Embed Size (px)
Citation preview
Auto-Focus Test Report
Test Dates 8/19/09 Thru 8/21/09
An Innovative Implementation of Transparent S f fil i f h A li i fSurface Profile Detection for the Application of
Excimer Laser Beam Auto-Focusing
Dana Lee Church
TeoSys Engineering LLC2138 Priest Bridge Ct Ste 102138 Priest Bridge Ct Ste 10
Crofton , MD 21114
410-451-8058 voice410-451-8059 fax410-353-6314 cell
Page 1 of 14TeoSys Engineering LLC Test Report, Rev. F 8/25/09
www.teosys.com

Auto-Focus Test Report
Test Dates 8/19/09 Thru 8/21/09
An Innovative Implementation of Transparent Surface Profile Detection for the Application of
Excimer Laser Beam Auto-Focusingg
> Purpose, Abstract and SummarySingle page summery of full test
> Hardware Setup, Functionality and Installation
2
3 Hardware Setup, Functionality and Installation Description of the hardware setup, physical installation in facility.
> Software and Data CollectionApplications functions and data collection process
3
5
> Static Testing (8 samples)Testing of small samples of various glass using the static flat fixture.
> Dynamic Testing – #1 Belt Conveyor
8
11
> Dynamic Testing – #2 Rubber Wheel Conveyor
> Results and Conclusions
12
14
Page 2 of 14TeoSys Engineering LLC Test Report, Rev. F 8/25/09
Auto-Focus Test Report
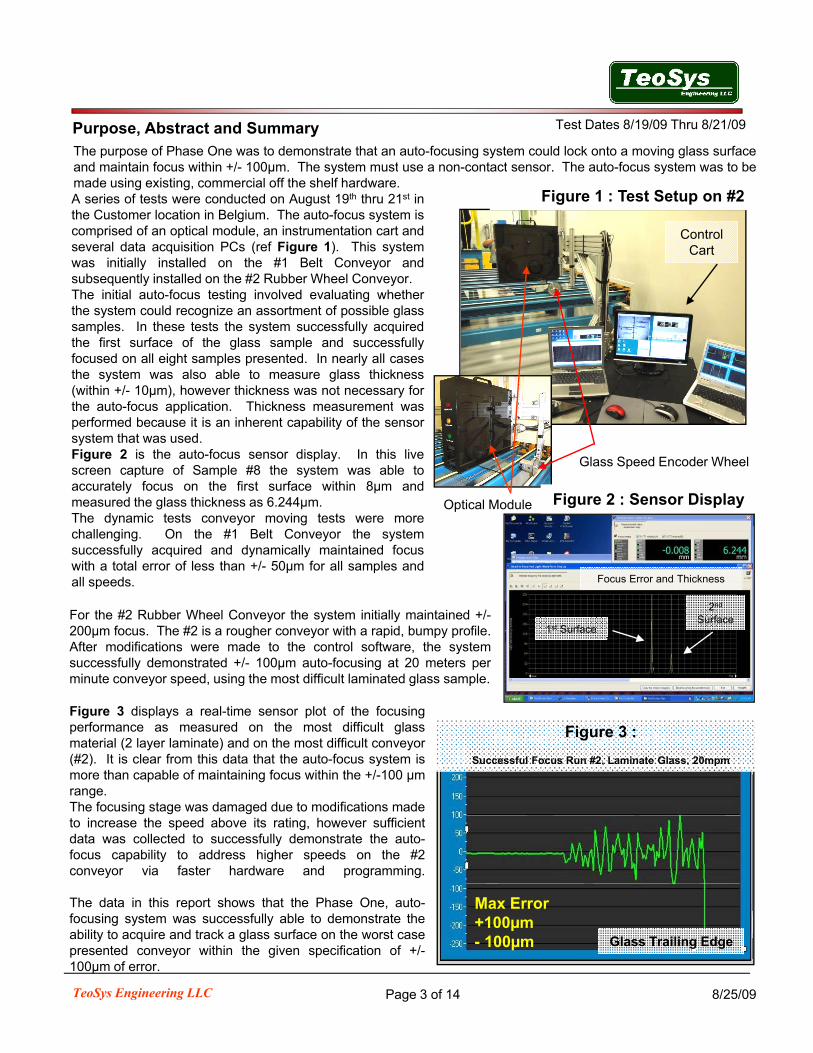
Test Dates 8/19/09 Thru 8/21/09Purpose, Abstract and SummaryThe purpose of Phase One was to demonstrate that an auto-focusing system could lock onto a moving glass surfaceand maintain focus within +/ 100µm The system must use a non contact sensor The auto focus system was to beand maintain focus within +/- 100µm. The system must use a non-contact sensor. The auto-focus system was to bemade using existing, commercial off the shelf hardware.A series of tests were conducted on August 19th thru 21st inthe Customer location in Belgium. The auto-focus system iscomprised of an optical module, an instrumentation cart andseveral data acquisition PCs (ref Figure 1). This systemwas initially installed on the #1 Belt Conveyor andsubsequently installed on the #2 Rubber Wheel Conveyor.
ControlCart
Figure 1 : Test Setup on #2
The initial auto-focus testing involved evaluating whetherthe system could recognize an assortment of possible glasssamples. In these tests the system successfully acquiredthe first surface of the glass sample and successfullyfocused on all eight samples presented. In nearly all casesthe system was also able to measure glass thickness(within +/- 10µm), however thickness was not necessary forthe auto focus application Thickness measurement wasthe auto-focus application. Thickness measurement wasperformed because it is an inherent capability of the sensorsystem that was used.Figure 2 is the auto-focus sensor display. In this livescreen capture of Sample #8 the system was able toaccurately focus on the first surface within 8µm andmeasured the glass thickness as 6.244µm.The dynamic tests conveyor moving tests were more
Optical Module
Glass Speed Encoder Wheel
Figure 2 : Sensor Display
challenging. On the #1 Belt Conveyor the systemsuccessfully acquired and dynamically maintained focuswith a total error of less than +/- 50µm for all samples andall speeds.
1st Surface
2nd
Surface
Focus Error and Thickness
For the #2 Rubber Wheel Conveyor the system initially maintained +/-200µm focus. The #2 is a rougher conveyor with a rapid, bumpy profile.After modifications were made to the control software the system
Figure 3 :
Successful Focus Run #2, Laminate Glass, 20mpm
Figure 3 displays a real-time sensor plot of the focusingperformance as measured on the most difficult glassmaterial (2 layer laminate) and on the most difficult conveyor(#2). It is clear from this data that the auto-focus system is
After modifications were made to the control software, the systemsuccessfully demonstrated +/- 100µm auto-focusing at 20 meters perminute conveyor speed, using the most difficult laminated glass sample.
p( ) ymore than capable of maintaining focus within the +/-100 µmrange.The focusing stage was damaged due to modifications madeto increase the speed above its rating, however sufficientdata was collected to successfully demonstrate the auto-focus capability to address higher speeds on the #2conveyor via faster hardware and programming.
Page 3 of 14TeoSys Engineering LLC Test Report, Rev. F 8/25/09
The data in this report shows that the Phase One, auto-focusing system was successfully able to demonstrate theability to acquire and track a glass surface on the worst casepresented conveyor within the given specification of +/-100µm of error.
Glass Trailing Edge
Max Error +100µm- 100µm
Auto-Focus Test Report
Test Dates 8/19/09 Thru 8/21/09Hardware Setup, Functionality and Installation
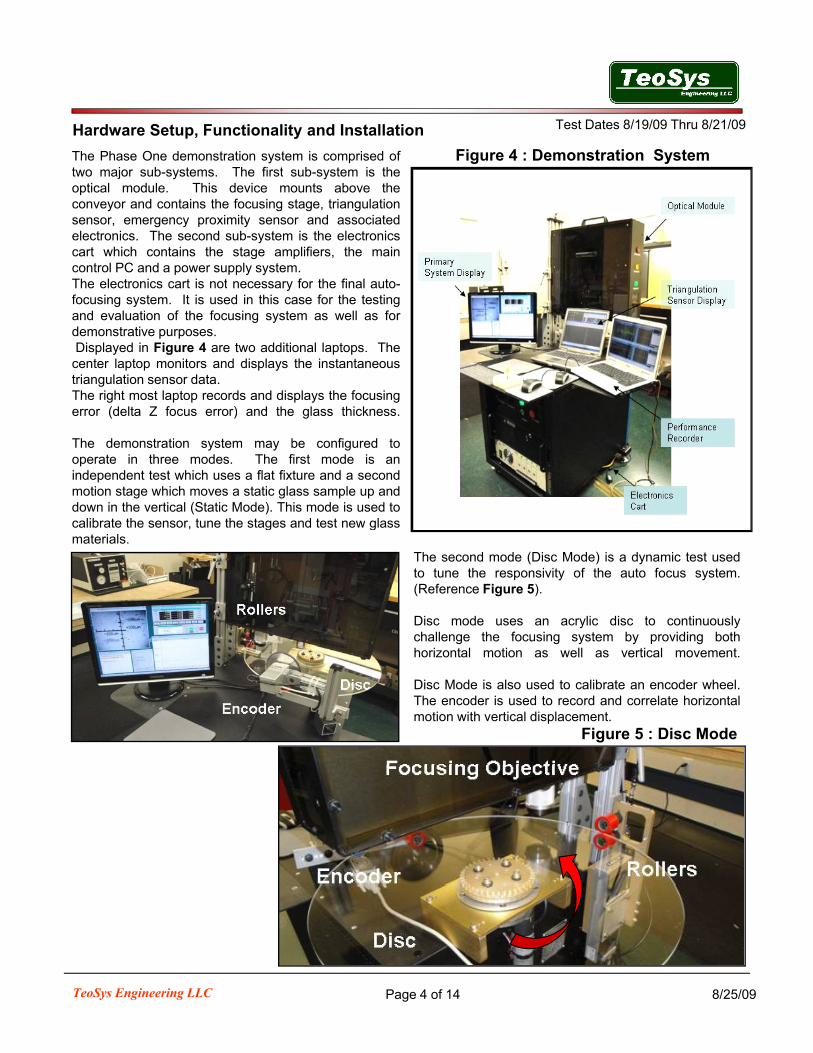
Figure 4 : Demonstration SystemThe Phase One demonstration system is comprised oft j b t Th fi t b t i thtwo major sub-systems. The first sub-system is theoptical module. This device mounts above theconveyor and contains the focusing stage, triangulationsensor, emergency proximity sensor and associatedelectronics. The second sub-system is the electronicscart which contains the stage amplifiers, the maincontrol PC and a power supply system.The electronics cart is not necessary for the final auto-The electronics cart is not necessary for the final autofocusing system. It is used in this case for the testingand evaluation of the focusing system as well as fordemonstrative purposes.Displayed in Figure 4 are two additional laptops. Thecenter laptop monitors and displays the instantaneoustriangulation sensor data.The right most laptop records and displays the focusing
(d lt Z f ) d th l thi kerror (delta Z focus error) and the glass thickness.
The demonstration system may be configured tooperate in three modes. The first mode is anindependent test which uses a flat fixture and a secondmotion stage which moves a static glass sample up anddown in the vertical (Static Mode). This mode is used tocalibrate the sensor, tune the stages and test new glass
The second mode (Disc Mode) is a dynamic test usedto tune the responsivity of the auto focus system.(Reference Figure 5).
Disc mode uses an acrylic disc to continuouslychallenge the focusing system by providing both
calibrate the sensor, tune the stages and test new glassmaterials.
horizontal motion as well as vertical movement.
Disc Mode is also used to calibrate an encoder wheel.The encoder is used to record and correlate horizontalmotion with vertical displacement.
Figure 5 : Disc Mode
Page 4 of 14TeoSys Engineering LLC Test Report, Rev. F 8/25/09

Auto-Focus Test Report
Test Dates 8/19/09 Thru 8/21/09Hardware Setup, Functionality and Installation
The optical module with triangulation sensor was installed on twoFigure 7 : Adapter Plate
The optical module with triangulation sensor was installed on twoconveyors for testing (Figure 6). The first location was on the LG-#1belt conveyor. This conveyor design is apparently the smoothest ofthe conveyors presented with an vertical displacement profile ofapproximately one millimeter.The second location was on the #2 wheel conveyor, which dependingupon the wheel presented, had a vertical displacement profile of threeto four millimeters. In addition, the wheels contained small ‘bumps’ of
Rear Course Vertical Adjustment
10mm in length or less. These bumps cause rapid vertical jumps inthe glass (500µm jumps up and down in less than 20ms!).
Figure 7 and Figure 8 both show details of the course verticaladjustment, the adapter plate, the locking clamps and the bridge.
Fi 6
Second Location
Figure 6 : Facility and Installation Locations
Locking Clamps
Figure 8 : Sensor Mounted on Bridge
First Location
omitted
omitted
Page 5 of 14TeoSys Engineering LLC Test Report, Rev. F 8/25/09
Auto-Focus Test Report
Test Dates 8/19/09 Thru 8/21/09Application Software and Data Collection
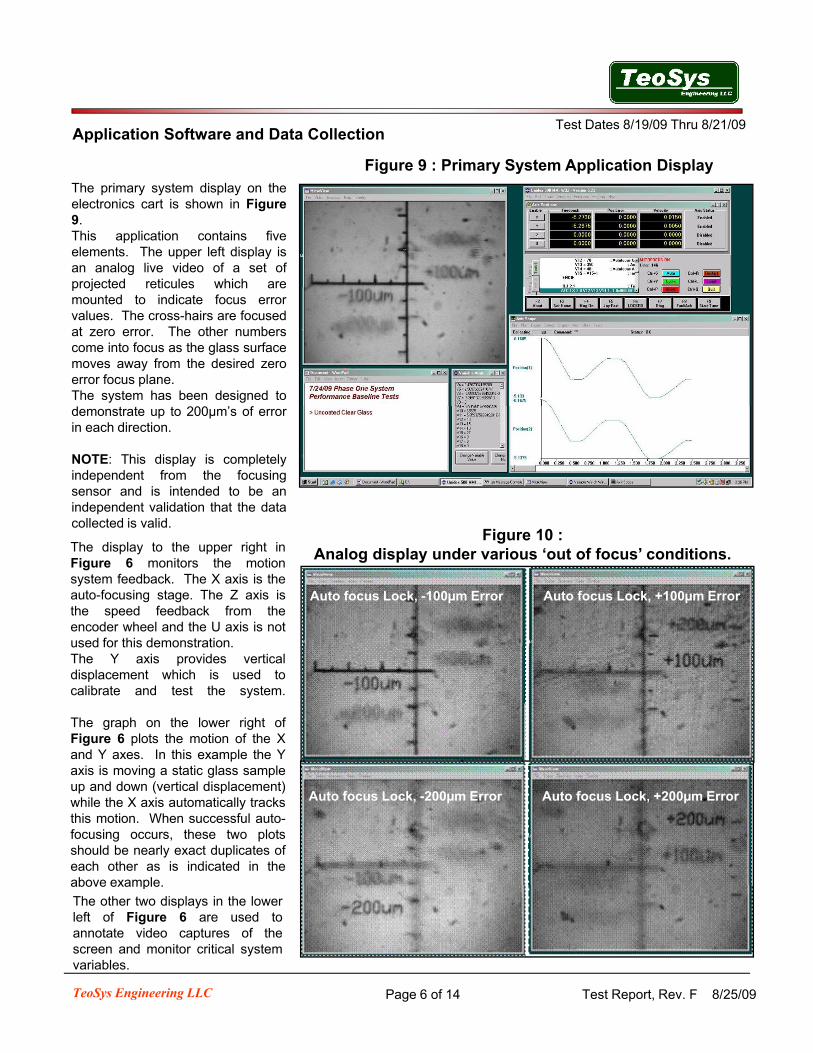
Figure 9 : Primary System Application DisplayThe primary system display on theelectronics cart is shown in Figure9.This application contains fiveelements. The upper left display isan analog live video of a set ofprojected reticules which are
Figure 9 : Primary System Application Display
projected reticules which aremounted to indicate focus errorvalues. The cross-hairs are focusedat zero error. The other numberscome into focus as the glass surfacemoves away from the desired zeroerror focus plane.The system has been designed tod t t t 200 ’ fdemonstrate up to 200µm’s of errorin each direction.
NOTE: This display is completelyindependent from the focusingsensor and is intended to be anindependent validation that the datacollected is valid.
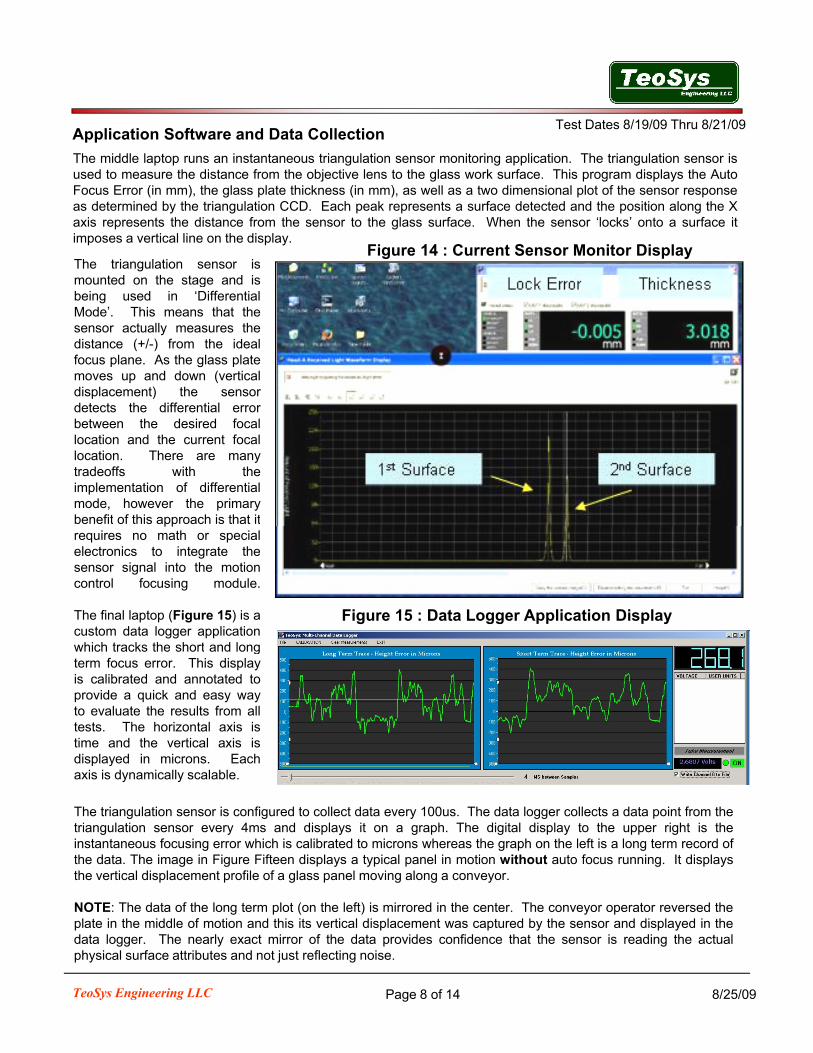
Auto focus Lock, -100µm Error Auto focus Lock, +100µm Error
collected is valid.
The display to the upper right inFigure 6 monitors the motionsystem feedback. The X axis is theauto-focusing stage. The Z axis isthe speed feedback from theencoder wheel and the U axis is notused for this demonstration.
Figure 10 : Analog display under various ‘out of focus’ conditions.
used for this demonstration.The Y axis provides verticaldisplacement which is used tocalibrate and test the system.
The graph on the lower right ofFigure 6 plots the motion of the Xand Y axes. In this example the Y
i i i t ti l l
Auto focus Lock, -200µm Error Auto focus Lock, +200µm Error
axis is moving a static glass sampleup and down (vertical displacement)while the X axis automatically tracksthis motion. When successful auto-focusing occurs, these two plotsshould be nearly exact duplicates ofeach other as is indicated in theabove example.
Page 6 of 14TeoSys Engineering LLC Test Report, Rev. F 8/25/09
above example.
The other two displays in the lowerleft of Figure 6 are used toannotate video captures of thescreen and monitor critical systemvariables.

Auto-Focus Test Report
Test Dates 8/19/09 Thru 8/21/09Application Software and Data Collection
Figure 11 : Focusing and Fixture Stage Motion Plot
X-Axis, Follower(Focusing Stage)
ns)
Figure 11 : Focusing and Fixture Stage Motion Plot
Y-Axis, Leader(Stage, Simulates Glass Motion)
Pos
ition
(m
icro
n
Time (Seconds)
Figure 13 : Primary display under real world auto-focusing conditions.
Note that there is no Y axis motion, only X.
itt d
Page 7 of 14TeoSys Engineering LLC Test Report, Rev. F 8/25/09
omitted
Auto-Focus Test Report
Test Dates 8/19/09 Thru 8/21/09
The middle laptop runs an instantaneous triangulation sensor monitoring application. The triangulation sensor is
Application Software and Data Collection
used to measure the distance from the objective lens to the glass work surface. This program displays the AutoFocus Error (in mm), the glass plate thickness (in mm), as well as a two dimensional plot of the sensor responseas determined by the triangulation CCD. Each peak represents a surface detected and the position along the Xaxis represents the distance from the sensor to the glass surface. When the sensor ‘locks’ onto a surface itimposes a vertical line on the display.
The triangulation sensor ismounted on the stage and is
Figure 14 : Current Sensor Monitor Display
gbeing used in ‘DifferentialMode’. This means that thesensor actually measures thedistance (+/-) from the idealfocus plane. As the glass platemoves up and down (verticaldisplacement) the sensordetects the differential errordetects the differential errorbetween the desired focallocation and the current focallocation. There are manytradeoffs with theimplementation of differentialmode, however the primarybenefit of this approach is that itpprequires no math or specialelectronics to integrate thesensor signal into the motioncontrol focusing module.
The final laptop (Figure 15) is acustom data logger applicationwhich tracks the short and long
Figure 15 : Data Logger Application Display
which tracks the short and longterm focus error. This displayis calibrated and annotated toprovide a quick and easy wayto evaluate the results from alltests. The horizontal axis istime and the vertical axis isdisplayed in microns. Eachp yaxis is dynamically scalable.
The triangulation sensor is configured to collect data every 100us. The data logger collects a data point from thetriangulation sensor every 4ms and displays it on a graph. The digital display to the upper right is theinstantaneous focusing error which is calibrated to microns whereas the graph on the left is a long term record ofthe data. The image in Figure Fifteen displays a typical panel in motion without auto focus running. It displaysthe vertical displacement profile of a glass panel moving along a conveyor.
Page 8 of 14TeoSys Engineering LLC Test Report, Rev. F 8/25/09
NOTE: The data of the long term plot (on the left) is mirrored in the center. The conveyor operator reversed theplate in the middle of motion and this its vertical displacement was captured by the sensor and displayed in thedata logger. The nearly exact mirror of the data provides confidence that the sensor is reading the actualphysical surface attributes and not just reflecting noise.

Auto-Focus Test Report
Test Dates 8/19/09 Thru 8/21/09Static Testing ( 8 Sample Test )
The static glass sample testing verified that each sample would ‘lock’ with the sensor and could close the auto-g p g pfocus loop. Each sample was photographed and a screen capture of the sensor monitor taken. Not all screencaptures were taken with the auto focus system enabled so the absolute error figure is not significant.
Sample 1– Dark Blue
omitted
Sample 2 – Grey
Good Lock on First Surface (Focus)Good Thickness Measurement of 5.911mm
omitted
Sample 3 – Taupe
Good Lock on First Surface (Focus)Good Thickness Measurement of 3.911mm
omitted
Page 9 of 14TeoSys Engineering LLC Test Report, Rev. F 8/25/09
Good Lock on First Surface (Focus)Good Thickness Measurement of 3.857mm
Auto-Focus Test Report
Test Dates 8/19/09 Thru 8/21/09Static Testing ( 8 Sample Test )
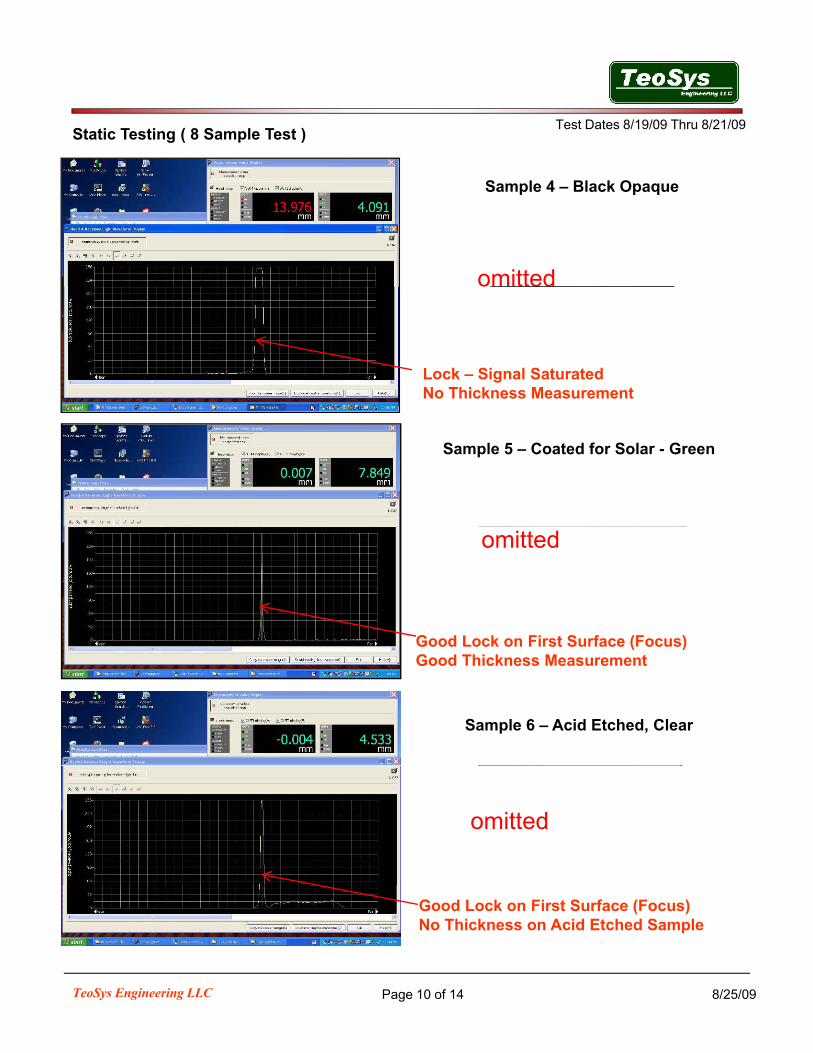
Sample 4 – Black Opaque
omitted
Lock – Signal SaturatedNo Thickness Measurement
Sample 5 – Coated for Solar - Green
Good Lock on First Surface (Focus)
omitted
Good Lock on First Surface (Focus)Good Thickness Measurement
Sample 6 – Acid Etched, Clear
omitted
Page 10 of 14TeoSys Engineering LLC Test Report, Rev. F 8/25/09
Good Lock on First Surface (Focus)No Thickness on Acid Etched Sample

Auto-Focus Test Report
Test Dates 8/19/09 Thru 8/21/09Static Testing ( 8 Sample Test )
Sample 7 –Clear Float
omitted
Good Lock on First Surface (Focus)No Thickness
omitted
Sample 8 – Additional Clear Float
omitted
Good Lock on First Surface (Focus)Good Thickness of 6.244mm
In all cases these measurements were taken without adjustment to the sensor parameter algorithm or alterationto the sensor optical path. With addition of optical filters, adjustments to sensor angle, and changes to sensoracquisition algorithm it is highly probable that all sensor responses can be optimized to be acquired reliably. Withth dditi f d h d t thi k l th b bilit f d thi k l kthe addition of a second sensor head to measure thickness only, the probability of a good thickness lockincreases by an order of magnitude. NOTE: Thickness measurements are not a requirement for auto-focusing.
In each stationary test, the auto focus system was able to reliably acquire the sample top surface. With thecurrent system configuration, which isn’t fully optimized, the auto focus system reliably demonstrates that it canacquire and lock on the first surface to within +/- 10µm on all stationary tests. The error value measurement, as itcomes from the triangulation sensor, appears to accurate within +/- 5µm
Page 11 of 14TeoSys Engineering LLC Test Report, Rev. F 8/25/09
The Phase One stationary testing demonstrated that for all presented glass materials, the sensor reliably andsuccessfully acquired and locked on the glass top surface. This was done without optimization or adjustmentbetween tests.

Auto-Focus Test Report
Test Dates 8/19/09 Thru 8/21/09Dynamic Testing, #1 - Belt Conveyor
The Belt Conveyor proved to be quite smooth and easiest conveyor on which to auto-focus. Below are real timescreen captures of all of the tests at the various speeds taken on the #1 Belt. Without the auto focus enabled, thevertical displacement profile that was measured with the glass on the #1 conveyor, is less than one millimeter. Thekey difference with the Belt Conveyer versus the Wheel Conveyor is that its oscillations are slower and shallower.With auto focus enabled, the maximum focusing error was much less than 50 microns on the #1.
Max Error +/- 20µmMax Error +/- 10µm Max Error +/- 20µm Speed 16 mpm
Max Error +/ 10µm Speed 1 mpm
Max Error +/- 15µm
100% In Focus100% In Focus
Max Error +/- 20µm Speed 20 mpm Speed 30 mpm
100% In Focus100% In Focus
Max Error + 8, - 30 µm Speed 40 mpm
Max Error + 8, - 35 µm Speed 50 mpmSpeed 40 mpm Speed 50 mpm
Page 12 of 14TeoSys Engineering LLC Test Report, Rev. F 8/25/09
100% In Focus 100% In Focus
Auto-Focus Test Report
Test Dates 8/19/09 Thru 8/21/09Dynamic Testing, #2 – Rubber Wheel Conveyor
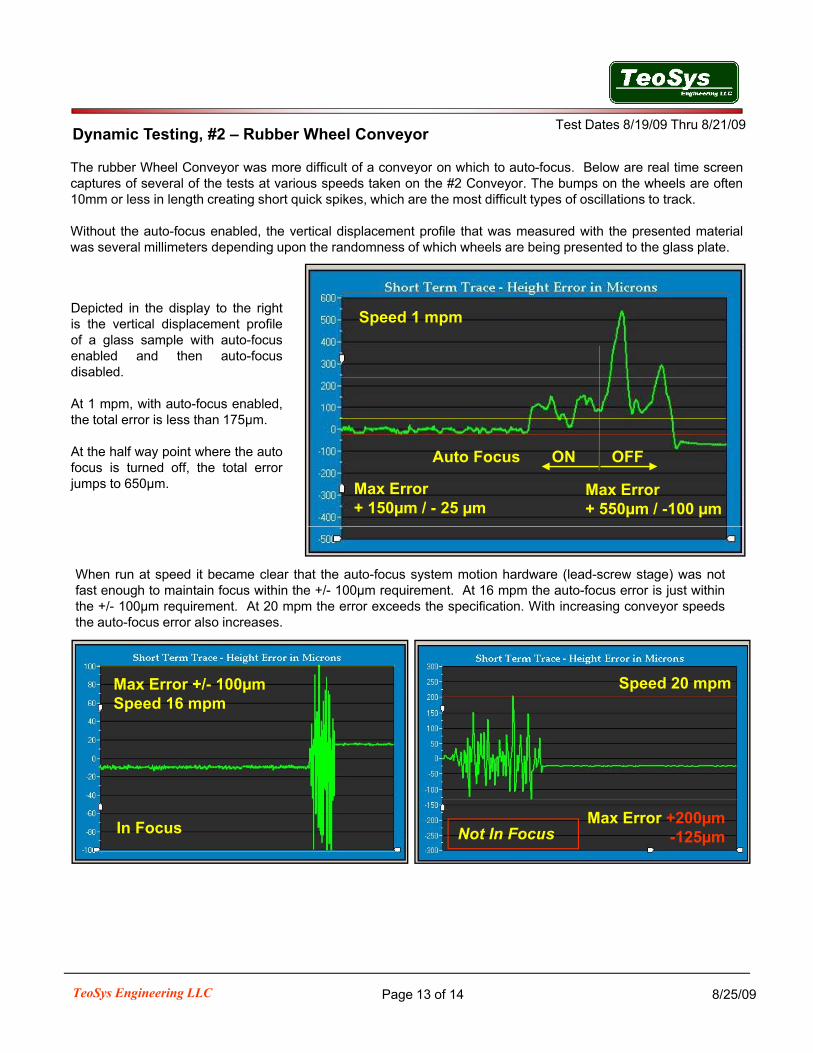
The rubber Wheel Conveyor was more difficult of a conveyor on which to auto focus Below are real time screenThe rubber Wheel Conveyor was more difficult of a conveyor on which to auto-focus. Below are real time screencaptures of several of the tests at various speeds taken on the #2 Conveyor. The bumps on the wheels are often10mm or less in length creating short quick spikes, which are the most difficult types of oscillations to track.
Without the auto-focus enabled, the vertical displacement profile that was measured with the presented materialwas several millimeters depending upon the randomness of which wheels are being presented to the glass plate.
Speed 1 mpmDepicted in the display to the rightis the vertical displacement profileof a glass sample with auto-focusenabled and then auto-focusdisabled.
At 1 mpm with auto-focus enabled
Max Error + 150µm / - 25 µm
Auto Focus ON OFF
Max Error + 550µm / -100 µm
At 1 mpm, with auto focus enabled,the total error is less than 175µm.
At the half way point where the autofocus is turned off, the total errorjumps to 650µm.
When run at speed it became clear that the auto-focus system motion hardware (lead-screw stage) was notfast enough to maintain focus within the +/- 100µm requirement. At 16 mpm the auto-focus error is just withinthe +/- 100µm requirement. At 20 mpm the error exceeds the specification. With increasing conveyor speedsthe auto-focus error also increases.
Max Error +/- 100µm Speed 16 mpm
Speed 20 mpm
Max Error +200µm-125µm
In Focus Not In Focus
Page 13 of 14TeoSys Engineering LLC Test Report, Rev. F 8/25/09
Auto-Focus Test Report
Test Dates 8/19/09 Thru 8/21/09Dynamic Testing, #2, Rubber Wheel Conveyor
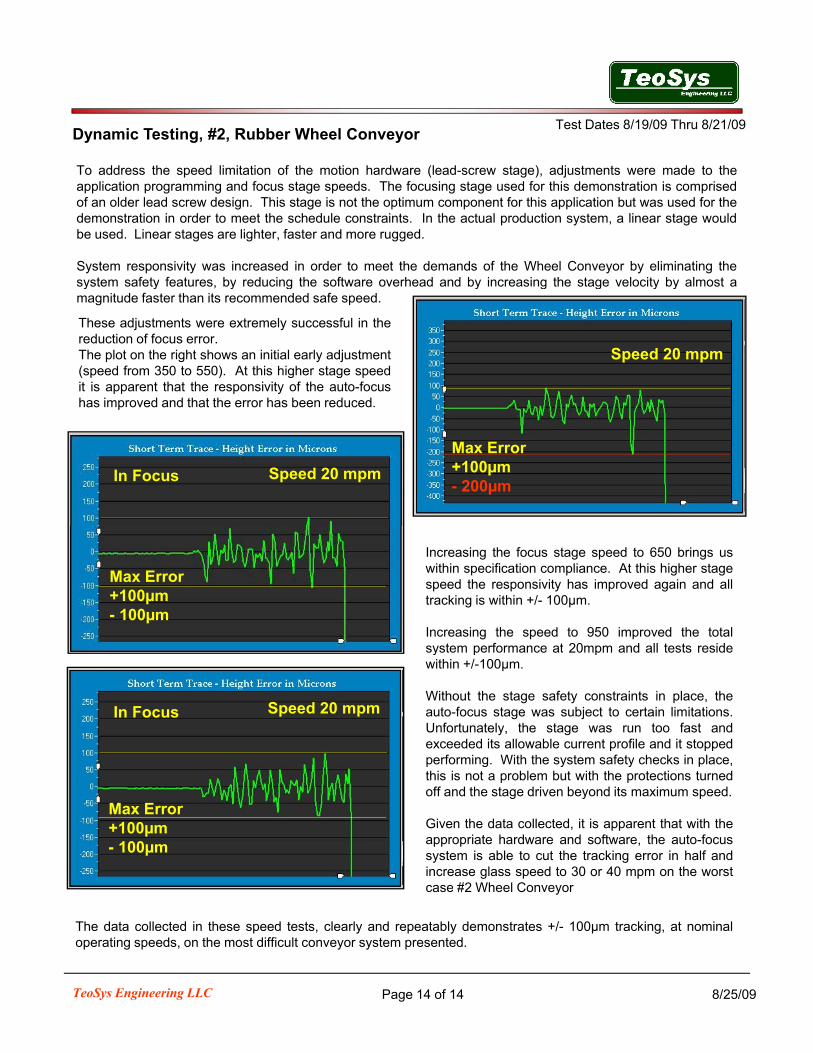
T dd th d li it ti f th ti h d (l d t ) dj t t d t thTo address the speed limitation of the motion hardware (lead-screw stage), adjustments were made to theapplication programming and focus stage speeds. The focusing stage used for this demonstration is comprisedof an older lead screw design. This stage is not the optimum component for this application but was used for thedemonstration in order to meet the schedule constraints. In the actual production system, a linear stage wouldbe used. Linear stages are lighter, faster and more rugged.
System responsivity was increased in order to meet the demands of the Wheel Conveyor by eliminating thesystem safety features, by reducing the software overhead and by increasing the stage velocity by almost ay y , y g y g g y ymagnitude faster than its recommended safe speed.
Speed 20 mpm
These adjustments were extremely successful in thereduction of focus error.The plot on the right shows an initial early adjustment(speed from 350 to 550). At this higher stage speedit is apparent that the responsivity of the auto-focushas improved and that the error has been reduced.
Max Error +100µm- 200µm
has improved and that the error has been reduced.
Speed 20 mpmIn Focus
Increasing the focus stage speed to 650 brings uswithin specification compliance. At this higher stagespeed the responsivity has improved again and alltracking is within +/- 100µm.
Increasing the speed to 950 improved the totalsystem performance at 20mpm and all tests reside
Max Error +100µm- 100µm
system performance at 20mpm and all tests residewithin +/-100µm.
Without the stage safety constraints in place, theauto-focus stage was subject to certain limitations.Unfortunately, the stage was run too fast andexceeded its allowable current profile and it stoppedperforming. With the system safety checks in place,
Speed 20 mpmIn Focus
p g y y p ,this is not a problem but with the protections turnedoff and the stage driven beyond its maximum speed.
Given the data collected, it is apparent that with theappropriate hardware and software, the auto-focussystem is able to cut the tracking error in half andincrease glass speed to 30 or 40 mpm on the worstcase #2 Wheel Conveyor
Max Error +100µm- 100µm
Page 14 of 14TeoSys Engineering LLC Test Report, Rev. F 8/25/09
case #2 Wheel Conveyor
The data collected in these speed tests, clearly and repeatably demonstrates +/- 100µm tracking, at nominaloperating speeds, on the most difficult conveyor system presented.
Auto-Focus Test Report
Test Dates 8/19/09 Thru 8/21/09Results and Conclusions
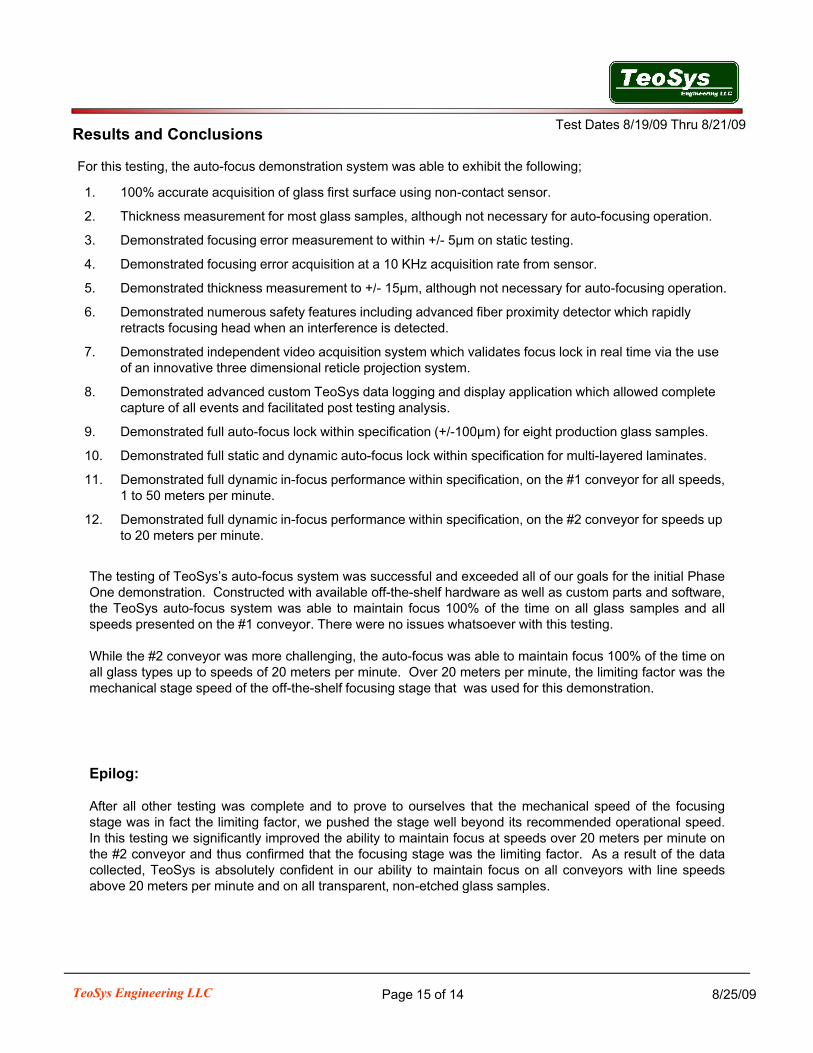
For this testing the auto-focus demonstration system was able to exhibit the following;For this testing, the auto-focus demonstration system was able to exhibit the following;
1. 100% accurate acquisition of glass first surface using non-contact sensor.
2. Thickness measurement for most glass samples, although not necessary for auto-focusing operation.
3. Demonstrated focusing error measurement to within +/- 5µm on static testing.
4. Demonstrated focusing error acquisition at a 10 KHz acquisition rate from sensor.
5 Demonstrated thickness measurement to +/ 15µm although not necessary for auto focusing operation5. Demonstrated thickness measurement to +/- 15µm, although not necessary for auto-focusing operation.
6. Demonstrated numerous safety features including advanced fiber proximity detector which rapidly retracts focusing head when an interference is detected.
7. Demonstrated independent video acquisition system which validates focus lock in real time via the use of an innovative three dimensional reticle projection system.
8. Demonstrated advanced custom TeoSys data logging and display application which allowed complete capture of all events and facilitated post testing analysiscapture of all events and facilitated post testing analysis.
9. Demonstrated full auto-focus lock within specification (+/-100µm) for eight production glass samples.
10. Demonstrated full static and dynamic auto-focus lock within specification for multi-layered laminates.
11. Demonstrated full dynamic in-focus performance within specification, on the #1 conveyor for all speeds, 1 to 50 meters per minute.
12. Demonstrated full dynamic in-focus performance within specification, on the #2 conveyor for speeds up y p p y p pto 20 meters per minute.
The testing of TeoSys’s auto-focus system was successful and exceeded all of our goals for the initial PhaseOne demonstration. Constructed with available off-the-shelf hardware as well as custom parts and software,the TeoSys auto-focus system was able to maintain focus 100% of the time on all glass samples and allspeeds presented on the #1 conveyor. There were no issues whatsoever with this testing.
While the #2 conveyor was more challenging, the auto-focus was able to maintain focus 100% of the time onall glass types up to speeds of 20 meters per minute. Over 20 meters per minute, the limiting factor was themechanical stage speed of the off-the-shelf focusing stage that was used for this demonstration.
Epilog:
After all other testing was complete and to prove to ourselves that the mechanical speed of the focusingstage was in fact the limiting factor, we pushed the stage well beyond its recommended operational speed.In this testing we significantly improved the ability to maintain focus at speeds over 20 meters per minute onthe #2 conveyor and thus confirmed that the focusing stage was the limiting factor. As a result of the datacollected, TeoSys is absolutely confident in our ability to maintain focus on all conveyors with line speedsabove 20 meters per minute and on all transparent non etched glass samples
Page 15 of 14TeoSys Engineering LLC Test Report, Rev. F 8/25/09
above 20 meters per minute and on all transparent, non-etched glass samples.