Embed Size (px)
Citation preview

Ding Nie
A Method to Investigate Structural-Functional Correlations in the Default Mode and other
Networks: Applied to Schizophrenia
12/16/2009 1/22

Overview Motivation Default mode network Methods
Computing structural gray matter maps Computing functional maps using ICA Correlation analysis
Results ICA maps of interest Histogram of correlations Spatial map results
Discussion Future work
12/16/2009 2/22
Motivation
Structural magnetic resonance imaging (sMRI) and functional magnetic resonance imaging (fMRI) analyses are typically performed separately
Previous studies only examine the localized correlation between sMRI and fMRI
Previous research do not explore inter-correlations of structural & functional data across the whole brain
In our recent study we introduced methods to explore structural-functional correlations across the whole brain [1]
[1] A. Michael, S. Baum, T. White, O. Demirci, N. C. Andreasen, J. M. Segall, R. E. Jung, G. D. Pearlson, V. P. Clark, R. L. Gollub, S.
C. Schulz, J. Roffmann, K. O. Lim, B. C. Ho, H. J. Bockholt, and V. D. Calhoun, "Does Function Follow Form?: Methods to Fuse
Structural and Functional Brain Images Show Decreased Linkage in Schizophrenia," NeuroImage, In Press.

Main Result from that Study
In this study we investigated the interconnection of task-related fMRI data and gray matter volumes across the whole brain
Used GLM method to construct the task related functional activation map
From the histogram of structural-functional correlations it was seen that linkage between strucure and function was weaker in schizophrenia patients (SZ) than healthy controls (HC)
In this study we are interested in the structural linkages to the default mode network (DMN)
-1 -0.8 -0.6 -0.4 -0.2 0 0.2 0.4 0.6 0.8 1-10
-8
-6
-4
-2
0
2
4
6
8x 10
6
Correlation
# o
f C
orr
ela
tions
Gray Matter Correlation with Sensory Motor Task (HC - SZ)
-1 -0.8 -0.6 -0.4 -0.2 0 0.2 0.4 0.6 0.8 10
0.5
1
1.5
2
2.5
3x 10
8
Correlation
# o
f C
orr
ela
tions
Gray Matter Correlation with Sensory Motor Task
HC
SZ
-1.0 -0.8 -0.6 -0.4 -0.2 0.0 +0.2 +0.4 +0.6 +0.8 +1.0
Correlation
3x10⁸
2.5
2.0
1.5
1.0
0.5
0.0
6x10⁶
2.0
-2.0
-4.0
# o
f C
orr
ela
tio
ns
(a)
(b)HC - SZ
-1 -0.8 -0.6 -0.4 -0.2 0 0.2 0.4 0.6 0.8 1-10
-8
-6
-4
-2
0
2
4
6
8x 10
6
Correlation
# o
f C
orr
ela
tions
Gray Matter Correlation with Sensory Motor Task (HC - SZ)
-1 -0.8 -0.6 -0.4 -0.2 0 0.2 0.4 0.6 0.8 10
0.5
1
1.5
2
2.5
3x 10
8
Correlation
# o
f C
orr
ela
tions
Gray Matter Correlation with Sensory Motor Task
HC
SZ
-1.0 -0.8 -0.6 -0.4 -0.2 0.0 +0.2 +0.4 +0.6 +0.8 +1.0
Correlation
3x10⁸
2.5
2.0
1.5
1.0
0.5
0.0
6x10⁶
2.0
-2.0
-4.0
# o
f C
orr
ela
tio
ns
(a)
(b)
-1 -0.8 -0.6 -0.4 -0.2 0 0.2 0.4 0.6 0.8 1-10
-8
-6
-4
-2
0
2
4
6
8x 10
6
Correlation
# o
f C
orr
ela
tions
Gray Matter Correlation with Sensory Motor Task (HC - SZ)
-1 -0.8 -0.6 -0.4 -0.2 0 0.2 0.4 0.6 0.8 10
0.5
1
1.5
2
2.5
3x 10
8
Correlation
# o
f C
orr
ela
tions
Gray Matter Correlation with Sensory Motor Task
HC
SZ
-1.0 -0.8 -0.6 -0.4 -0.2 0.0 +0.2 +0.4 +0.6 +0.8 +1.0
Correlation
3x10⁸
2.5
2.0
1.5
1.0
0.5
0.0
6x10⁶
2.0
-2.0
-4.0
# o
f C
orr
ela
tio
ns
(a)
(b)HC - SZ
12/16/2009 4/22

Default Mode Network (DMN)
Comprises regions more active during rest than during tasks
Thought as task-independent components and decreases in activity while the brain engages in a task
In this study we explore if structural-functional correlations differences exist between HC and SZ in the DMN
[2] Marcus E. Raichle, Ann Mary MacLeod, Abraham Z. Snyder, William J. Powers, Debra A. Gusnard, and Gordon L. Shulman, " A
default mode of brain function," Proc. Natl. Acad. Sci. U. S. A. 98, 676–682.

Methods Participants
Four different sites: IA, MA, MN, NM
sMRI Image Acquisition
fMRI Image Acquisition
n Age Education SES
HC 70 (50m, 20f) 34 ± 11 yrs 15 ± 3 yrs 2.4 ± 0.7
SZ 70 (57m, 13f) 35 ± 11 yrs 13 ± 3 yrs 2.7 ± 1.1
Scanner TR TE FOV Voxel
Siemens 1.5 T 12ms 4.76ms 161mm 0.63x0.63x1.5 mm3
12/16/2009 6/22
Scanner TR TE FOV Voxel Gap
Siemens 3 T 2s 30ms 22cm 3.4x3.4x4 mm3 1 mm

sMRI Preprocessing
sMRI Images brain tissue distribution
Gray matter (GM) White matter (WM) CSF
Template
Smooth Normalize
SPM used for preprocessing
12/16/2009 7/22

Find default mode
Motion Correction
1 2
Functional Images
Time 1 2 … 3
(secs)
Phase Fix
1 2 3
0s .66s .33s
Normalize
Template
Smooth
fMRI Preprocessing
group ICA used for preprocessing
Group ICA
84 81 78 75 72 69 66 63
60 57 54 51 48 45 42 39
36 33 30 27 24 21 18 15
12 9 6 3 0 -3 -6 -9
-12 -15 -18 -21 -24 -27 -30 -33
-36 -39 -42 -45 -48 -51
RL
5.8
0
7.2
0
7.3
0
8.5
0
10 20 30 40 50 60 70 80 90 100 110 120-0.4-0.200.20.4
Scans
Sig
nal U
nits
IC 11
-0.4-0.2
00.20.4
IC 12
-0.200.2
IC 17
-1
0
1
IC 18
29 24 20 15
11 6 2 -3
-8 -12 -17 -21
-26 -30 -35 -39
R L
0
7.6 Scans
12/16/2009 8/22

fMRI Task
Novel (complex sound)
OFF (16s)
200ms
Standard (1 kHz)
Mean ISI = 1200ms
Target (1.2 kHz) (a) AOD
LEARN 5 3 6 1 9
4 * 7 * 9
* * 3 * *
3 2 8
…
3 6 1 9
+ 3
Encode (6s) Recognize (38s) Fixate
2s 1s
Or 1.1s 0.6-2.4s
4-20s
ON (38s)
(b) SIRP ON (16s) ON
Pitch
0.2s 0.5s
(c) SM
Novel (complex sound)
OFF (16s)
200ms
Standard (1 kHz)
Mean ISI = 1200ms
Target (1.2 kHz) (a) AOD
LEARN 5 3 6 1 9
4 * 7 * 9
* * 3 * *
3 2 8
…
3 6 1 9
+ 3
Encode (6s) Recognize (38s) Fixate
2s 1s
Or 1.1s 0.6-2.4s
4-20s
ON (38s)
(b) SIRP ON (16s) ON
Pitch
0.2s 0.5s
(c) SM
fMRI Independent components of a sensorimotor task
Sensorimotor: A motor response for a sensory stimulus
Sensory stimuli
Auditory tones
Eight different pitched tones
Ascending and descending
Motor response
Right thumb button Press
On-Off blocks (16s)
Sensorimotor Task Time Course
12/16/2009 1/22

Group ICA
Evaluate time course of the functional data
Use multiple regression to show the beta weights of each subject on each component and on the task time course
: time course for individual subjects
: time course for each component
Save the beta values in two 70×1 matrices of HC and SZ for each component of interest
1 1i i p pi iy x x [3] D. Kim, D. Mathalon, J. M. Ford, M. Mannell, J. Turner, G. Brown, A. Belger, R. L. Gollub, J. Lauriello, C. G. Wible, D. O'Leary, K.
Lim, S. Potkin, and V. D. Calhoun, "Auditory Oddball Deficits in Schizophrenia: An Independent Component Analysis of the fMRI
Multisite Function BIRN Study," Schizophr Bull, vol. 35, pp. 67-81, 2009.
12/16/2009 10/22
iyix

Beta-Structure Correlation Analysis How all voxels from sMRI correlate to each functional component
Threshold 91×109×91-voxel sMRI data using mask to exclude CSF, skull and non-brain region, reducing the number of voxels to N 199k voxels
The correlation matrix RSF is 1×N, N: # of brain voxels
Interpret the correlation matrix using histogram and spatial map
Compare this with previous results
RSF
cov( , )
i
ii
X B
X B
Voxels (N)
Sub
ject
sSu
bje
cts
Structure (S)Structure Voxels (N)
Beta Value (B)
i SF correlationiX
12/16/2009 11/22
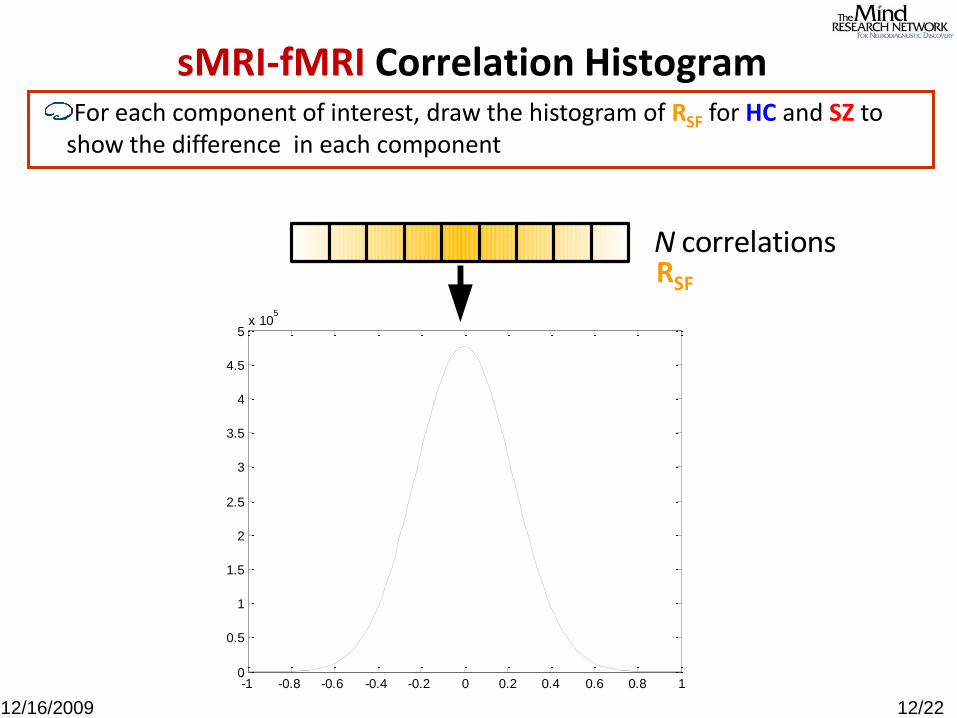
sMRI-fMRI Correlation Histogram For each component of interest, draw the histogram of RSF for HC and SZ to
show the difference in each component
-1 -0.8 -0.6 -0.4 -0.2 0 0.2 0.4 0.6 0.8 10
0.5
1
1.5
2
2.5
3
3.5
4
4.5
5x 10
5
N correlationsRSF
12/16/2009 12/22

sMRI-fMRI Correlation Spatial Map Each RSF contain number of elements equal to N (# of voxels)
Can be used to build a spatial map to see the spatial distribution of correlation
Compare the region with ICA results show the difference between HC and SZ
50
100
150
200
250
N correlationsRSF
12/16/2009 13/22

50
100
150
200
250
50
100
150
200
250
50
100
150
200
250
Task-Related Component
HC SZ HC-SZ -2.0
-1.0
0.0
+1.0
+2.0
Correlation with
task time Course
HC: p<1.2e-26
SZ: p<6.4e-25
-1 -0.8 -0.6 -0.4 -0.2 0 0.2 0.4 0.6 0.8 1 0
2000
4000
6000
8000
10000
12000
14000
16000
HC
SZ
X0.2

50
100
150
200
250
50
100
150
200
250
50
100
150
200
250
Default Mode 1
-2.0
-1.0
0.0
+1.0
+2.0
Correlation with
task time Course
HC: p<3.2e-14
SZ: p<8.6e-09
HC SZ HC-SZ
0
2000
4000
6000
8000
10000
12000
14000
16000
18000
HC
SZ
-1 -0.8 -0.6 -0.4 -0.2 0 0.2 0.4 0.6 0.8 1 X0.2

50
100
150
200
250
50
100
150
200
250
50
100
150
200
250
Default Mode 2
-26 -30 -35 -39 0
-2.0
-1.0
0.0
+1.0
+2.0
Correlation with
task time Course
HC: p<3.2e-07
SZ: p<5.9e-04
HC SZ HC-SZ
0
2000
4000
6000
8000
10000
12000
14000
16000
18000
HC
SZ
-1 -0.8 -0.6 -0.4 -0.2 0 0.2 0.4 0.6 0.8 1 X0.2

50
100
150
200
250
50
100
150
200
250
50
100
150
200
250
Another Component of Interest
-2.0
-1.0
0.0
+1.0
+2.0
Correlation with
task time Course
HC: p<1.6e-06
SZ: p<1.4e-08
HC SZ HC-SZ
0
2000
4000
6000
8000
10000
12000
14000
16000
18000
HC
SZ
-1 -0.8 -0.6 -0.4 -0.2 0 0.2 0.4 0.6 0.8 1 X0.2

Discussion: Histogram of Correlations
Individual histograms: HC & SZ, difference in all four components
Difference histogram
More negative correlations in SZ than HC; more positive correlations in HC than SZ: Task-related component Default mode 1 Another component of interest
Linkage between Gray matter and functional activity higher in HC than SZ : Default mode 2
12/16/2009 18/22

Discussion: Spatial Map Results
Spatial map shows HC has more positive regions than SZ in all four components
Regions in the cerebellum show more positive correlation in HC than SZ in three components: Task-related component Default mode 1 Another component of interest
The hot region in HC-SZ map does not overlap with functional brain region
12/16/2009 19/22

Preliminary Results: Brain Regions
Task-Related Component
Default Mode Component 1
Default Mode Component 2
Other Component of Interest
HC-SZ>0
Cerebellum Posterior Cerebellum Middle Parietal Lobe Anterior Cerebellum
Middle Occipital Lobe
Posterior Frontal Lobe Middle Frontal Lobe Posterior Cerebellum
Middle Frontal Lobe Anterior Temporal Lobe Posterior Occipital Lobe
Middle Temporal Lobe
Anterior Parietal
HC-SZ<0
Middle Cerebellum Middle Cerebellum Middle Temporal Lobe Middle Cerebellum
Middle Frontal Lobe Posterior Parietal Lobe Anterior Frontal Lobe
Posterior Frontal Lobe
12/16/2009 20/22

Future Works
Explore the effects of outliers in the subjects:
Bootstrap
Compute statistical significance of results
Identify differential brain regions and implication to
schizophrenia
Identify correlations with white matter
12/16/2009 21/22

Thank you!