Embed Size (px)
Citation preview

FINAL DESIGN REPORT MAY 4, 2015
EXECUTIVE SUMMARY
INTRODUCTION
We are the Global Urban Development Program: Stockton team, an international partnership of undergraduate and graduate students of different academic and geographic backgrounds. Our goal is to develop thoughtful and strategic solutions to revitalize South Stockton in partnership with the City of Stockton Planning Commission, Councilmember Michael Tubbs, and the Reinvent South Stockton Coalition (RSSC).
Our Project is structured into four phases: two phases of Research and two of Design. Our first two phases developed a comprehensive understanding of South Stockton’s current conditions, identifying areas of strength, opportunities for development, weaknesses, and threats to progress, and established target goals to quantifiably measure the success of our design proposals.
The second two phases focused on carving out said design proposals. This Final Design deliverable provides an understanding of Stockton’s site conditions, our approach to designing for said conditions, and the proposals we have selected which we believe contribute to accomplishing our established goals.
RESEARCH PROCESS
We started our research phase with Deliverable 1, Draft Research, in which we tried to identify key conditions and systemic challenges in Stockton. The work was distributed among team members, which were divided into 5 research groups, each covering one of the main topics in the city: Economic, Political/Legal, Cultural/Social, Environmental and Urban. Conclusions based on the aforementioned analysis were gathered in a SWOT Analysis (strengths, weaknesses, opportunities, threats). In Deliverable 2, Final Research, we refined our research to identify the most important target goals using SWOT and PESTEL Analysis. We focused more specifically on the current work of the RSSC and tried to come up with quantifiable goals in several Quality-of-Life indicators of the city: Place, Movement, Environment, Health & Safety, Community, Housing and Economic Development. Target goals were given feasible timescales (immediate, short-term, long-term) and were used as a basis for selecting design projects in the next phase.

Portfolio of Target Goals from Final Research.
(Table continued on next page)

DESIGN PROCESS
For the design phase of the project, we split up into four different teams in order to better address specific issues: Industry Revitalization, Environmental Resiliency, Airport Way, and CSU Stockton. The two “macro” level teams focused on industry revitalization and environmental infrastructure/energy efficiency on a larger scale encompassing South Stockton, while the “micro” level teams worked towards designing specific uses for empty lots on Airport Way and planning for a potential CSU in South Stockton. Team members split up based on interest, with 3-6 people in each. Rather than working specifically within our disciplines, we used systems thinking, human-centered design, and holistic problem solving to better understand and attempt to tackle deeply rooted problems. By doing so, we heard from community members whose voices may have been unheard through a traditional approach, and tackled problems from a variety of angles, from zoning to an outreach plan. As team members were spread across Stanford, Stockton, and Ljubljana, meetings were held online and utilized collaborative tools like Google Drive and Bluejeans Conferencing.
COMMUNITY ENGAGEMENT
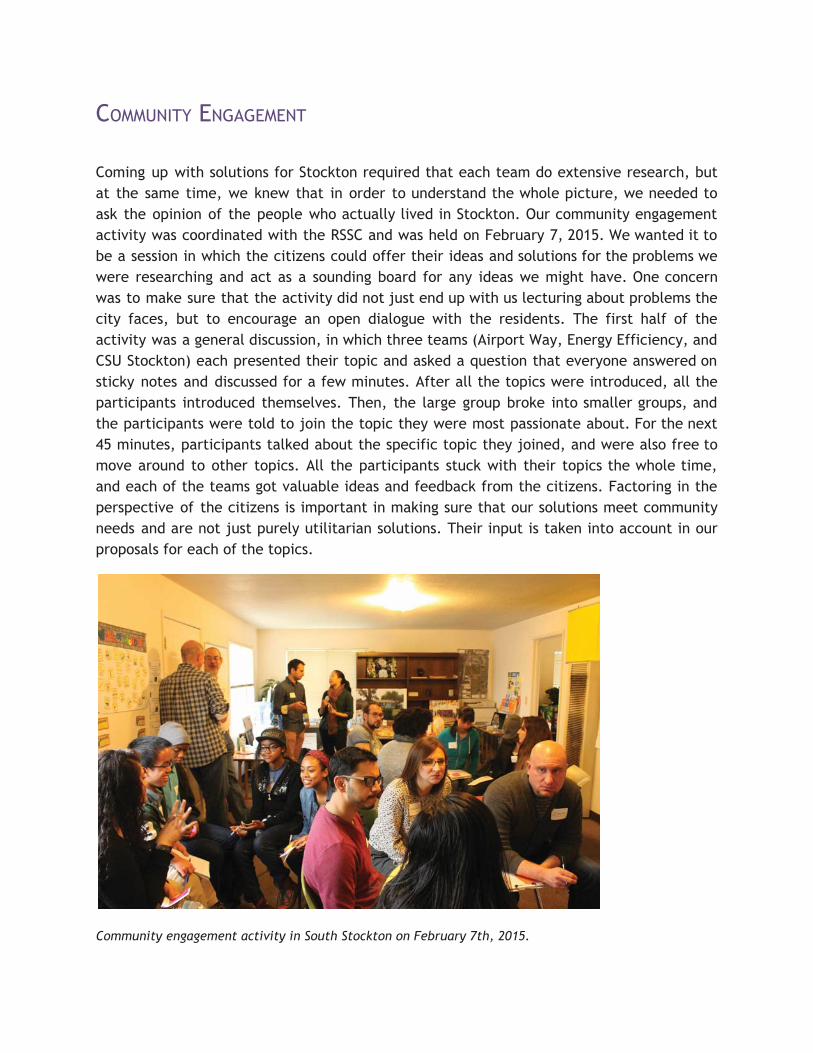
Coming up with solutions for Stockton required that each team do extensive research, but at the same time, we knew that in order to understand the whole picture, we needed to ask the opinion of the people who actually lived in Stockton. Our community engagement activity was coordinated with the RSSC and was held on February 7, 2015. We wanted it to be a session in which the citizens could offer their ideas and solutions for the problems we were researching and act as a sounding board for any ideas we might have. One concern was to make sure that the activity did not just end up with us lecturing about problems the city faces, but to encourage an open dialogue with the residents. The first half of the activity was a general discussion, in which three teams (Airport Way, Energy Efficiency, and CSU Stockton) each presented their topic and asked a question that everyone answered on sticky notes and discussed for a few minutes. After all the topics were introduced, all the participants introduced themselves. Then, the large group broke into smaller groups, and the participants were told to join the topic they were most passionate about. For the next 45 minutes, participants talked about the specific topic they joined, and were also free to move around to other topics. All the participants stuck with their topics the whole time, and each of the teams got valuable ideas and feedback from the citizens. Factoring in the perspective of the citizens is important in making sure that our solutions meet community needs and are not just purely utilitarian solutions. Their input is taken into account in our proposals for each of the topics.
Community engagement activity in South Stockton on February 7th, 2015.

INDUSTRY REVITALIZATION
The main goal of the Industry Revitalization team is to identify 3 industries to which Stockton has the most to offer and which could be positioned in the South Stockton area. The industries are strategically selected with regard to the resources, natural and otherwise, locally available. After the selection of industries, a detailed analysis was conducted into the internal incentives and external factors said industries find conducive. This entailed an overview of the current, potential, and required incentives and accounts for the external factors within the framework of PESTEL analysis. Urban and architectural plans and models were constructed in order to best cater to the needs of the industries; this point is crucial for the success of the project, as by far the greatest asset of the City is the land which it can provide to potential investors in a fiscally attractive environment.
Using the PESTEL framework an analysis was conducted of the macroeconomic factors affecting Stockton. This was then applied to the selection process for compatible industries in which industries were assessed. The industries were evaluated based on their fit in the South Stockton area. A matrix presenting mutually beneficial externalities was compiled to showcase the synergistic influences of the industries and the City with an emphasis on South Stockton.
Rendering of proposed industrial development for South Stockton.

ENVIRONMENTAL RESILIENCY
The Environmental Resiliency team focused on energy efficiency modeling and program analysis in support of Stockton’s Climate Action Plan. To this end, an easily comprehensible “typical home” energy model was generated to demonstrate the current standards of a house typically encountered in South Stockton. The next step was to propose improvements that would make it comply with the standards imposed by regulations. Benefits of the improvements were quantified in terms of the average annual household electricity bill. The main goal was to create a program that would aim to find the capital required to implement the changes proposed, in a way that would be financially sustainable and better meet stakeholder needs. In particular, the needs of South Stockton residents, many of whom have a low or moderate income. They would benefit from alterations to their homes with a small initial investment in terms of savings in energy costs and higher quality of life.
During the community engagement, the team recognized deeply rooted problems such as unhealthy landlord/renter relationships, old housing stock, and budget constraints. As a result, working to improve home energy use in a way that benefits traditionally underserved communities requires rigorous and comprehensive problem solving. Key points discussed include lack of awareness of available resources, distrust, and the need for better-designed incentives. The implementation plan included a discussion of who the stakeholders are and what role they might play, existing outreach strategy, incentive programs, and funding in order to tackle some of the main concerns and challenges voiced at the community engagement. One idea to improve energy efficiency engagement involved retrofitting an old home into a demonstration center, bundling other services such as subsidized materials for home improvement, meeting spaces, community garden, etc.
Possible home retrofit packages for an energy efficiency program in South Stockton.

AIRPORT WAY
The Airport Way team focused on the vacant lots along South Stockton’s Airport Way, which many community members have described as a potential neighborhood center which is currently severely underdeveloped. The goals of the team were to reduce the number of vacant lots over the course of the next twenty years, to make the street safer for pedestrians and bicyclists, to increase the use of bikes and public transportation, to find options for financing the development, and to bring jobs to the area.
Some potential programs the team considered were recreation areas for sports and afterschool activities, a public garden with adjoining market and restaurant, a grocery store, an after school activities center, a public park, a shared tool shed, and overall street infrastructure redesign.
The team gathered information needed to produce designs on key plots, made the program list, consulted with local firm WMB Architects about zoning and building regulations, and participated in the community engagement session.
Rendering of proposed community center on Airport Way in South Stockton.

CSU STOCKTON
The CSU Stockton team focused on the need for a public university in Stockton. To that end, they examined the California Public State University system as a whole, determined the financial feasibility of a CSU Stockton, and used CSU Stanislaus as a model to calculate necessary factors, such as the optimal square footage for the campus. The team chose two potential sites that seem the most realistic for a potential CSU institution: one along MLK / Highway 99, as seen below, and one in North Stockton.
The team worked on individual projects such as engineering and design of the CSU, energy analysis of the campus buildings, financial feasibility and funding, and potential programs/courses that would meet the needs of the city and its economy. The team also looked at public relations to advocate for CSU Stockton. This preliminary analysis will hopefully serve as a stepping stone for the current bill under discussion in the California State Assembly.
Proposed master plan for CSU Stockton on site in South Stockton.

TEAM MEMBERS
Organizers
Derek Ouyang, age 23, graduated from Stanford University in 2013 with dual Bachelor’s in Civil Engineering and Architectural Design, and will return in the fall for a Master’s in Structural Engineering. He co-created the Global Urban Development Program in 2012. He was project manager of Stanford’s first-ever entry to the U.S. DOE’s 2013 Solar Decathlon and has been featured as an up-and-coming architect in the Los Angeles Times, in Home Energy magazine’s “30 under 30”, and at TEDxStanford.
Sinan Mihelčič, age 32, graduated from Ljubljana University in Architectural Design. He co-created the Global Urban Development Program in 2012, both exploring digital collaboration tools in urban planning and architectural design. He established Skupina Štajn in 2008, an emerging young architectural studio in Kamnik, Slovenia. He is a technical assistant in architectural and urban planning studios at the Faculty of Architecture in Ljubljana, as well as a mentor to the AEC class at Stanford.
Klemen Kušar, age 28, graduated from Ljubljana University in 2012 in Architectural design and in 2013 in Economics. In 2010 he was an exchange student at Aalborg University and attended a summer workshop for the renewal of favela Dona Marta in Rio de Janeiro. He participated in the Global Urban Development Program in 2012. In 2008 and 2010 he was awarded 1st and 2nd place in the Isover Multi-Comfort House Design, and in 2012 was awarded the University of Ljubljana Prešeren Prize for his master’s thesis about public participation in the process of gentrification of urban sprawl. He is author of several articles regarding this matter.
Faculty Advisors
John Barton received his BA and M. Arch degrees from U.C. Berkeley. He worked at a number of Bay Area firms before founding Barton Architect in 1990. John has taught design and architecture at U.C. Berkeley, Cañada College, San Jose State University and is currently the Director of the Architectural Design Program at Stanford University. John enjoys cooking, playing lacrosse, and reading good literature and history. He likes Saturdays when the Cal Bears play football.
Glenn Katz is an instructor in the Civil & Environmental Engineering Department at Stanford University. He specializes in BIM education and was an AEC educator for Autodesk. He is the primary advisor for the Global Urban Development Program.
Andreja Cirman, PhD, is Associate Professor at the Department of Money and Finance at the University of Ljubljana, Faculty of Economics (FELU) in Slovenia. For six years she had served as associate dean for academic affairs at FELU and since 2011 she serves as FELU MBA program director. Her main fields of expertise in research and teaching are housing, real estate and public finance.

Mentors
Mikko Tuovinen, age 28, graduated from the UEF with M.Sc (“Master of EU law”) degree. He is passionate about EU, energy, climate and competition policies, and he is a substitute Member of the Municipal Council of Liperi (Finland) and a substitute Member of the Technical Committee of Liperi. Mikko has held also other positions of trust and chaired many associations, primarily in Finland, and is doing an internship at the Court of Justice of the European Union. His role in GUDP is to help with anything related to public relations.
Rob Best, age 26, is a Ph.D candidate in Sustainable Design and Construction program of the Civil and Environmental Engineering department at Stanford University. His research focuses on network planning, integration, and optimization of urban infrastructure systems. He has a B.S. in Engineering from Harvey Mudd College and an M.S. in Civil and Environmental Engineering from Stanford. He was the Design and Construction Manager for the Stanford Solar Decathlon Team, a student-driven project to build a net-zero energy home. Rob is also the Projects and Education Director for Engineers for a Sustainable World, a U.S. based nonprofit that advances project-based learning and knowledge sharing on sustainability and engineering nationwide.
Dimitris Farmakis, age 29, graduated from Stanford University in 2012 with an M.S. degree in Civil & Environmental Engineering (previous degrees in Business and Operations Research). He participated with the Stanford team and took the 1st place in the 24th Annual ASC Construction Management competition. Passionate about BIM and green architecture, after Stanford he founded his startup in Greece offering BIM consulting services and participated as a speaker in Design, Green Building and TEDx conferences in Greece. He occasionally teaches remotely at Stanford’s BIM courses as a guest instructor, and works in parallel with a Silicon Valley startup on developing the world’s first BIM based automated construction scheduler.
Tina Vilfan, age 29, is writing her thesis on revitalisation of old town cores through temporary usage of space at the Ljubljana Faculty of Architecture. She has been working as an architect at Techline projekt d.o.o. for 5 years and has constructed, managed and built projects. For the past year she has been living in Copenhagen, Denmark where she worked at We Architecture and collaborated on several open architectural competitions. She joined the team with participation in the Global Urban Design Course in 2012.
Naseem Alizadeh was born in 1975 and completed a Bachelor of Architecture at Cornell University (1998) and a Master of Architecture in Urban Design at Harvard University (2002). Her practice, Bureau for Architecture and Urbanism, was established in the year 2009. Development and design of environmentally responsible spaces, buildings, and products is the philosophy of Bureau for Architecture and Urbanism.

City Partners
Michael Tubbs was elected in 2012 as the youngest City Councilmember in Stockton's history and one of the youngest elected officials in the nation. He represents the 6th District of the City of Stockton, the district he grew up in.
Forrest Ebbs serves as the Planning Director for the City of Stockton, overseeing all current and advanced planning efforts, managing the Planning and Engineering Division staff, and creating new opportunities for hope and prosperity for the City of Stockton.
Fred is the Administrator for STAND, a 25-year-old South Stockton neighborhood based nonprofit that works on Community Policing, Affordable Housing and Neighborhood Activities. Fred has studied and worked in international and community development for 38 years. Many like to believe that poverty and crime causes blighted neighborhoods. Wrong. The true cause is municipal neglect in the form of weak code enforcement, absent legal action against slumlords, and lack of public investment in housing in these areas. Our mission is to reverse this decline.
Lange Luntao is the Youth Advisor for the Reinvent South Stockton Coalition and a college sociology teacher at Aspire Langston Hughes Academy in Stockton. The former Field Director of Councilmember Tubbs' successful campaign for City Council, he is an active supporter of civic and youth engagement efforts in his hometown of Stockton.
Melanie Vieux is a principal architect at WMB Architects. She received her BArch in 1992 from the California Polytechnic State University at San Luis Obispo, California. She is working on the First Credit Union project in South Stockton.
Doug Davis is a principal architect at WMB Architects. He received his BArch in 1997 from the California Polytechnic State University at San Luis Obispo, California. He is working on the First Credit Union project in South Stockton.
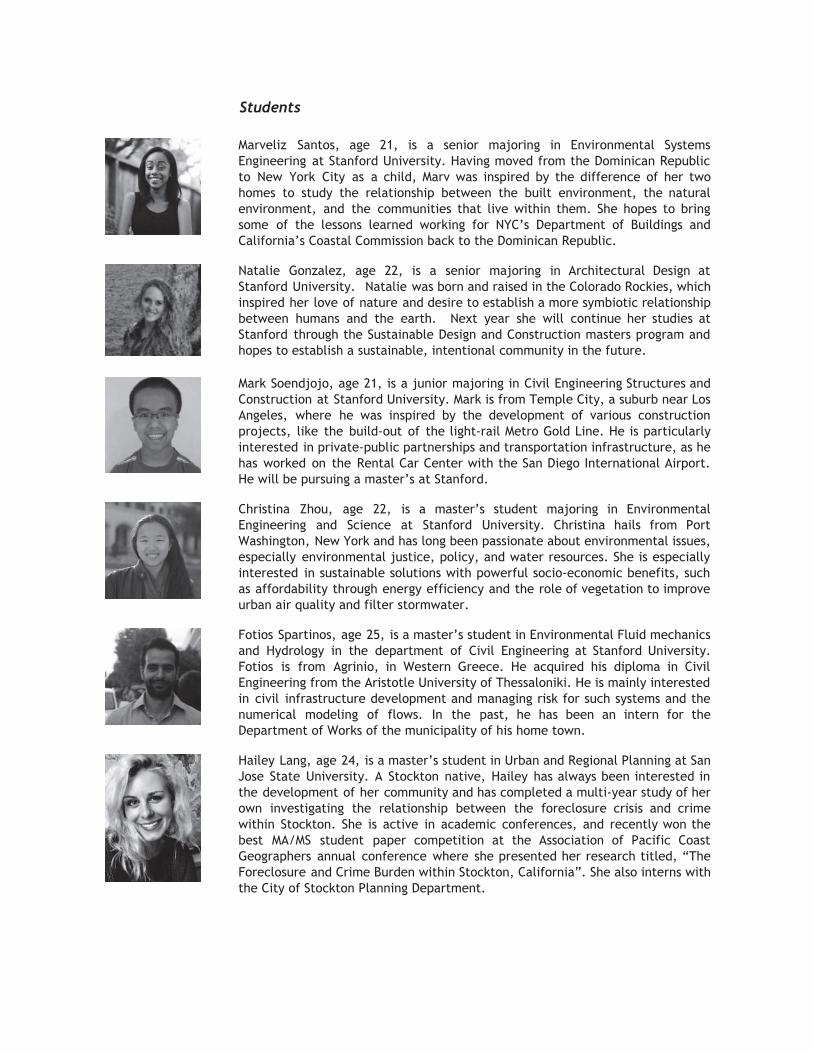
Students
Marveliz Santos, age 21, is a senior majoring in Environmental Systems Engineering at Stanford University. Having moved from the Dominican Republic to New York City as a child, Marv was inspired by the difference of her two homes to study the relationship between the built environment, the natural environment, and the communities that live within them. She hopes to bring some of the lessons learned working for NYC’s Department of Buildings and California’s Coastal Commission back to the Dominican Republic.
Natalie Gonzalez, age 22, is a senior majoring in Architectural Design at Stanford University. Natalie was born and raised in the Colorado Rockies, which inspired her love of nature and desire to establish a more symbiotic relationship between humans and the earth. Next year she will continue her studies at Stanford through the Sustainable Design and Construction masters program and hopes to establish a sustainable, intentional community in the future.
Mark Soendjojo, age 21, is a junior majoring in Civil Engineering Structures and Construction at Stanford University. Mark is from Temple City, a suburb near Los Angeles, where he was inspired by the development of various construction projects, like the build-out of the light-rail Metro Gold Line. He is particularly interested in private-public partnerships and transportation infrastructure, as he has worked on the Rental Car Center with the San Diego International Airport. He will be pursuing a master’s at Stanford.
Christina Zhou, age 22, is a master’s student majoring in Environmental Engineering and Science at Stanford University. Christina hails from Port Washington, New York and has long been passionate about environmental issues, especially environmental justice, policy, and water resources. She is especially interested in sustainable solutions with powerful socio-economic benefits, such as affordability through energy efficiency and the role of vegetation to improve urban air quality and filter stormwater.
Fotios Spartinos, age 25, is a master’s student in Environmental Fluid mechanics and Hydrology in the department of Civil Engineering at Stanford University. Fotios is from Agrinio, in Western Greece. He acquired his diploma in Civil Engineering from the Aristotle University of Thessaloniki. He is mainly interested in civil infrastructure development and managing risk for such systems and the numerical modeling of flows. In the past, he has been an intern for the Department of Works of the municipality of his home town.
Hailey Lang, age 24, is a master’s student in Urban and Regional Planning at San Jose State University. A Stockton native, Hailey has always been interested in the development of her community and has completed a multi-year study of her own investigating the relationship between the foreclosure crisis and crime within Stockton. She is active in academic conferences, and recently won the best MA/MS student paper competition at the Association of Pacific Coast Geographers annual conference where she presented her research titled, “The Foreclosure and Crime Burden within Stockton, California”. She also interns with the City of Stockton Planning Department.

Rok Perme, age 21, is a master student of architecture at the University of Ljubljana. He grew up and attained elementary and high school in Ljubljana, where he is now continuing his university education. Besides architecture he is interested in construction, real estate development and finance. In the school year 2015/2016 he is going to study in Muenchen, Germany as an exchange student. He played football (soccer) for 10 years on a high level, before he started studying.
Martin Valinger Sluga, age 20, is an undergraduate student in Urbanism on the Faculty of Architecture at the University of Ljubljana, Slovenia. After applying to the university, Martin instantly found himself in the various disciplines of urban planning. He is particularly interested in sustainable urban development and design. Urban research and revitalization in relation to connected socio-economic factors are important to him as well. He is attending a student’s exchange in the Netherlands in September and will pursue a master's in Urban Design in a foreign country the following year.
Matjaž Dolenc, age 25, graduated from Ljubljana University in 2014 with a Bachelor’s degree in Business and Economics and is currently attending the university for a Master’s degree in International Business. In 2012 and 2013, he participated in a student project which created a new regional development strategy for the Nova Gorica region in Slovenia, focusing on developing entrepreneurship, tourism and regional collaboration. From 2013 to 2014, he was a member of Ustvarjalnik, an initiative aimed at helping creative students develop their ideas, where he led entrepreneurship clubs at high schools in Nova Gorica, Slovenia.
Črt Jaklič, age 23, is a masters student in architecture at the University of Ljubljana. Črt, a Mirna Peč native, now lives and studies in Ljubljana. He has a special affection for numbers, which resulted in various prizes at mathematical competitions in high school. Now he is deepening his interest in residential and public buildings and is preparing for his master’s thesis about primary schools. In his free time he enjoys hanging with friends, playing basketball, and sleeping.
Matija Kuzman, age 23, is a masters student in architecture at the University of Ljubljana. He has lived in Ljubljana since birth and is now thinking about going abroad. His first destination is Istanbul, where he will study architecture at the Istanbul technical university next year. He is interested in architecture as well as urban design and interior design, and has yet to fully determine his career. His second interest is music; he has been playing in different bands and orchestras his whole life. He travels a lot and is interested in various cultures, especially different genres of music that emerged in every larger culture.
Andrej Slemenjak, age 22, graduated from University of Ljubljana in Money and Finance. He attended primary and high school and grew up in Velenje, Slovenia. In his early years he was an active scout and trained handball and aikido. Andrej also participated in several international projects, including Euroscola project. Finance has been his great field of interest, but he enjoys in skiing, cycling and reading a good book. Currently, he is working for a business consulting company and a private equity fund.

Lovro Kajapi is a Croatian student currently studying at the Faculty of Architecture in Ljubljana, majoring in Urbanism.
Samantha Konec, age 22, is a master’s student in architecture at the University of Ljubljana. She comes from Tolmin, beautiful small town in Slovenia, and is currently living in Ljubljana but going abroad next year; she wants to finish her studies in Portugal. Beside architecture she is also very interested in product design; her first collection of sunglasses is just on its way to be presented in several optic stores and optic fairs in Milano and Paris. You can find her at different fitness centers teaching aerobics every afternoon, or maybe at some kite surfing spot every few months. Sport is her passion!
Teodor Hribovšek, age 23, is a master’s student in architecture at the University of Ljubljana. He grew up in the alpine town of Kamnik. Soon he continued high school in Ljubljana where he attained classical education, including Latin and philosophy. It’s also when he showed keen interest in art and languages. Even though he followed his passion for architecture, he’s currently fluent in 3 foreign languages. Later he studied abroad in Madrid and furthered interest in design and architectural composition. He would like to promote simple solutions and sustainable development to solve even the most complex problems and hopes to do so throughout his career.
Žiga Hudournik, age 22, is a master’s student majoring in Bank and Financial Management, attending the Double Degree Program at the University of Ljubljana. His Bachelor studies include experiences from BI Norwegian Business School, a prestigious Triple Crown institution, where he plans on returning to finish his Master’s thesis. Žiga is currently employed as an analyst for a regional private equity fund and is also actively involved in startups. In 2013 through 2014 he co-led the creation of a development strategy for the newly established Slovenian municipality of Ankaran. In 2010 he led the Slovenian Euroscuola project congregation in the European Parliament. He has served as the Slovenian industry representative for a EU-funded environmental cluster co-op project. He was a national champion competitive swimmer for over 10 years and still enjoys swimming as well as sailing, scuba diving, skiing and tinkering with his old-timer Jaguar.
INDUSTRY REVITALIZATION
INTRODUCTION The main goal of the Industry Revitalization team was to identify 5 industries to which Stockton has the most to offer and which could be positioned in the South Stockton area. Due to the highly segmented nature of one of the industries, the choices were later on limited to 3 recommendations. The industries are strategically selected with regard to the resources, natural and otherwise, locally available. After the preliminary listing of industries, a detailed analysis, presented in Deliverable 3, was conducted into the internal incentives and external factors said industries find conducive. This entailed an overview of the current, potential, and required incentives and accounts for the external factors within the framework of PESTEL analysis. The aforementioned findings have been compiled and presented in a SWOT analysis format. Using the PESTEL framework an analysis was conducted of the macroeconomic factors affecting Stockton. This was then applied to the selection process for compatible industries in which industries were assessed. The industries were evaluated based on their fit in the South Stockton area. A matrix presenting mutually beneficial externalities was compiled to showcase the synergistic influences of the industries and the City with an emphasis on South Stockton. This matrix was presented in Deliverable 3 and formed the basis for final selection of the 3 industries. Urban plans and models have been constructed in order to best cater to the needs of these industries; this point is crucial for the success of the project, as by far the greatest asset of the City is the land, which it can provide to potential investors in a fiscally attractive environment. Below we present the final 3 industry recommendations. These are assessed in terms of business environment, labour force and investment needs. A cursory environmental impact analysis is also included with each recommendation. Finally, we present a 10-year forecasting model for the growth of the selected industries as a means of showcasing the long-term economic benefits the aforementioned industries can bring to Stockton.

FOOD PROCESSING
Development strategy
What to produce? Choosing the exact area in the food processing industry, where the city expects to achieve the highest results - the proximity of agricultural goods, along with the favorable climate, allows wide choice when deciding on the precise area of food processing to start the industry development in.
Market Research and Business Planning: Examine whether there is a market for the product, obtaining ideas for fine-tuning of the product, decide how to distribute, price and promote your product; gather information on the industry, competitors and customers.
Business Insurance, Regulations and Food Safety: Pay attention to the regulations and requirements that are related to the area of food processing industry and more specifically to the exact field of interest.
Manufacturing Strategies: Decide on the various factors, including construction or rental cost, customer location, material availability, trucking access and zoning, production processes and procedures, etc.
Marketing: In the first place, work on marketing strategy for the industry zone that will be developed in the city. Clustering brings many benefits to all the companies involved, and making connections between them is relevant for the development of both industry and the geographical area. Once the industry is established, promoting activities that will bring the products and their features closer to the public are needed.
Distribution: Use the benefits the city’s position provides to the industry; investigating prospective buyers, determining customer needs and desires, demonstrating how your product meets customer needs, and making the sale and following up.
Regulations and licensing
The US food system is regulated by numerous federal, state and local officials. At the federal level, The Food and Drug Administration publishes the Food Code, which is a model set of guidelines and procedures that assists food control jurisdictions by providing a scientifically sound technical and legal basis for regulating the retail and foodservice industries. The Food Code is then used by regulatory agencies to develop or update food safety rules. There are 15 agencies sharing oversight responsibilities in the food safety system, although the two primary agencies are the U.S. Department of Agriculture (USDA) Food Safety and Inspection Service (FSIS), which is responsible for the safety of meat,

poultry, and processed egg products, and the Food and Drug Administration (FDA), which is responsible for virtually all other foods. The Food Safety and Inspection Service has approximately 7,800 inspection program personnel working in nearly 6,200 federally inspected meat, poultry and processed egg establishments.
Besides the regulations on federal level, a number of U.S. states also have their own regulations and codes; meat inspection programs for example, which substitute for USDA inspection for meats that are sold only in-state. Certain state programs have been criticized for undue leniency to bad practices. However, other state food safety programs supplement, rather than replace, Federal inspections, generally with the goal of increasing consumer confidence in the state's produce. In addition to the US Food and Drug Administration, several states that are major producers of fresh fruits and vegetables (including California, Arizona and Florida) have their own state programs to test produce for pesticide residues. California has its own food codes that must be considered prior to any engagement in the industry.
Employment
In 2011, the U.S. food and beverage manufacturing sector employed about 1.5 million people, or just over 1 percent of all U.S. nonfarm employment. In almost 30,000 food manufacturing plants (as of 2007) located throughout the country, these 1.5 million workers were engaged in transforming raw agricultural materials into products for intermediate or final consumption. Meat and poultry plants employed the largest percentage of food and beverage manufacturing workers, followed by bakeries, and fruit and vegetable processing plants. (USDA, 2012) As food processing is still a relatively labor-consuming industry, there might be many career opportunities for locals. Processes tend to be less automatized, leading the industry to demand more highly educated professional profiles for their workers.
Within the food processing industry, there are different processes and procedures that are to be respected, and that are related to the specific field of processing (for example, processing almonds differs significantly from the procedures that are to be used when the dairy products are concerned). Due to these differences, the number of workers and their professional profiles vary as well. In general, we can expect every middle size factory in the industry that would be located in this industrial area to employ 100-250 people.

Industry size and value
The US food industry represents around 16.5 million jobs, and the population spends around $1 trillion per year on food products. In total, food manufacturing accounts for 14% of all U.S. manufacturing employees.
Investments
The size and frequency of investments made in the food processing industry vary in dependability of the exact industry concerned (for example, Blue Diamond invested $31.78m in the equipment for the plant on 36.5 ha land related to almonds processing, providing approximately 300 jobs, directly and directly; due to more complicated procedures and regulations, the investments of similar size in dairy industry are almost 1.5 times bigger, etc. )
Environmental effects
The two major environmental issues concerning food processing plants are wastewater and solid waste. Because wastewater generation is the industry’s biggest area of concern, new clean technologies focus on source reduction, recycling and reuse of wastewater. The need for an effective water treatment system is therefore a must. Another problem is the discharge of large amounts of water; for example, one medium-sized plant can have a major effect on local water supply and surface water quality. Large food-processing plants will typically use more than 1,000,000 gallons of potable water per day.
The quantity of solid waste varies by the type of food the industry produces, from rinds, seeds and skins in the fruit/vegetable industry to the fats and acids in the dairy industry. The most effective method to preserve the environment and reduce the disposal costs is to decrease the volume of waste material and by-products generated in the process. Common source reduction methods employed at most plants include improving good housekeeping practices, making process modifications, substituting more environmentally friendly raw materials, and segregating waste streams. If source reduction is not a viable solution,
1
alternatives such as using the food by-product as an animal feed or composting it should be used. The newest legislations are stipulating the presence of small recycling plants within the industrial zones, such as ReConserve Inc. in the southern (industrial) part of Stockton, specialized for the solid organic waste that the nearby plants produce.
The food processing factories should also follow the major technological innovations in the industry, including those in clean technologies and processes. Clean technologies are
1 For more details, see http://www.unido.org/fileadmin/import/32129_25PollutionfromFoodProcessing.7.pdf ; useful also for examining ways of environmental protection.
defined as "manufacturing processes or product technologies that reduce pollution or waste, energy use, or material use in comparison to the technologies that they replace."
2
Clean technologies include: ● Advanced Wastewater Treatment Practices – use of wastewater technologies beyond
conventional secondary treatment, ● Improved Packaging – use of less excessive and more environmentally friendly
packaging products, ● Improved Sensors and Process Control – use of advanced techniques to control
specific portions of the manufacturing process to reduce wastes and increase productivity,
● Water and Wastewater Reduction (Closed Loop/Zero Emission Systems) – reduction or total elimination of effluent from the manufacturing process.
3
Because the food processing industry has special concerns about the health and safety of the consumer, clean technologies are already being widely used. To run an environmentally friendly plant, the presentation of the technological solutions to the potentially established companies in South Stockton would be necessary as it would it be to inform them about their future possibilities. The city and their partners would have to exercise a strict control over the plants and the companies would have to carry out these regulations consistently.
Differentiation
For certain products in food processing industry, California and San Joaquin county have the the positive origin effect that can be evoked. For example, the world’s most famous and most dominant nuts (especially almonds and walnuts) come from this region. Furthermore, the citrus fruits are some of the world’s most succulent.
“Know how” is present as well, due to the long tradition of excellence in the field of agriculture and food industry in the state. Different professional profiles and education – having long experience in the activities related to the agriculture and food processing (directly or indirectly) make the Stockton area rich in experts, or at least experienced and knowledgeable locals.
Affordable workforce: unlike many cities nearby, Stockton can offer a workforce whose prices enable investors to be competitive in the market. Numerous food processing companies are present in the state of California. The potential industry located in Stockton would be able to offer companies:
2 http://www.sustainabletable.org/869/impacts-of-industrial-agriculture 3 http://www.unido.org/fileadmin/import/32129_25PollutionfromFoodProcessing.7.pdf

Good location: important for both transportation and distribution, and for quality of inputs; connection to major state roads (not only land ones; port and airport are located in the city as well, and they have the capacity to accommodate such undertakings).
Proximity of inputs: as the top 3 most important characteristics needed for successful establishment of industry in a certain area.
TIRE RECYCLING Tires are not desired at landfills, due to their large volumes and 75% void space, which quickly consumes valuable space. Tires can trap methane gases, causing them to become buoyant, or bubble to the surface. This ‘bubbling’ effect can damage landfill liners that have been installed to help keep landfill contaminants from polluting local surface and groundwater. California recycles almost 90% of all waste tires. The vast majority of the tires are processed for further use, also for export to Vietnam, Indonesia, and China where they are used as a fuel in their thermal power plants. The process of recycling (which is divided in several sub-categories) is being done in special facilities where tires are shredded, stamped or cut.
Industry overview The industry shows great dynamics. The number of facilities involved in export shifts rapidly; some of existing facilities ceased operations, while others are expanding them. Waste tires can be processed in several different ways, for: ● export: waste tires and processed TDF (tire derived fuel) ● reuse: retread ● ground rubber: paving, athletic fields, loose-fill play/ bark/ mulch ● ADC (alternative daily cover) ● civil engineering: landfill applications ● landfill disposal ● TDF

The graph above shows waste tire end-use trends by broad market category since 2002. In recent years, rapid and unprecedented growth in exports of tires to Pacific Rim nations was largely responsible for boosting the overall diversion rate beyond the 72-75 percent level (where it had hovered for more than 10 years). The decline in diversion in 2013 was also due in part to a drop in sales of crumb rubber produced from California tires of about 25 percent, caused by competitive pressures and soft markets, exacerbated by lingering impacts from the collection revenue decline and tire supply shifts caused by the export surge.
Supply and demand balance California has a large, dynamic infrastructure for collecting and processing waste tires. In 2013, the vast majority of tires generated in California flowed to one of 14 processors or to one of four exporter facilities (i.e., facilities that primarily or exclusively ship baled or shred tires overseas). While export demand softened somewhat for a time in 2013 and crumb rubber sales were down, overall competition for whole tires remained strong and was apparently increasing again in 2014. Some established processors continue to be severely impacted by the trend, with lower volumes and profitability. It should also be noted that a number of developers are investigating the potential to establish new facilities in California that could use significant quantities of

California-generated waste tires for crumb rubber production, pyrolysis, and other types of processes and technologies. So far, none of these proposed or discussed facilities has materialized on a commercial scale. However, if one were to be sited and compete for tires, it could have a significant impact on the supply-demand balance and could negatively affect existing firms involved in managing California scrap tires in terms of access to tires, collection revenues, and competition for sales. Given the current strong demand for California tires, such a venture would likely require attractive pricing to secure an adequate feedstock supply, which can be achieved through the grant program.
Tire Incentive Program (TIP) The TIP is focused on promoting feedstock conversion and market expansion by providing payments of 10 cents per pound to manufacturers of established products that increase sales, 20 cents per pound for manufacturers shifting feedstock from virgin rubber to crumb rubber for at least 5 percent of feedstock needs, and 20 cents per pound for manufacturers of compound plastic-rubber products (or other combinations of materials) or those using fine crumb rubber of 50 mesh or greater mesh size. This can result in a combined incentive of up to 40 cents per pound to select manufacturers.
What would the industry bring to Stockton? The industry would turn one of the Stockton’s brownfields into their recycling facility and would enhance the overall look of the city. Through operating activities there are expected capital inflows to the city, which will also collect tax from industry’s revenue and other activities. Tire recycling would boost people’s perception of the importance of recycling and will decrease unemployment. One million invested in tire recycling facility creates, on average, 6 jobs. Thus, the median income will increase and create, through the job multiplier effect, other businesses, such as restaurants nearby. Tire recycling offers great synergies with the logistics. It may also be upgraded to tire manufacturing as described later.

This is how a typical tire recycling facility looks like from inside. Man on the picture is loading the shredded tires.
What would Stockton bring to the industry? Stockton offers perfect positioning for such an industry due to its traffic connections. It also has access to a deep-water port, so TDF and other products can be transported to Asia with more competitive prices. Stockton also offers land that is currently completely unused. As it is described in the document, the perfect location for such a facility has already been selected based on numerous parameters such as proximity of residential objects, traffic connections, and others. One of the most important factors is workforce. Tire recycling demands relatively unskilled workers and some with basic knowledge of operating heavy and light machinery.
Tire manufacturing A possible alternative or even upgrade from tire recycling is tire manufacturing. The demand of tires in the US was at 288 million units in 2013 (market size of ca. $40 billion), of which 152 million units were imported. The industry is very competitive, with the four biggest companies (Dunlop, Firestone, Michelin, Goodyear) having a market share of 83%. Future projections suggest there will be a strong demand of tires in the next years, mostly due to the recovery of American automobile industry. Some tire makers have already taken into account future trends and invested heavily in the new production facilities in the US which can be seen in the graph below.

New investments in tire manufacturing from 2012 - 2013 The top states by daily production are Oklahoma (89k), South Carolina (84k), North Carolina (73,2k), Alabama (46,8k), and Mississippi (42k). Stockton may have a huge competitive advantage in tire supplying, having in mind there are 13 million automobiles registered in California. Also, Stockton’s unique location allows export of tires to the west coast of Canada, Japan and Australia with lower costs and more competitive prices. The US produces mostly tires for trucks, buses and off-road vehicles, which are, due to their dimensions, more difficult to ship, but can be sold at the higher margins, compensating the relatively expensive domestic workforce. A typical manufacturing facility with 1,000 employees produces 16,000 tires daily. Much like the tire recycling, tire manufacturing offers important synergies with logistics, too.
Environmental effects
Due to the large volume produced, tires that are no longer suitable for use on vehicles are among the largest and most problematic sources of waste in the world today. Although 42 states in U.S. regulate the disposal of tires to some degree, discarded tires still present a serious environmental concern. From ca. 5 million tire waste that is generated annually, only 35 percent of rubber from these tires is recycled. This means tons of tire waste goes into already overcrowded landfills that are still being tolerated by the majority of states. Due to the fact that tires contain a number of components that are ecologically problematic, toxin release is the second major problem. Toxins, heavy metals and oils that are released from decomposition, incineration or fire can pollute the groundwater, air and

soil. To avoid these, each site should be individually assessed determining if the shredding is appropriate for given conditions. Another problem which doesn't necessarily reflect as an environmental but more of a health issue, is the fact that waste tires can become a breeding ground for pests (e.g. mosquitoes).
Tire shredding and the production of scrap tires is therefore the most environmentally safe solution in disposal of worn-out tires. Tire scraps can be used in a number of productive applications, such as tire-derived fuel, civil engineering applications and ground rubber applications. Due to the unpleasant smell of shredded rubber, the tire shredding plant
4
should be located in the suitable industrial zone. Another regulation for this kind of industry is the presence of a “dumping ground” or warehouse with sufficient ventilation, the capacity of which is suitable to the quantity of tire scrap the plant produces. A sufficient logistics center and transportation system for the regular removal of material is essential.
LOGISTICS The logistics industry is a key element of the modern economy and its importance is set to increase as globalization continues and trade increases. It is a highly location-specific industry and is very competitive in the United States, yet companies on the logistics market have access to the world’s largest consumer market. The industry is divided into many subsectors:
● logistics services ● air and express delivery services ● freight rail ● maritime ● trucking
Industry size and value The U.S. logistics and transportation spending totaled $1.35 trillion in 2013, and represented 8.5 percent of the gross domestic product (GDP). While many businesses perform this function in-house, others do not; instead, they outsource it to third-party logistics (3PL) businesses. This subsector represented 10.6 percent of the industry in 2013 and has been steadily growing in recent years; market size has increased from $127.3 billion in 2010 to $146.4 billion in 2013.
4 http://www.epa.gov/waste/scrap_tires

Investment Investments in the industry vary in size significantly; they can range from a small warehouse unit to a large distribution center worth hundreds of millions of dollars. There have recently been logistics investments nearby. In Tracy, Amazon recently opened a 1 million sq. ft. fulfillment center, creating over 1500 jobs. On average, a $1 million dollar investment in the industry generates 3.8 jobs. The type of investment most suited to Stockton is a distribution center or warehousing facilities. However, as clustering is beneficial to the development of the involved companies and results in a faster growth rate, attempting to achieve this in Stockton would be advisable.
Regulation The logistics industry in the United States is regulated in a similar manner as throughout the developed world. There are many regulations applying to the transportation of goods and the transportation sector in general, from hours of service limits to shipping container sizes. Customs procedures also have a high impact on the logistics industry in terms of international trade.
What would Stockton bring to the industry? Choosing the right location is key when planning logistic centers. Stockton’s location is ideally suited for logistics; it is close to fast-growing large population centers such as the Bay Area and Greater Sacramento, it has relatively inexpensive and adequate land, it has excellent access to highways and railways, with intermodal yards, a deep-water port and an airport. The Central Valley’s suitability for logistics operations has not gone unnoticed; logistics jobs have been steadily shifting there from the Bay Area, primarily due to lower costs. The annual warehouse operating costs in Stockton are estimated at $18.5 million, which compares favorably with Bay Area locations such as Richmond ($21.6 million) and Oakland ($20.6 million). The main advantage Stockton has in comparison with other Central Valley cities is its deep-water port, which other cities in the area lack. Another important factor is the workforce. Logistics companies have a need to employ a range of diverse profiles; however, a large share of jobs in the logistics industry require little to no experience.
What would the industry bring to Stockton? Besides filling vacant lots and increasing economic activity, the industry would decrease unemployment, as locals can fill most of the new job positions, also increasing median incomes in the city. The Bureau of Labor Statistics estimates employment in the area of logistics may increase by 21.9 percent between 2012 and 2022, with 27,600 new jobs added. The employment characteristics of the logistics industry make it especially suitable for Stockton. Logistics companies have a need to employ a range of diverse profiles, blue-collar and white-collar workers alike. For example, a distribution center requires skilled managers but also warehousing staff such as material handlers; positions, which have low job requirements, where no specialized skills or special licenses and certifications are necessary. As Stockton has a relatively less educated workforce than the California average, this represents an opportunity to increase the income of the most at-risk members of the community. New jobs in the logistics industry would also create new jobs elsewhere in the city economy due to the job multiplier effect, from suppliers, subcontractors to the services sector, which would benefit from an increased disposable income. Altogether, one new logistics job results in 3.47 new jobs elsewhere in the economy. While a $1 million investment generates on average 3.8 direct jobs, due to the job multiplier effect, 13.2 other jobs are also created in the economy. Furthermore, as operational experience is valued in the field and many companies promote from within, the resulting increased career opportunities for lower-paid workers also positively affect the local community. There is a long-term trend towards the creation of more high-skilled jobs in the logistics industry, especially as companies start to make better use of information systems and apply technological innovations to warehouse management and delivery systems. This represents a unique opportunity for Stockton, should the proposed California State University campus come to fruition, as the university could help the city provide a high-skilled workforce for the industry in the long run through cooperation, the development of relevant study courses and specialized logistics training.
Environmental effects
Environmental requirements and industry regulations among developed countries don’t differ much one from another, so the environmental effect has been overlooked from the point of developed countries as investment countries.
The issue with the environmental effects of FDI (foreign direct investment) is the transfer of polluting industries and dividing those into positive and negative effects. Correspondingly, the standards for the formation of environmental effects should be split

into two specific areas, where environmental standards influence the capital inflow among countries, and pollution industries of high standard areas invest to slightly lower standard areas, which contribute to transferred pollution.
There are many different impacts of the logistics industry on the environment. Firstly, there is an impact while occupying land due to transport and storage, such as transportation access, site, ground and material storage transportation and handling facilities. Goods transportation consumes fuel the same as transport and storage equipment. Material consumption and processing waste due to reverse logistics is also problematic. All of these generate waste on different levels. There is also the possibility of production loss and waste due to distribution processing. The way to fix these issues is introduction to advanced logistics technology. This includes promotion of development of green logistics, making efficient forward logistics and smooth reverse logistics in order to form a positive environmental impact of the whole logistics process.
INDUSTRY GROWTH FORECAST In order to present the long-term economic benefit of the selected industries to the City, a projection of growth was computed with regard to relevant revenue and cost drivers of each of the industries. Results in the form of yearly growth figures are summarized in the graph below.
Food processing A dominant part of the proposed food processing industry is almond and other nut production, of which over 70% of the world’s total output is produced in California and shipped globally, the proxy for the primary revenue driver is world GDP growth. Costs of the industry are mostly dependant on input prices of raw material; these were proxied by traded futures contracts on orange juice and almonds. Projected growth closely follows the world GDP forecast and is expected to average between 3.5% and 4%.
Tire recycling Due to low procurement costs and plentiful supply the main growth drivers in this industry are revenue based. Since the vast majority of revenue in this industry is created – directly or indirectly - through sales to the Chinese energy market, the base proxy for revenue growth used is the Chinese energy demand chain index. This is further adjusted for petroleum fuel prices to account for transport costs in the form of crude oil price forecasts.

Chinese industrial ecological legislature is also taken into account to control for emission regulation constraints.
The industry is characterised by high potential growth, which is set to increase in the first 5-year period, driven by the prevailing energy demand growth factor. In the second 5-year period the growth starts to taper off with the energy demand index due to lower Chinese economy growth rates and further augmented with implantation of emission control regulations.
Logistics
The logistics industry presents significant revenue as well as cost driver effects. As in most service industries, revenues are heavily dependant on current economic activity in the relevant market. For this reason the primary revenue driver proxy is real US GDP growth. The primary cost driver in the logistics industry is the cost of fuel. As such the proxy chosen is real US petroleum price growth, which is itself highly correlated with the price of crude oil.
Growth in this industry is highly correlated with real US GDP growth as is stated above and is as such expected to remain in the 2% to 3% range for the forecasting period.

INDUSTRIES LOCATIONS
Industries locations in South Stockton
The implementation of selected key industries in South Stockton was made upon:
● existing land use (General Plan of Stockton),
● location of existing nearby industries,
● location of existing industries in Stockton with similar program,
● public transport/cycling accessibility,
● spatial needs of industry,
● transportation requirements,
● technology requirements,
● agricultural preservation limitations,
● South Stockton Land Use Strategy (mentioned later), etc.


Market research
Although the above mentioned factors are those upon which the relevant selection should be made, the selection is of purely informative nature and for the purpose of the project. Selected sites can only serve as a direct referential case. Due to limited sources, land value of vacant lots, the cost of taxes and market value in the future were the only relevant factors that were not taken into account entirely. The research was based on the assumption that the city would offer the vacant lots they own (to potential investors and buyers) for low purchase price or "pro bono". Low industrial property taxes and work costs would aid to the willingness of investors to purchase this kind of land and the benefit from the city's point of view would be the revitalization of brownfields and other degraded industrial sites.
To include the above mentioned factors, a broader and more detailed research has to be made. This would create a relevant and more accurate financial plan. Within the context of our project this was not possible, so we compared the value of selected parcels to those industrial lands in South Stockton that are currently on market, to try to appraise the approximate value of lands. From the below table we can conclude that the prices for vacant lots are extremely variable and can differ depending on their location, surrounding environment, property type and the valuation of appraiser. The growth of land values is not necessary proportional with the size of the parcel.
Location Area Land Value
3817 Farmington Rd. 4 ha $ 650,000
2025 E Weber Ave. 5 ha $ 975,500
Airport Way & Sperry Rd. 6 ha $ 1,250,000
715 W 8th St. 7,5 ha $ 1,750,000
4100 S Highway 99 9 ha $ 2,100,000
Airport Way & Zephyr St. 12,5 ha $ 2,000,000
3158 Acres El Pinal Dr. 14,5 ha $ 2,300,000
Land value for different vacant lots in South stockton (source: http://www.landandfarm.com)

SOUTH STOCKTON LAND USE STRATEGY
Directions of land use development
The aforementioned industries and their locations were also selected based upon a strategy, which would bring more systematic and judicious development in pursuit of more coherent and heterogeneous land use.
The development of the three main land uses in the city (residential, commercial, industrial) would focus on infill, revitalization and mixed use, avoiding segregation of program and low-density area. Commercial development would be concentrated along three city major paths, connecting the city's southern part and downtown, while providing a break through industry zone on the south (for possible future residential development). Residential land use development would concentrate on the future connections between certain neighborhoods providing a more compact shape, while the industry development would concentrate on continuation of the outlined direction, but at the same time allowing potential residential development on the degraded sites. The long red vector between the two industrial (blue) vectors on the south is the area of Airport Way. Currently the area intersects with industrial land use in the south, but in the further development we would combine the two separated industrial areas with a commercial longitudinal line in between them. This would also benefit the nearby residential part to have more areas of mixed use as the opposite of the already existing singular use sites. The industrial parts would continue to develop to the southwest of South Stockton, along the main railway in the south

and towards main port, thus creating the space for the development of the residential sites inside the existing boundaries. These would be intersected by the commercial use roads and streets.
The strategy could be developed in a real development plan of South Stockton as actual mapping of several regions' growing boundaries. The plan would show detailed typological examples of how to efficiently develop new factories within the area and would analyze the benefits of this to the overall city land use. Collaboration and correspondence with the present and future work of Stockton’s Planning Commision, Economic Development Commission and Planning Staff would be crucial to create an effective and comprehensive strategy.
CSU STUDY PROGRAMMES
During the fourth phase of our project, members of the Industry Revitalization team considered the idea of connecting with the CSU team (see later section), creating several study and educational programs which the CSU could offer the students. These programs would serve as a direct connection with the proposed industries and would be designed in a way that students from CSU would be most suitable for the jobs. Graduated students would have a chance to be employed by one of the companies that would establish itself in the city or would be offered a working experience during the course of the study.
There are several benefits of this kind of collaboration. Firstly, apart from the jobs in the industries which would employ the majority of workforce with lower education (eg. manufacturing), industries would also generate jobs which would demand a personnel with higher (or technical) education. Higher paid jobs would also be beneficial for the industries and the city itself, considering the benefits of the aforementioned "Job Multiplier Effect". Another benefit of collaboration would be the employment of young personnel from city's own student base (county, city or local area), thus benefiting the city's demographic and educational parameters.
Suitable professions for proposed industries:
● Information Technology, ● Logistics, ● Operational Management, ● Business administration, ● Environmental Research, ● Food Technology, ● Biotechnology, ● Agricultural technology, etc
ENVIRONMENTAL RESILIENCY
OVERVIEW
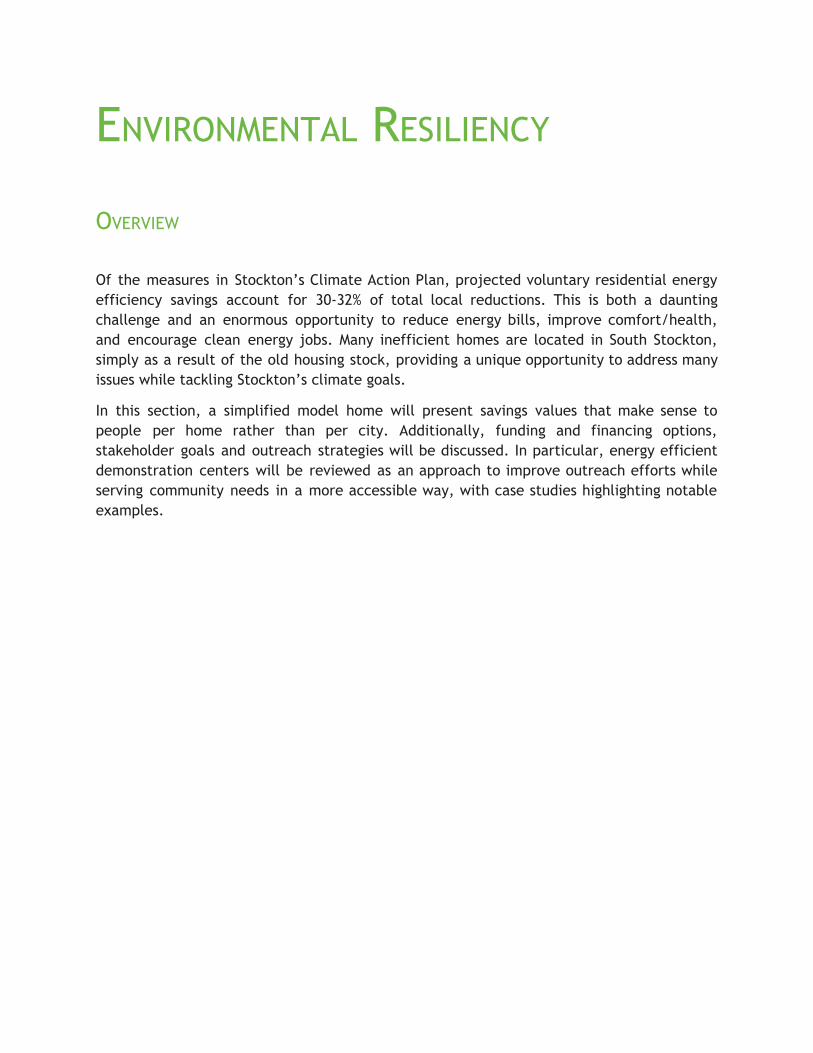
Of the measures in Stockton’s Climate Action Plan, projected voluntary residential energy efficiency savings account for 30-32% of total local reductions. This is both a daunting challenge and an enormous opportunity to reduce energy bills, improve comfort/health, and encourage clean energy jobs. Many inefficient homes are located in South Stockton, simply as a result of the old housing stock, providing a unique opportunity to address many issues while tackling Stockton’s climate goals.
In this section, a simplified model home will present savings values that make sense to people per home rather than per city. Additionally, funding and financing options, stakeholder goals and outreach strategies will be discussed. In particular, energy efficient demonstration centers will be reviewed as an approach to improve outreach efforts while serving community needs in a more accessible way, with case studies highlighting notable examples.

COMMUNITY ENGAGEMENT
This work was guided heavily thanks to feedback from the Community Engagement workshop. Attendees cited the poor state of homes, inaccessibility of outreach, disconnect in incentives, inability to pay upfront, and lack of trust as barriers to acting on, or even caring about energy efficiency to save bills, let alone environmental friendliness. These considerations guided the team’s problem solving approach, and shaped our final proposal.
MODELLING APPROACH
In order to best illustrate the benefits of improving existing houses in terms of energy efficiency, a “typical” home was modeled. The house was assumed to be built in the 1970’s or earlier, before energy codes were developed, with dimensions and construction typical of a home one might find in South Stockton. While not all homes fall into this category, a sizeable portion of homes in South Stockton belong to this aging housing stock, with high energy consumption and poor indoor air quality.

Baseline House Dimensions
Floor Area 1064 square feet
Ceiling Height 9 feet
Stories 1
Window area 143 square feet
Gross wall area estimate 1468 square feet
A reference floorplan from a recently constructed home was used to design the house, and its Title 24 energy performance was compared with the baseline old home and old home with energy saving upgrades.The following energy upgrades were applied to the home individually and in combination with one another, and evaluated in terms of performance and cost effectiveness:

Measure Improvement Construction Cost
Window film Windows: R 1 -> R 5 1-2 years
Air sealing Infiltration: 1 ACH -> 0.6 ACH 1-2 years
Insulation Wall: R5 -> R15 Roof: R15 -> R40
1-3 years
For each case, energy performance, cost savings, and construction cost were estimated. The cases above have been chosen in order to illustrate the impact of small changes that can be easily carried out, and their combined impact if all are implemented. As seen in the chart below, though not all of the following measures are modeled, many are simple to install and/or require very little payback.

Measure Typical difficulty Typical Payback
Seal small air leaks Average homeowner 1-2 years
Insulate water heater Average homeowner 1-2 years
Energy-saving showerhead Average homeowner 1-3 years
Seal large air leaks Skilled homeowner 1-2 years
Seal ducts Skilled homeowner 1-2 years
Thermostat Skilled homeowner 1-2 years
Heating tune-up Expert technician 1-3 years
Ceiling Insulation Skilled homeowner 3-7 years5
5 https://www.xcelenergy.com/staticfiles/xe/Marketing/Files/SmartEnergyGuide.pdf

RESULTS
As expected, many of the improvements we tested were reasonably priced with significant energy savings without too much additional cost. Simply by applying these three measures alone, without changing any appliances or lights, about 30% energy savings are possible. A new house, on the other hand, uses about half of the energy that the old house uses with additional low-cost measures, such as water heater insulation/maintenance, thermostat controls, energy saving showerheads, radiant barriers, and duct sealing.

One key finding evident from these figures is the significance of labor costs relative to material costs. With the exception of window film, the majority of costs in all cases was the labor component. This is especially true for sealing leaks, which has an extremely low material cost.
Energy Assistance Programs
Name Sponsor Benefits Requirements San Joaquin County Weatherization Program
San Joaquin County Human Services Agency
Free weatherizations - measures include insulation, repairs, improved appliances, etc.
A member of the household receives temporary Aid for Needy Families (TANF), Food Stamps, SSI or SSP, Veterans and Survivors Pension or if the household income does not exceed a certain amount http://www.benefits.gov/benefits/benefit-details/1844
Energy Savings Assistance Program
PG&E Repair or replacement of refrigerators, furnaces or water heaters, insulation/ caulking, lighting, showerheads, etc
Home 5 years or older, meets CARE guidelines http://goo.gl/8zvcu3 Valid through May 2015
Energy Upgrade California - whole house
PG&E Up to $2500 in rebates PG&E Customers with single family homes Choose measures from a menu of options
Appliance rebates
PG&E Depends on the appliance
Purchase of Energy Star or approved appliance
Energy Efficiency Financing Options
Program type Pro Con
PACE (HERO, Figtree) Approved in Stockton No upfront cost- pay with additional property taxes Vetted contractors (3 in Stockton) Choice of payback (5/10/15/20 years)
Higher property tax bills Must pay property tax (ineligible to renters)
On-bill financing No upfront cost - pay using portion of energy savings Financing can stay with the property
Not available Risk for utility if bills are not paid
Loan (i.e. from the Golden State Finance Authority)
Up to $50,000 financing, 6.5% interest for 15 yr loan Partner with approved contractor
Only one Stockton based contractor No flexibility for

http://www.chfloan.org/programs/energy/overview.shtml
loan length
Crowdfunding (VillagePower Finance, Mosaic, Kickstarter)
Community buildingMore flexible Sense of ownership
Requires strongcommunity partner
STAKEHOLDER ANALYSIS
The table below outlines some of the key considerations of the main stakeholders affectedby or driving energy efficiency.
Group Goals Barriers Current State
Residents(renters and landlords + homeowners)
Affordable energy bill Comfortable and healthy home
Low maintenance
Working during daytime Upfront cost Landlord/renterrelationship, disconnect in incentives
Poor housing stock
Limited idea of energy incentive availability
Utility
Provide reliable energy supply Customerrelations Comply with regulations
Difficulty reaching residents Not trusted bycommunity Funding programs- costly
Limited community presence (uses contractors and partners)
Community Groups
Serve community Have enoughresources to do so
Limited network of nonprofits
Limited resources for large projects
Church community strong
Contractors
Consistent work Increase # jobs Customer
Business mostly word of mouth - need goodreputation
Many affiliated with PG&E or PACE

relations
Bank orLender
Return on investment Social Responsibility
Unclear payback times - each housedifferent Many small borrowers to keeptrack of
See table above on financing options Banks currently not very engaged
Potential partnership with credit union
DEMONSTRATION HOME CASE STUDIES
Center for Sustainable Engagement and Development
New Orleans, Louisiana
This proposed demonstration home, educational center, and office for the CSED began soliciting funding through Kickstarter in 2014. The house is a refurbished 100-year-old historical home, now converted into a 6
demonstration home with windows into energy efficient construction elements and a community garden. While there are limited updates on the center’s current status, this project is especially fascinating because it also aspires to bring the neighborhood together rather than simply serving as a museum. The organization provides simple home energy retrofits, blight restoration, and home improvement, while also promoting community gardens and wetland sustainability.
Demonstration Home
Chula Vista, California
On the other end of the spectrum, the Chula Vista demonstration home is simply a modified house with tours. With that said, this simplicity can be effective, as 25% of tour participants were inspired to sign up for an energy assessment with a contractor after the tour. 7
6 https://www.kickstarter.com/projects/312337143/the-center-a-sustainable-historic-house/description 7http://energy.gov/eere/better-buildings-neighborhood-program/innovative-home-tours-help-homeowners-understand-energy

SDG&E Energy Innovation Center
San Diego, California
While the Energy innovation Center isn’t a home (rather, it is a renovated grocery store with double LEED certification), it provides a valuable resource for both homeowners and businesses seeking energy efficient solutions . Features include 8
the building itself, smart home, interactive displays, demonstration kitchen, produce garden, and solar parking . Key services include tours, 9
seminars, and a library with books and tools. While the center highlights technologies that are out of reach for many residents in its focus on the cutting edge rather than affordability, it remains useful as a demonstration and an inspiration/resource for residents hoping to improve their home energy use.
Ecoworks Center
Detroit, Michigan
The Ecoworks Center is similar in some respects to the CSED in New Orleans, as it is also an energy efficient home for the nonprofit Ecoworks and the community. Key programs include education, social enterprise, job training, consulting, and policy advocacy . Environmental 10
sustainability, economic empowerment, and job training are key priorities of the organization, and these three tenants (Eco(nomy) + Work) are what its name is based upon. Two programs in particular include the Youth Energy Squad, which works with schools to improve energy use and add STEM programming, and the incubation of the social enterprise Reclaim Detroit, which salvages material from blight redevelopment projects and sells them as furniture or housewares. As for the building itself, it is a state-designated energy demonstration center that offers tours.
8 http://www.sdge.com/eic 9http://www.sdge.com/newsroom/press-releases/2012-07-23/sdge-hosts-70-middle-school-teachers-green-boot-camp 10 http://warmtraining.org/wordpress/home/

POTENTIAL FOR DEMONSTRATION HOME IN SOUTH STOCKTON
Retrofitting and operating a demonstration home may be a useful way to tackle many of the barriers discussed during the stakeholder analysis. The overall vision for such a home in South Stockton would be to be a community center bringing people together to improve their homes and household well-being, with a physical demonstration of how it can be done. Ideally the house would be old and inefficient but still functioning so that the transformation can be economically feasible.
One disclaimer: for an endeavor like this to succeed, it is necessary to have the backing or ownership of a dedicated group of people, perhaps in an existing or newly formed community group. This upgraded house could play a natural role as an office for the group and home base in the neighborhood. Additionally, some funding is necessary to get a project like this off its feet - a crowdsourcing effort like the CSED in New Orleans may be one approach, while sustaining the house and its programs will require strategic partnerships with companies, e.g. PG&E.
One especially useful resource would be access to shared and/or subsidized resources, such as caulk guns, insulation rolls or blowers, window film squeegees, and safety equipment, as well as non-efficiency related home improvement supplies. Considering the substantially lower cost of materials versus labor, as well as the inability of many residents to be home during working hours for contractors, this seems like a potential solution to meet the needs of those interested in making basic home improvements. At the same time, contractors interested in building relationships with residents can assist with training and the easier upgrades so that they are the first to call when residents want further efficiency upgrades.
Finally, while this would ultimately be up to the party managing the demonstration home, effective programming will be necessary to serve community needs and attract visitors. An
element of fun would make the center more attractive for children and adults, especially with interactive exhibits and hands-on experience. Using programming, such as job training and youth programs, to serve other existing community needs is also essential. There are a wide range of opportunities to build energy through a center like this, and finding one that is congruous with the needs of the neighborhood and the goals of the organization is a worthwhile challenge.
CONCLUSION
The simplified model detailed above, while not perfect, demonstrates that many home energy retrofits are within reach, especially if carried out by the homeowner. Though a targeted analysis is still necessary for effective efficiency upgrades, older houses may share many of the same problems, and may actually be similarly responsive to these improvements.
Two of the key challenges identified during the community engagement included the inability of residents to pay for long-term savings upfront, and the lack or ineffectiveness of communication regarding potential efficiency opportunities. The disconnect in incentives between renters and landlords is strong, especially given the prevalence of “slumlords” and the shorter term mindset that typically comes with renting rather than buying a home. Unfortunately, a program that addresses both this and the high upfront costs does not currently exist in Stockton - PACE programs require home ownership, while rebates don’t eliminate first costs. PG&E does have a fairly comprehensive outreach strategy for its low income energy savings assistance (ESA) program, but it has yet to fully reach its audience. These include some elements of Community Based Outreach, which uses local community networks to encourage participation in efficiency programs, and holds promise in building trust and reaching previously unreachable audiences . 11
As a means to bridge the cost and outreach barriers, while meeting other needs, a demonstration home may be a promising approach. While far from the easiest solution, with sufficient drive, an aging and inefficient house can be transformed into a home for a community group, and a center for the neighborhood, supporting both electrical energy as well as the people’s. Partnerships with other community groups or churches, companies, and existing institutions such as the Energy Training Center and Venture Academy could be extremely valuable for educational, job training, and outreach purposes. This has great potential for overlap with the Airport Way and CSU proposals (see later sections) - a community garden, youth programs, and workshops can bring energy and life to the center.
11 http://web.mit.edu/energy-efficiency/docs/theses/mcewen_thesis.pdf
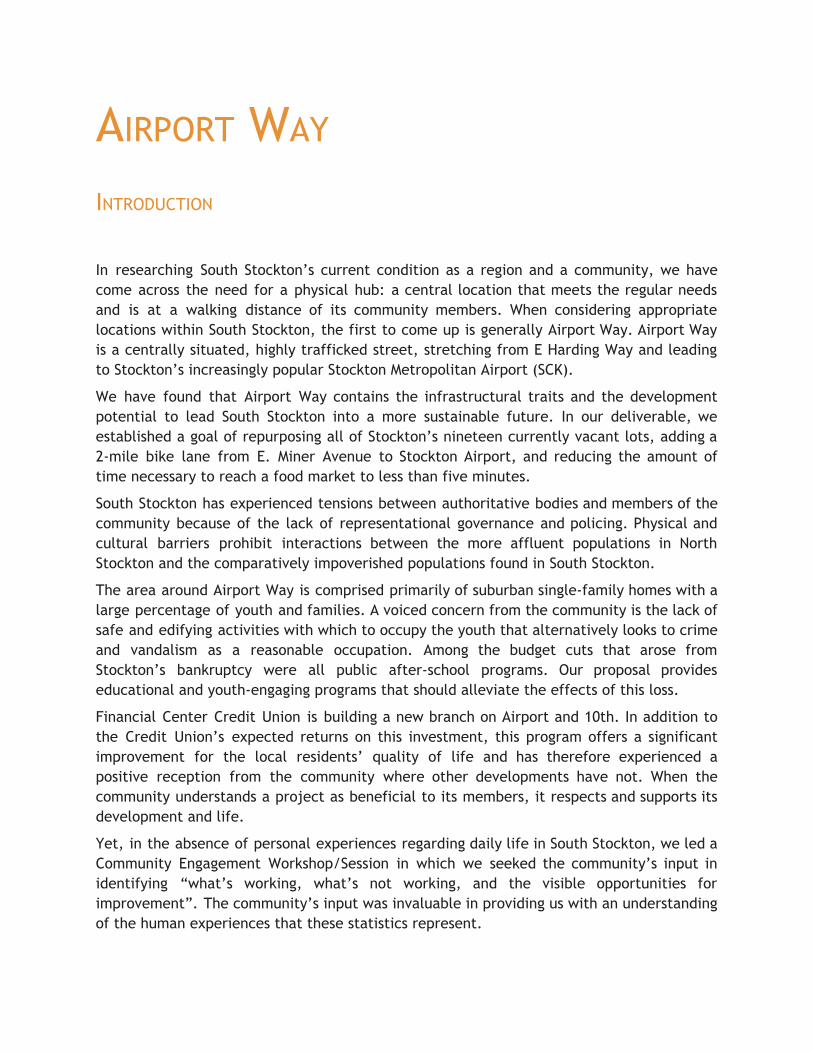
AIRPORT WAY
INTRODUCTION
In researching South Stockton’s current condition as a region and a community, we have come across the need for a physical hub: a central location that meets the regular needs and is at a walking distance of its community members. When considering appropriate locations within South Stockton, the first to come up is generally Airport Way. Airport Way is a centrally situated, highly trafficked street, stretching from E Harding Way and leading to Stockton’s increasingly popular Stockton Metropolitan Airport (SCK).
We have found that Airport Way contains the infrastructural traits and the development potential to lead South Stockton into a more sustainable future. In our deliverable, we established a goal of repurposing all of Stockton’s nineteen currently vacant lots, adding a 2-mile bike lane from E. Miner Avenue to Stockton Airport, and reducing the amount of time necessary to reach a food market to less than five minutes.
South Stockton has experienced tensions between authoritative bodies and members of the community because of the lack of representational governance and policing. Physical and cultural barriers prohibit interactions between the more affluent populations in North Stockton and the comparatively impoverished populations found in South Stockton.
The area around Airport Way is comprised primarily of suburban single-family homes with a large percentage of youth and families. A voiced concern from the community is the lack of safe and edifying activities with which to occupy the youth that alternatively looks to crime and vandalism as a reasonable occupation. Among the budget cuts that arose from Stockton’s bankruptcy were all public after-school programs. Our proposal provides educational and youth-engaging programs that should alleviate the effects of this loss.
Financial Center Credit Union is building a new branch on Airport and 10th. In addition to the Credit Union’s expected returns on this investment, this program offers a significant improvement for the local residents’ quality of life and has therefore experienced a positive reception from the community where other developments have not. When the community understands a project as beneficial to its members, it respects and supports its development and life.
Yet, in the absence of personal experiences regarding daily life in South Stockton, we led a Community Engagement Workshop/Session in which we seeked the community’s input in identifying “what’s working, what’s not working, and the visible opportunities for improvement”. The community’s input was invaluable in providing us with an understanding of the human experiences that these statistics represent.

The function of this deliverable will therefore be to combine the research and analysis we have performed with the community’s take and a selection of relatable case studies to develop a reasonable proposal that will meet the needs of the community while appealing to those in positions of power.
Strategy Along Airport Way Based on our past research and responses from the RSSC Community Survey as well as our Community Engagement Session, we found that South Stockton would benefit immensely from basic infrastructure and business development as well as more community amenities. While currently representing the general blight and overlooked nature of the area, the empty lots along Airport Way are perfect starting points for large scale change. Because Airport Way is currently a busy throughway street connecting South Stockton to the rest of Stockton, the empty lots offer ample opportunity for commercial development to capitalize on the passing traffic that otherwise speeds through while serving the community at large. Because Airport Way is currently vastly underdeveloped, potential developers claim that South Stockton lacks the market for successful business, which largely ignores the impact of passing traffic. Rancho San Miguel is just one attestment to the untapped markets along Airport Way, and hopefully the new Credit Union will further demonstrate the potential within an often overlooked community. However, development along Airport Way clearly needs more incentive to get started, and the community can help catalyze that process while also using the lots as assets and solutions to widespread resident needs. With this in mind, we approach Airport Way with long term and short term goals and see how those can coalesce to best facilitate a natural progression of development. In the long term, we consider what a fully developed Airport Way would ideally look like and how it connects to the surrounding community as well as Stockton at large. On a more immediate scale, we consider how to most effectively use the assets that already exist to benefit the community now while creating a framework that encourages and initiates sustained progress in the long term.

Program distribution map

MASTER PLAN
Master plan with potential volumes of structures and program division

SHORT TERM: TEMPORARY USE CONCEPT Incorporating temporary structures and uses into vacant lots along Airport Way can act as a catalyst to promote growth and vitality in South Stockton. Though currently ignored, the empty lots along Airport Way offer many opportunities for immediate as well as long-term innovation and development. In particular, a focus on community based and initiated programs and activities will both enliven the area and give residents more spaces to gather and call their own, thus producing immediate results while priming the area for more established uses later on. Farther into the future, each function can be filled with a more permanent structure or program, but prototyping those uses on a smaller scale will help them develop and blossom during the planning phases for long term solutions. From our research and talking with residents at the Community Engagement Session, the empty lots along Airport Way should be resources rather than deterrents in the community that can serve as hubs of activity both for residents and passersby. Since Airport Way is currently underused and not frequented even by locals, temporary structures and programs can serve as a low-stakes means to attract more activity and bring the community into those spaces. Youth especially need more safe places to go after school for educational and physical engagement, so ideally each design can serve the community as a whole with special attention towards youth empowerment. Another common complaint and addressable need in the community is the lack of access to food, especially fresh vegetables. Though not even a full grocery store, Rancho San Miguel remains the largest food market for miles. In a largely walking community, residents’ diets are dictated largely by the limited options available, which lack affordable fresh produce. Given the favorable climate and surrounding agricultural success, home-grown food could be an incredible supplement for the community at large. Community gardens offer a glorious marriage between practical and affordable food supplementation, community enhancement, and educational engagement that also provide beautiful open space that residents themselves manage and value. Keeping these drivers in mind, we are considering the following potential temporary uses along Airport Way: ● Community Garden(s): for residents that also include an educational element collaborating with schools to engage and expose students to affordable, nutritious food ● Farmer’s Market space in/near community garden ● Tool Sharing/Fix It Center: space for tools to be used by community and days to bring items to be fixed ● Flea Market/Trading Center ● Art Display and Creation Space

Benefits of Gardening for Children Research shows that gardening provides an array of engagement and educational opportunities for children “including designing, planting and maintaining gardens; harvesting, preparing and sharing food; working cooperatively in groups; working cooperatively in groups; learning about science and nutrition and creating art and stories inspired by gardens” (Yost). Research-proven benefits include: ● Lifelong benefits from interactive knowledge of healthy foods, outdoor physical activity, and positive social interactions ● Positive social and interpersonal skills gained from bonding through communal effort ● Community growth ● Healthy eating habits and hands on nutritional education ● Increase in science achievement and positive attitude towards learning ● Higher self-efficacy and enhanced environmental stewardship and value ● Opportunities for special populations including children with learning disabilities and juvenile offenders to engage in positive cooperative effort

Volumetric Representations
City Funding Under protection of chapter 9 of the federal bankruptcy code, the city of Stockton has a balanced budget in the size of $632,564,874, of which is 22% planned for utilities, following with 17% for police, as it can be seen in pie chart below.
City Budget Distribution

Under its current budget plan, Stockton allots 3% ($21.6 million) to economic development and a mere 1% to community development. This represents a great challenge for our design efforts.
The five-year Capital Improvement Program (CIP) cost projections for fiscal years 2014-19 total $738 million of which $81.5 million is proposed in the FY 2014-15 Annual Budget. However, of this amount only $2.775 million or 0.4% is funded from the General Fund. The CIP budget for next year is almost entirely made of transportation and utility improvements. These categories count for the majority of the five year CIP project list as well. This is reflective of the poor condition of the General fund and the lack of new development mitigation fees. Included in the five year plan are projects totalling $347 million which have identified funding sources and $391 million with unidentified funding sources. This latter amount represents improvements that are needed but cannot be funded at this time. Capital improvements funding sources include city funds, federal/state funds, sales tax measure K, city enterprise funds, public facility fees, and other revenue (e.g. boat launching facilities).
Cost Estimations
“The total cost estimation for each proposed lot development includes the cost of direct construction, the cost of site development (e.g. sidewalks, underground utilities), indirect costs (e.g. marketing, managements, insurance, financing, and closing costs), and permit fees. Doug Davis, Principal Architect at WMB Architects, provided us with the direct construction and site development cost rates of the Federal Credit Union project as comparable rates. We use the City of Stockton permit fee estimator to calculate permit fee. The Economic Impact Study of the Proposed Housing Development in Stockton, California, approximates $62,706 in soft costs for a 2,070 Foot New Home. We will use this same relationship to approximate our soft costs.
It is also worth mentioning that these are city-owned lots thereby eliminating land costs.
Environmental Conditions We have proposed three fairly large green spaces, ranging between 2500 to 4500 sqft. The proposed green spaces lie on currently paved lots. Depavementation is a relatively simple process. Given our interest in involving the community as much as possible with the revitalization of Airport Way we proposed to have the community involved in the depaving of these three lots. The simplest approach would be two rent a Skidsteer or Bobcat with breaker attachment. Home Supply, a tool rental shop about 3 miles north of our site rents Bobcats at $235.00 per day and attachable Breaker for an additional $140.00 per day. We will allocate one day per lot and given the Stocktonite familiarity to construction, hope to engage the community in the physical labor required.

Potential Partnerships: KaBOOM! KaBOOM strives to bring play to more communities around the United States through community-built playgrounds. As a nonprofit, they partner with companies such as Disney and Snapple to help communities fund and eventually build playgrounds often coupled with community gardens. Their main initiative, Build it with KaBOOM, provides selected communities with most of the funding and full logistical support to plan a playground in two months and build it together as a community in one 6 hour Build Day. KaBOOM also has a variety of Build it Yourself grant options that offer some financial support - often through a match program - and basic logistical assistance from KaBOOM staff while the applicant community decides the timeline and organizes the playground construction.
In either scenario, a partnership with KaBOOM is an incredible opportunity for the community to unite towards a common goal and build something together. The program itself provides a cohesive infrastructure for other community-initiated projects as well as access to other resources and contacts that can help in future endeavors.

SELECTED EXAMPLE PROJECTS
Temporary Use Concept
Temporary structures can serve as immediate, interchangeable amenities initiated from within the community that also increase resident interactions and provide useful programs on the many empty lots along Airport Way. Home Depot sheds and shipping containers offer immediate opportunities to construct temporary programs such as tool and supply support for a community garden, weekend flea markets, or community art creation and display spaces. Shipping containers can even be stacked and connected into larger buildings or even play structures.

Community Built Design
Another alternative is a community-built structure on a trailer chassis. The simple construction using 2x4s and plywood could easily be built by community members in a day and offer an opportunity for community engagement while the structure is assembled. A self-constructed structure would give a greater sense of agency and ownership to community members that would hopefully induce respect and appreciation for the shared space. Plus, the same basic construction can serve any purpose, filling the interior program with tools, art, educational programming, etc. Eventually, the temporary programs will be replaced by more permanent structures filling a similar function. However, the ease of construction, accessibility, and mobility of

temporary structures allows them to be quickly organized by and for the community without waiting on months of planning, paperwork, permits.
Community Center Project In response to the feedback received at our Community Engagement Sessions, we have included a Community Center Project in our Airport Way Development plans. The residents we spoke to longed for a centrally located recreational space for its underserved community members. Due to the local economic crisis, public school after-school programs have been cancelled, leaving schoolchildren of all ages without particularly edifying activities to pursue outside of school hours. Soccer and basketball are sports of great and growing popularity among the young population. Families of children interested in sports must purchase memberships to sports clubs at least a mile away. Our workshop participants highlighted the dangerous route young children must walk through to reach these sports clubs. Our community center proposal aims to meet these needs and potentially cater to this market.

Community Center Floorplan with Site
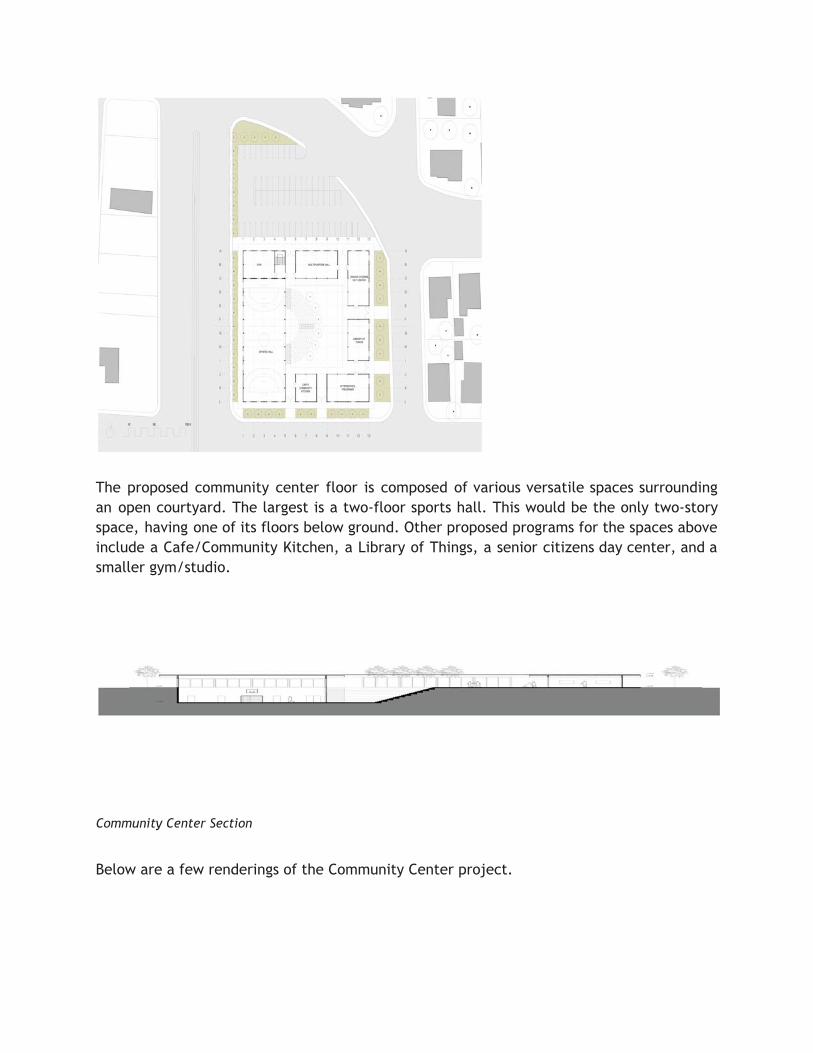
The proposed community center floor is composed of various versatile spaces surrounding an open courtyard. The largest is a two-floor sports hall. This would be the only two-story space, having one of its floors below ground. Other proposed programs for the spaces above include a Cafe/Community Kitchen, a Library of Things, a senior citizens day center, and a smaller gym/studio.
Community Center Section Below are a few renderings of the Community Center project.

Interior Rendering
Community Center Courtyard, night

Community Center Courtyard, evening
Community Center Amphitheater
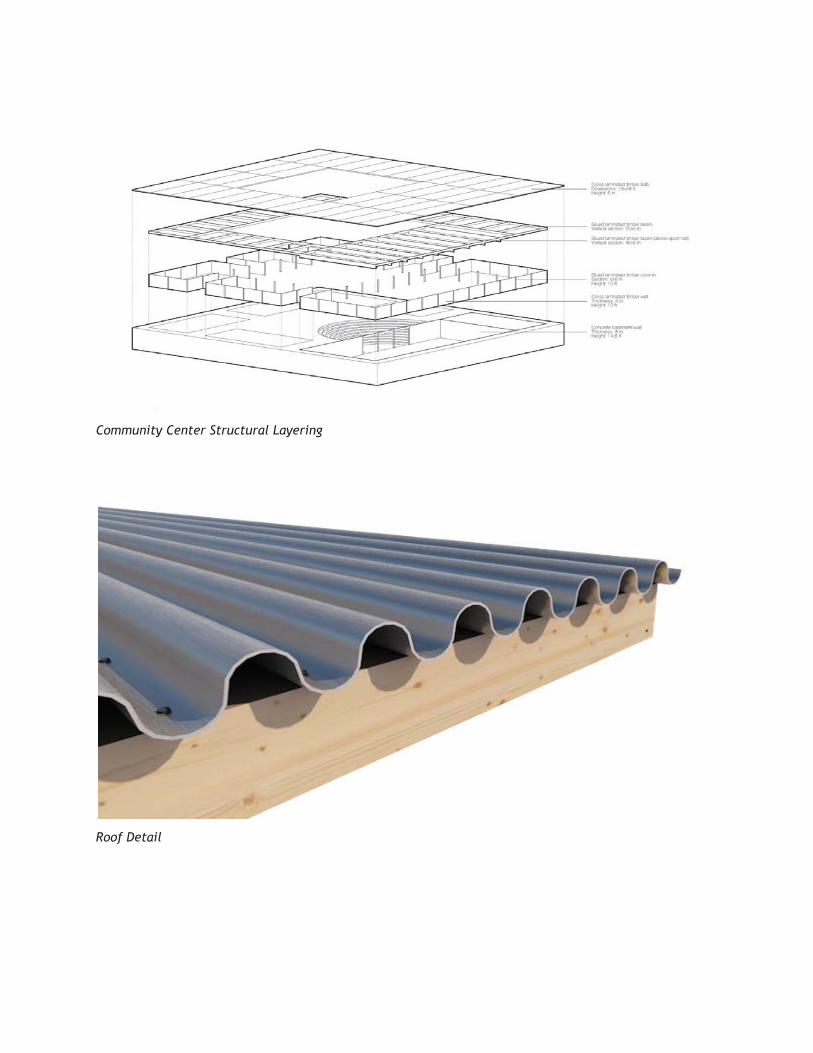
Community Center Structural Layering
Roof Detail

Pedestrian Friendly Crosswalk
Corner View

CSU STOCKTON INTRODUCTION
Stockton is the largest metropolitan area in California without a public university. Stockton does have multiple higher education institutions, like the University of the Pacific (UOP), a well-regarded private university, and the San Joaquin Delta College (SJDC), a community college, but no CSU. Both Sacramento State and CSU Stanislaus, the two closest CSUs, are about an hour away from Stockton by car, as can be seen in the figure on the right. This commute back and forth can be draining for students, who can otherwise use this time and effort to focus on their studies. Having a CSU in Stockton would not only make it easier for students to go to school, and potentially save money by living at home, but it would also serve as a source of pride for the city. During the community engagement activity held on February 7th with the help of the RSSC, Hector, one of the members with the RSSC, noted how having a physical campus in the city would serve as a psychological role in reminding parents and students alike the usefulness of higher education. Indeed, the physical presence of the university could serve as motivation for students to go to a university that they see every day and makes the goal of going to college much more tangible. Similarly, having a CSU in Stockton would have a significant economic impact. For example, CSU Stanislaus has an annual spending of around $150.2 million, which generates around $169 million for the regional economy and around $269 million for California’s economy . 12
This impact translates to supporting more than 2000 jobs in the region and around $8 million in local tax revenues. These positive results greatly benefit Turlock, the home of CSU Stanislaus, which has a population of around 70,000. Imagine the potential benefits for a city with more than quadruple the population of Turlock. Having a CSU in Stockton will also help mitigate the ‘brain drain’ that happens when the students go to other cities for higher education and do not come back to Stockton.
12 http://www.calstate.edu/impact/campus/stanislaus.html

URBAN ANALYSIS
With regards to possible locations for CSU Stockton, we looked at four sites and weighed the pros and cons of each location. We narrowed it down to two sites: the MLK and Highway 99 site and the North Stockton site. The benefits and issues are discussed below and also within our decision matrix. The two campus maps also show where we envision the location and orientation of the buildings of the main campus would be. With regards to the size and costs of CSU Stockton, we used CSU Stanislaus as our model for determining the necessary space for the campus, as we expect CSU Stockton to be more similar to Stanislaus than Sacramento State. The current number of full-time students at CSU Stanislaus is around 8900 full-time students, with a capacity of 12,000 full-time students, and the corresponding land usage was found on the master plan. The campus of CSU Stanislaus is around 228 acres, with more than 50% of those acres left as open space . 13
Since the space in the chosen lots is limited, we plan to have CSU Stockton built in phases. Phase 1 would accommodate 10,000 full-time students, and Phase 2 would accommodate the anticipated growth. Using CSU Stanislaus as a reference, CSU Stockton at its maturity should have around 35,000 students. This number was calculated using a ratio of Turlock’s population compared to Stockton’s population.
MLK / Highway 99 Campus Plan
13https://www.csustan.edu/sites/default/files/FS/Publications/PhysicalMasterPlanUpdate/8-CampusMasterPlanFinalNarative.pdf

As can be seen in figure above, the proposed campus in the MLK / Highway 99 site is laid out in a radial fashion, with the parking and administration near the top. The instructional classrooms take up the middle, with the dorms to the south. The green belt that stretches to the bottom with the library is meant to serve as a green park pathway between the campus and the southern residential area, connecting it with South Stockton. The belt would have biking and walking paths, picnic areas, and other recreational spots. The benefits of this location are that it is centrally located, close to residential areas, and the lot currently has no coherent use, besides the house in the middle. To address the issue of the house, the alternative campus design seen in the figure below leaves the house intact, while also condensing the various building functions. This alternative location also has green belts going across the city, to better integrate it with the rest of the city, like how the left belt could go to downtown and the waterfront. Another drawback is that there is not much room for expansion, as this proposed campus design is for supporting the maximum capacity of Phase 1.
MLK / Highway 99 Alternative Location

MLK / Highway 99 Alternative Location integration into the city by existing green belt
North Stockton Location

The North Stockton location seen in the figure above is ideal in that there is a lot of room for expansion to the right, as the lots are empty and CSU Stockton’s student population is expected to increase steadily. This location also has a green belt, but it does not connect it to other parts of the city. The green belt just serves as a temporary boundary for Phase 1 of the campus. The area is safer than the MLK site, due to its location in North Stockton. However, the location is removed from the rest of the city, and we envision the focus of CSU Stockton to help out South Stockton. As many existing higher education facilities already are situated in central / north Stockton, we want to ensure that this public university is geared toward those who cannot go to the other universities within Stockton. Also, the accessibility of this location is not ideal, in that it can only be reached by car, with no transit options nearby. The corresponding table, seen below, is the decision matrix with which we used to pick our locations within Stockton. We started off with four locations, and narrowed it down to two for our final report. We took into consideration factors like the size of the available land, whether it was accessible via public transit, and if there was adequate room for expansion. The factors are ranked by their importance in the order they appear on the table, with the more important ones being closer to the top. In the end, MLK / Highway 99 and the North Stockton location both had six +’s, whereas the other two locations only had 3 +’s each.
Location 1: MLK + H99
Location 2: Airport Way
Location 3: R4 + FW5
Location 4: North Stockton
Location + - o o
Accessibility + - + +
Size o + + +
Public transport - + + +
Surrounding areas + - o o
Safety o o - +
Infrastructure + o - o
Place for expansion
o + o +
Nearby residents + - o +
Close to services + o - o
Decision Matrix of Four Locations

(+ means good, o means neutral, - means bad / parameters that are higher are more important)
One issue that all the sites share is the limited amount of space available for the campus and future expansions. Most of the other CSUs when they were established did not face this problem, because they tended to be established first, and then the community would coalesce around the university, as in the case of CSU Stanislaus. CSU Stanislaus has a campus that is mostly left as open space. In order the maximize the limited space, CSU Stockton could reduce the percentage of open space on the campus. Similarly, the green belts can serve as vital open space without having a sprawling campus. The CSU could also take advantage of nearby parks for open spaces, like how the MLK site is near the county fairgrounds. Maximizing the infill development also serves as a model for the city, as it struggles to promote infill development and deal with urban sprawl.
Instructional GSF 623,482 Instructional GSF / student 51.96 gsf / student
Library 123,319 Library / student 10.28 gsf / student
Housing / Dining 226,292 Housing / Dining / student 18.86 gsf / student
Administrative / Student Services 227,642 Administrative / student 18.97 gsf / student
Other Support 66939 Other Support / Student 5.58 gsf / student
Parking spots 2908 Parking / student 24.23%
# of beds 656 Beds / students 5.47%
(Source: CSU Stanislaus Campus Master Plan, CSU Five Year Capital Improvement Program ) 14
Based on the values found on CSU Stanislaus’s master plan, we calculated the gross square foot per student, as well as the percentage of parking spots and number of beds compared to students. For reference, gross square foot refers to the total square feet of the building, including the mechanical cores and other non-usable areas. Similar to CSU Stanislaus, we expect most of the students at CSU Stockton to be from the city or region, thus minimizing the need for housing on campus. CSU Stanislaus estimates that around 10% of the students live on campus, with the rest commuting to school. CSU Stockton is targeted for the Stocktonians, so housing is not expected to be a priority for the first few years of the university. Thus, using the number of square foot per student from CSU Stanislaus, we can approximate the necessary gross square footage for Phase 1, as well as the necessary parking spots and number of beds. The total gross square footage necessary for the Phase 1 buildings comes out to 1,056,395 gsf.
14 http://www.calstate.edu/cpdc/Facilities_Planning/2014-15-Five-Yr-CapImprovementPgmBk.pdf

Instructional 519,568.33 gsf
Library 102,765.83 gsf
Housing / Dining 188,576.67 gsf
Administrative / Student Services 189,701.67 gsf
Other Support 55,782.50 gsf
Parking spots 2423
# of beds 546.7
Grand total 1,056,395 gsf
CONSTRUCTION BUDGET With regards to the construction budget, we used the CSU’s own estimate for construction costs per gross square foot to calculate the total costs of the necessary structures for the campus.
Construction Costs per GSF for CSUs General Contractor
Costs
Classroom $352 $182,888,052.2
Library $311 $31,960,173.13
Housing / Dining $274 $51,670,007.58
Administration $354 $67,154,391.18
Structure and surface per parking space
$19,278 $46,710,594
Grand Total $380,383,218.1
Including Site Work Site Work assumed to be 3% of building costs $391,794,714.6
(Source: CSU Cost Guide ) 15
Thus, adding up the values in the table above, the estimated total for phase 1 of CSU Stockton comes out to roughly $400 million. This cost estimate is lower than the $450 million recorded in Deliverable 3. The reason for the discrepancy is due to the fact that we
15 https://www.calstate.edu/cpdc/Facilities_Planning/CostGuideforStateandNonStateBuildings.pdf
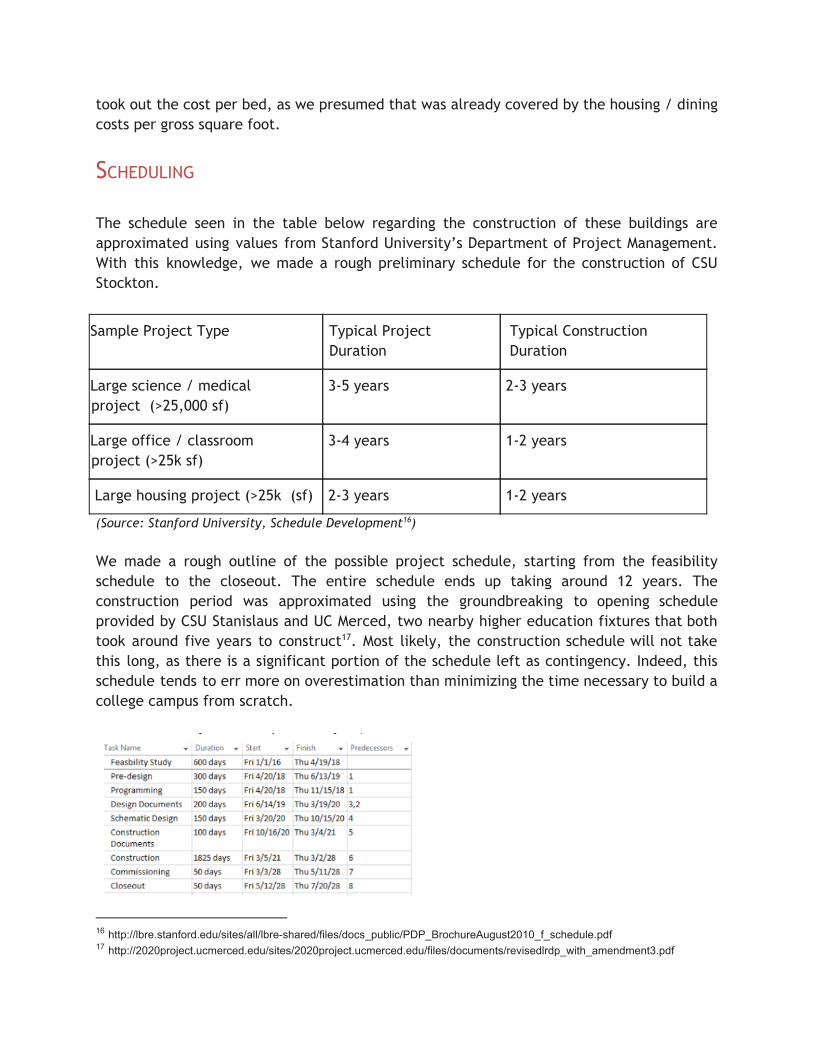
took out the cost per bed, as we presumed that was already covered by the housing / dining costs per gross square foot.
SCHEDULING The schedule seen in the table below regarding the construction of these buildings are approximated using values from Stanford University’s Department of Project Management. With this knowledge, we made a rough preliminary schedule for the construction of CSU Stockton.
Sample Project Type Typical Project Duration
Typical Construction Duration
Large science / medical (project (>25,000 sf)
3-5 years 2-3 years
Large office / classroom (project (>25k sf)
3-4 years 1-2 years
Large housing project (>25k (sf) 2-3 years 1-2 years
(Source: Stanford University, Schedule Development ) 16
We made a rough outline of the possible project schedule, starting from the feasibility schedule to the closeout. The entire schedule ends up taking around 12 years. The construction period was approximated using the groundbreaking to opening schedule provided by CSU Stanislaus and UC Merced, two nearby higher education fixtures that both took around five years to construct . Most likely, the construction schedule will not take 17
this long, as there is a significant portion of the schedule left as contingency. Indeed, this schedule tends to err more on overestimation than minimizing the time necessary to build a college campus from scratch.
16 http://lbre.stanford.edu/sites/all/lbre-shared/files/docs_public/PDP_BrochureAugust2010_f_schedule.pdf 17 http://2020project.ucmerced.edu/sites/2020project.ucmerced.edu/files/documents/revisedlrdp_with_amendment3.pdf

Preliminary Schedule Breakdown
ENERGY CONSUMPTION Another important aspect of the campus is the expected energy usage of the buildings. Using an energy modeling software called eQuest, we were able to come up with rough approximations of the energy usage for the various building uses and for the different locations. eQuest is a free, well-regarded building energy-modeling software used by many in the industry and funded by organizations like the US Department of Energy. The assumptions are noted in the parentheses with each table.
MLK Highway 99 Classroom Electricity Natural Gas
Yearly Energy Usage 419,660 kWh 3302 therms
Bill $62,792 $1988
Total Bill $64,780
(12 buildings without expansion, 90% occupancy load, 70 ft by 210 ft, Mon-Fri, 8 am - 9 pm, 15 ft floor to ceiling height, steel construction)
MLK Highway 99 Housing Electricity Natural Gas
Yearly Energy Usage 181,200 kWh 0
Bill $26,929
Total Bill $26,929

(8 dorms without expansion, 90% occupancy load, 70 ft by 110 ft, 10 ft floor to ceiling height, wood construction, electric resistance heating)
MLK Highway 99 Administrative Electricity Natural Gas
Yearly Energy Usage 520,850 kWh 2061.8 therms
Bill $86,276 $1305
Total Bill $87,581
(Administrative: 60 ft by 265 ft, 4 buildings without expansion, 8 am - 5 pm, weekdays, 90% occupancy, 10 ft floor to ceiling height, steel construction)
MLK Highway 99 Library Electricity Natural Gas
Yearly Energy Usage 1,200,800 kWh 10,179 therms
Bill $195,832 $5748
Total Bill $201,580
(Library: 70 ft by 475 ft, 1 building, 8 am - 5 pm, operating everyday except holidays, 90% occupancy, 12 ft floor to floor height, steel construction)
Total Energy Bill (MLK Highway 99) Electricity Bill Natural Gas Bill
Housing $215,432 $0
Classroom $753,504 $23,856
Administrative $345,104 $5220
Library $195,832 $5748
Total $1,509,872 $34,824
Grand Total (per year) $1,544,696
North Stockton Classroom Electricity Natural Gas

Yearly Energy Usage 817,310 kWh 6018.2 therms
Bill $121,398 $3483
Total Bill $124,881
(Classroom: 6 buildings, 90% occupancy load, 70 ft by 412 ft, Mon-Fri, 8 am - 9 pm, 15 ft floor to ceiling height, steel construction)
North Stockton Housing Electricity Natural Gas
Yearly Energy Usage 364,060 kWh 0
Bill $53,533
Total Bill $53,533
(Housing: 4 dorms, 90% occupancy load, 70 ft by 225 ft, 10 ft floor to ceiling height, wood construction, electric resistance heating)
North Stockton Administration Electricity Natural Gas
Yearly Energy Usage 1,081,600 kWh 3341.2 therms
Bill $175,767 $2005
Total Bill $177,772
(Administrative: 60 ft by 525 ft, 2 buildings, 8 am - 5 pm, weekdays, 90% occupancy, 10 ft floor to ceiling height, steel construction)
North Stockton Library Electricity Natural Gas
Yearly Energy Usage 1,200,800 kWh 10,179 therms
Bill $195,832 $5748
Total Bill $201,580
(Library: 70 ft by 475 ft, 1 building, 8 am - 5 pm, everyday except holidays, 90% occupancy, 12 ft floor to floor height, steel construction)

Total Energy Bill (North Stockton) Electricity Bill Natural Gas Bill
Housing $214,132 $0
Classroom $728,388 $20,898
Administrative $351,534 $4010
Library $195,832 $5748
Total $1,489,886 $30,656
Grand Total (per year) $1,520,542
The total energy consumption of the MLK / Highway 99 and the North Stockton location differ by around $20,000, meaning that even with different locations and building orientations, the energy consumption is similar for both campus. It shows that the methodology is consistent for measuring the energy emphasis.
Cross-sectional view of the classroom (left) and administration (right). We also made some architectural sections for the buildings, as seen in the figures above, to determine the spaces within the building. For the classroom, we envision a three-story building 70 feet across. On both ends of the building are classrooms 30 feet in length, with a 10 feet long hallway in the middle. Similarly, the administration building is three stories and 70 feet across. The closed offices on either side are 20 feet long, with open offices / hallway in the remaining middle 30 feet.
PROGRAMS
With regards to the majors and programs to be offered by CSU Stockton, we anticipate it will have similar offerings to CSU Stanislaus. The rough breakdown by major would be: 10% agriculture, 30% arts / humanities / social sciences, 20% business, 10% education, 15% health professionals, 4% law and legal studies, and 11% STEM majors . Another estimation 18
by the San Joaquin Delta College forecasts that the sectors expected to grow in the San Joaquin County include computer networking and computer science, health science, nursing, and sustainability-related majors . Thus, it seems prudent for CSU Stockton to 19
build science and laboratories in future phases to accommodate the expected growth in the healthcare and technology sectors.
BUDGET / FINANCIAL AID The initial financing for a CSU would come from both the state and from the local community. With regards to the structures, only the buildings with direct links to education are funded by the state, like the classrooms, labs, offices, and gyms. Other buildings, like the residence and dining halls, student union, and parking structures, are not funded by the state . These are funded partly by the students through their payments in room and board. 20
After the university is up and running, the tuition and other fees paid by the students will help finance the university as well. The campus budget of CSU Stanislaus for the 2014-15 school year is $96,859,774, which is on the lower side of the statewide CSU budgets . Though we do not have any concrete 21
number for the expected budget of CSU Stockton, we would expect it to be lower than $90 million for the first few years, as it takes root and slowly grows in student population. Financial aid will be important for CSU Stockton. At Stanislaus, 88% of the full-time undergraduates were determined to have a financial need. Of the undergraduates that were determined to have financial need, 91% of them received financial aid . The average 22
full-time undergraduate for the 2010-2011 academic year at CSU Stanislaus has a financial aid package of around $8000, which does not include any private alternative loans. Stanislaus also offers need-based gift awards, with the average amount awarded to undergraduates coming to about $6700. The average need-based loan for a student was around $4300. There were also awards for students who had no financial aid need and still received non-need-based aid, with an average of $1000 given to undergraduates. The estimated percentage of students who borrowed through all of the loan programs is around 18%.
18 https://secure.csumentor.edu/campustour/undergraduate/17/CSU_Stanislaus/CSU_Stanislaus3.html 19 http://www.deltacollege.edu/org/fmp/documents/EDMASTERPLANDRAFTMARCH2010.pdf 20 https://www.calstate.edu/cpdc/Facilities_Planning/Cost_Guide_CCCI_5565_EPI_2928.pdf 21 https://www.csustan.edu/sites/default/files/Budget/2014-15_university_budget.pdf 22 https://secure.csumentor.edu/campustour/undergraduate/17/CSU_Stanislaus/CSU_Stanislaus4.html

The tuition rate for the CSU system is the same: $5472 per academic year for undergraduates enrolled in more than 6 units per term and $3174 for those taking 6 or fewer units . There are also mandatory fees that students must pay that are dependent on 23
the campus. For Stanislaus, the mandatory fees for the 2014-2015 school year are $1214. We expect a majority of the students to utilize financial aid, as the targeted population of Stockton generally is of lower-income. The credit union expected to open along Airport Way can serve as another way for students to finance their education. Generally, credit unions offer personal loans of up to $50,000 with terms up to 72 months, with corresponding higher APR rates based on the duration of the loan . 24
PUBLIC RELATIONS PLAN The idea for a CSU Stockton is important for the city, but the message must also be communicated with the local community. The first step to advocating for a CSU in Stockton would be to raise awareness about the benefits and opportunities that come from having a college degree. Without the residents seeing why higher education is important, the CSU will not be fully utilized by the people it is meant to benefit. As noted earlier in our introduction, having a CSU in Stockton will serve as a tangible model for the community. CSU Stockton would start off attracting local high school students and be primarily a commuter-based institution. CSU Stockton staff could also promote the university by attending college fairs at the local high schools and by informing high school counselors about opportunities at CSU Stockton. The university could also partner with other universities, like UOP and SJDC, to help Stocktonian seniors decide which institution is the best fit for them. The universities could also allow transfer of credit between the schools, which would be beneficial for all involved. For example, UOP students could take summer classes at CSU Stockton, and thus save money, or CSU Stockton students could take high-level science courses at UOP so they can be exposed to STEM fields.
CONCLUSIONS We also looked at how our section linked to the other three topics. For the industry team, having a CSU would help with the internal development of the businesses within the city, with programs like the CSU Study program. To promote environmental resiliency, the CSU could offer majors dealing with sustainability and promote green research. Lastly, the
23 http://www.calstate.edu/budget/student-fees/mandatory-fees/1415-feeschedules.shtml 24 http://www.fccuburt.org/loans-credit/loans/personal-loans.html

establishment of a CSU in Stockton could lead to the long-term development in Stockton, especially in the empty lots along Airport Way. We hope our analysis on the feasibility of a CSU in Stockton will help the decision-makers with giving California’s largest metropolitan area without a public university its own CSU. We understand that the process for creating a new CSU requires much more work, but this will hopefully serve as a baseline for any future studies. There is a current bill in the California State Assembly that would look into the feasibility of a CSU in Stockton, sponsored by Assemblywoman Susan Eggman (D-Stockton). The bill has now been amended to put the role of determining feasibility with the Legislative Analyst’s Office, instead of making a site-specific CSU bill . Thus, instead of looking specifically at Stockton, the bill 25
would call for seeing which part of the state needs a CSU. Eggman believes this impartial analysis will show that Stockton needs a CSU. If Stockton does get chosen to receive a CSU, this preliminary study can hopefully help the researchers with choosing a location.
25 http://www.recordnet.com/article/20150401/NEWS/150409995