Embed Size (px)
Citation preview

NONLINEAR HYDRODYNAMIC FORCES
MANUFACTURE AND TRANSDUCER SELECTION
By Sachindra Max
2010

Overview of the Project
• This experiment is to
understand the fluid
hydrodynamic forces acting
on a floating body.
• This is practically applicable
for borehole oil drilling in
offshore and onshore.
• Properties of Fluids inside
the bore will be able to
measure from this equipment.
2

Overview of the Project
• My main objective was to manufacture the experiment rig and select transducers to it.
• Apart form that I compared the experimental results in different conditions with a theoretically obtained values.
• Methods of multiple scale analysis is used to evaluate the theoretical values.
Experimental Results
Theoretical Values
3

About bore hole drilling
• Bore holes may construct for may different purposes.
• In the Oil and Gas industry bore hole drilling is very important.
• Drilling is divided mainly in to 2 categories.
1. Onshore Drilling 2. Offshore Drilling
4

About bore hole Drilling cont..
• This technology has a history of hundreds years.
• Drilling methods have been developed over the time for different purposes and environments to increase its efficiency.
• Few main drilling types,
I. Auger drilling
II. Air core drilling
III. Cable tool drilling
IV. Diamond core drilling
V. Hydraulic-rotary drilling
VI. Sonic (vibratory) drilling / Resonance enhanced drilling 5

Manufacturing of apparatus
6

Experimental rig – Manufacturing
• The rig is adjusted couple of times to achieve the desired experimental results.
7

Transducer Selection

Transducer Selection – Linear variable displacement transducer
• Linear variable displacement transducer (LVDT) is used to measure the amplitude of the oscillation.
• Change in position vertically of the actuator rod measures the amplitude of the oscillation.
• This device uses the eddy current principle to get the measurement.
• Accuracy of the LVDT used is sufficient enough for the experiment.
9

Transducer Selection – Accelerometer
• Acceleration of the inner cylinder is measured by using this
device.
• Device is connected to a oscilloscope or to a computer software to get the experimental results.
• Fixing this unit to the experimental rig is easy and accuracy is high enough for the experiment.
10

Transducer Selection – Pressure Transducer
• Pressure transducer is necessary to fix to the bottom of the large cylinder to measure the variable fluid pressure due to the impact of the actuator.
• This can be connected to a oscilloscope or to a computer software just like the Accelerometer or LVDT.
• Similarly fluid level can be measured by using the basic hydrostatic pressure equation.
P = hρg
• Suitable transducer for this experiment has a pressure range of 0 – 6 bar
11

Transducer Selection – Vibro impactor
• This device creates the vertical sinusoidal force to vibrate the system.
• The metal bar is placed in a solenoid which creates a magnetic flux according to the current supplied.
• This is a very simple design and it’s the most appropriate for the experiment.
12
Transducer Selection – Motor selection
• Initially experiment rig was supposed to design with a electric motor instead of a vibro impactor.
• Setup of the motor could be done as shown above.
• Main disadvantage of connecting a motor to the experiment is that it can create vibration NOT only vertically but also horizontally.
• Therefore it can create unnecessary friction to the vibrating system.
13

Arrangement of the experimental rig
14

Experimental rig – Signal generation / inputs
• A Sinusoidal current is generated from a signal generator and sent it to the vibro impactor, solenoid of the impactor creates a sinusoidal magnetic flux in the same frequency as the current. Therefore the metal bar will vibrates at the same frequency as the current.
• Amplitude of the sinusoidal motion of the metal bar is varied by varying the supplied voltage from the transformer.
• Best results of the experiment can be achieved by setting the vibrating frequency to 6Hz and voltage to 12v.
Transformer Signal
Generator Vibrating system
15

Experimental rig – Results / data outputs
• Output signals from all the transducers are connected either to a oscilloscope or to a computer.
• Graphical representation of the data can be filtered well only in the computer software.
• Oscilloscope used to show the general idea of the motion graphically.
• Experimental data is taken at different conditions such as with water and without.
• Data is recorded as a function of time from the computer software and then plotted as shown in next slides.
Vibrating system
Transducers Oscilloscope / Computer
16

Data acquisition for various cycles
17

Water damped system with the LVDT : Displacement Vs. Time
18

Water damped system with the Accelerometer : Acceleration Vs. Time
19

Mathematical model for the experimental results
• Experiment rig can be simplified to a simple spring damper system as shown above.
• Springs of the rig will act same and water of the system behave as a damper.
20

Transient motion of the system without water
• Suspended system is lifted up n released manually with a magnetic system and let the system vibrate freely with no external forced applied.
• Equation of the acceleration Vs. time graph of the system can assumed as;
1
• Oscillating Velocity of the system can be obtained by integrating the equation 1
2
21

• Graphical representation of the equation 2
Velocity Vs. time – without water
( in a time interval of 0 – 2 seconds ) 22

• Equation 2 can be integrated once and obtained the displacement Vs. time equation
3
Displacement Vs. time – without water
( In a time interval of 0 – 2 seconds) 23

Theoretical model for the system
24

Method of multiple scales
• This is a perturbation method.
• Duffing equation is used to evaluate the theoretical values.
• This equation can be used to this experiment since it’s amplitude is low and it can be used for water damping systems.
• Duffing equation :-
• This equation does not contain a damping term. There for its modified with an additional damping term.
• Duffing equation with damping term :-
25

Duffing equation • Substitutions;
• After the substitution coefficients of each power of ϵ is separated;
• Solutions for u0 , u1 , u2 obtained.
• u is obtained by substituting u0 , u1 , u2
• Where;
26

Comparison
• Data obtained experimentally and numerically needs to compared.
• Amplitude of the oscillation will be lower in experiment values due to the friction acting at contacting points.
• The values can be compared as shown in the next slide.
27
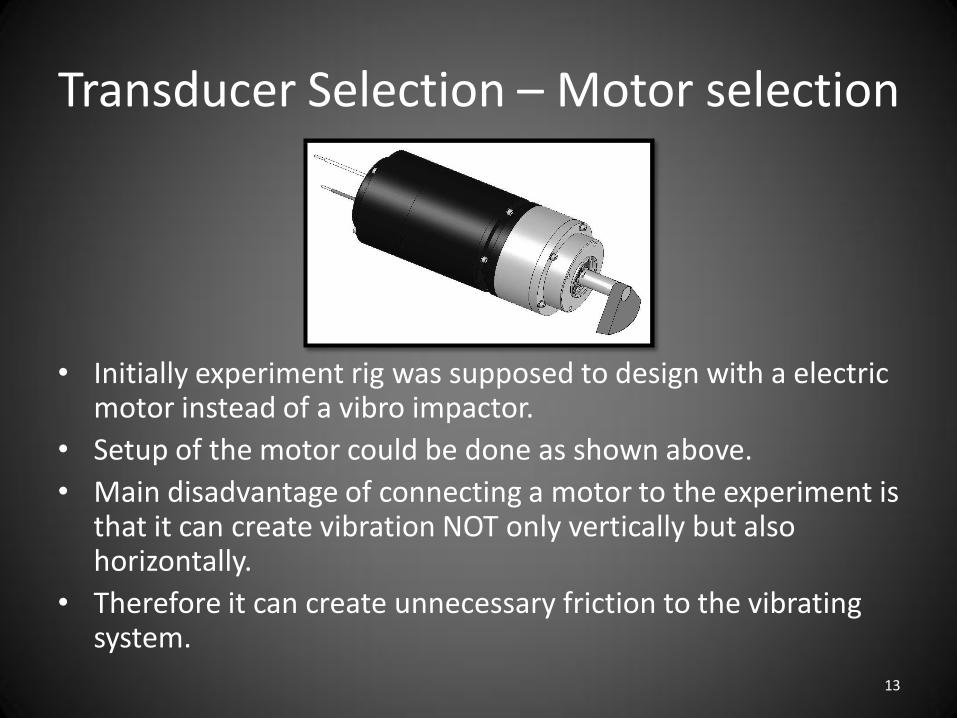
Graphical comparison
Experimental results Theoretical values 28
Conclusion
• Properties of water such as the damping term can be evaluated by comparing the two methods.
• Accuracy of the system can be increased buy remanufacturing some parts. And by using proper rigid connections.
• Experiment rig needs to be modified further for real life applications.
29

Thank you. Any Questions ?
30