Embed Size (px)
Citation preview

Keynote address
The power of learning analytics: a need to move towards new methodologies in education?
EARLI SIG 17, Maastricht, The Netherlands
@DrBartRienties
Reader in Learning Analytics
A special thanks to Avinash Boroowa, Aida Azadegan, Simon Cross, Rebecca Ferguson, Lee Farrington-Flint, Christothea Herodotou, Martin Hlosta, Lynda Prescott, Kevin Mayles, Tom Olney, Jekaterina Rogaten, Dirk Tempelaar, Lisette Toetenel, Thomas Ullmann, Denise Whitelock, John Woodthorpe, Zdenek Zdrahal, and others…A special thanks to Prof Belinda Tynan for her continuous support on analytics at the OU UK

Keynote address
The power of learning analytics: a need to move towards new methodologies in education?
is there still a need for educational research?
EARLI 2017 Tampere, Finland
@DrBartRienties
Reader in Learning Analytics
A special thanks to Avinash Boroowa, Aida Azadegan, Simon Cross, Rebecca Ferguson, Lee Farrington-Flint, Christothea Herodotou, Martin Hlosta, Lynda Prescott, Kevin Mayles, Tom Olney, Jekaterina Rogaten, Dirk Tempelaar, Lisette Toetenel, Thomas Ullmann, Denise Whitelock, John Woodthorpe, Zdenek Zdrahal, and others…A special thanks to Prof Belinda Tynan for her continuous support on analytics at the OU UK


What is learning analytics?
http://bcomposes.wordpress.com/

(Social) Learning Analytics“LA is the measurement, collection, analysis and reporting of data about learners and their contexts, for purposes of understanding and optimising learning and the environments in which it occurs” (LAK 2011)
Social LA “focuses on how learners build knowledge together in their cultural and social settings” (Ferguson & Buckingham Shum, 2012)


Agenda? You choose 1. The power of 151 Learning Designs on 113K+ students at the
OU?2. Analytics4Action: evidence-based interventions?3. OU Analyse: predictive analytics with automated student
recommender? 4. Key drivers for 100K+ student satisfaction?5. Opportunities of learning analytics/elearning for educational
research, teaching practice, and wider policy implications.


Assimilative Finding and handling information
Communication
Productive Experiential Interactive/
Adaptive
Assessment
Type of activity
Attending to information
Searching for and processing information
Discussing module related content with at least one other person (student or tutor)
Actively constructing an artefact
Applying learning in a real-world setting
Applying learning in a simulated setting
All forms of assessment, whether continuous, end of module, or formative (assessment for learning)
Examples of activity
Read, Watch, Listen, Think about, Access, Observe, Review, Study
List, Analyse, Collate, Plot, Find, Discover, Access, Use, Gather, Order, Classify, Select, Assess, Manipulate
Communicate, Debate, Discuss, Argue, Share, Report, Collaborate, Present, Describe, Question
Create, Build, Make, Design, Construct, Contribute, Complete, Produce, Write, Draw, Refine, Compose, Synthesise, Remix
Practice, Apply, Mimic, Experience, Explore, Investigate, Perform, Engage
Explore, Experiment, Trial, Improve, Model, Simulate
Write, Present, Report, Demonstrate, Critique


Method – data sets• Combination of four different data sets:
• learning design data (189 modules mapped, 276 module implementations included)
• student feedback data (140)• VLE data (141 modules)• Academic Performance (151)
• Data sets merged and cleaned• 111,256 students undertook these modules

Toetenel, L. & Rienties, B. (2016). Analysing 157 Learning Designs using Learning Analytic approaches as a means to evaluate the impact of pedagogical decision-making. British Journal of Educational Technology.

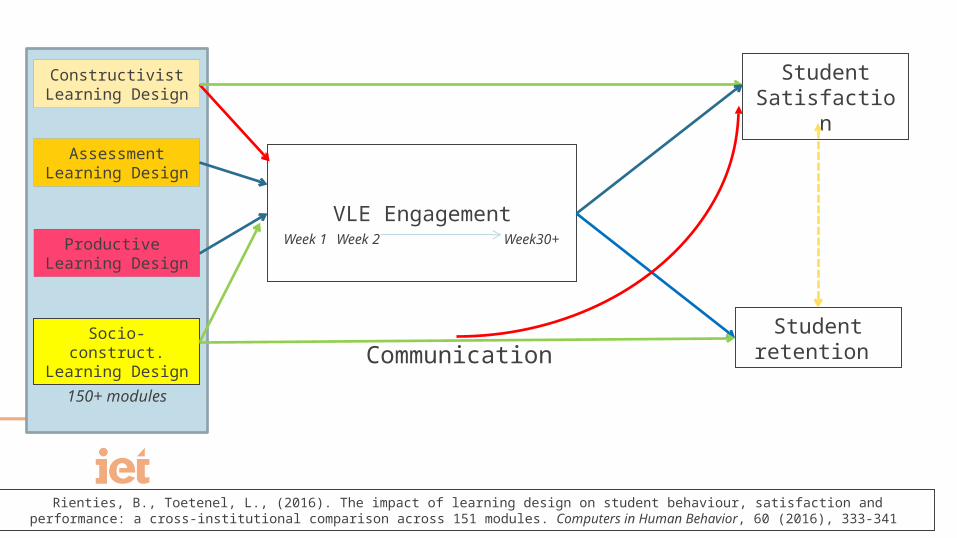
Constructivist Learning Design
Assessment Learning Design
Productive Learning Design
Socio-construct. Learning Design
VLE Engagement
Student Satisfaction
Student retention
Learning Design151 modules
Week 1 Week 2 Week30+
Rienties, B., Toetenel, L., Bryan, A. (2015). “Scaling up” learning design: impact of learning design activities on LMS behavior and performance. Learning Analytics Knowledge conference.
Disciplines LevelsSize module

Average time spent per week in VLE

Cluster 1 Constructive (n=73)

Cluster 2 Assessment (n=10)

Cluster 3 Productive (n=38)

Cluster 4 Social Constructivist (n=20)

Week Assim Find Com. Prod Exp Inter Asses Total
-2 -.03 .02 -.02 -.09 .20* -.03 .01 .35** -1 -.17* .14 .14 -.01 .30** -.02 -.05 .38**
0 -.21* .14 .37** -.07 .13 .08 .02 .48**
1 -.26** .25** .47** -.02 .28** .01 -.1 .48**
2 -.33** .41** .59** -.02 .25** .05 -.13 .42**
3 -.30** .33** .53** -.02 .34** .02 -.15 .51**
4 -.27** .41** .49** -.01 .23** -.02 -.15 .35**
5 -.31** .46** .52** .05 .16 -.05 -.13 .28**
6 -.27** .44** .47** -.04 .18* -.09 -.08 .28**
7 -.30** .41** .49** -.02 .22** -.05 -.08 .33**
8 -.25** .33** .42** -.06 .29** -.02 -.1 .32**
9 -.28** .34** .44** -.01 .32** .01 -.14 .36**
10 -.34** .35** .53** .06 .27** .00 -.13 .35**

Model 1 Model 2 Model 3
Level0 -.279** -.291** -.116
Level1 -.341* -.352* -.067
Level2 .221* .229* .275**
Level3 .128 .130 .139
Year of implementation .048 .049 .090
Faculty 1 -.205* -.211* -.196*
Faculty 2 -.022 -.020 -.228**
Faculty 3 -.206* -.210* -.308**
Faculty other .216 .214 .024
Size of module .210* .209* .242**
Learner satisfaction (SEAM) -.040 .103
Finding information .147
Communication .393**
Productive .135
Experiential .353**
Interactive -.081
Assessment .076
R-sq adj 18% 18% 40%
n = 140, * p < .05, ** p < .01 Table 3 Regression model of LMS engagement predicted by institutional, satisfaction and learning design analytics
• Level of study predict VLE engagement
• Faculties have different VLE engagement
• Learning design (communication & experiential) predict VLE engagement (with 22% unique variance explained)

Model 1 Model 2 Model 3
Level0 .284** .304** .351**
Level1 .259 .243 .265
Level2 -.211 -.197 -.212
Level3 -.035 -.029 -.018 Year of implementation .028 -.071 -.059
Faculty 1 .149 .188 .213*
Faculty 2 -.039 .029 .045
Faculty 3 .090 .188 .236* Faculty other .046 .077 .051
Size of module .016 -.049 -.071 Finding information -.270** -.294**
Communication .005 .050
Productive -.243** -.274** Experiential -.111 -.105
Interactive .173* .221* Assessment -.208* -.221*
LMS engagement .117
R-sq adj 20% 30% 31%
n = 150 (Model 1-2), 140 (Model 3), * p < .05, ** p < .01 Table 4 Regression model of learner satisfaction predicted by institutional and learning design analytics
• Level of study predict satisfaction
• Learning design (finding info, productive, assessment) negatively predict satisfaction
• Interactive learning design positively predicts satisfaction
• VLE engagement and satisfaction unrelated

Model 1 Model 2 Model 3
Level0 -.142 -.147 .005
Level1 -.227 -.236 .017
Level2 -.134 -.170 -.004
Level3 .059 -.059 .215
Year of implementation -.191** -.152* -.151*
Faculty 1 .355** .374** .360**
Faculty 2 -.033 -.032 -.189*
Faculty 3 .095 .113 .069
Faculty other .129 .156 .034
Size of module -.298** -.285** -.239**
Learner satisfaction (SEAM) -.082 -.058
LMS Engagement -.070 -.190*
Finding information -.154
Communication .500**
Productive .133
Experiential .008
Interactive -.049
Assessment .063
R-sq adj 30% 30% 36%
n = 150 (Model 1-2), 140 (Model 3), * p < .05, ** p < .01
Table 5 Regression model of learning performance predicted by institutional, satisfaction and learning design analytics
• Size of module and discipline predict completion
• Satisfaction unrelated to completion
• Learning design (communication) predicts completion
Constructivist Learning Design
Assessment Learning Design
Productive Learning Design
Socio-construct. Learning Design
VLE Engagement
Student Satisfaction
Student retention
150+ modules
Week 1 Week 2 Week30+
Rienties, B., Toetenel, L., (2016). The impact of learning design on student behaviour, satisfaction and performance: a cross-institutional comparison across 151 modules. Computers in Human Behavior, 60 (2016), 333-341
Communication


Toetenel, L., Rienties, B. (2016) Learning Design – creative design to visualise learning activities. Open Learning.


So what does the OU do in terms of interventions on learning analytics?

The OU is developing its capabilities in 10 key areas that build the underpinning strengths required for the effective deployment of analytics
Strategic approach

43


45
Analytics4Action framework
Implementation/testing methodologies
• Randomised control trials• A/B testing
• Quasi-experimental• Apply to all
Communityof inquiry
framework:underpinning
typology
Menu of response actions
Methods of gathering data Evaluation Plans
Evidence hub
Key metrics anddrill downs
Deep dive analysis and
strategic insight


48
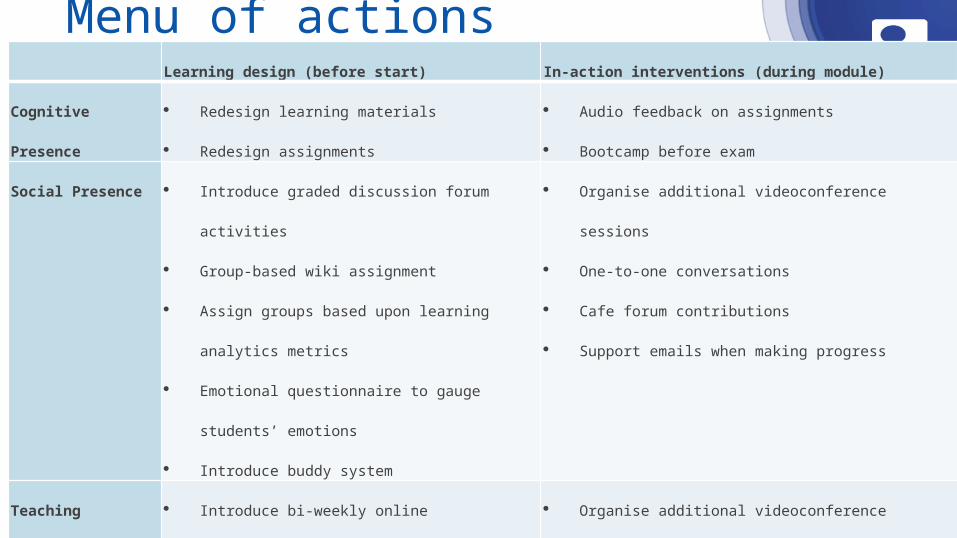
Menu of actions Learning design (before start) In-action interventions (during module)
Cognitive Presence Redesign learning materials
Redesign assignments
Audio feedback on assignments
Bootcamp before exam
Social Presence Introduce graded discussion forum activities
Group-based wiki assignment
Assign groups based upon learning analytics
metrics
Emotional questionnaire to gauge students’
emotions
Introduce buddy system
Organise additional videoconference sessions
One-to-one conversations
Cafe forum contributions
Support emails when making progress
Teaching Presence Introduce bi-weekly online videoconference
sessions
Podcasts of key learning elements in the module
Screencasts of “how to survive the first two weeks”
Organise additional videoconference sessions
Call/text/skype student-at-risk
Organise catch-up sessions on specific topics that
students struggle with


Problem specification – the OU model
• Given:– Demographic data at the Start (may include information about student’s
previous modules studied at the OU and his/her objectives)– Assessments (TMAs) as they are available during the module– VLE activities between TMAs– Conditions student must satisfy to pass the module
• Goal: – Identify students at risk of failing the module as early as possible so that
OU intervention is efficient and meaningful.

Available data
• Demographic data: age, gender, new/cont. student, education, IMD, post code, occup. category, motivation, …
• Presentation-related (fluid) data: VLE logs, TMA (score, submission date), CMA, payment dates, TMA/CMA weights, End of module assessment.
• Aggregated VLE data available daily.

Naïve Bayes network
Gender
Education
N/C
VLE
TMA1
• Education:– No formal qualif.– Lower than A level– A level– HE qualif.– Postgraduate qualif.
• VLE:– No engagement– 1-20 clicks– 21-100 clicks– 101 – 800 clicks
• N/C:– New student– Continuing student
• Gender:– Female– Male
Goal:Calculate probability of failing at TMA1 • either by not submitting TMA1,• or by submitting with score < 40.

Bayes network: example• Demographic data
– New student– Male– No formal qualification
Gender
Education
N/CTMA1
Without VLE:Probability of failing at TMA1 = 18.5%
Gender
Education
N/C
VLE
TMA1
With VLE:
Clicks Probability
0 64%1-20 44%
21-100 26%101-800 6.30%

Why TMA1?
• Two reasons:– TMA1 is a good predictor of success or failure– It is enough time to intervene … is it true?
We are hereHistory we know Future we can affect

Predicting final result from TMA1
Gender
Education
N/C
VLE
TMA1 Final resultTMA6TMA2
Pass/Distinction
Fail
TMA1 >=40
TMA1 <40
Bayes minimum error classifierIf student fails in TMA1, he/she is likely to fail the whole module
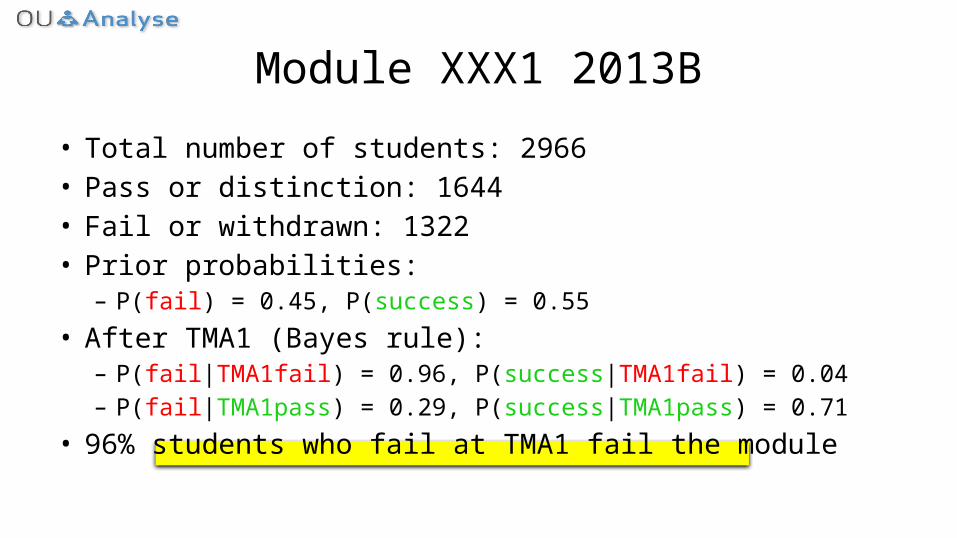
Module XXX1 2013B
• Total number of students: 2966• Pass or distinction: 1644• Fail or withdrawn: 1322• Prior probabilities:
– P(fail) = 0.45, P(success) = 0.55• After TMA1 (Bayes rule):
– P(fail|TMA1fail) = 0.96, P(success|TMA1fail) = 0.04– P(fail|TMA1pass) = 0.29, P(success|TMA1pass) = 0.71
• 96% students who fail at TMA1 fail the module

Module XXX2 2013B
• Total number of students: 1555• Pass or distinction: 609• Fail or withdrawn: 946• Prior probabilities:
– P(fail) = 0.61, P(success) = 0.39• After TMA1 (Bayes rule):
– P(fail|TMA1fail) = 0.986, P(success|TMA1fail) = 0.014– P(fail|TMA1pass) = 0.46, P(success|TMA1pass) = 0.54
• 98.6% students who fail at TMA1 fail the module

Selected important VLE activities
• Forum (F), Subpage (S), Resource (R), OU_content (O), No activity (N)
• Possible activity combinations in a week: F, FS, N, O, OF, OFS, OR, ORF, ORFS, ORS, OS, R, RF, RFS, RS, S
FSF RFSOFS ORFN O SRFROF OR ORSORFS OS RS

Start
FSF RFSOFS ORFN O SRFROF OR ORSORFS OS RS
FSF RFSOFS ORFN O SRFROF OR ORSORFS OS RS
FSF RFSOFS ORFN O SRFROF OR ORSORFS OS RS
FSF RFSOFS ORFN O SRFROF OR ORSORFS OS RS
FSF RFSOFS ORFN O SRFROF OR ORSORFS OS RS
Pass Fail No submit TMA-1time
VLE opens
Start
Activity space
FSF RFSOFS ORFN O SRFROF OR ORSORFS OS RS

FSF RFSOFS ORFN O SRFROF OR ORSORFS OS RS
Start
FSF RFSOFS ORFN O SRFROF OR ORSORFS OS RS
FSF RFSOFS ORFN O SRFROF OR ORSORFS OS RS
FSF RFSOFS ORFN O SRFROF OR ORSORFS OS RS
FSF RFSOFS ORFN O SRFROF OR ORSORFS OS RS
Pass Fail No submit TMA-1time
VLE opens
Start
VLE trail: successful student
FSF RFSOFS ORFN O SRFROF OR ORSORFS OS RS

FSF RFSOFS ORFN O SRFROF OR ORSORFS OS RS
Start
FSF RFSOFS ORFN O SRFROF OR ORSORFS OS RS
FSF RFSOFS ORFN O SRFROF OR ORSORFS OS RS
FSF RFSOFS ORFN O SRFROF OR ORSORFS OS RS
FSF RFSOFS ORFN O SRFROF OR ORSORFS OS RS
FSF RFSOFS ORFN O SRFROF OR ORSORFS OS RS
Pass Fail No submit TMA-1time
VLE opens
Start
VLE trail: student who did not submit

Probabilistic model: all studentstime
TMA1
VLE
start

Module VLE Fingerprint

Four predictive models built from legacy data by Machine Learning

Prediction sheet: example

Dashboard: Module viewTime Machine and VLE overview with notifications

Prediction tableDashboard: Module view

Filter
Dashboard: Module view

Dashboard: Student view
VLE activities, TMA results, time machine

Nearest neighbours, Predictions with real scores, Personalised recommender
Dashboard: Student view

Feedback from tutors
Dashboard: Tutor view


Background of QAA Study
• HE increasingly competitive market: student satisfaction has become an important component of Quality Assurance (QA) and Quality Enhancement (QE, Kember & Ginns, 2012; Rienties, 2014).
• Measurement of student satisfaction is important to pinpoint strengths and identify areas for improvement (Coffey & Gibbs, 2001; Zerihun, Beishuizen, & Os, 2012).
• Potential benefits and drawbacks of student evaluations have been well-documented in the literature (see for example Bennett & De Bellis, 2010; Crews & Curtis, 2011),
o Recent research continues to suggest strong resistance amongst academic staff (Crews & Curtis, 2011; Rienties, 2014).
o Most student survey instruments lack of focus on key elements of rich learning, such as interaction, assessment and feedback.
• With the increased importance of NSS and institutional surveys on academic and educational practice, there is a need for a critical review of how these data are used for QA and QE.

Key Questions of the Project
1. To what extent are institutions using insights from NSS and institutional surveys to transform their students’ experience?
2. What are the key enablers and barriers for integrating student satisfaction data with QA and QE
3. How are student experiences influencing quality enhancementsa) What influences students’ perceptions of overall satisfaction the most? Are student
characteristics or module/presentation related factors more predictive than satisfaction with other aspects of their learning experience?
b) Is the student cohort homogenous when considering satisfaction key drivers? For example are there systematic differences depending on the level or programme of study?


Methodology (Logistic Regression) & Validation
Step 1: A descriptive analysis was conducted to discount variables that were unsuitable for satisfaction modelling.
Step 1 also identified highly correlated predictors and methodically selected the most appropriate.
Module
Presentation
Student
Concurrency
Study history
Overall Satisfaction
SEaM
UG new, UG continuing, PG new and PG continuing students were modelled separately at Step 2.
Step 2: Each subset of variables was modelled in groups. The variables that were statistically significant from each subset were then combined and modelled to identify the final list of key drivers
We found at Step 3 that the combined scale provided the simplest and most interpretable solution for PG students and the whole scale for UG students. The solution without the KPI’s included was much easier to use in terms of identifying clear priorities for action.
Step 3 Validation: all models have been verified by using subsets of the whole data to ensure the solutions are robust. A variety of model fit statistics have also been used to identify the optimum solutions.


Satisfaction Modelling:Undergraduate Continuing Students
% planned life cycle
15
Module: Examinable Component
14
Module: Level of
study
13
Module: Credits
12
Q6 Method
of delivery
11
Q11 Assignme
nt completio
n
09
Q23 Tutor knowledg
e
07
Q3 Advice &
guidance
05
Q13 Qualificati
on aim
03
KPI-05 Teaching materials
01
KPI-06Workload
10
Q9 Assignmen
t instruction
s
08
Q14 Career
relevance
06
Q5 Integratio
n of materials
04
Q36 Assessmen
t
02
Importance to Overall Satisfaction
Li, N., Marsh, V., & Rienties, B. (2016). Modeling and managing learner satisfaction: use of learner feedback to enhance blended and online learning experience. Decision Sciences Journal of Innovative Education, 14 (2), 216-242.

Satisfaction Modelling:Undergraduate New Students
Age
07
Q14 Career
relevance
05
Q3 Advice &
guidance
03
KPI-05 Teaching materials
01
Q13Qualification
aim
06
Q5 Integratio
n of materials
04
Q36 Assessmen
t
02
Importance to Overall Satisfaction

Li, N., Marsh, V., Rienties, B., Whitelock, D. (2016). Online learning experiences of new versus continuing learners: a large scale replication study. Assessment & Evaluation in Higher Education. DOI: 10.1080/02602938.2016.1176989.

Conclusions (Part I)
1. Learning design strongly influences student engagement, satisfaction and performance
2. Visualising learning design decisions by teachers lead to more interactive/communicative designs

Conclusions (Part II)
1. 10 out of 11 modules improved retention
2. Visualising learning analytics data can encourage teachers to intervene in-presentation and redesign afterwards

Conclusions (Part III)
1. Need for educational theory to unpack learning analytics
2. Need for educationalists to embrace learning analytics ….
3. Lets work together

The power of learning analytics: a need to move towards new methodologies in education?
EARLI SIG 17, Maastricht, The Netherlands@DrBartRienties
Reader in Learning Analytics