Embed Size (px)
Citation preview
1
KWAME NKRUMAH UNIVERSITY OF SCIENCE AND
TECHNOLOGY
TOPIC
DETERMINATION OF FUNCTIONAL GROUPS OF COMPOUNDS
VIA INFRARED SPECTROSCOPY (IR) TOOL
BY
JAPHAT OPOKU OFOSU ([email protected])
DECEMBER, 2014
Phone:(+233)506056606
TABLE OF CONTENTS
2
1.0 ABSTRACT 3
1.1 LITERATURE REVIEW 3-4
1.2 BACKGROUND [4-16]
Introduction 4-6
Basic Instrument parts 6-8
Instrument types and their Operation or Mechanism 8-15
Contrast between the types and applications 15-16
1.3 METHOD/PROCEDURE 16-17
1.4 DISCUSSION AND INTERPRETATIONS OF THE RESULTS 18-19
1.5 CONCLUSION 20
1.6 LIMITATIONS 20
1.7 RECOMMENDATION 21
1.8 REFERENCES 21-22
1.0 ABSTRACT
3
Triggering molecular vibrations through irradiation with infrared light provides mostly
the information about the presence or absence of certain functional groups. Functional
groups are common and specific arrangements of atoms that impact predictable
reactivity and properties to a molecule. Even though there are millions of organic
compounds, you may be relieved to know that we can readily understand much about
whole families of compounds simply by learning about the properties of the common
functional groups. Infrared radiation (λ = 2.5–25 μm) is the energy source in infrared
spectroscopy. These are somewhat longer wavelengths than visible light, so they are
lower in frequency and lower in energy than visible light. Frequencies in Infrared
Spectroscopy are reported using a unit called the wavenumber. Based on the special
uses or applications of these functional groups in the manufacture of natural products
and the synthetic usage of these functional groups to produce other related functional
groups or compounds, it is necessary to know the functional groups presence in a given
compound.
This thesis focuses on the use of Infrared spectroscopy (IR) to determine the functional
groups of compounds. The mechanism of operation of the IR tool explained in details,
and the tool is put under test theoretically for limitations, recommendations and
conclusion. Applications and other IR related issues of interest have been well
discussed.
1.1 LITERATURE REVIEW
Several methods have been designed earlier in the determination of functional groups of
compounds. These include solubility test, Infrared spectroscopy adsorption and
elemental analysis. Sydney Siggia recently reported on the determination of functional
groups through chemical means. His approach is concerned with techniques and
reasoning involved in devising a new method in analysis and making changes in known
procedures. Keivan Torabi in 1999 reported on the use of Fourier transform Infrared
spectroscopy (a type of IR) to replace a differential refractive index (DRI) in SEC. Size
Exclusion Chromatography (SEC) separates the molecules according to their size in
solution to permit each size to be examined by a "detector‖. If a Fourier Transform
Infrared (FTIR) spectrometer could be used instead of the DRI it could more than
overcome this disadvantage by providing a great deal of information on the
concentration of individual functional groups. He found out that although a small
volume flow cell offers continuous monitoring of polymer solutions for FTIR detection

4
application in SEC is limited due to low polymer concentration and strong i-d
absorption bands of the mobile phase. Infrared spectroscopy has such a wide
applications.
1.2 BACKGROUND
Spectroscopy is a method of analysis based on the interaction of electromagnetic
radiation and matter. Modern experimental chemistry uses many spectroscopic
techniques, among them ultraviolet and visible spectroscopy, infrared spectroscopy, and
nuclear magnetic resonance spectroscopy, and electron spin resonance spectroscopy. All
depend in some manner on the absorption of energy by a collection of molecules, the
energy involved being in different regions of the electromagnetic spectrum. Infrared
(IR) spectroscopy is a simple and rapid instrumental technique that can give evidence
for the presence of various functional groups. If you had a sample of unknown identity,
among the first things you would do is obtain an infrared spectrum, along with
determining its solubility in common solvents and its melting and/or boiling point.
Infra-red (IR) spectroscopy deals with the interaction between a molecule and radiation
from the IR region of the EM spectrum (IR region = 4000 - 400 cm-1
). The cm-1
unit is
the wave number scale and is given by 1 / (wavelength in cm). Wavenumber is inversely
proportional to wavelength and reported in reciprocal centimeters (cm–1). Wavenumber
(ν~) is proportional to frequency (ν). Frequency (and therefore energy) increases as the
wavenumber increases. Using the wavenumber scale, IR absorptions occur from 4000
cm–1
–400 cm–1
. Absorption of IR light causes changes in the vibrational motions of a
molecule.
Covalent bonds are not static. They are more like springs with weights on each end.
When two atoms are bonded to each other, the bond stretches back and forth. When
three or more atoms are joined together, bonds can also bend. These bond stretching and
bending vibrations represent the different vibrational modes available to a molecule.
IR radiation causes the excitation of the vibrations of covalent bonds within that
molecule. These vibrations include the stretching and bending modes. IR radiation is
readily absorbed by molecular substances because photon energy in this region
corresponds to the difference between vibrational energy states corresponding to
stretching and bending.
Although the force gradient is different, the mass-spring system can give useful insight
5
into the vibrational modes along chemical bonds that give rise to infrared absorbance’s
detected by IR spectroscopy. The relationships between electrostatic force, particle
mass, and frequency are similar to the relationships between spring constant, object
mass and frequency of spring oscillation (although the force of attraction is very
different). The main point is that larger masses and weaker forces give lower frequency.
In general, this means that a singly bonded large atom absorbs at lower frequency than a
double bonded small atom.
An IR spectrum shows the energy absorptions as one 'scans' the IR region of the
Electromagnetic spectrum (EM). In general terms it is convenient to split an IR
spectrum into two approximate regions: 4000-1000 cm-1
known as the functional group
region, and < 1000 cm-1
known as the fingerprint region. Most of the information that is
used to interpret an IR spectrum is obtained from the functional group region. In
practice, it is the polar covalent bonds that are IR "active" and whose excitation can be
observed in an IR spectrum. In organic molecules these polar covalent bonds represent
the functional groups. All hydrocarbons give absorption peaks in the 2800–3300-cm-1
region that are associated with carbon–hydrogen stretching vibrations. We can use these
peaks in interpreting IR spectra because the exact location of the peak depends on the
strength (and stiffness) of the C-H bond, which in turn depends on the hybridization
state of the carbon that bears the hydrogen. The C-H bonds involving sp-hybridized
carbon are strongest and those involving sp3-hybridized carbon are weakest. The order
of bond strength is sp _ sp2_ p3 This, too, is the order of the bond stiffness.
Hence, the most useful information obtained from an IR spectrum is what functional
groups are present within the molecule. Remember that some functional groups can be
"viewed" as combinations of different bond types. For example, an ester, CO2R
contains both C=O and C-O bonds and both are typically seen in an IR spectrum of an
ester. In the fingerprint region, the spectra tend to be more complex and much harder to
assign.
Development of IR Spectrometers
There have been three generations up till FTIR

6
1. The first generation IR spectrometer was invented in late 1950s. It utilizes prism
optical splitting system. The prisms are made of NaCl. The requirement of the
sample’s water content and particle size is extremely strict. Furthermore, the
scan range is narrow. Additionally, the repeatability is fairly poor. As a result,
the first generation IR spectrometer is no longer in use.
2. The second generation IR spectrometer was introduced to the world in 1960s. It
utilizes gratings as the monochrometer. The performance of the second
generation IR spectrometer is much better compared with IR spectrometers with
prism monochrometer, But there are still several prominent weaknesses such as
low sensitivity, low scan speed and poor wavelength accuracy which rendered it
out of date after the invention of the third generation IR spectrometer.
3. The invention of the third generation IR spectrometer, Fourier transform infrared
spectrometer, marked the abdication of monochrometer and the prosperity of
interferometer. With this replacement, IR spectrometers became exceptionally
powerful. Consequently, various applications of IR spectrometer have been
realized.
Basic Instrumental components present in all IR types
(a)Sources:
An inert solid is electrically heated to a temperature in the range 1500-2000 K. The
heated material will then emit infrared radiation.
The Nernst glower source is a cylinder (1-2 mm diameter, approximately 20 mm long)
of rare earth oxides. Platinum wires are sealed to the ends, and a current passed through
the cylinder. The Nernst glower can reach temperatures of 2200 K.
The Globar source is a silicon carbide rod (5mm diameter, 50mm long) which is
electrically heated to about 1500 K. Water cooling of the electrical contacts is needed to
prevent arcing. The spectral output is comparable with the Nernst glower, except at
short wavelengths (less than 5 mm) where it's output becomes larger.

7
The incandescent wire source is a tightly wound coil of nichrome wire, electrically
heated to 1100 K. It produces a lower intensity of radiation than the Nernst or Globar
sources, but has a longer working life.
In obtaining infrared absorption spectra, it is most convenient to use an incandescent
body as a source which emits radiation of all wavelengths in the regions to be
investigated. Most of the sources used have emission characteristics approaching those
of a black body. Sources, although continuous, do not have uniform intensity
throughout the spectral region. It is further to be noted that although the curves extend
only to about 6 microns at the long wave end, even at this relatively short wavelength
140-130cm-1
.Well at longer wavelengths for sources at these temperatures indicates
that the intensity falls off inversely as the fourth power of the wavelength. Hence at 15
or 25 microns, there is relatively little power available. This puts a limitation on the
range of wavelengths which may be examined readily. However techniques have been
developed so that there is no great difficulty in determining absorption characteristics at
wavelengths as long as 25 microns. The Nernst glower and the Globar are the two most
commonly used sources of radiation. They both operate in the temperature range of
1000 to 1500 degrees Kelvin.
(b) Detectors
The other component of the instrument of some interest is the detector. Devices used for
detection of the presence of infrared radiation may be arranged in three classes. Most
widely used is the thermocouple The three categories of detector;
1. Thermal
2. Pyroelectric
3. Photoconducting
Thermocouples consist of a pair of junctions of different metals; for example, two
pieces of bismuth fused to either end of a piece of antimony. The potential difference
(voltage) between the junctions changes according to the difference in temperature
between the junctions.

8
Pyroelectric detectors are made from a single crystalline wafer of a pyroelectric
material, such as triglycerine sulphate. The properties of a pyroelectric material are such
that when an electric field is applied across it, electric polarisation occurs (this happens
in any dielectric material). In a pyroelectric material, when the field is removed, the
polarisation persists. The degree of polarisation is temperature dependant. So, by
sandwiching the pyroelectric material between two electrodes, a temperature dependant
capacitor is made. The heating effect of incident IR radiation causes a change in the
capacitance of the material. Pyroelectric detectors have a fast response time. They are
used in most Fourier transform IR instruments.
Photoelectric detectors such as the mercury cadmium telluride detector comprise a film
of semiconducting material deposited on a glass surface, sealed in an evacuated
envelope. Absorption of IR promotes nonconducting valence electrons to a higher,
conducting, state. The electrical resistance of the semiconductor decreases. These
detectors have better response characteristics than pyroelectric detectors and are used in
FT-IR instruments - particularly in GC - FT-IR.
Types of IR Instrument and Their Mechanism of Operation
These are often double-beam recording instruments, employing diffraction gratings for
dispersion of radiation. Radiation from the source is flicked between the reference and
sample paths. Often, an optical null system is used. This is when the detector only
responds if the intensity of the two beams is unequal. If the intensities are unequal, a
light attenuator restores equality by moving in or out of the reference beam. The
recording pen is attached to this attenuator. Dispersive IR Spectrometers
Dispersive Infrared Spectrophotometer

9
To understand the powerfulness and usefulness of FTIR spectrometer, it is essential
to have some background information of dispersive IR Spectrometer. The basic
components of a dispersive IR spectrometer include a radiation source, monochromator,
and detector. The common IR radiation sources are inert solids that are heated
electrically to promote thermal emission of radiation in the infrared region of the
electromagnetic spectrum. The monochromator is a device used to disperse or separate a
broad spectrum of IR radiation into individual narrow IR frequencies.
Generally, dispersive spectrometers have a double-beam design with two equivalent
beams from the same source passing through the sample and reference chambers as
independent beams. These reference and sample beams are alternately focused on the
detector by making use of an optical chopper, such as, a sector mirror. One beam will
proceed, traveling through the sample, while the other beam will pass through a
reference species for analytical comparison of transmitted photon wavefront
information.
After the incident radiation travels through the sample species, the emitted wavefront of
radiation is dispersed by a monochromator (gratings and slits) into its component
frequencies. A combination of prisms or gratings with variable-slit mechanisms,
mirrors, and filters comprise the dispersive system. Narrower slits gives better
resolution by distinguishing more closely spaced frequencies of radiation and wider slits
allow more light to reach the detector and provide better system sensitivity. The emitted
wavefront beam (analog spectral output) hits the detector and generates an electrical
signal as a response.
Detectors are devices that convert the analog spectral output into an electrical signal.
These electrical signals are further processed by the computer using mathematical
10
algorithm to arrive at the final spectrum. The detectors used in IR spectrometers can be
classified as either photon/quantum detectors or thermal detectors.
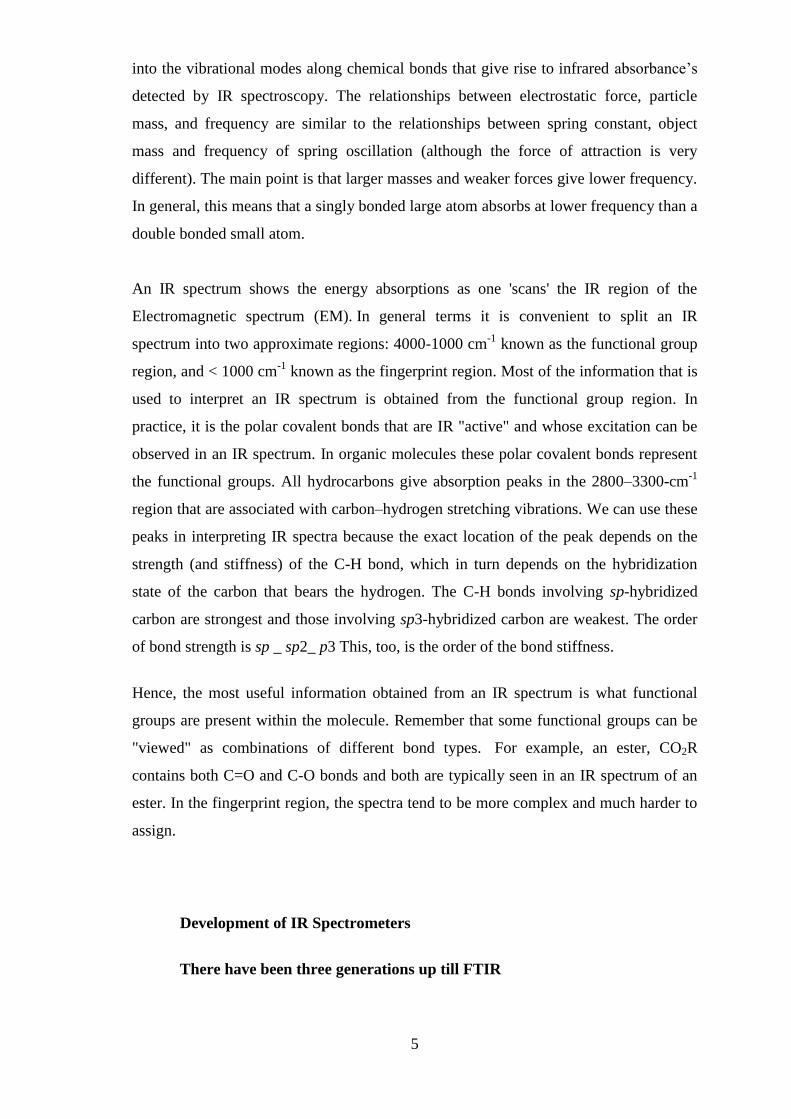
It is the absorption of IR radiation by the sample, producing a change of IR radiation
intensity, which gets detected as an off-null signal (e.g. different from reference signal).
This change is translated into the recorder response through the actions of synchronous
motors. Each frequency that passes through the sample is measured individually by the
detector which consequently slows the process of scanning the entire IR region. A
block diagram of a classic dispersive IR spectrometer is shown in Figure C.
Figure C
Dispersive IR instruments operate in the frequency domain. There are, however,
advantages to be gained from measurement in the time domain followed by computer
transformation into the frequency domain.
If we wished to record a trace in the time domain, it could be possible to do so by
allowing radiation to fall on a detector and recording its response over time. In practice,
no detector can respond quickly enough (the radiation has a frequency greater than 1014
Hz). This problem can be solved by using interference to modulate the IR signal at a
detectable frequency.
11
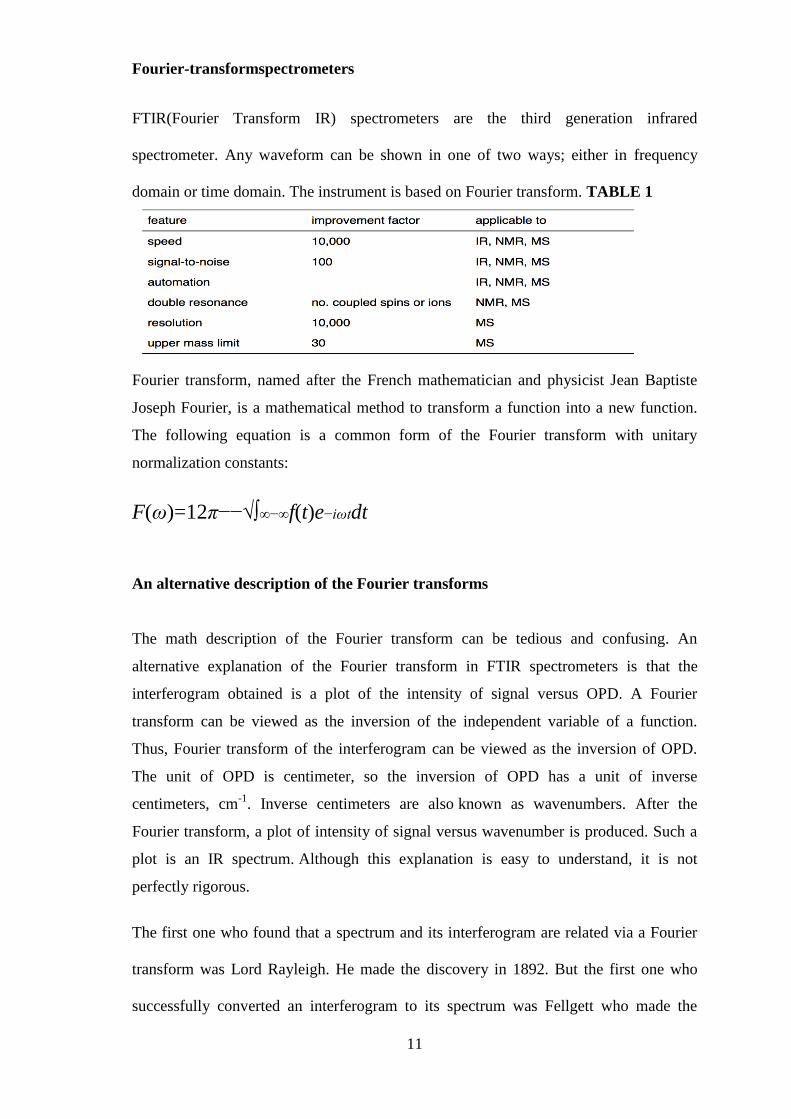
Fourier-transformspectrometers
FTIR(Fourier Transform IR) spectrometers are the third generation infrared
spectrometer. Any waveform can be shown in one of two ways; either in frequency
domain or time domain. The instrument is based on Fourier transform. TABLE 1
Fourier transform, named after the French mathematician and physicist Jean Baptiste
Joseph Fourier, is a mathematical method to transform a function into a new function.
The following equation is a common form of the Fourier transform with unitary
normalization constants:
F(ω)=12π−−√∫∞−∞f(t)e−iωtdt
An alternative description of the Fourier transforms
The math description of the Fourier transform can be tedious and confusing. An
alternative explanation of the Fourier transform in FTIR spectrometers is that the
interferogram obtained is a plot of the intensity of signal versus OPD. A Fourier
transform can be viewed as the inversion of the independent variable of a function.
Thus, Fourier transform of the interferogram can be viewed as the inversion of OPD.
The unit of OPD is centimeter, so the inversion of OPD has a unit of inverse
centimeters, cm-1
. Inverse centimeters are also known as wavenumbers. After the
Fourier transform, a plot of intensity of signal versus wavenumber is produced. Such a
plot is an IR spectrum. Although this explanation is easy to understand, it is not
perfectly rigorous.
The first one who found that a spectrum and its interferogram are related via a Fourier
transform was Lord Rayleigh. He made the discovery in 1892. But the first one who
successfully converted an interferogram to its spectrum was Fellgett who made the

12
accomplishment after more than half a century. Fast Fourier transform method on which
the modern FTIR spectrometer based was introduced to the world by Cooley and
Turkey in 1965. It has been applied widely to analytical methods such as infrared
spectrometry, nuclear magnetic resonance and mass spectrometry due to several
prominent advantages which are listed in Table 1.
The Components of FTIR Spectrometers
A common FTIR spectrometer consists of a source, interferometer, sample
compartment, detector, amplifier, A/D convertor, and a computer. The source generates
radiation which passes the sample through the interferometer and reaches the detector.
Then the signal is amplified and converted to digital signal by the amplifier and analog-
to-digital converter, respectively. Eventually, the signal is transferred to a computer in
which Fourier transform is carried out. Figure 2 is a block diagram of an FTIR
spectrometer.
Figure 2
Radiation leaves the source and is splitted. Half is reflected to a stationary mirror and
then back to the splitter. This radiation has travelled a fixed distance. The other half of
13
the radiation from the source passes through the splitter and is reflected back by a
movable mirror. Therefore, the path length of this beam is variable. The two reflected
beams recombine at the splitter, and they interfere (e.g. for any one wavelength,
interference will be constructive if the difference in path lengths is an exact multiple of
the wavelength. If the difference in path lengths is half the wavelength then destructive
interference will result). If the movable mirror moves away from the beam splitter at a
constant speed, radiation reaching the detector goes through a steady sequence of
maxima and minima as the interference alternates between constructive and destructive
phases.
This occurs because all wavelengths emitted by the source are present, the
interferogram is extremely complicated. The moving mirror must travel smoothly; a
frictionless bearing is used with electromagnetic drive. The position of the mirror is
measured by a laser shining on a corner of the mirror. A simple sine wave interference
pattern is produced. Each peak indicates mirror travel of one half the wavelength of the
laser. The accuracy of this measurement system means that the IR frequency scale is
accurate and precise.
In the FT-IR instrument, the sample is placed between the output of the interferometer
and the detector. The sample absorbs radiation of particular wavelengths. Therefore, the
interferogram contains the spectrum of the source minus the spectrum of the sample. An
interferogram of a reference (sample cell and solvent) is needed to obtain the spectrum
of the sample. After an interferogram has been collected, a computer performs a Fast
Fourier Transform, which results in a frequency domain trace that is intensity versus
wavenumber) that we all know and love. The detector used in an FT-IR instrument must
respond quickly because intensity changes are rapid (the moving mirror moves quickly).
Pyroelectric detectors or liquid nitrogen cooled photon detectors must be used. Thermal
detectors are too slow.To achieve a good signal to noise ratio, many interferograms are
14
obtained and then averaged. This can be done in less time than it would take a dipersive
instrument to record one scan. Fourier Transform of Interferogram to Spectrum.
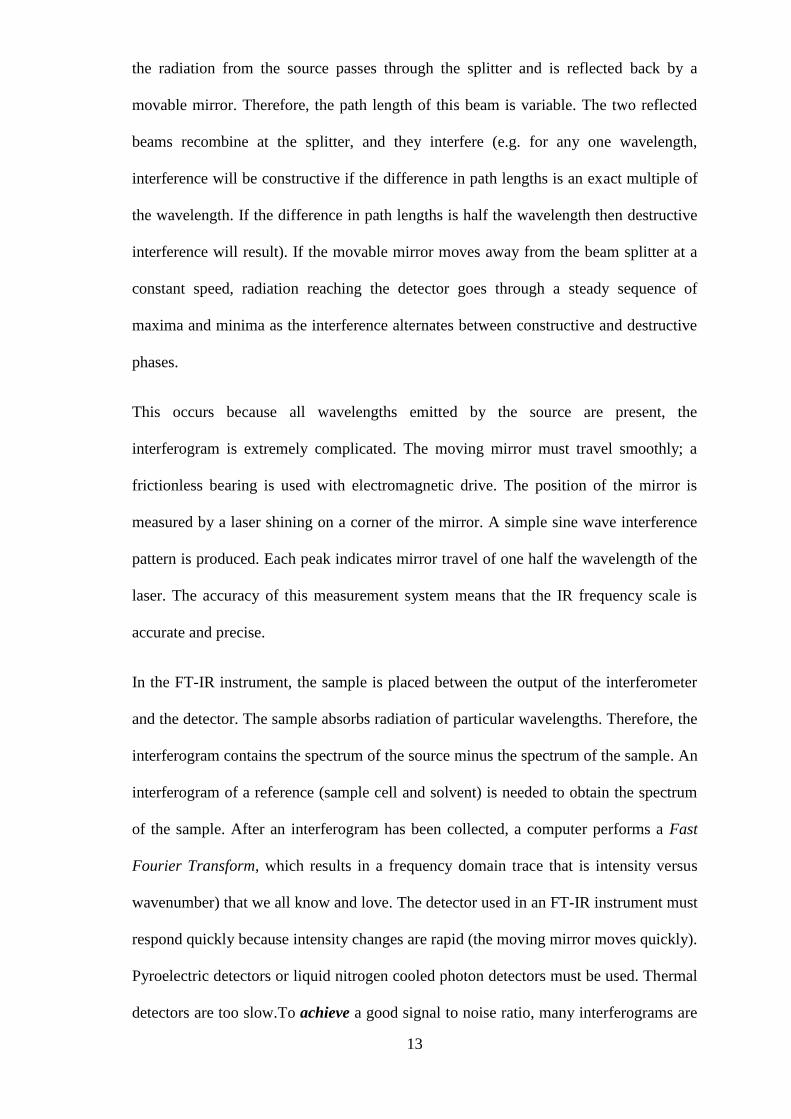
The interferogram is a function of time and the values outputted by this function of time
are said to make up the time domain. The time domain is Fourier transformed to get a
frequency domain, which is deconvolved to product a spectrum. Figure 4 shows the
Fast Fourier transform from an interferogram of polychromatic light to its spectrum.
(b) (a)
Figure 4. (a) Interferogram of a monochromatic light; (b) its spectrum
The major difference between an FTIR spectrometer and a dispersive IR spectrometer is
the Michelson interferometer.
Michelson Interferometer
The Michelson interferometer, which is the core of FTIR spectrometers, is used to split
one beam of light into two so that the paths of the two beams are different. Then the
Michelson interferometer recombines the two beams and conducts them into the
detector where the differences of the intensity of these two beams are measured as a
function of the difference of the paths. Figure D is a schematic of the Michelson
Interferometer. The Michelson interferometer

15
Figure D
A typical Michelson interferometer consists of two perpendicular mirrors and a beam
splitter. One of the mirrors is a stationary mirror and another one is a movable mirror.
The beam splitter is designed to transmit half of the light and reflect half of the light.
Subsequently, the transmitted light and the reflected light strike the stationary mirror
and the movable mirror, respectively. When reflected back by the mirrors, two beams of
light recombine with each other at the beam splitter.
If the distances travelled by two beams are the same which means the distances between
two mirrors and the beam splitter are the same, the situation is defined as zero path
difference (ZPD). But imagine if the movable mirror moves away from the beam
splitter, the light beam which strikes the movable mirror will travel a longer distance
than the light beam which strikes the stationary mirror. The distance which the movable
mirror is away from the ZPD is defined as the mirror displacement and is represented by
∆. It is obvious that the extra distance travelled by the light which strikes the movable
mirror is 2∆. The extra distance is defined as the optical path difference (OPD) and is
represented by delta.
Advantages of Fourier transform IR over dispersive IR;
1. Improved frequency resolution
2. Improved frequency reproducibility (older dispersive instruments must be
recalibrated for each session of use)
3. Higher energy throughput
4. Faster operation
5. Computer based (allowing storage of spectra and facilities for processing
spectra)
16
6. Easily adapted for remote use (such as diverting the beam to pass through an
external cell and detector, as in GC - FT-IR)
Applications of Infrared Spectroscopy
Infrared spectroscopy is used in research to identify samples, do quantitative analysis,
or detect impurities. Infrared spectroscopy can be used on gaseous, liquid, or solid
samples and does not destroy the sample in the process. Other applications include:
Chemical analysis, Forensics, Environmental testing, and many more.
1.3 METHOD/PROCEDURE
To be able to identify the functional group(s) that exists in a particular compound.
Step 1: The first step is sample preparation. The standard method to prepare solid
sample for FTIR spectrometer is to use KBr. About 2 mg of sample and 200 mg KBr
are dried and ground. The particle size should be unified and less than two micrometers.
Then, the mixture is squeezed to form transparent pellets which can be measured
directly. For liquids with high boiling point or viscous solution, it can be added in
between two NaCl pellets. Then the sample is fixed in the cell by skews and measured.
For volatile liquid sample, it is dissolved in CS2 or CCl4 to form 10% solution. Then the
solution is injected into a liquid cell for measurement. Gas sample needs to be measured
in a gas cell with two KBr windows on each side. The gas cell should first be
vacuumed. Then the sample can be introduced to the gas cell for measurement.
Step 2: The second step is getting a background spectrum by collecting an
interferogram and its subsequent conversion to frequency data by inverse Fourier
transform. We obtain the background spectrum because the solvent in which we place
our sample will have traces of dissolved gases as well as solvent molecules that
contribute information that are not our sample. The background spectrum will contain
information about the species of gases and solvent molecules, which may then be
subtracted away from our sample spectrum in order to gain information about just the
sample. Figure 6 shows an example of an FTIR background spectrum.
17
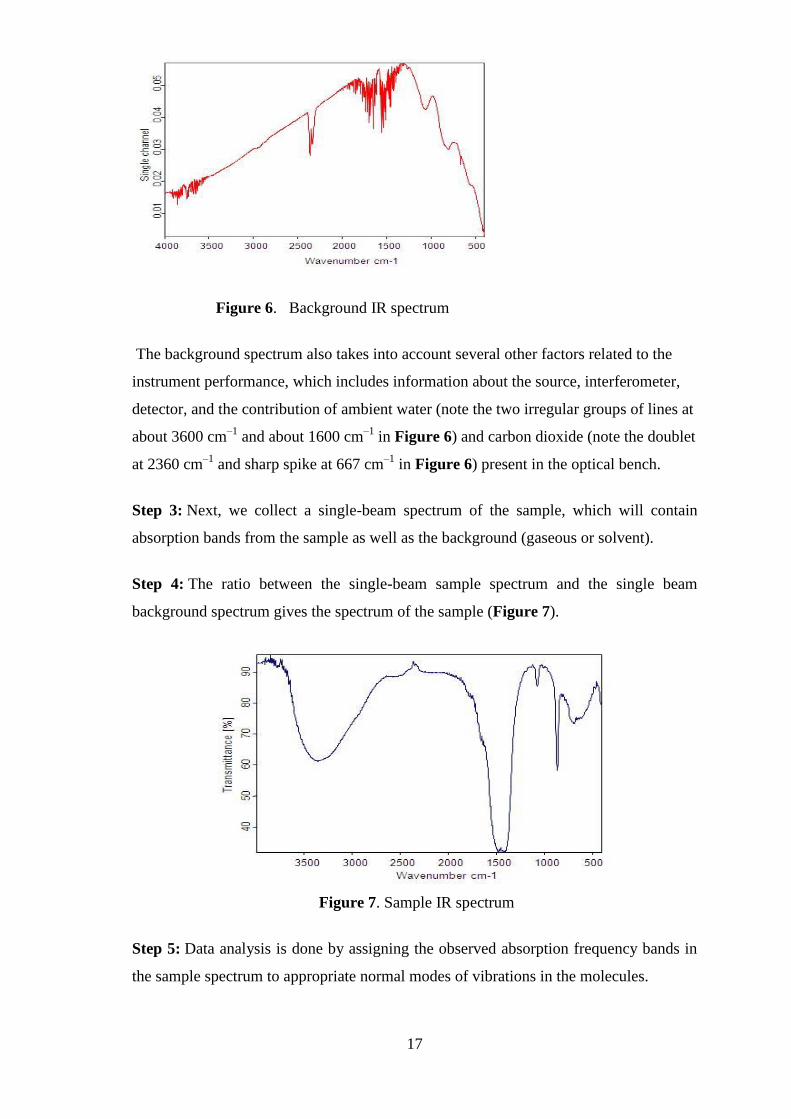
Figure 6. Background IR spectrum
The background spectrum also takes into account several other factors related to the
instrument performance, which includes information about the source, interferometer,
detector, and the contribution of ambient water (note the two irregular groups of lines at
about 3600 cm–1
and about 1600 cm–1
in Figure 6) and carbon dioxide (note the doublet
at 2360 cm–1
and sharp spike at 667 cm–1
in Figure 6) present in the optical bench.
Step 3: Next, we collect a single-beam spectrum of the sample, which will contain
absorption bands from the sample as well as the background (gaseous or solvent).
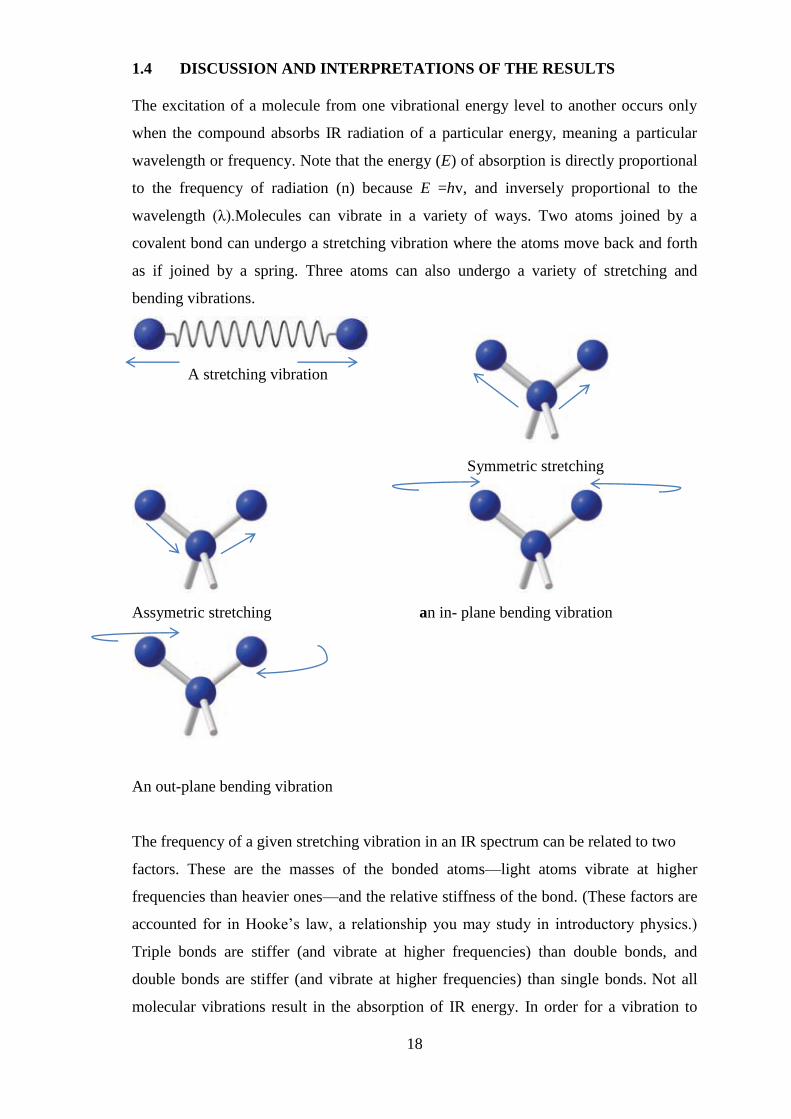
Step 4: The ratio between the single-beam sample spectrum and the single beam
background spectrum gives the spectrum of the sample (Figure 7).
Figure 7. Sample IR spectrum
Step 5: Data analysis is done by assigning the observed absorption frequency bands in
the sample spectrum to appropriate normal modes of vibrations in the molecules.
18
1.4 DISCUSSION AND INTERPRETATIONS OF THE RESULTS
The excitation of a molecule from one vibrational energy level to another occurs only
when the compound absorbs IR radiation of a particular energy, meaning a particular
wavelength or frequency. Note that the energy (E) of absorption is directly proportional
to the frequency of radiation (n) because E =hv, and inversely proportional to the
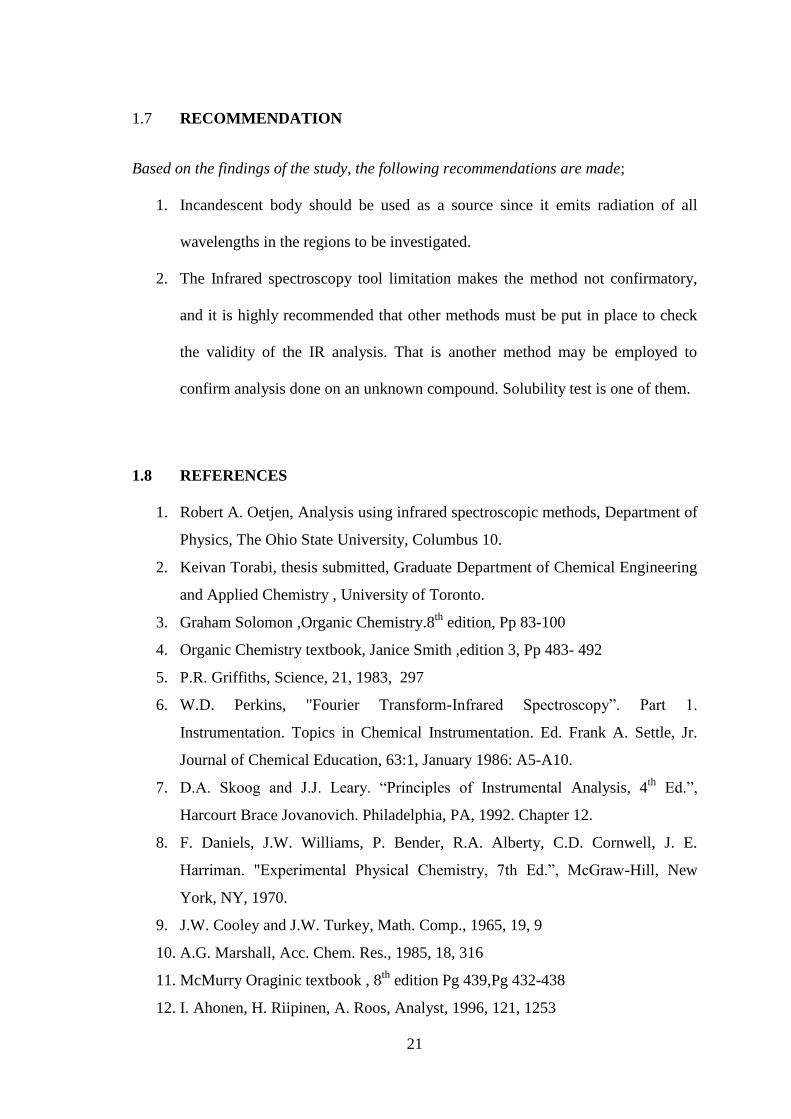
wavelength (λ).Molecules can vibrate in a variety of ways. Two atoms joined by a
covalent bond can undergo a stretching vibration where the atoms move back and forth
as if joined by a spring. Three atoms can also undergo a variety of stretching and
bending vibrations.
A stretching vibration
Symmetric stretching
Assymetric stretching an in- plane bending vibration
An out-plane bending vibration
The frequency of a given stretching vibration in an IR spectrum can be related to two
factors. These are the masses of the bonded atoms—light atoms vibrate at higher
frequencies than heavier ones—and the relative stiffness of the bond. (These factors are
accounted for in Hooke’s law, a relationship you may study in introductory physics.)
Triple bonds are stiffer (and vibrate at higher frequencies) than double bonds, and
double bonds are stiffer (and vibrate at higher frequencies) than single bonds. Not all
molecular vibrations result in the absorption of IR energy. In order for a vibration to

19
occur with the absorption of IR energy, the dipole moment of the molecule must change
as the vibration occurs. Thus, methane does not absorb IR energy for symmetric
stretching of the four C H bonds; asymmetric stretching, on the other hand, does lead to
an IR absorption. Symmetrical vibrations of the carbon–carbon double and triple bonds
of ethene and ethyne do not result in the absorption of IR radiation, either. Vibrational
absorption may occur outside the region measured by a particular IR spectrometer, and
vibrational absorptions may occur so closely together that peaks fall on top. The table
below shows the characteristic frequency for certain functional groups vibrations and
stretching’s. The table is referred to know the functional group present in your
determinations or analysis.
TABLE 2 Adapted from McMurry Oraginic textbook , 8th
edition Pg 439
The Spectrum/Data
The spectrum plots the frequency which is the inverse of wavelength against %
Absorbance/transmittance .The frequency is in the range of 400-4000cm-1
and the
percentage absorbance which indicates the strength of the absorption from 0%-100%.
A sample of the plot is shown below
4000cm-1 3000cm-1 2000cm-1 1000cm-1 400cm-1
% T
ransm
itta
nce

20
1.5 CONCLUSION
Molecules that have different structure vibrate and rotate differently, hence have
different infrared absorption spectrograms. The IR apparatus is available for detecting
these differences. This satisfies the requirements for a method of chemical analysis
based on differences in a physical property of the substances. That the method is
satisfactory been demonstrated in hundreds of applications. The Infrared spectroscopy
gives the presence or the absence of a functional group and also gives further
information about the structure of the compound.
1.6 LIMITATIONS
The Infrared spectroscopy tool characteristic values or wavelengths are similar for
certain functional groups which make the identification of those functional groups
difficult. Again, the tool can be used to identify only organic functional groups because
from literature all organic functional groups absorb energies at a wavelength of 800-
4000cm-1
which also lies in the range of the tool (Infrared Spectroscopy). Therefore any
functional group discovered or not discovered with an absorption wavelength lesser
than the minimum wavelength of the tool cannot be identified. It is also frequently non-
adherence to Beer’s law complexity spectra. Moreover, with a single IR spectrum, it is
not possible to know whether the sample or the compound is a pure compound or a
mixture of compound. For example the IR spectrum of paraffin and alcohol is the same
as the spectrum of a high molecular weight of alcohol only. The complete interpretation
of an IR spectrum is difficult because most organic molecules have dozens of different
bond stretching and bending motions, and thus have dozens of absorptions. The last but
not least, the tool failed to give the molecular weight of a compound and does not
provide information about the relative position of different functional groups on a
molecule.
21
1.7 RECOMMENDATION
Based on the findings of the study, the following recommendations are made;
1. Incandescent body should be used as a source since it emits radiation of all
wavelengths in the regions to be investigated.
2. The Infrared spectroscopy tool limitation makes the method not confirmatory,
and it is highly recommended that other methods must be put in place to check
the validity of the IR analysis. That is another method may be employed to
confirm analysis done on an unknown compound. Solubility test is one of them.
1.8 REFERENCES
1. Robert A. Oetjen, Analysis using infrared spectroscopic methods, Department of
Physics, The Ohio State University, Columbus 10.
2. Keivan Torabi, thesis submitted, Graduate Department of Chemical Engineering
and Applied Chemistry , University of Toronto.
3. Graham Solomon ,Organic Chemistry.8th
edition, Pp 83-100
4. Organic Chemistry textbook, Janice Smith ,edition 3, Pp 483- 492
5. P.R. Griffiths, Science, 21, 1983, 297
6. W.D. Perkins, "Fourier Transform-Infrared Spectroscopy‖. Part 1.
Instrumentation. Topics in Chemical Instrumentation. Ed. Frank A. Settle, Jr.
Journal of Chemical Education, 63:1, January 1986: A5-A10.
7. D.A. Skoog and J.J. Leary. ―Principles of Instrumental Analysis, 4th
Ed.‖,
Harcourt Brace Jovanovich. Philadelphia, PA, 1992. Chapter 12.
8. F. Daniels, J.W. Williams, P. Bender, R.A. Alberty, C.D. Cornwell, J. E.
Harriman. "Experimental Physical Chemistry, 7th Ed.‖, McGraw-Hill, New
York, NY, 1970.
9. J.W. Cooley and J.W. Turkey, Math. Comp., 1965, 19, 9
10. A.G. Marshall, Acc. Chem. Res., 1985, 18, 316
11. McMurry Oraginic textbook , 8th
edition Pg 439,Pg 432-438
12. I. Ahonen, H. Riipinen, A. Roos, Analyst, 1996, 121, 1253
22
13. D. W. Ball, Field Guide to Spectroscopy, SPIE Publication, Bellingham, 2006
14. V. Saptari, Fourier-Transform Spectroscopy Instrumentation Engineering, SPIE
Publication, Bellingham, 2003
15. P. R. Griffiths, J. A. de Haseth, Fourier Transform Infrared Spectrometry,
Wiley, New York, 1986
16. B. C. Smith, Fundamentals of Fourier Transform Infrared Spectroscopy, CRC
press, 1996
17. B. Stuart, Modern Infrared Spectroscopy, Wiley, New York, 1996
18. A. L. Smith, Applied Infrared Spectroscopy : Fundamentals, Techniques, and
Analytical Problem-solving, Wiley, New York, 1979
19. 5. H.M. Heise, R. Marbach, Th. Koschinsky, F.A. Gries, Appl. Spectrosc. 48, 85
(1994)
20. 6. A.J. Berger, T.-W. Koo, I. Itzkan, G. Horowitz, M.S. Feld, Appl. Optics 38,
2916 (1999)
21. 7. H.M. Heise, R. Marbach, A. Bittner, Th. Koschinsky, J. Near Infrared
Spectrosc. 6, 361 (1998)
22. 8. H.M. Heise, A. Bittner, R. Marbach, J. Near Infrared Spectrosc. 6, 349 (1998)