Embed Size (px)
DESCRIPTION
Presentation at the HEA-funded workshop 'Making undergraduate social science count: engaging sociology and criminology students in quantitative research methods'. This workshop aimed to encourage pedagogical reflection and debate on the teaching of quantitative methods to sociology/criminology undergraduates and provide delegates with opportunities for the sharing of best practice in this area. The event included dissemination of the outputs of two recent HEA-funded projects on teaching research methods in the social sciences. Delegates were also introduced to some new and existing quantitative datasets and resources and explore the potential for integrating these across the undergraduate curriculum. This presentation is part of a related blog post that provides an overview of the event: http://bit.ly/1iBrVMR For further details of the HEA's work on teaching research methods in the Social Sciences, please see: http://bit.ly/15go0mh
Citation preview
Funded as part of the HEA Social Sciences strategic project 2012 – 13
Introduction to new teaching datasets and associated resources
Emma Calvert and Paula Devine
Queen’s University Belfast

Overview
• Introduce ARK and its resources and how these can facilitate the teaching of quantitative methods (QM)
• Highlight the new teaching datasets and discuss issues in creating them/utilisation in teaching QM

Background to ARK
• Joint QUB/UU initiative, established 2000
• Aim: To make material on the social and political life of Northern Ireland available to the widest possible audience
• Provides access, research and knowledge

ARK resources (www.ark.ac.uk)
• Background facts and figures on N Ireland
• Extensive and varied material on the conflict
• Tables of results from surveys
• Raw data from ARK surveys
• Questionnaires
• Bibliographies and summaries
• Audio-visual and qualitative data
• Election results
• Critical policy unit .................and much more!
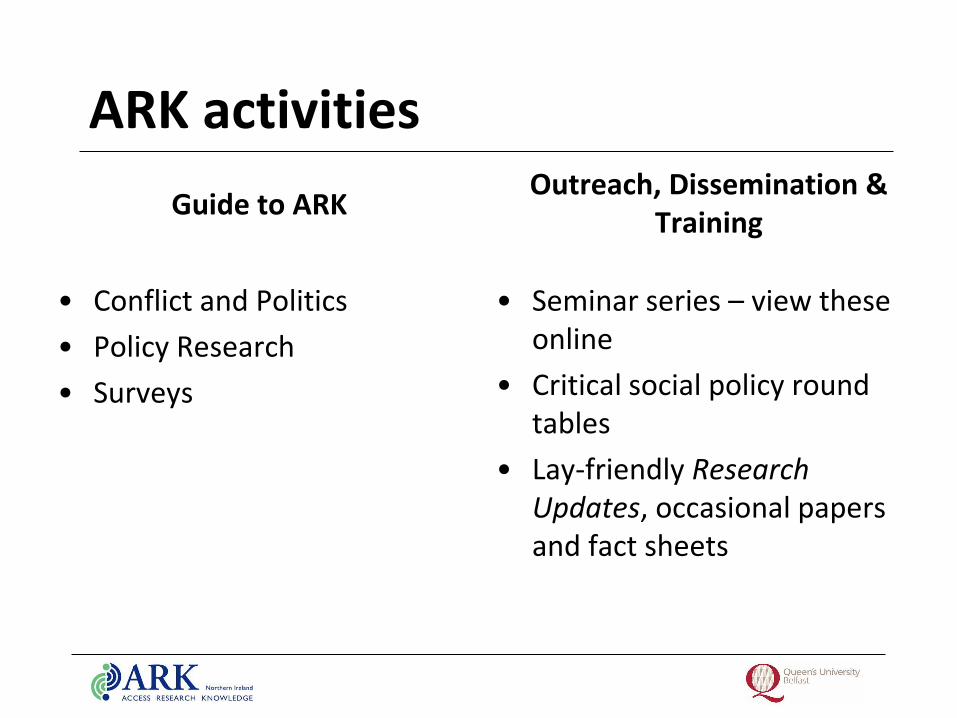
ARK activities
Guide to ARK
• Conflict and Politics
• Policy Research
• Surveys
Outreach, Dissemination & Training
• Seminar series – view these online
• Critical social policy round tables
• Lay-friendly Research Updates, occasional papers and fact sheets

Introduction to ARK
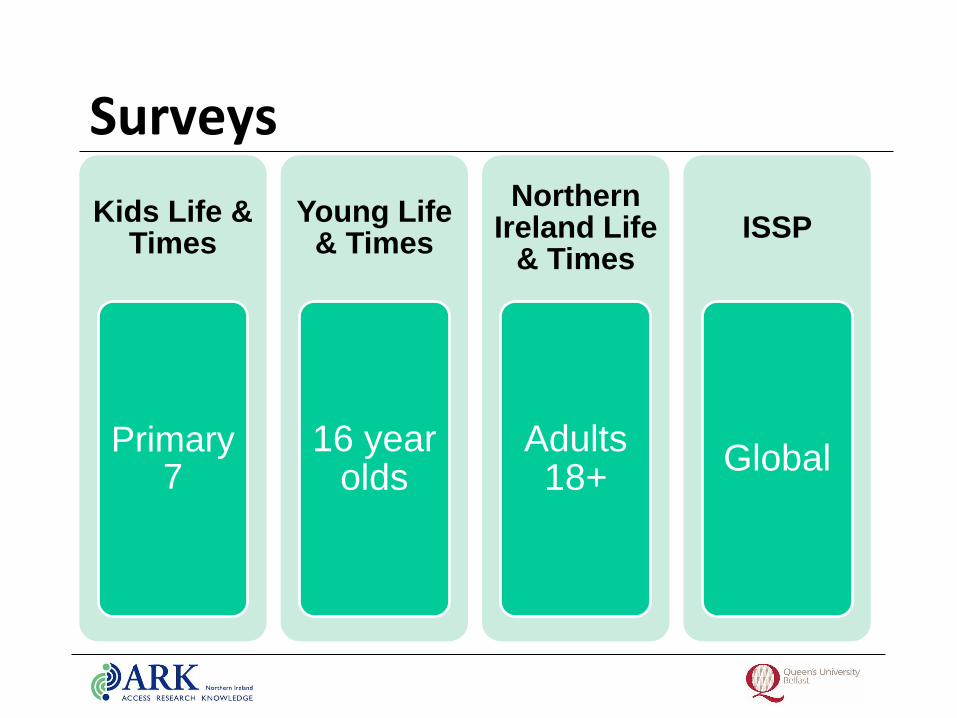
Surveys
Kids Life & Times
Primary 7
Young Life & Times
16 year olds
Northern Ireland Life
& Times
Adults 18+
ISSP
Global

Why?
Through our surveys we provide time-series attitudinal data to inform policy development and provide a public voice
These three annual surveys monitor the attitudes of people of different ages in Northern Ireland to a wide range of social and political issues

Overview of ARK surveys
While the samples and methods of data collection vary, all 3 surveys have common features:
• ‘Modular’ construction (discrete, topic-based sets of questions)
• Completely free and easy access to the data shortly after fieldwork is completed, including tables of results, dataset, questionnaires, technical report
NI Life and Times
• Annual survey, began in 1998
• Monitor the attitudes and behaviour of people in Northern Ireland
• Time-series and public record of attitudes and behaviour
• Descendent of Northern Ireland Social Attitudes Survey 1989-1996
• Modular format : 4-5 per year, but always community relations


Young Life and Times
• Annual survey of young people
1998-2000: 12-17 year olds living in household of NILT respondent
2003 onwards: 16 year olds
• 6-7 modules per year
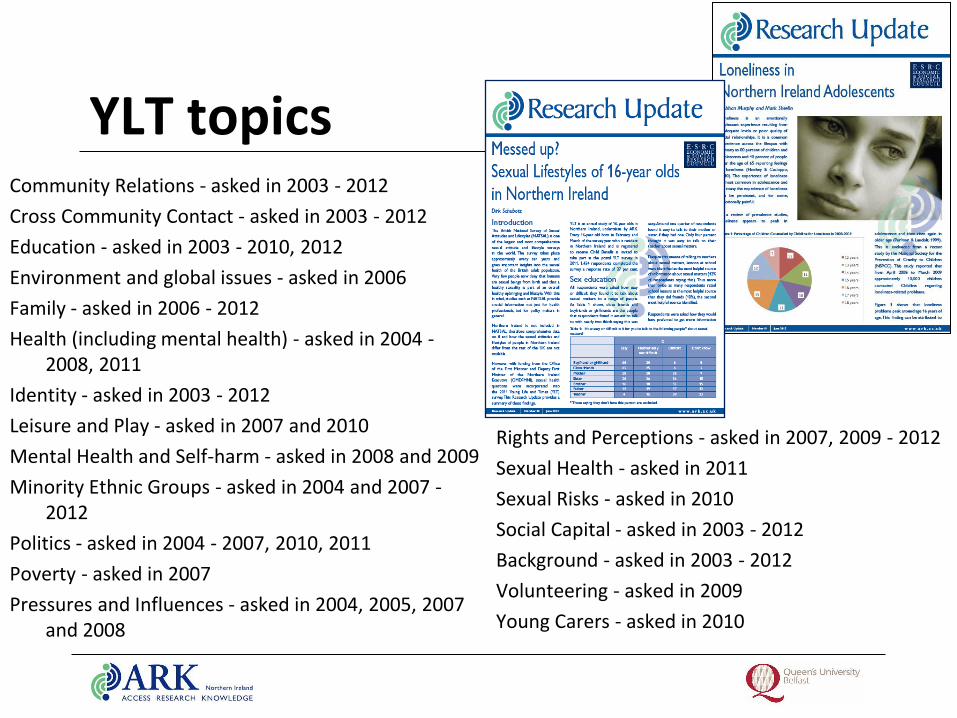
YLT topics Community Relations - asked in 2003 - 2012
Cross Community Contact - asked in 2003 - 2012
Education - asked in 2003 - 2010, 2012
Environment and global issues - asked in 2006
Family - asked in 2006 - 2012
Health (including mental health) - asked in 2004 - 2008, 2011
Identity - asked in 2003 - 2012
Leisure and Play - asked in 2007 and 2010
Mental Health and Self-harm - asked in 2008 and 2009
Minority Ethnic Groups - asked in 2004 and 2007 - 2012
Politics - asked in 2004 - 2007, 2010, 2011
Poverty - asked in 2007
Pressures and Influences - asked in 2004, 2005, 2007 and 2008
Rights and Perceptions - asked in 2007, 2009 - 2012
Sexual Health - asked in 2011
Sexual Risks - asked in 2010
Social Capital - asked in 2003 - 2012
Background - asked in 2003 - 2012
Volunteering - asked in 2009
Young Carers - asked in 2010
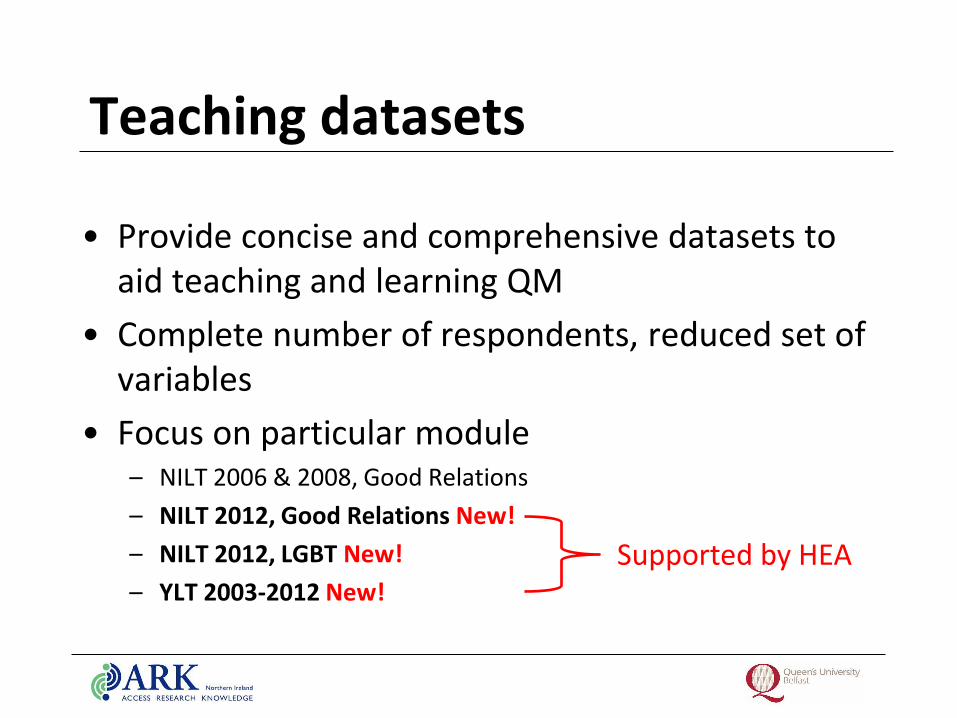
Teaching datasets
• Provide concise and comprehensive datasets to aid teaching and learning QM
• Complete number of respondents, reduced set of variables
• Focus on particular module – NILT 2006 & 2008, Good Relations
– NILT 2012, Good Relations New!
– NILT 2012, LGBT New!
– YLT 2003-2012 New!
Supported by HEA
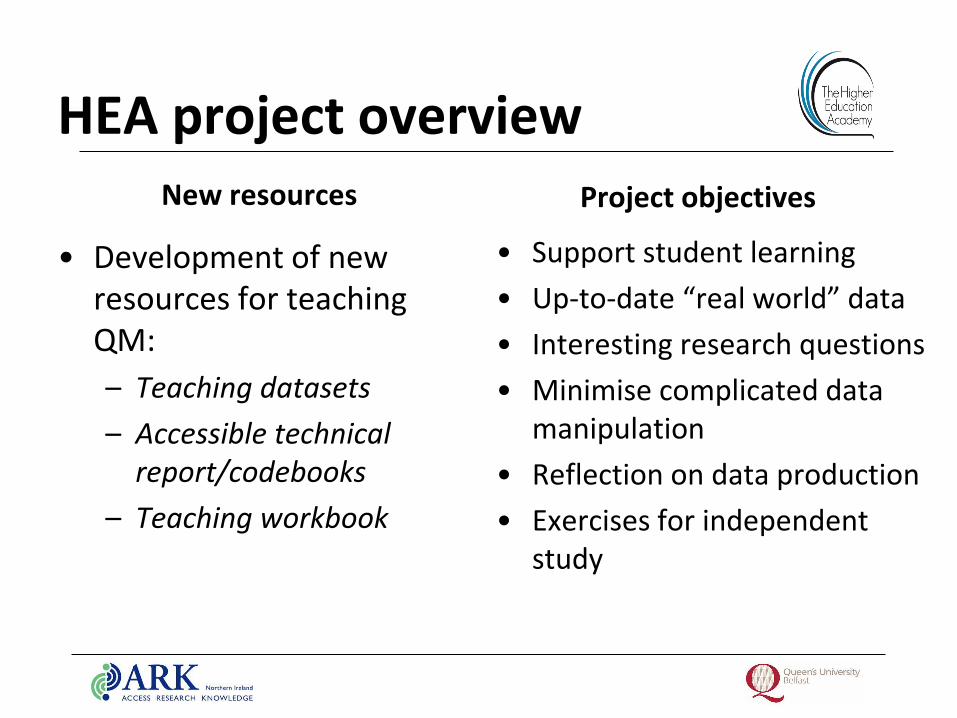
HEA project overview New resources
• Development of new resources for teaching QM:
– Teaching datasets
– Accessible technical report/codebooks
– Teaching workbook
Project objectives
• Support student learning
• Up-to-date “real world” data
• Interesting research questions
• Minimise complicated data manipulation
• Reflection on data production
• Exercises for independent study

Teaching QM
ASA Guidelines
• Real-world data
• Conceptual understanding vs knowledge of procedures
• Foster active learning
• Technology to aid understanding & data analysis
• Assessments to improve and evaluate student learning
Developments in teaching QM
• Push from traditional lectures to more activity-based formats (Scott & Green 2012)
• What helps learning: group work in/out of class, explaining and communicating, frequent rapid feedback, problem
formulation (Moore 1997)

Anxiety
Anxiety which occurs when a student
encounters statistics in any form
and at any level
(Onwuegbuzie and Wilson
2003)
Confidence
Perceived lack of
confidence/ability?
(Ruggeri et
al. 2008)
Surprise
46% of students surveyed
were aware of
the statistical content of
their psychology
degree
(Ruggeri et al. 2008)
Relevance
Do I need research
skills?
(Murtonen et al. 2008)
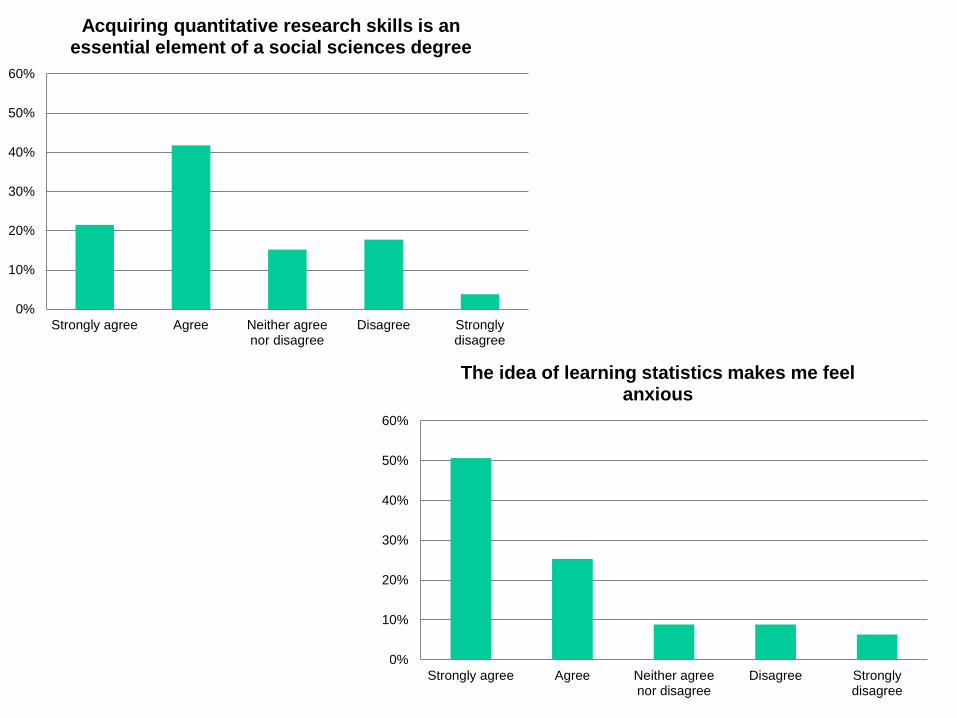
0%
10%
20%
30%
40%
50%
60%
Strongly agree Agree Neither agreenor disagree
Disagree Stronglydisagree
Acquiring quantitative research skills is an essential element of a social sciences degree
0%
10%
20%
30%
40%
50%
60%
Strongly agree Agree Neither agreenor disagree
Disagree Stronglydisagree
The idea of learning statistics makes me feel anxious

Creating QM resources
For teaching
• Structure/set-up
• Enabling range of data analysis
• New variables (scale)
• Simplification of variables
• Data cleaning to remove “difficult” responses
• Basic workbook
For research
• “Real-life” dataset
– range of topics/limited duplication
– all survey respondents
• Documentation:
– Accessible technical report
– Codebook

intuitive
variable
names
detailed
information from
questionnaire
value labels
set up
following
conventions correct level of
measurement
Structure
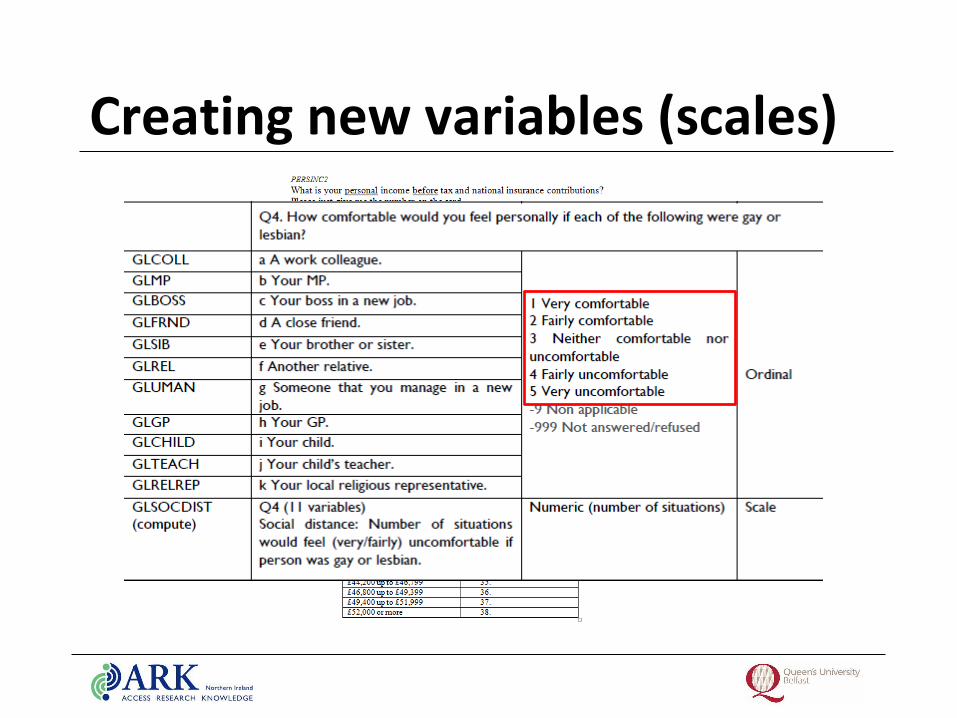
Creating new variables (scales)

Simplification of variables
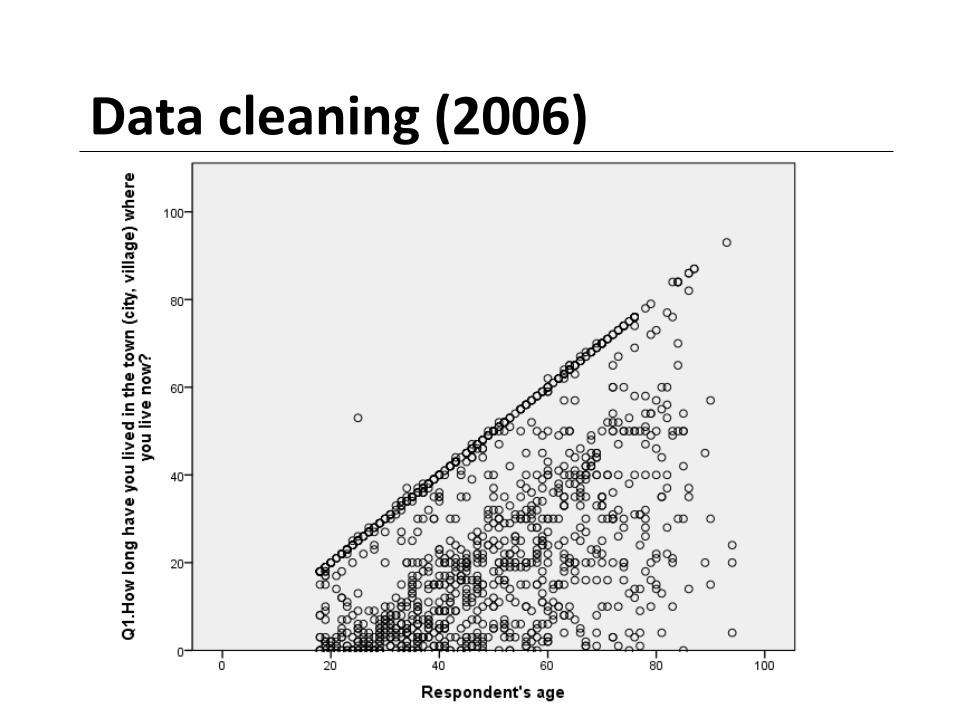
Data cleaning (2006)
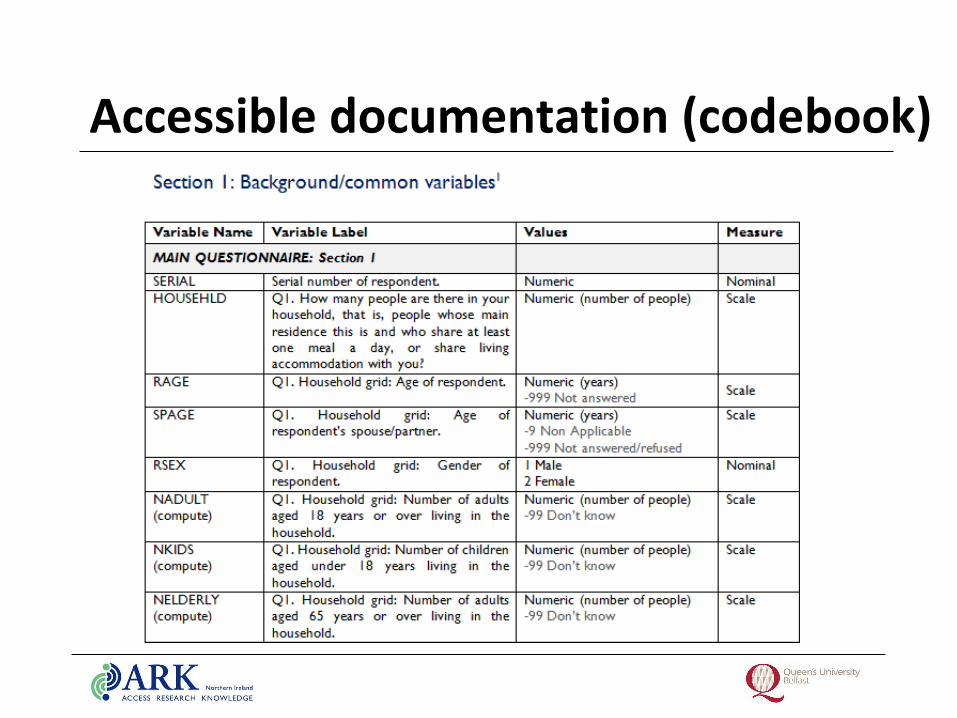
Accessible documentation (codebook)
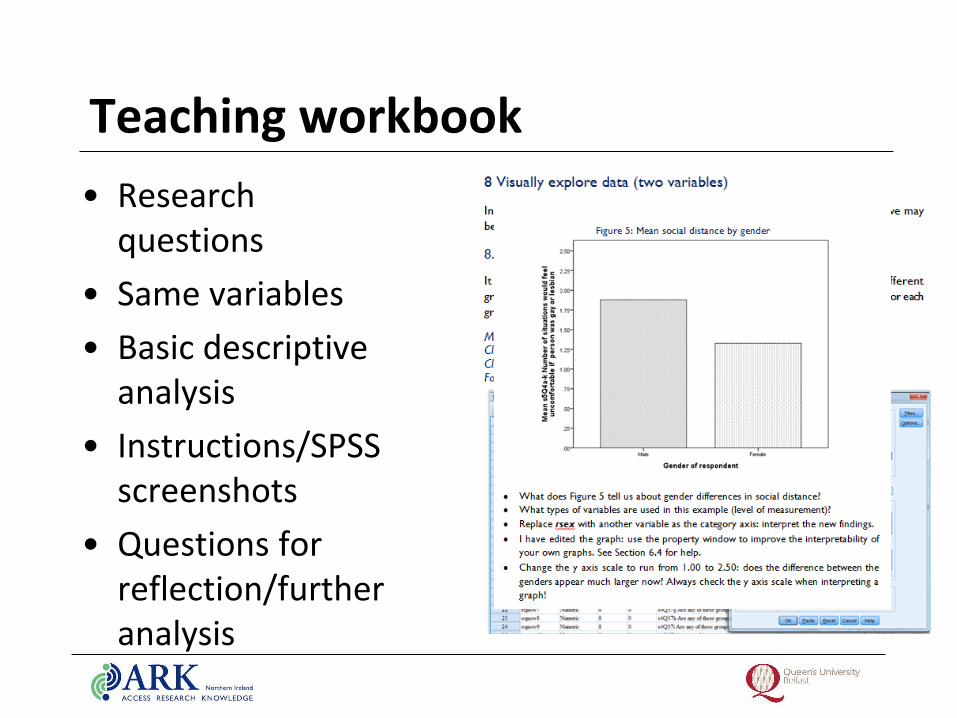
Teaching workbook
• Research questions
• Same variables
• Basic descriptive analysis
• Instructions/SPSS screenshots
• Questions for reflection/further analysis

QM @ QUB
• Core module
• Secondary data analysis
• Approx. 100 Criminology, Sociology and Social Policy students – Large group teaching
– Small group teaching (SPSS)
Researching
perceptions
about
neighbourhood
“neutrality”
Researching
sexuality

“Real-world” research
Research sexual orientation and attitudes to sexuality in NI:
– Issues of measurement
– Sensitive questions
– Attitudinal research
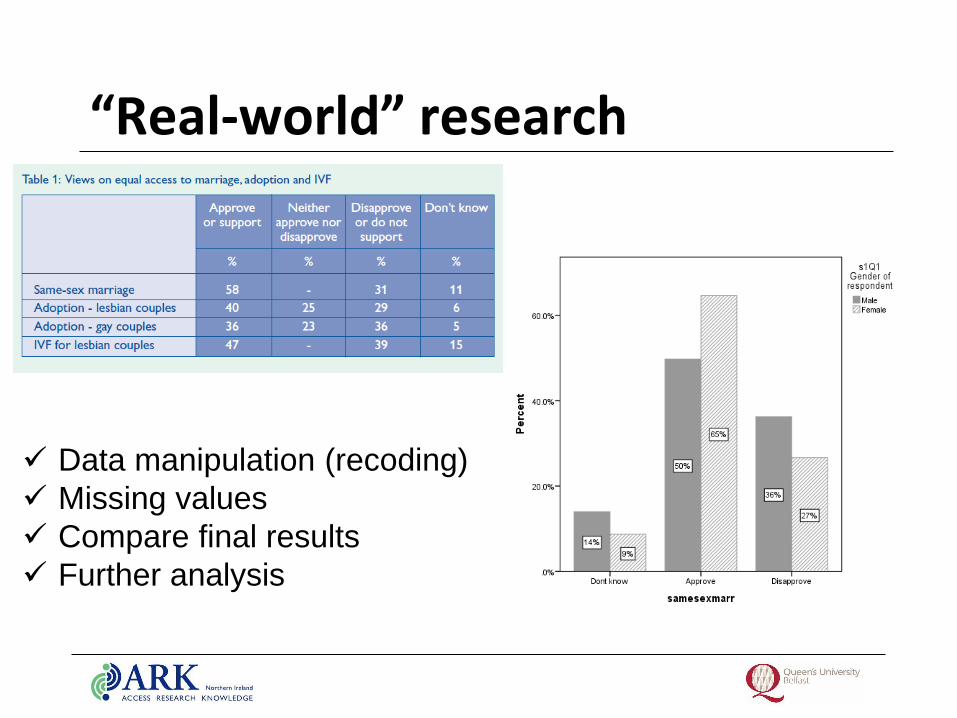
“Real-world” research
Data manipulation (recoding)
Missing values
Compare final results
Further analysis

Possible research questions
research
Minority ethnic communities/
culture/economy
Young people’s views on
community relations
(2003-12)
Recent riots/
community relations
Sexuality and family

Resources online @ ARK
NILT 2012
• Teaching datasets – Good Relations
– LGBT
• Accessible documentation
YLT 2002-12
• Merged teaching dataset
• Accessible documentation
Teaching workbooks available via email
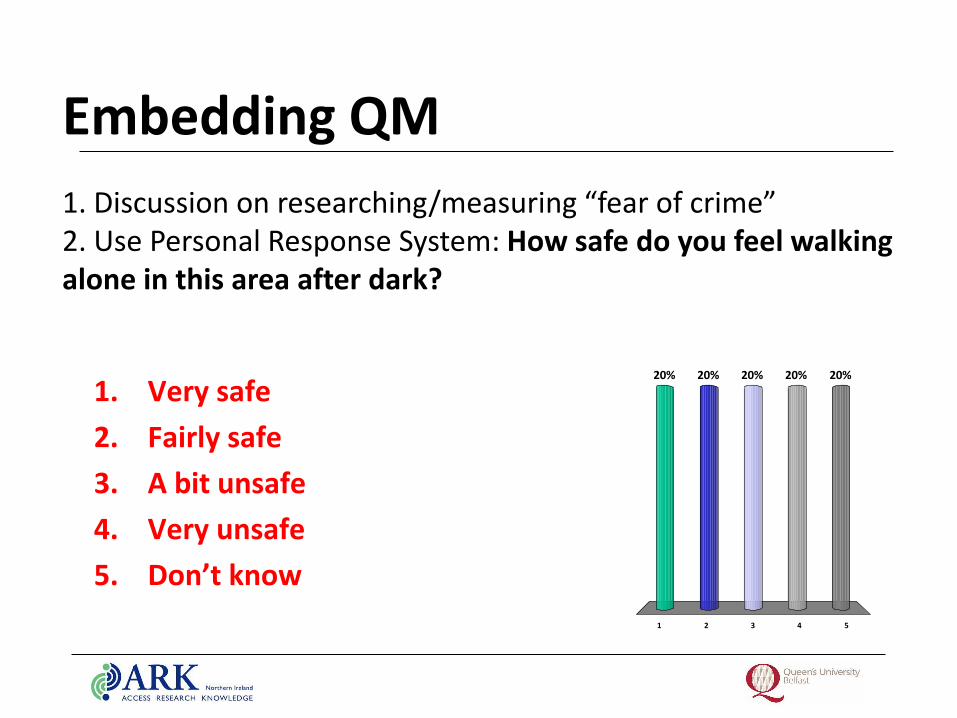
Embedding QM
1. Very safe
2. Fairly safe
3. A bit unsafe
4. Very unsafe
5. Don’t know
1 2 3 4 5
20% 20%20%20%20%
1. Discussion on researching/measuring “fear of crime” 2. Use Personal Response System: How safe do you feel walking alone in this area after dark?
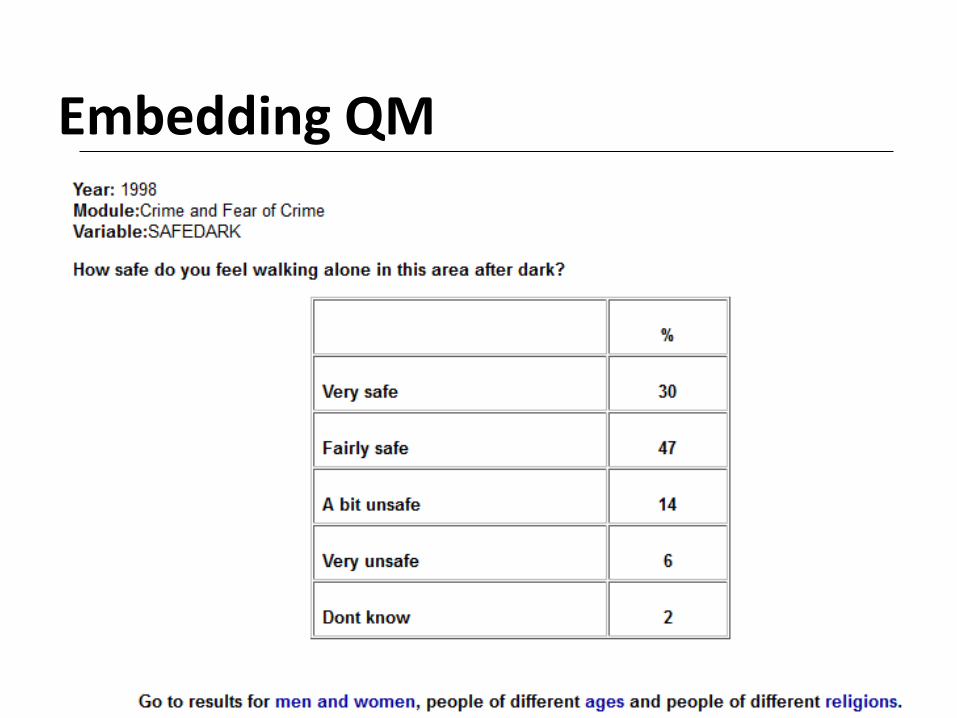
Embedding QM

Queen’s Q-Step Centre