Embed Size (px)
Citation preview

S
Turning Infographics Into Effective Teaching Tools
Technology in Education Conference May 19 2014
Karen Megay Nespoli

Getting to know you
Name Department
Why you are interested in infographics?

Introduction to infographics
Types of infographics
Creating infographics
Ideas for using infographics in the classroom

Infographics are visual representations of
Information data knowledge
Infographics
Used where complex information needs to be
explained quickly and clearly such as in signs, maps,
journalism, technical writing and education.

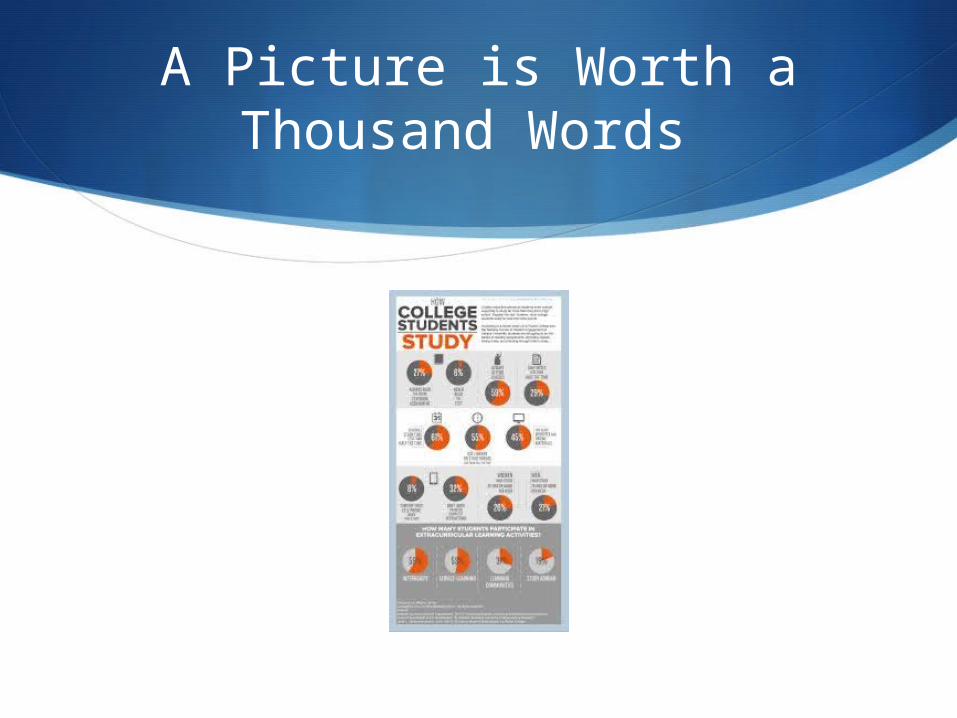
A Picture is Worth a Thousand Words

Learners are constantly bombarded by information. A deluge of messages are conveyed through the use of pictures, photographs, and video. Learning how to “read” and evaluate visual media is a skill that can be taught, just as reading is taught.
Students must also learn to express their understandings through visual representations.
Writing, research, and planning, all while combining digital and traditional text forms.
Visual Literacy

Why use infographics?
Make it easy to understand complicated concepts or how-to perform tasks
Dynamically combine words and picture in ways that are visually appealing
Stand alone
Reveal new information
Are universally understood
Who will find infographics an engaging way to learn course material?
Fact oriented learners
Data enthusiasts
Creative minds
S
Types of Infographics

Statistical

Timeline

Informational

Process

Research Based

Summary

Sources of infographics
Government Organizations

Professional Organizations

What makes a good infographic?

Purpose
The audience should be able to infer the author’s purpose, draw conclusions based on the evidence, and summarize the gist of the infographic

Style
The graphic components including the layout, text, symbols and color scheme should address the tone of the author.

Evidence
Data and text must be cited and appropriately integrated in the design to support the reader’s understanding.

Format
The infographic can be represented in a static format, designed for print, or a dynamic medium, allowing for interactivity.
A Picture is Worth a Thousand Words

Creating Infographics

Online Infographic Tools
PiktoChart (www.picktochart.com) Free tools with simple advanced features and a variety of templates
Glogster (http://edu.glogster.com) Interactive posters
PowerPoint - Free templates to use within a PowerPoint Presentation
http://blog.hubspot.com/blog/tabid/6307/bid/33499/The-Marketer-s-Simple-Guide-to-Creating-Infographics-in-PowerPoint-Template.aspx

Online Infographic Tools
Easelly (www.easel.ly) Free tool for designing infographics from pre-designed templates. Easiest of all of the infographic tools.
InfoGram ( www.infogr.am) Simple no cost tool for designing information and data visualizations with interactive content.
Visually (www.visual.ly) A professional design marketplace with examples of infographics in all subjects.

Infographics
Can support reading comprehension and writing while strengthening critical thinking and synthesizing skills.
Can be useful for connecting literacy content with science, history or math lessons.
Can be used as a visual resume
Can be used as creative formative or summative assessment to showcase a student’s mastery of knowledge.

Using infographics in the classroom to:
review the steps of a science experiment
talk about a character’s decision in literature
highlight important historical events
compare ways of looking at data
discuss the historical setting of a book
pre-teach a new subject
present a new idea or topic

Resources
Kathy Schrock’s Guide to Everything

Resources
Davis, M. & Quinn, D. (January, 2014) Visualizing text: The New Literacy of Infographics. Reading Today.
Kathy Schrock’s Guide to Everything http://www.schrockguide.net/infographics-as-an-assessment.html
TeachThought: A Primer On Infographics in the Classroom http://www.teachthought.com/literacy-2/a-primer-on-infographics-in-the-classroom/
Teaching with Infographics http://www.slideshare.net/srichter/teaching-with-infographics-27211531

Photo Credits
Agenda icon - Creative Commons via partido-pirata.blogspot.com
Getting To Know You http://www.cartoonstock.com/
Student infographic - http://www.classesandcareers.com/
Infographic samples - Google images