Embed Size (px)
Citation preview
Myanmar Pulses Production, Trade and Technology: Issues and Prospects
• San Thein and San San Yi • Contact Email: [email protected]
• Paper presented to “Pulses for Sustainable Agriculture and Human Health”
• May 31- June 1, 2016
• IFPRI, NASC Complex, Pusa, New Delhi

Pulses and Bean Sector in Myanmar
Leading country in bean and pulses among ASEAN nations
Second largest sown area after rice (4.45 million ha),
occupying 21 % of total crop sown area
Over 40% export earning of total agricultural commodity is
contributed by pulses alone
18 kinds of pulses, including other pulses, are grown
Sown in monsoon and post monsoon season
Most of the pulses (black gram, green gram and pigeon pea)
grown in Myanmar are for export
Important vegetable protein source for the daily
consumption of Myanmar people.
Some pulses grown for green manure, soil conservation and
by-products are valuable for animal feed and fuel
Legume crop can be easily grown than cereal crops
Legume crop need less water than cereal (1 ac of rice used
water=3 – 4 acre for pulses)

Comparison of Export Value and Volume of Important Crops for 3 Years
No Crops
Name
2012-2013 2013-2014 2014-2015
Volume Value
($- million) Volume
Value
($- million) Volume
Value
($- million)
M. Ton % Million % M. Ton % Million % M. Ton % Million %
1 Rice & its
products 1470680 34.66 568.94 23.53 1233367 27 460.696 19 1812332 33.26 644.729 25.31
2 Pulses
crops 1418488 33.43 912.05 37.72 1369233 30 948.608 40 1323679 24.29 1083.434 42.54
3 Maize 565111 13.32 184.44 7.63 1061028 23 286.513 12 1360477 24.97 394.528 15.49
4 Oil Crops 197719 4.66 327.61 13.56 192332 4 354.999 15 91069 1.67 180.890 7.10
5 Rubber 103151 2.43 290.14 12.00 83715 2 195.082 8 77010 1.41 111.048 4.36
6 Fruits &
vegetables 444121 10.47 104.43 4.32 612242 13 96.053 4 710104 13.03 108.141 4.25
7 Kitchen
Crops 43993 1.03 29.99 1.24 56512 1 27.178 1 74801 1.37 24.334 0.96
Total 4243263 100 2417.58 100 4608429 100 2369.1 100 5449472 100 2547.104 100
2012-13 2014-15 2013-14
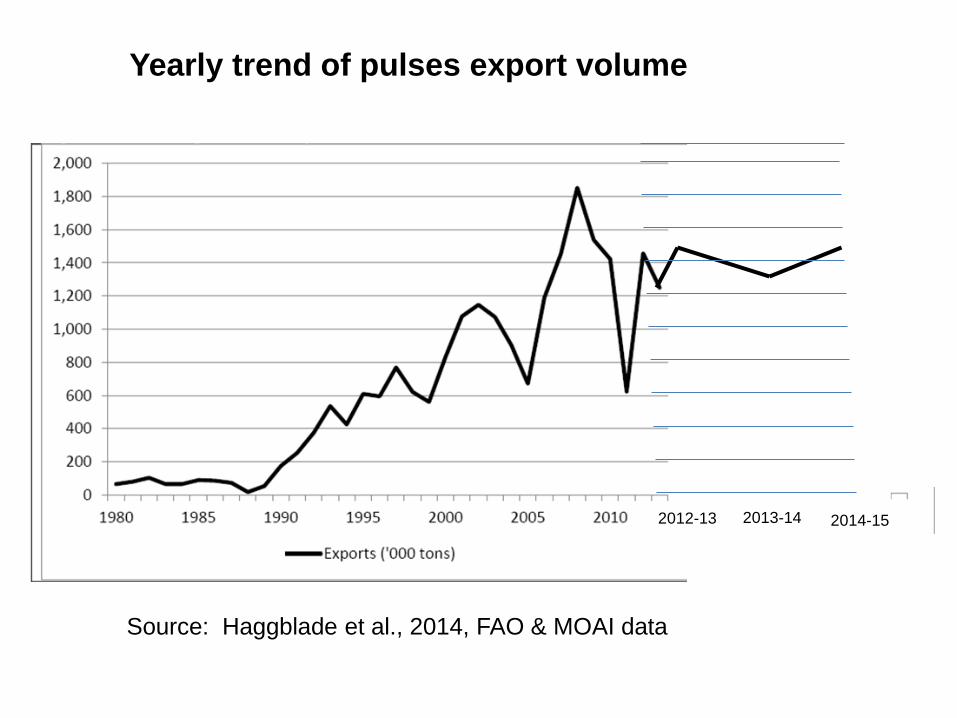
Yearly trend of pulses export volume
Source: Haggblade et al., 2014, FAO & MOAI data

Trends in composition of Myanmar pulses export
Pulses 1990 1995 2000 2005 2010 2013
Black gram 27 117 235 407 615 658
Green gram 15 128 145 144 303 302
Pigeon pea 110 89 89 193 296
Chick pea 40 40 47
X 000 MT
Okatomo, 2008; E Trade (2014); Soe Win Maung, 2014
Last 8 yrs average for export value: BG - 43%, GG – 28 %, PP –
17%, Other pulses – 12 %

(MT)

Sr. Varieties Myanmar
name
Total (million)
Sow
(ha)
Harvest
(ha)
Yield
Rate
(mt/ha)
Production
(mt)
1 Black gram Matepe 1.098 1.098 1.44 1.577
2 Green gram Pedisein 1.173 1.173 1.31 1.515
3 Pigeon pea Pesingone 0.619 0.619 1.36 0.84
4 Chick pea Kalape 0.378 0.378 1.6 0.604
5 Cow pea Pelun 0.145 0.145 1.29 0.187
6 Soy bean Peboke 0.151 0.151 1.52 0.228
7 Sultapya Sultapya 0.11 0.11 1.28 0.141
8 Bocake Bocake 0.133 0.133 1.26 0.168
9 Sultani Sultani 0.013 0.013 1.41 0.018
10 Butter bean Htawbatpe 0.064 0.064 1.4 0.089
11 Rice bean Peyin 0.051 0.051 1.13 0.057
12 Duffin bean Pebyugale 0.013 0.013 1.12 0.014
13 Lab Lab bean Peygyi 0.122 0.122 1.32 0.162
14 Lima bean Pegya 0.015 0.015 1.08 0.016
15 Garden pea Sadawpe 0.054 0.054 1.33 0.071
16 Lentil bean Peyaza 0.002 0.002 1.87 0.001
17 Peanauk Penaok 0.139 0.139 1.01 0.14
18 Other pulses Others 0.247 0.272 1.14 0.311
Total 4.527 4.552 1.36 6.139
Black gram Green gram Pigeon pea Chick pea
Cow pea Soy bean Sultapya Bocake
Sultani Butter bean Rice bean Duffin bean
Lab Lab bean Lima bean Garden pea Lentil bean
Peanauk Other pulses
Pulses and Beans Production in Different
Varieties for 2014-2015
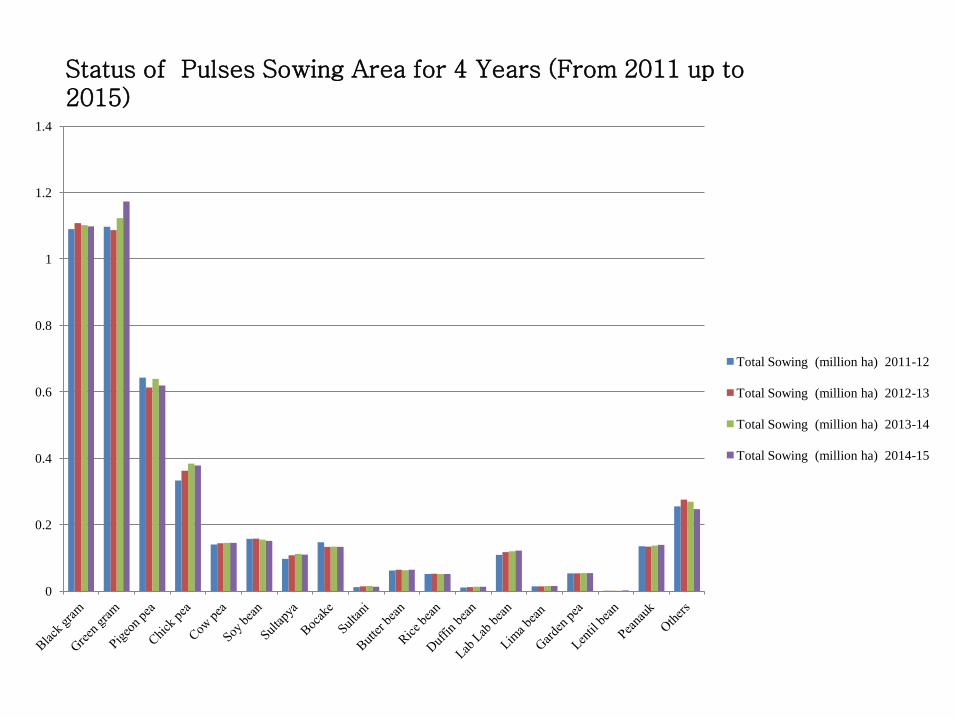
Status of Pulses Sowing Area for 4 Years (From 2011 up to 2015)
0
0.2
0.4
0.6
0.8
1
1.2
1.4
Total Sowing (million ha) 2011-12
Total Sowing (million ha) 2012-13
Total Sowing (million ha) 2013-14
Total Sowing (million ha) 2014-15

Geographic distribution of area cropped in pulses in Myanmar 2015
Sr Location Pulses Sown area
Area (Acre) Percent
Upper Myanmar
1 Sagaing 1026977 23%
2 Magway 858922 19%
3 Mandalay 584498 13%
4 Shan(South) 93588 2%
5 Shan(North),(East),(Chin),(Kachin) 110531 2%
Subtotal 2674516 59%
Lower Myanmar
6 Bago 803645 18%
7 Ayeyarwady 683557 15%
8 Yangon 173624 4%
9 Kayin, Kayah, Mon, Rakhine, Tanintharyi 149154 3%
10 Naypyitaw 69544 2%
Subtotal 1879524 24%
Total Myanmar 4,554,040 82%

Crops
Cost and Benefit Ratio
2012-13
2013-14
2014-15
2015-16
(Expect)
Black gram 1: 1.96 1: 2.03 1 : 3.18 1 : 2.06
Green gram 1: 1.44 1: 1.85 1 : 2.00 1 : 2.07
Soybean 1: 1.91 1: 1.93 1: 2.41 1 : 1.30
Pigeon pea 1: 1.45 1: 1.64 1 : 2.38 1 : 2.65 Cow pea 1: 1.52 1: 1.60 1 : 1.76 1 : 1.49
Chick pea 1: 1.86 1: 1.86 1 : 2.79 1 : 2.05
Cost -Benefit Ratio of Pulses

11
Net margin,
$/ha
Labor productivity,
$/day
Production costs,
$/ha
Labor use,
days/ha
Monsoon paddy 114 4.75 510 103
Dry season paddy 246 9.20 626 63
Black gram 267 9.29 237 45
Green gram 581 15.92 355 51
Chickpeas 141 6.85 266 42
Groundnuts 324 8.32 421 65
Sesame 202 8.54 217 44
Sunflower seeds 377 15.68 121 30
Comparative cost, labour productivity and grow margin in
cultivation of paddy, pulses and oil seed crops, 2015-1016
Source: Sergiy Zora, The World Bank, May 2016. Report Launch May 11, 2016,
Yangon, Myanmar.

Black gram yearly price movement in two markets vs. 5 Yr. average: E trade, 2015
Price movement, Yangon Year Yearly mean
Yangon market price of Black gram , USD/Mt
5- year average price, 2008-12
2008 443 631
2009 613 631
2010 842 631
2011 703 631
2012 553 631
2013 563 631
2014 Up to
October
724 631
Price movement, Mumbai Year Yearly mean
Mumbai market price of Black gram , USD/Mt
5- year average price, 2008-12
2008 569 755
2009 743 755
2010 1007 755
2011 836 755
2012 623 755
2013 610 755
2014 up
to October
788 755
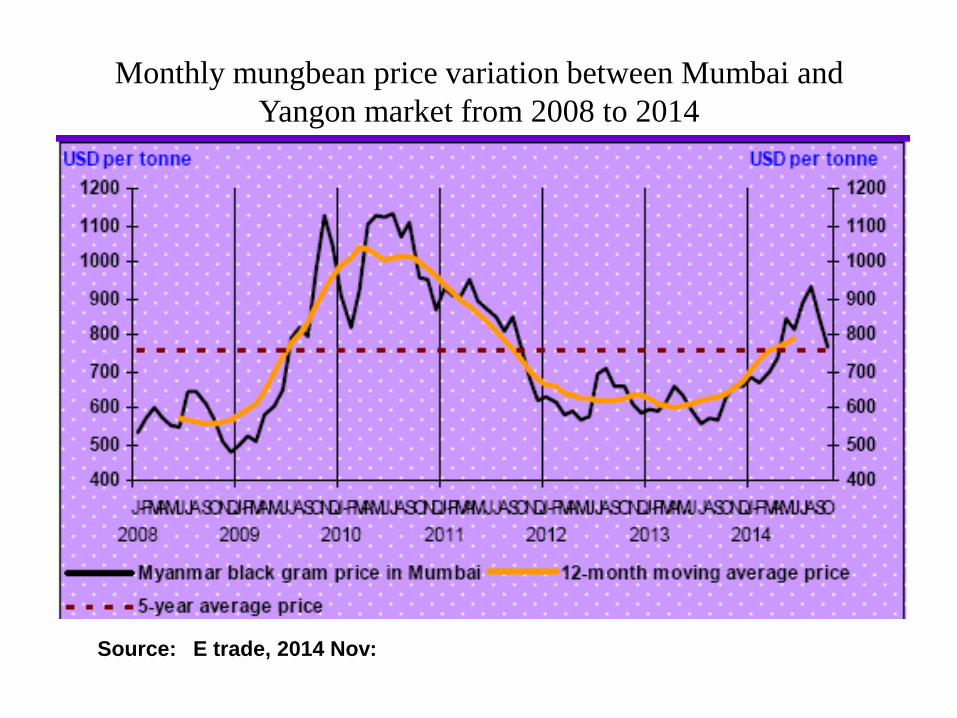
Monthly mungbean price variation between Mumbai and
Yangon market from 2008 to 2014
Source: E trade, 2014 Nov:

Year Annualize
price volatility
2008 40.03 %
2009 36.99 %
2010 48.34 %
2011 22.15 %
2012 34.06 %
2013 28.02 %
2014 25.40 %
Annualize black gram price volatility in Yangon
from 2008 to 2014 (up to October)
E Trade, 2014

0
200
400
600
800
1000
1200
1400
1600
1800
2000
Pulses Price (FOB Yangon), last week of every month, Jan 2015 to April, 2016, Soe Win Maung, 2016
Black gram Pigeon pea Green gram Chick pea

0
200
400
600
800
1000
1200
1400
1600
1800
2000
Jan Feb Mar Apr May Jun Jul Aug Sep Oct Nov Dec Jan Feb Mar Apr
USD
/mt
Pulses Price (FOB Yangon) , (Jan,2015 - Apr, 2016) mean monthly value, Soe Win Maung, 2016
Black gram Pigeon pea Green gram Chick pea

Effect of Indian Market Demand on Distribution of Myanmar Black gram Export by Month, 2015
• Soe Win Maung, 2016
Sudden High Rise of Indian Market Demand
• The characteristic of this budget year 2015-2016 is the record high surge of pulses prices due to Indian demand pull.
• It affected highest ever price level in Myanmar pulses market.
• In black gram, fob Yangon price reached its highest price level of 1,820 USD / Mt in October 2015, which is more than the double of price level of 860 USD / Mt in January, 2015.
• Likewise, pigeon pea price skyrocketed from 760 to 1,570 USD / Mt in the same period.
• As a result, distribution of pulses export showed faster and larger export occurred in the early marketing season in comparison with the regular trade pattern.
• The prices of other pulses showed not much fluctuated like black gram and pigeon pea.

Outlook for Pulse Export
• In previous years, Myanmar encountered widespread flood, abnormal hail storm, ElNino effect, stress of unfavourable soil moisture, etc.
• Pulses output in 2015-16 is estimated to decrease from 6.5 to 5.6 million Mt, by 8 % decline.
• Outlook for pulses production in Myanmar for 2016-2017 is to restore production around 6.1 million MT and to export about 1.3 million Mt.
• Promotion of export is one of major priority of the New Government. It aims to triple the export earning of the country this year.


Opportunities and Barriers
• In the new Democratic government, business environment becomes more favourable. Myanmar exporters can enjoy GSP benefits for the products of their country.
• But for most cases, there are still barriers such as fulfillment of the requirements in quality standard, SPS measures, certification, traceability system, etc.
• Trade financing and high transport costs, limited access to credit for business expansion must be4 areas of further improvement.


Comparison of Sowing Area and High Yielding Variety Area in 2014-2015 (Pulses)
Crop Sowing Area-ac
Sowing HYV-ac
Area %
Black Gram 2712,047 10,265 0.38
Green Gram 2899,154 14,361 0.50
Pigeon Pea 1529,136 32,853 2.15
Chick Pea
934,186
25,674
2.75
Ground nut 2346,187 32,256 14
Other Pulses > 0.02 %
Use of improved seed is severely limiting in pulses cultivation.
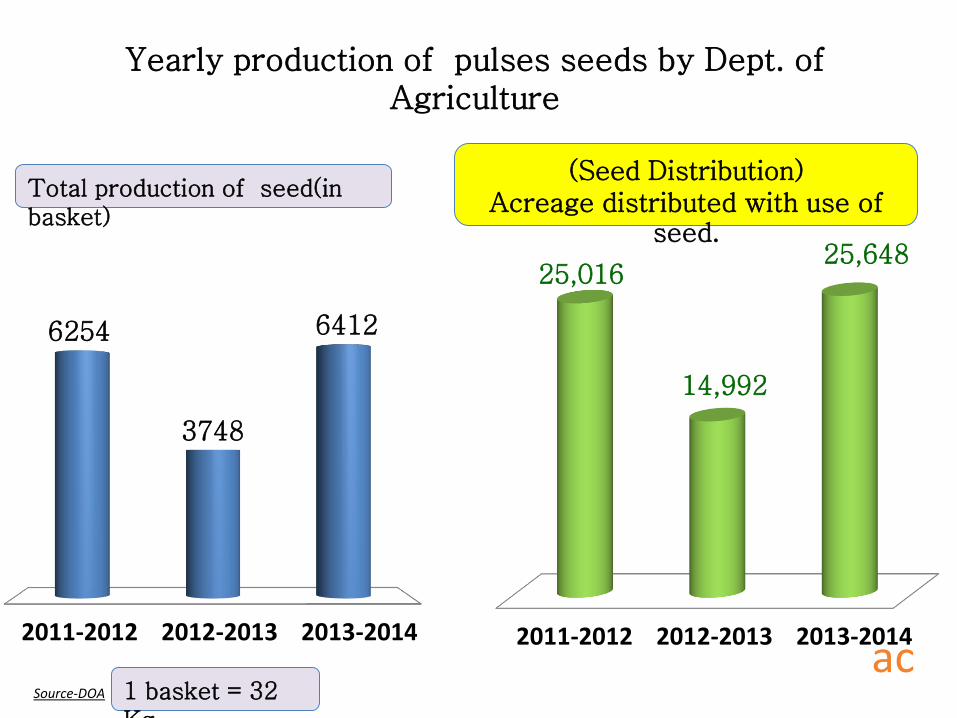
Yearly production of pulses seeds by Dept. of Agriculture
6254
3748
6412
2011-2012 2012-2013 2013-2014
25,016
14,992
25,648
2011-2012 2012-2013 2013-2014 ac
(Seed Distribution) Acreage distributed with use of
seed.
Source-DOA
Total production of seed(in basket)
1 basket = 32 Kg

Way forward by Agriculture Department
• Enormous scope for introduction and replacement of old cultivars across pulse crops (BG, GG, Chick pea and PP)
• Strengthening formal/informal seed systems is the key for further enhancing quality productivity across all crops
• Tracking of seed entrepreneurs/capacity building and their seed multiplication process, learning lessons from those experiences is highly valuable
• Focused crop improvement for development of short-duration, disease resistant and climate smart cultivars/adaptation to climate change

Breeder Seeds
Foundation Seeds
Registered Seeds
DAR
Seed company
Normal farmers
Market demand, Consumer
Preference and local
Adaptability
Certified Seeds
DOA
Contact farmers
Seed Flow/ Procedure of Seed Production

DOA Proposed Public Private Partnership for Seed
PUBLIC SECTOR
DAR&DOA
Exte; Seed
National Seed
Committee
Seed Law
SEED CERTIFICATION BODY
Breeder seed
Foundation seed
Registered seed
Private Community Leading Companies (CS1)
Farmers Community Based Seed Multiplication (CS2, in VSB & FBS)
Seed marketing based on national and international demand
As for quality seed
Distribute with systematic Seed/ storage/ packaging
Seed Multiplication Technology by Seed/Ex;
Staffs-DOA

Pulses Consumption Pattern
• Monthly Household Expenditure Survey indicated that average monthly expenditure for pulses for the whole Union is 1.75 percent of total expenditure including food and non-food items. The monthly expenditure on pulses was highest in Mandalay Region (Dry Zone) and lowest in Rakhine State (Coastal region).
• Source: CSO (2012)
• High export demand has generated rural household income increase but its effect on small holder livelihood in the dry zone still is not well understood.

Stepping up from the Primary Industry Status?
• Pulses total are currently One Billion export earning crops for the country. BG or GG offers about 1,000 USD /Mt of output for farmer.
• Land resource allocation has led farmers to focus on monsoon paddy > pulses in post monsoon. It becomes more attractive to farmers as compared to sugarcane crop.
• However, pulses business offer low degree of agro-industrialization. Myanmar agriculture sector may remain as primary industry for some decades.

နနနနနန
• နနနနနနနနနနနနနနနနနနန နနနနနနနနနနနနနနနနနနနနနနနနနနနနနန နနနနနန နနနနနနနနနနနနနနနနနနနနနနနနနနနနနနနနနနနနနနနနနနနနနနနန
• နနနနနနနနနနနနနနနနန နနနနနနနနနနနနနနနနနနနနနနနနနနနနနနနနနနနနနနနနန နနနနနနနနနနနနနနနနနနနနနနနနနနနနနနနနနနနနနနနနနနနနနနန နနနနနနနနနန နနနနနနနနနနနနနနန နနနနနနနနနနန နနနနနနနနနနနနန နနနနနနနနနနနနနနနနနနနနနနနနနနနနနန နနနနနနနနနနနနနနနနနနနနနနနန