Embed Size (px)
Citation preview

Pulses in Bangladesh for Nutritional
Security
Akhter Ahmed
International Food Policy Research Institute
Conference: Pulses for Sustainable Agriculture and Human Health
New Delhi, 31 May – 1 June 2016

Data for analysis: IFPRI’s panel
household surveys in Bangladesh
IFPRI’s Bangladesh Integrated Household Survey (BIHS): the most comprehensive, nationally representative rural household survey to date. Largest panel survey conducted in 2011/12 and 2015
BIHS sampling is statistically representative
nationally of rural Bangladesh
rural areas for each of the 7 administrative divisions
BIHS is the first nationally representative household survey in the country that collected data on intrahousehold food consumption
The dietary intake module of the survey used a combination of 24-hour food recall and food weighing methods to estimate consumption quantities of various food items by individual household members


Pulses account for a small share of protein in
diet, but the share has increased recently
4
3.8
56.5
4.3 2.4 1.6
3.7
13.6
1.1
11.0
5.7
50.9
5.0 3.2 2.8
4.4
12.9
2.1
10.6
0
10
20
30
40
50
60
Pulses Rice Wheat Other cereals
Diary Meat Fish Egg Vegetables
Pe
rce
nt
of
tota
l pro
tein
inta
ke
2011/12 Baseline 2015 Midline Source: IFPRI-PRSSP 2011-2015 BIHS data

Remarkable change in growth rates:
Rice and pulses
2.4
-13.5
5.7
-11.9
3.3 1.8
-15
-10
-5
0
5
10
Rice Pulses
Annual growth rates, five years before then (%)
Area Production Yield
-0.3
7.8
0.3
10.6
0.6
2.6
-2
0
2
4
6
8
10
12
Rice Pulses
Annual growth rates, last five years (%)
Area Production Yield
Rice: From 2005-06 to 2009-10 Pulses: From 2004-05 to 2008-09
Source: Bangladesh Bureau of Statistics, Various years
Rice: From 2010-11 to 2014-15 Pulses: From 2009-10 to 2013-14
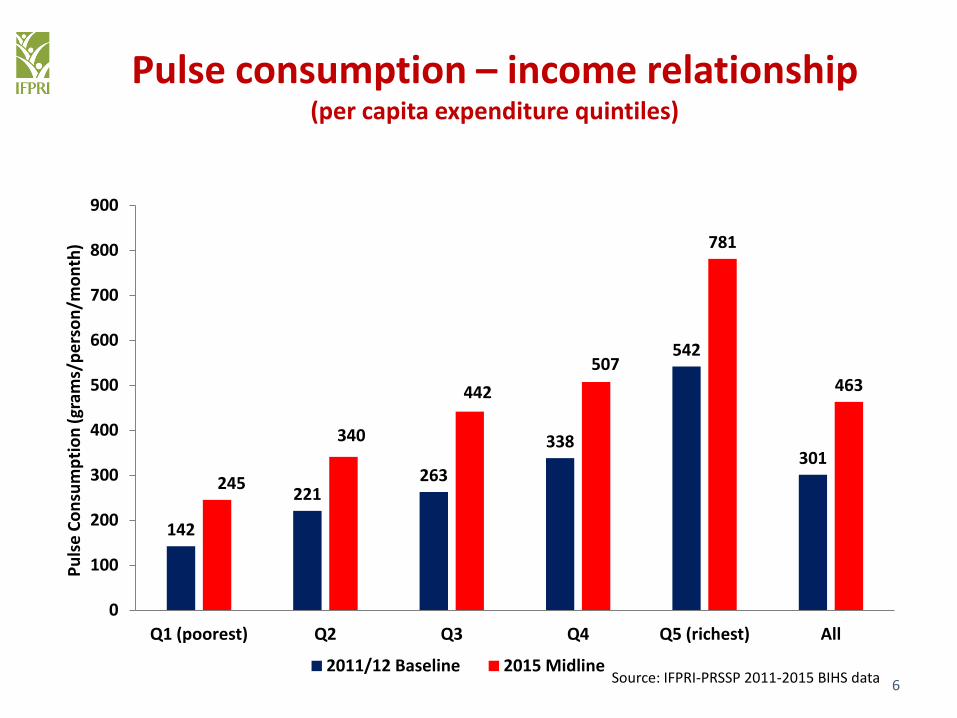
Pulse consumption – income relationship (per capita expenditure quintiles)
6
142
221 263
338
542
301
245
340
442
507
781
463
0
100
200
300
400
500
600
700
800
900
Q1 (poorest) Q2 Q3 Q4 Q5 (richest) All
Pu
lse
Co
nsu
mp
tio
n (
gram
s/p
ers
on
/mo
nth
)
2011/12 Baseline 2015 Midline Source: IFPRI-PRSSP 2011-2015 BIHS data

Pulse consumption – income relationship by selected types of pulses
7
114
169
231
291
445
17 21 28 23 33 35 30 37 39 31 7 11 16 12
40
-50
50
150
250
350
450
Q1 (poorest) Q2 Q3 Q4 Q5 (richest)
Mo
nth
ly P
uls
e C
on
sum
pti
on
in g
ram
s
Lentil Balck gram Kheshari Mung
Source: IFPRI-PRSSP 2011-2015 BIHS data

Pulse producers consume more pulses than non-producers
8
475
558
290
456
0
100
200
300
400
500
600
2011/12 Baseline 2015 Midline
Pu
lse
Co
nsu
mp
tio
n (
gram
s/p
ers
on
/mo
nth
)
Pulse producers Non-Producers Source: IFPRI-PRSSP 2011-2015 BIHS data

Intrahousehold pattern of protein intakes from pulses
by age groups
9
33
50
71
80
86
79
69
41
72
98
112 111 105
96
0
20
40
60
80
100
120
1-<6 years 6-<11years 11-<18years 18-49 years 50-64years 65+ years all
Pro
tein
inta
kes
fro
m p
uls
es
(gra
ms/
pe
rso
n/m
on
th)
2011/12 Baseline 2015 Midline Source: IFPRI-PRSSP 2011-2015 BIHS data

Gender-disaggregated intrahousehold protein intakes
from pulses in 2015
10
40
75
106
121 124
109
101
43
69
91
106
97 100
91
0
20
40
60
80
100
120
1-<6 years 6-<11years 11-<18years 18-49 years 50-64years 65+ years all
Pro
tein
inta
kes
(gra
ms/
mo
nth
) FR
OM
PU
LSES
Male Female Source: IFPRI-PRSSP 2011-2015 BIHS data

Intrahousehold patterns of protein intakes from pulses
as percentage of total protein intakes
11
3.5 3.7 3.9 3.8
4.1 4.3
3.8
5.1
5.6 5.8 5.7
5.9
6.5
5.7
0
2
4
6
8
1-<6 years 6-<11years 11-<18years 18-49 years 50-64years 65+ years all
Pro
tein
fro
m p
uls
es
as p
erc
en
tage
of
tota
l pro
tein
in
take
s
2011/12 Baseline 2015 Midline Source: IFPRI-PRSSP 2011-2015 BIHS data

Summary and conclusions
Bangladesh has seen remarkable changes in cropping patterns in past decade
Mainly due low price and high input costs, farmers are reducing area under rice, and switching from high-cost and high-yielding rice to low-cost but low-yielding rice
Many farmers are growing less rice and more profitable crops such as pulses and maize
Rice is the main driver of agricultural growth in Bangladesh, so it must not be de-emphasized. Research and policies are needed to intensify rice production

Summary and conclusions
Pulses give relatively high value output per unit of land, so it offers more scope for sustained income growth
However, year-to-year price fluctuations are much larger for pulses than for rice, indicating relatively high levels of market-induced risks for production of pulses
Need to address market efficiency issues to reduce the risks associated with pulse production
Pulses account for a small share in diet, but recently the share has increased for pulses and decreased for rice
Pulse intakes are considerably less for adolescent girls and adult women than intakes by their male counterparts.