Embed Size (px)
Citation preview

Understanding teachers’ working experiences: capturing data on teachers as professionals, learners and change-makers in low resource
contextsA joint Young Lives and RITES/Open University
symposium
Rhiannon MooreYoung Lives
Alison BucklerThe Open University
Renu SinghYoung Lives
Eric Addae-KyeremehThe Open University
Jack RossiterYoung Lives
Chris HighLinnaeus University, Sweden
Ben AlcottCambridge University

A recognition of the teacher as knowledgeable and agentive
A recognition of the importance of context and connections
A focus on the positives rather than just the negatives
(redressing the deficit discourse)
A consideration of impact – and in particular impact for
whom?
Four principles for ‘enabling teachers’ through research

Can you introduce your studies?

11/09/20174
Using network ethnography (NetE) to examine peer learning in a headteacher network in Ghana
Eric Addae-Kyeremeh
@addaekyeremeh
UKFIET
Conference
5-7 September
2017

Background
11/09/2017 The Open University 5
Context
• Peri-urban district in Ghana
• Network boundary (one educational circuit comprising 17 headteachers i.e. representing an a whole network analysis of an organisational unit)
• Mixed methods study (Interviews, observations & Network survey/census)
Aims
• To explore types of information an advice shared in this peer network
• To examine the flow of information and advice and the extent to which peer network relationships facilitates professional development of headteachers (individual and group social capital)

@yloxford
@rhi_moore
‘Positive deviants’ in the classroom
Developing measures of teacher attitudes, instructional
environments and professional knowledge for use in
Ethiopia, India and Vietnam
Rhiannon Moore & Jack Rossiter
UKFIET Conference
6th September 2017

YOUNG LIVES & LINKED SCHOOL SURVEYS
Longitudinal survey of children,
their households, schools and
communities running for 15 years
in 4 countries
Young Lives school surveys:
introduced in 2010
2016-17 school surveys: school
effectiveness in Ethiopia, India and
Vietnam
• Ethiopia: upper primary (Grades 7-8)
• India: lower secondary (Grade 9)
• Vietnam: upper secondary (Grade 10)
Around 28,000 children and 1100
teachers (maths & English) within 3
countries

SCHOOL SURVEY DESIGN
School effectiveness design:
Student performance in terms of
progress (rather than cross-sectional
measure)
The teaching and learning processes that
affect student progress
The ‘value-added’ of one year of school
To do this, we administered:
Cognitive tests at beginning and end of
one school year
Background instruments and psychosocial
measures for teachers and students to
contextualise learning progress

YOUNG LIVES TEACHER MEASURES
Construct Measure
Teacher Psychosocial Measures (focus on motivation and efficacy)
‘Wellbeing’ scale
‘Relationship with others in the school’ scale
‘Morale and job satisfaction’ scale
‘Equality’ scale
‘Professional Commitment’ scale
‘Efficacy’ scale
Teacher Professional Knowledge
15 item questionnaire
Classroom Instructional Environment
‘Engagement and empathy’ scale
‘Awareness and control’ scale
* See Moore & Rossiter, forthcoming for further details of the development of these teacher measures

Secondary Teacher Demand & Supply Study

Secondary Teacher Demand & Supply Study in 2 States
OBJECTIVES• To explore factors of teacher
availability • To review the compatibility of
demand and supply of teachers • To project subject teacher demand
and supply
STUDY STATES• Two states (Karnataka &Madhya
Pradesh)selected.• Karnataka-Classes VIII, IX, X• Madhya Pradesh-Classes IX, X
DESIGN: Mixed method • QUANTITATIVE 1) Demand side: Secondary data
analysis of schools and teachers (state data & UDISE).
2) Supply side: Primary data analysis of Colleges of Teacher Education
• QUALITATIVE interviews of 1) Schools and principals, 2) School teachers, 3) CTEs & Principals and 4) Teacher Trainee Focus groups For both Demand and Supply sides

Required number of subject teachersProjected gap or
surplus
-Growth Demand: School Population, Transition Rates , Number of schools, school size, expansion plans, transition rates-Provisioning: Allocation of teachers, recruitment, retirement, promotions, transfers, deployment and practices to fill vacancies including retiring teachers, guest teacher appointments-Policy : State Norms covering Secondary teachers, Service Rules, Planning process to meet demand of subject teachers
Number of subject teachers available for recruitment
-Pattern of Subject teacher supply: Total seats in state institutions of teacher education by subject, Annual Supply of Successful Candidates by subject, gender and social categories.-Policies : Admission procedure and reservation (caste, management quota), allocation of seats by subject- Existing Resource Pool : teachers available for employment in state, numbers applying for recruitment and teacher eligibility test (TET)- Delays/ Leakages …Teachers passing BEd and not joining secondary schools, Delays in recruitment due to court orders
Projected gap or surplus of secondary school subject teachers
DEMAND ANALYSIS SUPPLY ANALYSIS
Adapted from: Workforce Planning Tool Kit: Supply/Demand Analysis and Gap Analysis, 2007, CPS Human Resource Services
Number of secondary teachers by subject based on norms
Current total vacancies by subject
Projecteddemand
of subjectteachers
SchoolEnrolment/Population
Number of teachers available after passing TET, combined entrance tests
Trained supply of teachers by subjects in CTC( Only B.Edinstitutes)
Projected supply
of subject teachers
-+
/
=
-
-
= =
Supply & Demand Study- Analytical Model

Visual and collaborative
methodologies for capturing
teacher agency in rural Malawi
Dr Alison Buckler @AlisonBucklerEd
Dr Christopher High@Posthelion
https://vimeo.com/123403447

How did your research design value the role of the teacher?


Planning / designing / conceptualisation
Data
Analysis, output production and dissemination
Conventional research sandwich
Photo credit: Steven Groves CC-BY https://flickr.com/photos/8271947@N05/5445838305

Voices of TeachersWork load is heavy, there is too
much correction work and I have begun to face health problems due to increased
checking work, which I try to complete during free periods
Regular teachers must be appointed because guest teachers teach but they don’t take full
responsibility of children and school. Regular teachers are held responsible for the result of
children because guest teachers leave the school on 15th of April, and afterwards regular teachers
are blamed for the results.
Teacher’s are given non-teaching duties, though it is banned by the department… but teachers are given duties in the name of Election Census and some other national interest work. This leads to further shortage of teachers in schools
When a subject teacher is unavailable for a long time, children start asking
questions from other subject teachers and get demotivated as they don’t get correct and satisfactory answers from
them.. This affects learning
Government should monitor
and collect information about which school needs
how many subject teachers are required and recruit annually

Using network ethnography (NetE) to examine peer learning
in a headteacher network in Ghana
11/09/2017 The Open University 18
• Headteachers as knowledgeable individuals contributed to the design of the network survey by identifying the primary sources of help and support they need and provide to each other e.g. how to improve teaching and learning, how to deal with student discipline and how to deal with underperforming teachers. The emerging data provides a network map of key actors (most central headteacher, cliques, isolates, etc.) for these various information sources in the professional network.
• The headteacher voice captured through the observations and interviews was crucial in examining the structural web of interrelationships and the quality of associations and how these afford access to ideas, resources, learning and influence.
Never doubt that a small group of thoughtful committed citizens can change the
world.” Margaret Mead

A mixed methods design: Network Ethnography
11/09/2017 The Open University 19
Focussed ethnography
Network survey
Focussed ethnography
Role of headteachers in this
participatory approach
Headteachers determine
the sorts of knowledge and
ideas that are exchanged
(within this bounded
community)
All headteachers in the
educational circuit
participate in the census
Follow up interviews
with headteachers
(data balancing)
• Ideas on how to improve teaching and
learning in the school
• How to help ineffective teachers improve
on their practice
• How to improve student discipline
• New ideas on how to delver the
curriculum effectively
• Advice on career development and
progression

Headteacher voices from phase 1
11/09/2017 The Open University 20
“In my circuit there are a lot of
experienced headteachers and we can
share with others and encourage and
motivate each other. We can learn from
each other via headteacher association
meetings as well. Is that what you call
networking?” [H4]
“…to be honest most of my
leadership development has been
90% through my own efforts. I
believe headteachers learn and
develop best when they work with
other headteachers [pause] Group
work and cluster collaboration is
the way forward.” [H5]
“…the headteacher handbook is
useful to some extent but hearing
from other colleagues about their
experiences offer me the best
learning opportunity.” [H6]
“… I feel we as headteachers
learn better when we get the
opportunity to chat about our
challenges and how we have
managed to resolve everyday
problems”. [H6]
“…For me everything is in the
headteacher handbook so all we need is
an opportunity to share our knowledge
and experience with others. There
should be opportunities for new
headteachers to learn from more
experienced ones like me.”

TEACHERS ENGAGED THROUGHOUT PROCESS
Teachers invited to
participate in consultation
meetings throughout the
survey design process
Teacher feedback on teacher
and student instruments
collected during piloting
→ amends to instruments
Data collection from
maths and English
teachers within each
school

TEACHER MEASURES WITHIN LINKED DATA
Wave 1
outcome
measures
Wave 2
outcome
measures
Value-added by one
year of school
Student background &
psychosocial measures
Teacher background
measures
School context & school
management measures
Head teacher
background measure
Teacher psychosocial
measures
Teacher professional
knowledge measure
Classroom instructional
environment measure

What were the advantages of the use of this research design to understand and measure teachers’ working experiences? What, if any, were the challenges or limitations?

CONTEXTUALISING TEACHER EXPERIENCES
This research design gave us the opportunity to
contextualise teacher working experiences within
a large-scale quantitative dataset
Some challenges, e.g.
Contextualising and adapting measures for
developing country contexts
Limits of ‘self-reporting’
Interpretation of results – complex measures
But also a lot of advantages and possibilities

EXAMPLE: TEACHER MOTIVATION IN CONTEXT
-.4
-.2
0.2
.4
Tea
che
r p
sych
oso
cia
l m
ea
su
re P
CA
Ben Tre Da Nang Hung Yen Lao Cai Phu Yen
Teacher Psychosocial Measure Scores, by Province
Wellbeing Relationships w/ others in school
Morale Self efficacy
-50
5
Mo
rale
PC
A
-10 -5 0 5Relationship with others in school PCA
Scores for component 1 Fitted values
Vietnam
Teacher morale & relationship with others in school
We can look at how different teacher
psychosocial measures vary by factors
such as region
We can also look at how the different
psychosocial measures relate to each
other – e.g. strong association
between morale and relationship with
others in school-5
05
Mo
rale
PC
A-4 -2 0 2 4
Wellbeing PCA
Scores for component 1 Fitted values
Vietnam
Teacher morale & Teacher wellbeing

Transition Rate Remain Low
26

Secondary School Student Population (%)
Karnataka Schools
7
22
32
26
12
0
5
10
15
20
25
30
35
<50 50-100 101-159 160-299 >=300
School PopulationMadhya Pradesh Schools

11/09/2017 28
What were the advantages of the use of this research
design to understand and measure teachers’ working
experiences? What, if any, were the challenges or
limitations? [including ethical considerations]
The Open University

11/09/2017 The Open University 29
• The benefit of this mixed method approach is that it combines narrative tools of
ethnography with numerical tools associated with SNA to critically explore a
professional network consisting of headteachers of basic education schools in a
district in Ghana.
• The incorporation of interviews and observations (in this approach) offer opportunity to
capture network enactments which are often elusive in quantitative approaches in
SNA and provide the narrative behind network structures.
• A significant challenge for this approach is that it’s quite intrusive and intense and
therefore relies on high level of trust between the researcher and participants.
• Ethical challenges mainly due to the fact the organisational unit (the educational
circuit) chosen could not be anonymised within the district. Everyone knew they were
participating in the study therefore care had to be taken to ensure any data generated
was a true representation of their views. Although individual responses are
anonymised, there are aspect of the analysis that make people identifiable e.g.
gender. To mitigate these challenges, a meeting was held with educational
administrators and all participants to thoroughly discuss informed consent prior to the
field work.

Operational field map for Network Ethnography (NetE)
11/09/2017 30
Define parameters for
study
Initial/exploratory study
Whole network study
Data balancing
Phase 1
Phase 2
Phase 3
interviews,
observation & field
notes
Follow up
interviews
Census
questionnaire
• Repeated roster with names of
17 headteachers
• Boundaries are known and all
actors are listed
• Each actor has approximately
an equal chance of being
selected
• Fewer concerns about
respondent recall and
accuracy
• Valued and non valued
responses
Headteachers,
circuit supervisors
and district
managers
headteachers

Learning and information networks
11/09/2017 The Open University 31
The are no isolates in any of the learning and information networks which means that information can reach everyone across the network. (albeit with varying degrees of success)
Density
learning and information network Density Total
ideas on how to improve teaching and learning 0.816 222
how to help ineffective teachers improve on their practice 0.75 204
how to improve student discipline 0.723 196
new ideas on how to delver the curriculum effectively 0.596 162
advice on career development and progression 0.665 181

11/09/2017 The Open University 32
Centralitywho do you go to for advice and
new ideas on how to improve
teaching and learning?

33
sociogram for network relations excluding female headteachers sociogram for network relations excluding male headteachers
11/09/2017 The Open University
Roles and positions (e.g. bridgers)
who do you go to for advice and new ideas on how to improve teaching and learning?

“Yeah [using the professional kit] you cannot do filming on your own. You have a group which is called a crew which depend on one another. Someone on camera, someone directing, someone on sound, and if you have everyone working together, it will all go alright.
And [the workshop] has made me realise the same thing applies to working in a school: we need to be a crew and come together for planning and action and reflection. I am very serious about this!”

How can findings from this study be used to inform policy which sustainably supports and enables teachers?

Using network ethnography (NetE) to examine peer learning in a
headteacher network in Ghana
11/09/2017 The Open University 36
• Research into professional networks has huge potential in the area of school leadership development particularly in contexts where there are limited opportunities for ‘formal leadership development’ programmes. By capturing types of information exchanged and key actors in the peer network, educational supervisors will have a better understanding of how particular types of information and knowledge are shared amongst headteachers. The importance of social connectedness
• The study has the potential to contribute to the understanding of unreported practices in professional development (PD) amongst headteachers in Ghana. A focus on what the headteachers believe they learn from each other and how this happens in their peer network provides some evidence for a different approach to headteacher PD and collaborative working. This will help in the planning and delivery of PD programmes for school leaders particularly headteachers (in-service and pre-service).

Informing policy through helping to understand more about the working
experiences of teachers in schools where more student learning takes
place
‘Repeated measures’ data enables us to look at teacher factors in
relation to student achievement levels and student achievement
progress
-10
0-5
0
050
10
0
Math
s V
A (
unco
nd
itio
nal)
-100 -50 0 50 100English VA (unconditional)
Private Aided Private Unaided
State Govt Tribal Social Welfare
Maths and English Value-Added by School Type
IDENTIFYING ‘POSITIVE DEVIANTS’
Above
average
maths
learning
Above
average
English
learning
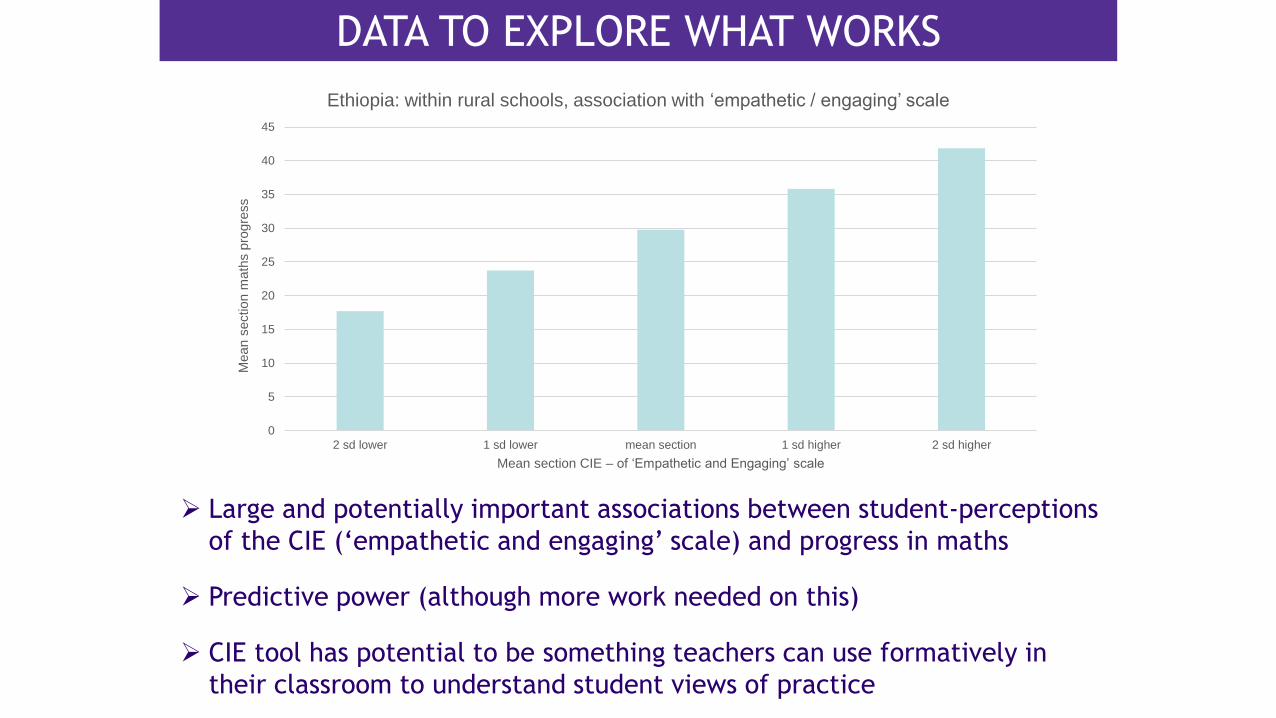
DATA TO EXPLORE WHAT WORKS
Large and potentially important associations between student-perceptions
of the CIE (‘empathetic and engaging’ scale) and progress in maths
Predictive power (although more work needed on this)
CIE tool has potential to be something teachers can use formatively in
their classroom to understand student views of practice
0
5
10
15
20
25
30
35
40
45
2 sd lower 1 sd lower mean section 1 sd higher 2 sd higher
Mean s
ection m
ath
s p
rogre
ss
Mean section CIE – of ‘Empathetic and Engaging’ scale
Ethiopia: within rural schools, association with ‘empathetic / engaging’ scale

“Through this workshop I have really grown intellectually. Why do I say so? Because I used to answer questions lightly, but now I think deeply and I answer deeply. Standing behind the camera has opened another chapter in my mind, and this will feed into my classroom”
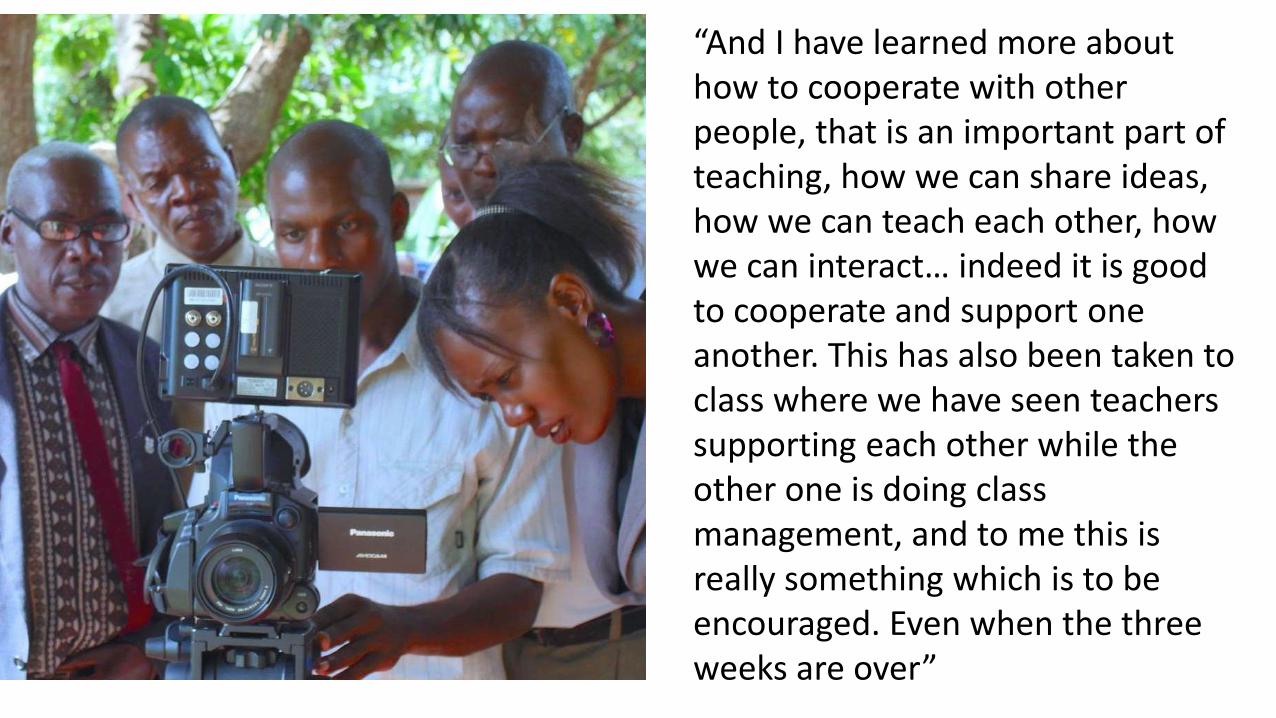
“And I have learned more about how to cooperate with other people, that is an important part of teaching, how we can share ideas, how we can teach each other, how we can interact… indeed it is good to cooperate and support one another. This has also been taken to class where we have seen teachers supporting each other while the other one is doing class management, and to me this is really something which is to be encouraged. Even when the three weeks are over”

Karnataka
• Majority of teachers are teaching in Govt (41%) and Aided (28%) schools.
• Though the PTR is 21:1, only 5% of all schools and 7% of govt schools have 5 core subject specialist teachers.
• 62% schools do not have a single Social Studies teacher
• 39% schools with no Science teacher
• 36% schools without Maths teacher
• 32% schools without 2 Language teachers
• Subject teacher shortage was most severe among Private Unaided schools.
Madhya Pradesh
• Almost 2/3 teachers are working in Govt schools
• Only 55% teachers have BEd/ MEd
• Less than 2% of all schools have 5 core subject teachers (PTR 35:1).
• 57% schools without 2 Language teachers
• 41% schools without Maths teacher
• 37% schools do not have a single Social Studies teacher
• 37% schools with no Science teacher
• Teacher paucity worst in Private Unaided schools.
Demand Side Key Findings: Schools

Impact in the Classroom• Subject teacher paucity affected both students and teachers
• 40% of interviewed teachers spoke of increased workload due to teacher shortage. Many of them were teaching extra subjects without specialization, while others were often substituting ‘missing’ teachers.
• The interviewed Private Aided schools were appointing teachers on contract basis.
• In the Government schools, guest teachers were appointed through SDMC who sanctioned the proposal of hiring a guest teacher, if qualified teachers were not available. The guest teachers were very poorly compensated and lacked job security.

Issue of Small Schools• Smaller schools have less subject teachers. • There is a system to appoint teachers to teach “All Subjects” (9% and 66% of workforce
in the two states). These teachers are teaching extra subjects without specialization in the respective subjects.
• Given large numbers of small size schools the situation of teacher shortage has reached unmanageable proportions.
0
10
20
30
40
50
60
70
80
90
5 Core subjects 2 Languages Maths Social Studies Science
Pe
rce
nt
Proportion of Schools with Subject Teachers
ENR <50 ENR 50-100 ENR 101-159 ENR 160-299 ENR >300

Supply Side Key Findings
Karnataka
• A total of 328 Teacher Colleges
• Close to 25,000 teachers are trained annually
• 60% took up Arts stream
• 65% women
• SC (17%), ST (5%), OBC (60%)
• Subject Specialisation: 65% teacher trainees took up Social Studies combined with Language, 18% Science with Maths, 7% Science combinations.
Madhya Pradesh
• In 2014-15, 567 Teacher Colleges offered 47202 seats.
• Nearly ¾ seats filled by Arts students.
• 63% women
• SC (16%), ST (8%), OBC (33%)
• Subject Specialisation: 55-58% took up Language combined with Social Studies, Less than 15% Maths with Language, Less than 8% Science.

32228 32796 33125 33177 33125 33058 33029 32876 32790 32702
0
5,000
10,000
15,000
20,000
25,000
30,000
35,000
2011 2012 2013 2014 2015 2016 2017 2018 2019 2020 2021 2022 2023 2024
Teac
he
r D
em
and
Grand Total
Language
Social Sci
Science
Maths
Replacement demand
2 Languages(32%)
Social Studies(31%)
Science(19%) Maths
(14%)
Projection of Population, Enrolment & Teacher Demand Karnataka
2,500,000
2,700,000
2,900,000
3,100,000
3,300,000
3,500,000
Po
pu
lati
on
&
Enro
lme
nt
Population (Actual)Population (Projected)Enrolment (Actual)Enrolment (Projected)
GER=85
GER=98

Projection of Population, Enrolment & Teacher Demand Madhya Pradesh
42240 43322 44518 45751 46626 47769 48760 49890 50999 52163
42240 42579 43255 43969 44325 44949 45422 46034 46624 47270
0
10,000
20,000
30,000
40,000
50,000
2011 2012 2013 2014 2015 2016 2017 2018 2019 2020 2021 2022 2023 2024
Model 2 Total
Model 1 Total
2 Languages
Maths
Science
Social Sciences
Replacement
Teac
he
r D
em
and
2 Languages(58%)
Maths(15%)
Science(13%)
Social Studies(13%)
1,900,000
2,100,000
2,300,000
2,500,000
2,700,000
2,900,000
3,100,000
3,300,000
Population (Actual)
Enrolment (Actual)
Population (Projected)
Enrolment (Projected, Model 1)
Enrolment (Projected, Model 2)
Po
pu
lati
on
& E
nro
lme
nt
GER=79
GER=88
GER=96

Implications for SDG’s
• The paucity of core subject teachers and serious teacher shortage particularly in small schools needs attention.
• In order to overcome the shortage, many teachers are teaching extra subjects without specialization.
• Considering the low PTR, it is difficult to conclude that subject teachers are unavailable for schools. In addition, a large number of teacher candidates are produced annually.
• The problem seems to be more in the deployment of the current workforce.
• Careful and systematic planning is critical.