Embed Size (px)
Citation preview

Cynthia Antonio
Jayalakshmi Nair
Reshma J Palangat
Taylor Stevak

Originated in the 1950s
Derived from “popular”
music
Mass audience appeal
Catchy rhythm and lyrics
Major form of
entertainment for all ages
Medium of expression
INTRODUCTION

Analyze lyrical patterns of
hit pop songs
From 1970 to 2009
Observe trends in terms
of frequent
words, artists, length of the
track etc.
Notice variations in styles
across decades
WE FOCUS ON

HOW DID WE DO THIS?Data from multiple sources
Combined into a large data set
Data summarization
Text mining and modeling
SAS Sentiment studio and modeling

BENEFICIARIES
Artist
Songwriters
Producers
Record labels
Listeners
Music
students
Music
researchers

BENEFITSMonetary paybacks – Higher
salaries
Profits – Chart topping songs
Higher revenues – Increase
knowledge
Cultivate an identifiable trend
of lyrics
Recognitions, awards, competi
tive advantage

No direct costs -
internet, software and
other resources were
provided by Oklahoma
State University.
Intangible costs – 100
labor hours
Software tools – $
COSTS

COSTS
SOFTWARE TOOLS COST
SAS® Enterprise Miner $ 25,570
Microsoft® Office $ 400
SAS® JMP $ 5,892
Tableau $ 1,999
IBM® Cognos $ 14,700
SAS® Enterprise Guide $ 2,035
Text Miner add-on $ 16,800

“It is a capital mistake to theorize before one has data.”

DATA PREPARATIONData access:
COLUMN DESCRIPTION SOURCEYear of song release
http://www.bobborst.com/popculture/top-100-songs-of-the-year/?year=1970
Position
Artist Name
Song Name
Lyrics http://www.metrolyrics.com/az-
lyrics.html
http://www.lyricsfreak.com/
Gender http://en.wikipedia.org/wiki/
State http://en.wikipedia.org/wiki/
Length http://en.wikipedia.org/wiki/

4 separate excel
workbooks created with
201 rows each.
Consolidate function
on Excel was used to
merge the datasets.
File was exported as a
DATA CONSOLIDATION

Preview of rows in an excel
workbook
Conversion of data
Conversion to standard format
Importing data into
environment
Steps involved in data consolidation
DATA CONSOLIDATION

Unwanted ads
between lyrics were
discarded. E.g.:
“www.metrolyrics.com”
The excel workbook
was separated into
DATA CLEANING

Only adjectives, nouns
and verbs were
considered.
A Synonym list was
created to filter words with
similar meanings.
Created a stop list to
DATA
TRANSFORMATION

DATA DICTIONARY
Attribute Description Field type Source Example
Year Year of appearance on list Num(5) http://www.bobborst.com 2004
Position Rank of song on list Num(3) http://www.bobborst.com 4
Artist Name of the singer VarChar(50) http://www.bobborst.com Maroon 5
Song Title of the track VarChar(100) http://www.bobborst.com This love
Gender Gender of the artist Char(10) http://www.wikipedia.com Male
Lyrics Lyrics of the song VarChar(20000) http://www.azlyrics.com I was so high...
State Name of the US state of
origin, else NA
Char(50) http://www.wikipedia.com California
Length Length of the track in
seconds
Num(10) http://www.wikipedia.com 207
Theme* Specifies theme of the
song as
rap/religion/men/women
Varchar(20) Manually coded Love
* We used themes such as Happiness,
Love, Heartbreak, Optimism etc. as a
categorical variable to signify the theme of
the song.

DATA UNDERSTANDINGArtists/groups by location
California: 76 artists
New York: 68 artists

DATA UNDERSTANDINGDistribution of songs according to themes:
Heartbreak:
188
Love: 162
Happiness: 89
Dance: 82
Sorrow: 81
Rap: 59
Optimism: 54
Women: 46
Men: 13
Hate: 13
Religion: 8
Instrumental: 5

DATA UNDERSTANDING
The average length of
songs peaked between
the late 80s to the 90s.
The current trend is
towards shorter songs.
Average length of songs by year

DATA UNDERSTANDING
Shortest song: 1:40
minutes
Longest song: 8:57
minutes
Overall Mean: 4:02
minutes
Length versus position on chart
Songs with lengths less than 2:30 minutes
and beyond 7:30 minutes never made it to the
top 10 positions.
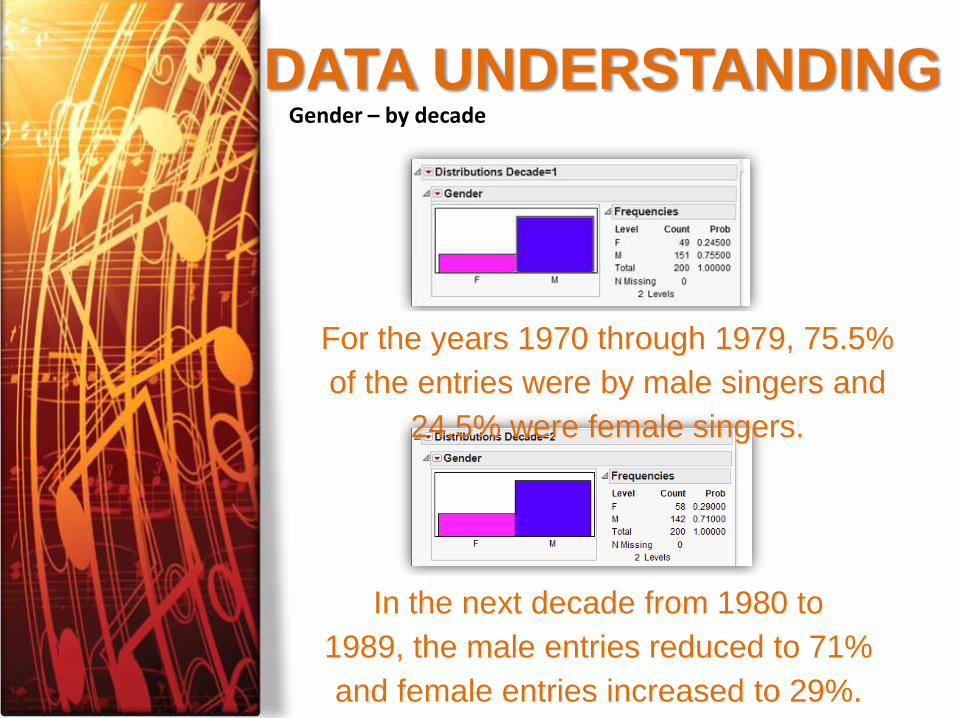
DATA UNDERSTANDINGGender – by decade
For the years 1970 through 1979, 75.5%
of the entries were by male singers and
24.5% were female singers.
In the next decade from 1980 to
1989, the male entries reduced to 71%
and female entries increased to 29%.

DATA UNDERSTANDINGGender – by decade
During the 90s, there was a change in
trends and almost equal entries were
observed in both cases. The male
entries dropped to 53% while the female
entries rose to 47%.
During the following decade spanning
from 2000 to 2009, male entries
increased to 62.5% and female entries

TEXT MINING
Flow diagram for Data preparation and
modeling
training:
validation:
testing
50:30:20
PARTITION
TEXT
PARSING
TEXT
FILTERING
TEXT
CLUSTERING

MODELINGExpectation maximization
algorithm: 13 clusters
Love-88
Heartbreak- 59Rap- 31

TEXT MININGHierarchical clustering: 30 clusters

MODELINGAim: Predictive modeling to predict
themes
Regression- Logistic regression with
stepwise selection method
Model Misclassification
rate
Average squared
error
Logistic regression
(stepwise)
0.07625 0.070996
Text topics as input variable
Themes as target variable
Logistic Regression

MODELINGAim: Predictive modeling to predict
themes
Regression- Logistic regression with
stepwise selection method
Topics 2 and 5 were identified and
considered significant inputs

Aim: Categorize the
songs into positive and
negative themes
Three models were
developed
• Statistical
• Rule-based
• Hybrid
SENTIMENT ANALYSIS

MODELING

MODELING
A rule based model was built
using specified rules by us and
were classified into positive,
negative and neutral categories.

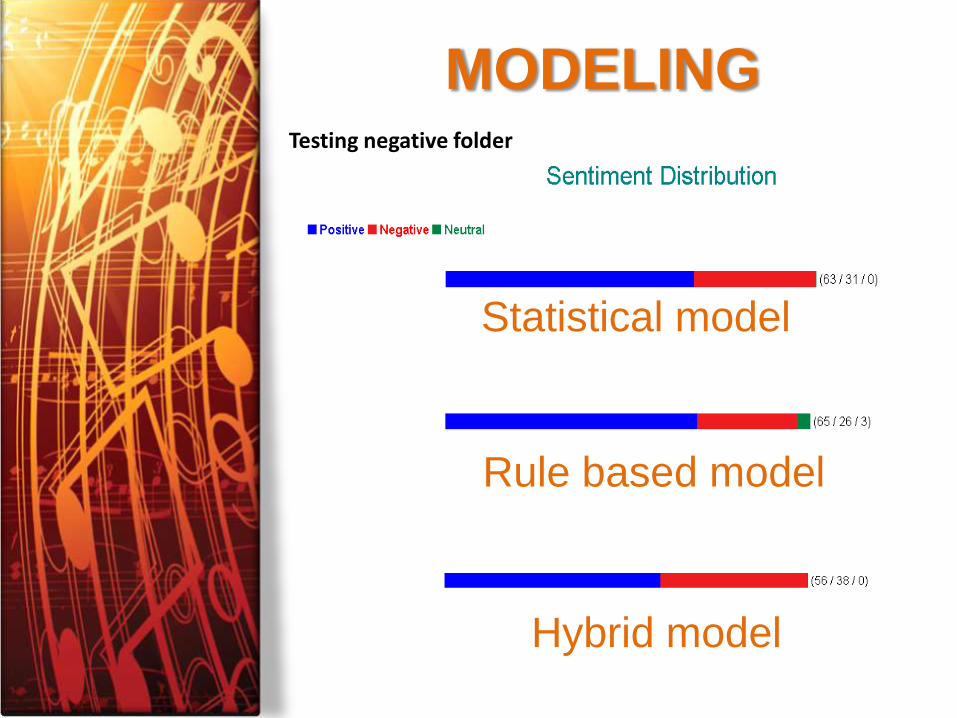
MODELING
Statistical model
Rule based model
Hybrid model
Testing positive folder
MODELING
Statistical model
Rule based model
Hybrid model
Testing negative folder

MODELING
Model Precision (%) Accuracy (%) Recall (%)
Statistical 72 62 75
Rule-based 87 70 70
Hybrid 88 65 64
Precision, accuracy and recall for models built

MODELING
Overall sentiment analysis

WORD CLOUD
Word cloud depicting the most frequent words

CONCLUSIONS -
THEMES
Themes of the 70’s (Heartbreak 18.5% Love 17.5% Sorrow 16.5%)
Themes of the 80’s (Love 31% Heartbreak 18% Dance 11.5%)

CONCLUSIONS -
THEMES
Themes of the 90’s (Heartbreak 36.5% Love 20% Dance 11%)
Themes of the 00’s (Heartbreak and Rap 21% each; Love 12.5%)

CONCLUSIONS –
LENGTH

CONCLUSIONS –
POPULAR TRENDS
79 songs by the top ten most
recurring artists were further
analyzed.
Six female entries and four
male entries were observed.
47 songs were sung by
females as opposed to 32 by
males.
Top themes were heartbreak
(36.7%), love (22.8%) and
dance (12.7%).

CONCLUSIONS –
POPULAR TRENDSThere was no pattern in the
place of origin.
3 out of 10 entries
belonged to countries other
than the U.S.
Most of these singers
made it to the top hits in
multiple years spanning
decades.

CONCLUSIONS –
POPULAR TRENDS12 entries New York
11 entries Texas
9 entries Indiana
8 entries
8 entries California
7 entries
6 entries Texas
6 entries Pennsylvania
6 entries Michigan
6 entries Barbados
1
2
3
4
5
6

THANK YOU