Embed Size (px)
Citation preview

Comparative statics
Market Equilibrium, Price Rationing and Consumer Welfare

P
Q
Market Equilibrium:Where Quantity Demanded equals Quantity Supplied.
E
Q s
Q d
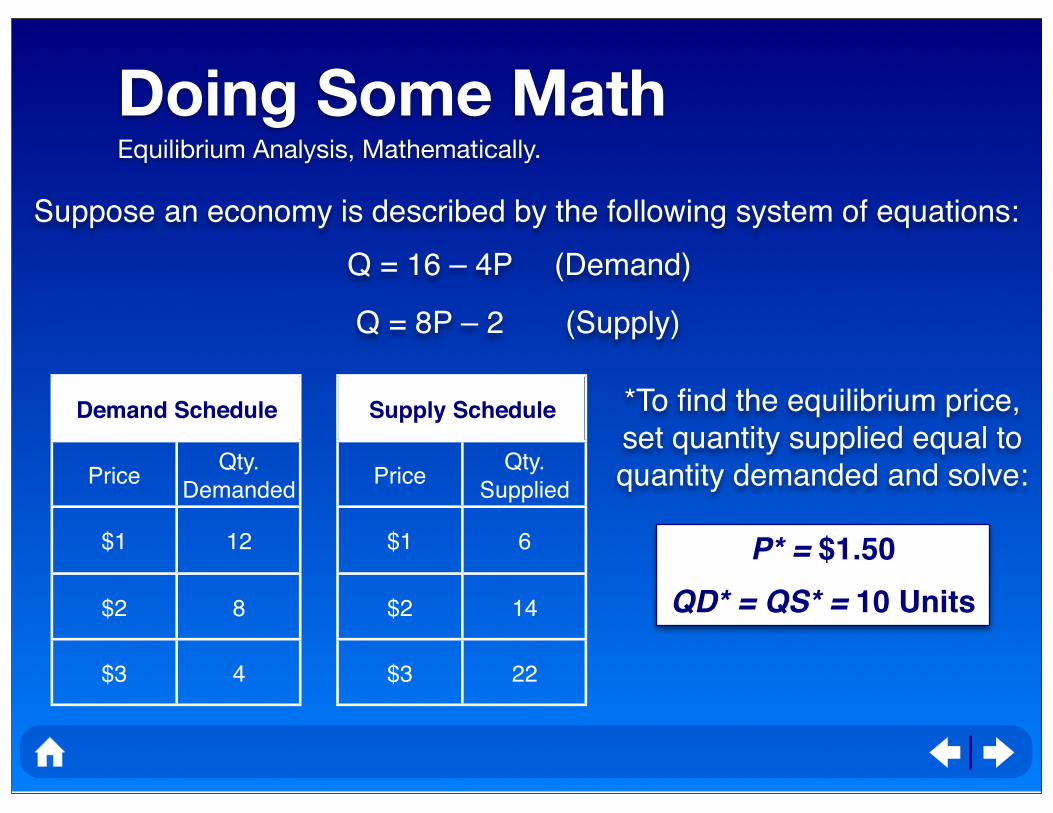
Doing Some MathEquilibrium Analysis, Mathematically.
Suppose an economy is described by the following system of equations:
Q = 16 – 4P
Q = 8P – 2
(Demand)
(Supply)
Demand Schedule
PriceQty.
Demanded
$1 12
$2 8
$3 4
Supply Schedule
PriceQty.
Supplied
$1 6
$2 14
$3 22
*To find the equilibrium price, set quantity supplied equal to quantity demanded and solve:
P* = $1.50
QD* = QS* = 10 Units

P
Q
What happens if the good is priced at $6?
Q s
Q d
E$10
24

P
Q
What happens if the good is priced at $6?
Q s
Q d
A B$6
20 35
At that price, households will demand B = 35 units, but firms are only willing to supply A= 20; price will have to rise.
E$10
24
P
Q
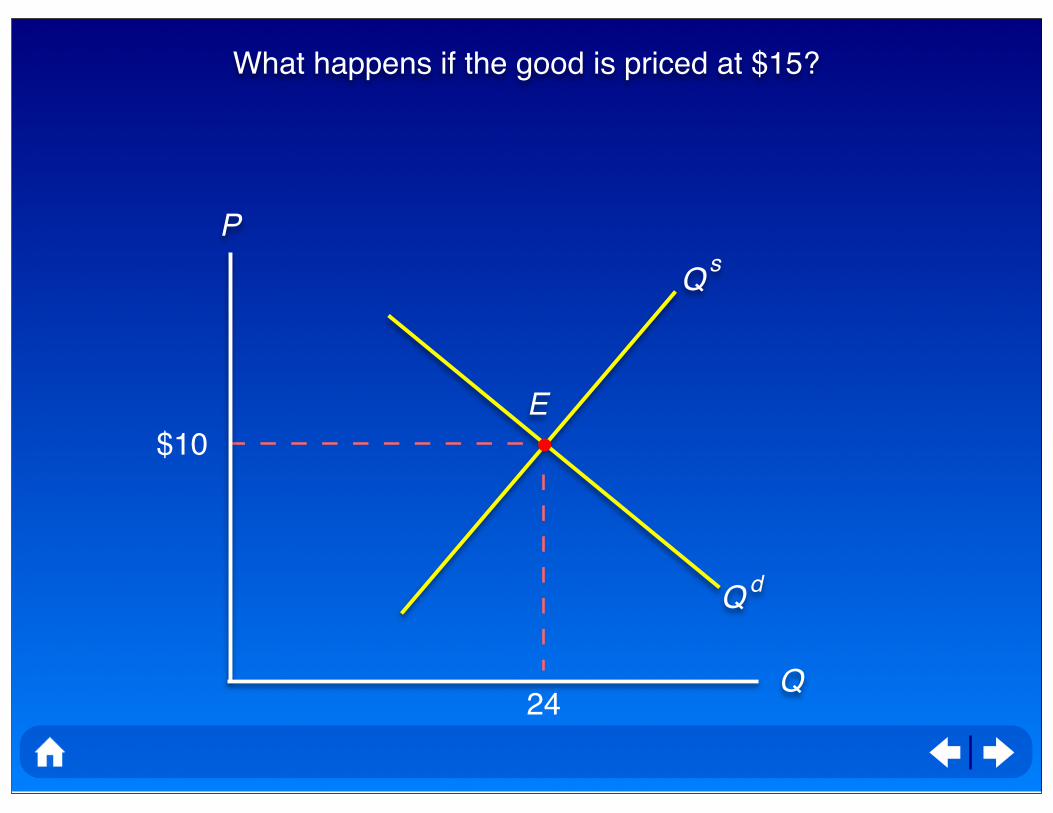
What happens if the good is priced at $15?
E
Q s
Q d
$10
24

P
Q
What happens if the good is priced at $15?
E
Q s
Q d
$10
24
At that price, firms will be willing to produce as much as B’= 32 units, but households are only willing to buy A’ = 18; price will have to fall.
$15A’ B’
18 32

Excess Supply
Excess Demand
P
Q
Therefore, “above” the equilibrium point we have excess supply, and “below” the equilibrium point we have excess demand.
E
Q s
Q d

P
Q
Scenario: Wealth Increases and the Good is Normal
S
D
P
Q

P
Q
Scenario: Wealth Increases and the Good is Normal
S
D
P
Q
D’
P’
Q’
P
Q
Scenario: The Price of Complementary Goods Increases
S
D
P
Q

P
Q
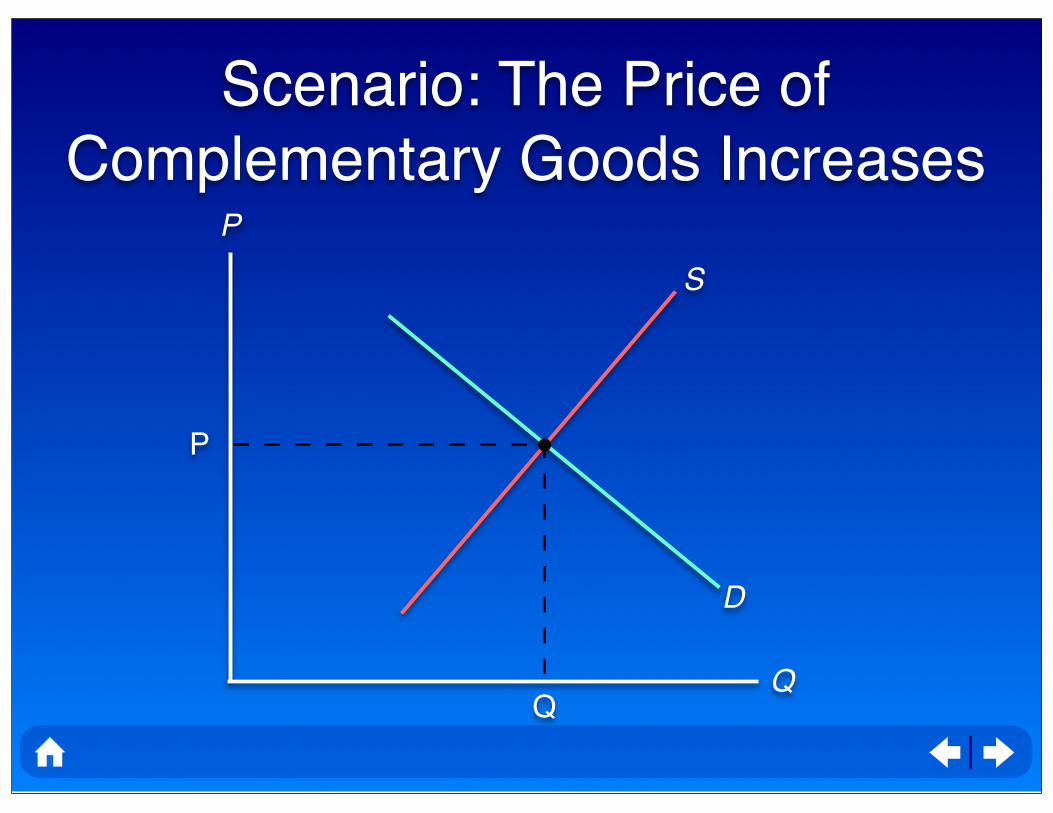
Scenario: The Price of Complementary Goods Increases
S
D
P
Q
D’
P’
Q’

P
Q
Scenario: Technology Improves
S
P
Q
P
Q
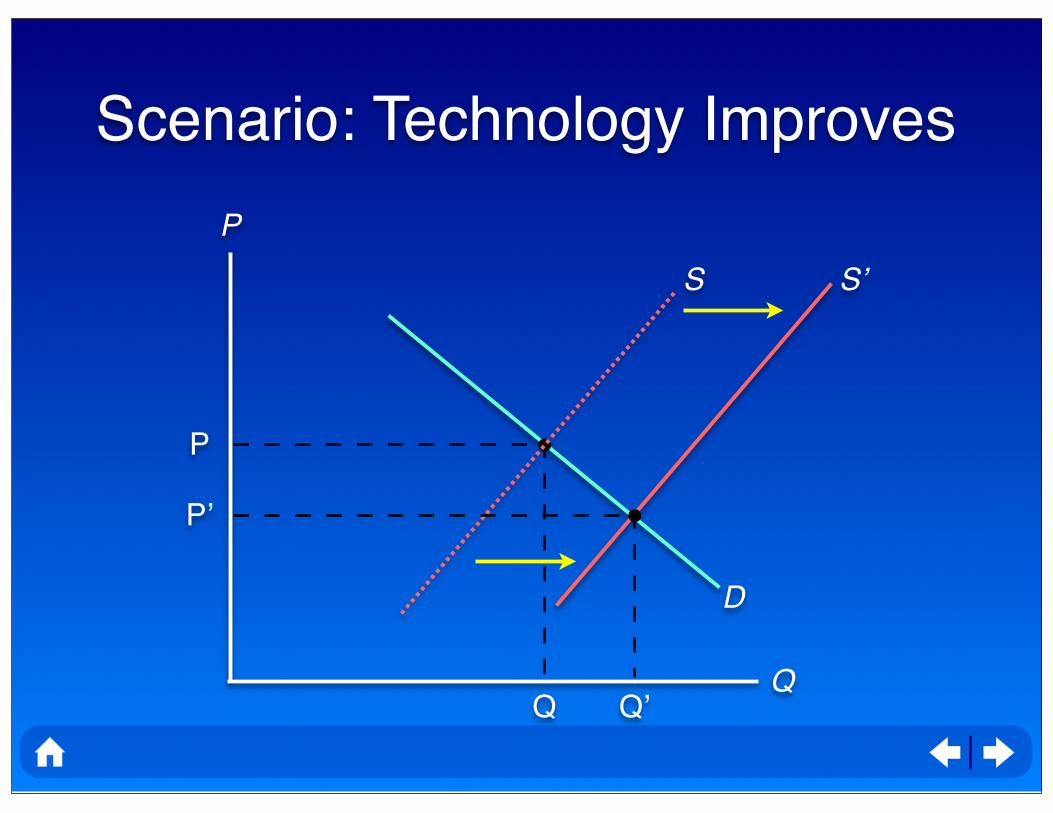
Scenario: Technology Improves
S
P
Q
D
S’
P’
Q’

P
Q
S
D
P
Q
Scenario: Both Demand and Supply Curves Shift

Scenario: Both Demand and Supply Curves Shift
IT DEPENDS!!!
• Hypothetically, if they shift in the same direction and in
the same proportion, then quantities will change in the
direction of the shift but prices will remain the same.
• Otherwise, it is necessary to know which shift has the
larger magnitude to draw any conclusions.
• The effect is clearer when the two curves shift in
opposite directions.

P
Q
D
Case 1: Rare Item AuctionsWhy do rare items fetch such high prices?
SP
Q
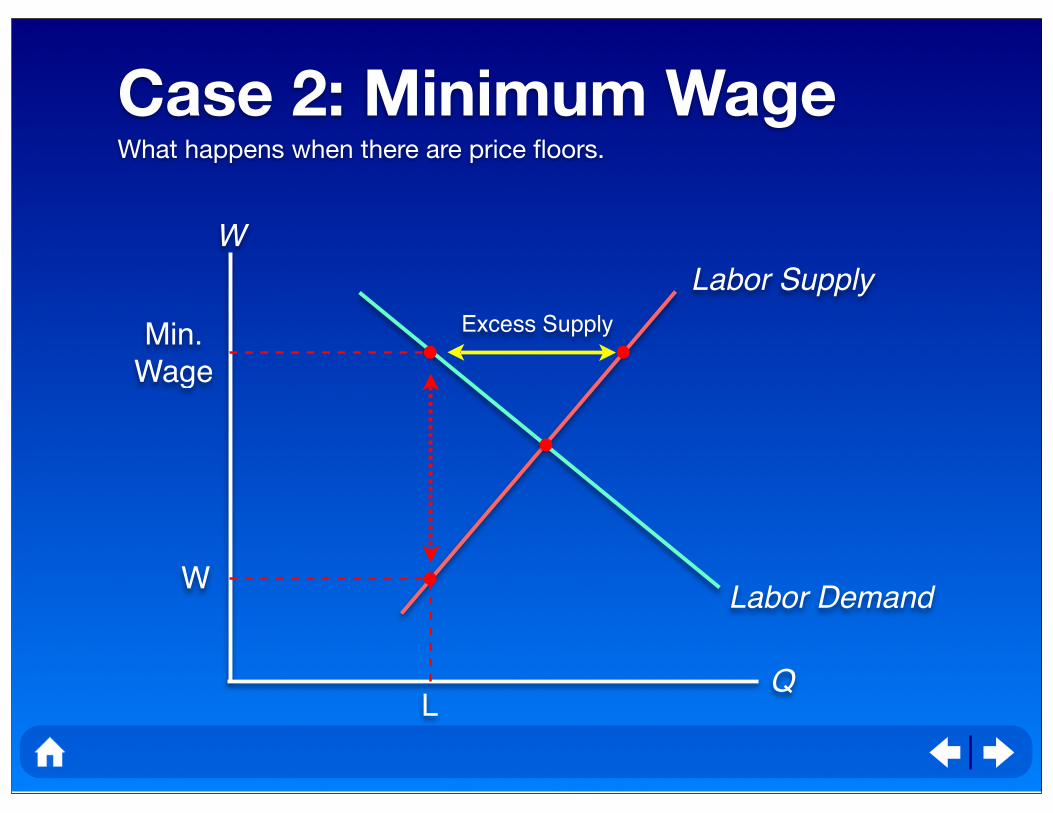
Case 2: Minimum WageWhat happens when there are price floors.
Labor Supply
Labor Demand
W
Q
Min.Wage
Excess Supply
L
W

Case 3: Oil PricesWhat happens when there are price ceilings.
P
Q
$1.50
S1974
D1974
QS dQ
Excess Demand
$0.57

Case 4: Oil ConsumptionIntroducing a fee on Oil Imports.
P
Q
S
DWorld Oil Price
($18) Imports
Domestic Oil Production and Consumption
Import Fee
Price w/ Import Fee ($24)

Case 5: Illegal NarcoticsDemand versus supply approaches to combat the drug problem.
P
Q
S
D
P
Q
A Supply-Oriented Approach
Q’
S’
P’

Case 5: Illegal NarcoticsDemand versus supply approaches to combat the drug problem.
P
Q
S
D
P
Q
A Demand-Oriented Approach
Q’
D’
P’

P
Q
Qs
Qd
P*
Consumer Surplus: The area below the demand curve but
above the price level.
E
Welfare AnalysisFree markets maximize the benefit to households and firms...

P
Q
Qs
Q d
P*
Consumer Surplus: The area below the demand curve but
above the price level.
Producer Surplus: The area above the
supply curve but below the price level.
E
Welfare AnalysisFree markets maximize the benefit to households and firms...

P
Q
Qs
Q d
P*E
Welfare Analysis (2)...although sometimes firms get the prices right and get the quantities wrong.

P
Q
Qs
Q d
P*E
Welfare Analysis (2)...although sometimes firms get the prices right and get the quantities wrong.
Y
B

P
Q
Qs
Q d
P*E
Welfare Analysis (2)...although sometimes firms get the prices right and get the quantities wrong.
Y
B

P
Q
Qs
Q d
P*E
Welfare Analysis (2)...although sometimes firms get the prices right and get the quantities wrong.

P
Q
Qs
Q d
P*
Deadweight Loss: Loss in consumer and/or producer surplus resulting from over- or underproduction.
E
Welfare Analysis (2)...although sometimes firms get the prices right and get the quantities wrong.
B’
Y’