Embed Size (px)
Citation preview

AQA GCSE Revision: Population
SECTION 1 – IS GLOBAL POPULATION DISTRIBUTION UNEVEN?
1. What is population? The study of people – what they do, where they live and why.
2. What is population DENSITY?
Population density is…. The number of people living in a place per Km2.
☺ Places with LOTS of people living in them are called DENSELY POPULATED areas – i.e. Western Europe
☺ Places with FEW people living in them are called SPARSELY POPULATED areas – i.e. Sahara, Antarctica
3. What is population DISTRIBUTION?
Population distribution is…..The way people are dispersed or spread out around the globe. Where people live in relation to other places
4. What affects where people live? Some factors will encourage lots of people to live in certain areas but also can discourage some people from living in others. The diagram below shows some of these factors affecting where people live:
Some of these are HUMAN factors (i.e. made by people – e.g. roads, jobs, improved housing, governments)
Others are PHYSICAL factors (i.e. part of the natural environment – e.g. dense forest, natural resources, climate)

Examples of countries with dense and sparse populations:
Densely populated Sparsely populated
SECTION 2 – POPULATION CHANGE DEPENDS ON BIRTH RATES & DEATH RATES
1. How has population growth changed over time?
2. What are birth rates and death rates?
Ø Birth rates – the number of babies born per 1000 people
Ø Death rates – the number of people dying per 1000 people
The population of the world is increasing very quickly!
Every hour there are an extra 8,000 people living on our planet!
This is an increase of 2 people every second.
The Population is currently around 6.5 billion.
EXAM Q – Try to describe the growth of the population over time. Give specific data about the years and the numbers of people in millions.
3. What will affect birth rates & death rates?
The population increases when the birth rate is higher than the death rate
The population stays the same
when the birth rate is equal to the
death rate
The population decreases when the
death rate is higher than the
birth rate
EXAM Q –
“Explain how some parts of the world have low population densities”
OR
“Explain why population densities can vary within a country”

SECTION 3 – THE DEMOGRAPHIC TRANSITION MODEL
1. What is the Demographic Transition Model?
It is a model developed to show the stages through which a country’s population growth will pass. It is affected by levels of economic development, politics, social culture and migration.
2. What might cause changes in the birth and death rate lines on the graph?
HIGH LOW
BIRTH RATE
- High infant mortality – women have more children as more are likely to die during childbirth or at an early age
- Lack of advi ce or availability of family planning & contraception
- Many children can help to work on the land & so help to increase family income
- Low age of marriage – women marry then have children
- Low infant mortality – better health care allows women to feel confident that their children will survive past infant-hood. So they have fewer children
- Good family planning advice given and contraception is easily available. Women can plan how many children they want and when
- Women are staying in education longer & focusing on careers and getting married and having families later on
- People choose material possessions over children and so may have only 1 or 2 children
DEATH RATE
- High rate of disease, famine, malnutrition
- Also a lack of clean water supply can lead to many deaths
- Lack of basic healthcare so people are more prone to diseases
- Low (if any) rates of dangerous diseases
- Good access to a regular food supply & access to clean, safe water
- Good access to appropriate healthcare that is available to everyone
- Continued good healthcare leads to populations where people lead long, healthy lives – sometimes to over 100 years!
Rainforest tribes
Bangladesh, Nigeria, Kenya
Egypt, Brazil, India
Italy, UK, Japan, USA
To read the DTM:
1. Look at what is happening to the birth line. Is it increasing or decreasing or fluctuating (moving up and down).
2. Now look at the death rate line. Is it increasing or decreasing or fluctuating (moving up and down).
3. Now look at the total population – it is increasing and showing population growth or decreasing to show population DECLINE?

3. What is STAGE 5?
SECTION 4 – WHAT ARE POPULATION STRUCTURES?
3. What do population pyramids for MEDC’s and LEDC’s look like – AND WHY is this?
☺ Stage 5 was created to show countries that are very developed
☺ Their BIRTH RATES ARE NOW LOWER THAN THE DEATH RATES
☺ This means that their population is DECREASING
☺ It is also AGEING (lots more elderly people and not many young)
☺ Countries include: UK, Germany, Italy, Spain
4. How useful is the Demographic Transition Model (DTM)?
It is GOOD because:
ü It generalises the expectedpattern of population growth.
ü It allows us to compare countries
ü It helps us to link population change with social and economic conditions.
ü It can help us to predict future changes that may take place.
HOWEVER
1. Not all countries will pass through all stages of the model at the same rates
2. It doesn’t consider the impact of the size of the population
3. It doesn’t take into account migration rates
5. How do the DTM’s of LEDC’s and MEDC’s vary?
MEDC’s
- Most have passed through all stages
- Some are heading towards Stage 5
- Economic development led a quick move through the stages
LEDC’s
- Not yet passed through all stages
- Many still in stages 2 or 3
- Their populations are still growing
- Economic development may be slow
1. What are population pyramids and population structures?
Population pyramids: Are a way of displaying the age/ sex structure of a population. We can analyse it to predict the future and plan accordingly
Population structures: This is the make up of a total populati on in a country or area where people are grouped by age and sex. It shows the balance between the two. It is very closely linked to the demographic transition model (DTM) and migration.
They provide us with information about how a country might develop
This allows us to plan for the needs of that
country
Youthful (young) population structures = need more money spent on schools &
teachers
Ageing (elderly) populations = more
money spent on retirement homes,
healthcare & pensions
2. Why are population pyramids so useful to geographers?

SECTION 5 – HOW ARE COUNTRIES COPING WITH POPULATION CHANGE?
2. The UNITED KINGDOM – an ageing population – Aim = to manage the growing number of elderly people in the UK
WHY? Pyramids for stages 1 & 2
- Poor medical care
- High infant mortality – so high birth rate to compensate
- Poor diet, sanitation so high death rates
WHY? Pyramids for stages 3 & 4
- Improvements in medical care – longer life expectancy
- Straighter sides means lower death rates
- Marrow base = fewer children being born – more contraception available & family planning
The one-child policy was established in 1979 and meant that each couple was allowed just one child.
1. CHINA’S ONE CHILD POLICY – a growing population – Aim = to reduce the increasing number of young people being born
Fines were placed on families that had more than one child. Couples who had more than one child already were sterilised (mainly women) so they couldn’t have more children
Fines were placed on families that had more than one child.Couples who had more than one child already were sterilised (mainly women) so they couldn’t have any more!
Why was it a good idea and a success? ☺
1. The birth rate of China has fallen & population growth is now VERY l ow at 0.7%
2. As the population has been reduced, the resources can now be shared more easily amongst the rest of the population – giving a better quality of life
Why negative consequences did it cause? L
1. Large numbers of girls were aborted or killed due to families preferring to have boys
2. It has led to a culture of SPOILT, RICH BOYS!! They have been called “The Little Emperors”
3. Less children means less people to care for the elderly generation – it itself a big problem!
And the situation today? The policy has been relaxed a little. Couples can now apply to have a second child. China’s population is now rising slowly again but the main issue is with the growing proportion of elderly people.

3. ENCOURAGING PEOPLE TO HAVE MORE CHILDREN IN EUROPE
One other interesting point is that some countries in the EU are heading into STAGE 5 of the DTM (as discussed earlier). This means that there are more people dying than being born, and so the population of the country is decreasing.
To encourage some countries to increase their populations once again, some governments in these countries have been putting measures into place to encourage them to have more children.
Countries include Finland, Poland, UK, Germany.
SECTION 6 – MIGRATION
1. What is migration?
2. Why do people migrate?
People migrate for many different reasons.
ECONOMIC reasons - to find work and to earn a living
SOCIAL reasons - migrants may be moving to join up with family members
ENVIRONMENTAL reasons - natural disaster or war and would have no choice but to move for their own safety
Key issue – The UK has a high life expectancy and so a growing number of people are living to an elderly age. This puts pressure on the health care resources and means we need to be spending more money on old people’s homes
& on activities for elderly people.
“The movement
of people”However, we need to realise there is some degree of permanence.
So the United Nations definition extends to:
“Migration is the movement of people which involves a change of residence lasting more than
one year”
This definition does not include seasonal movements – i.e. fruit pickers, pastoral nomads & tourists would not be considered
“migrants”
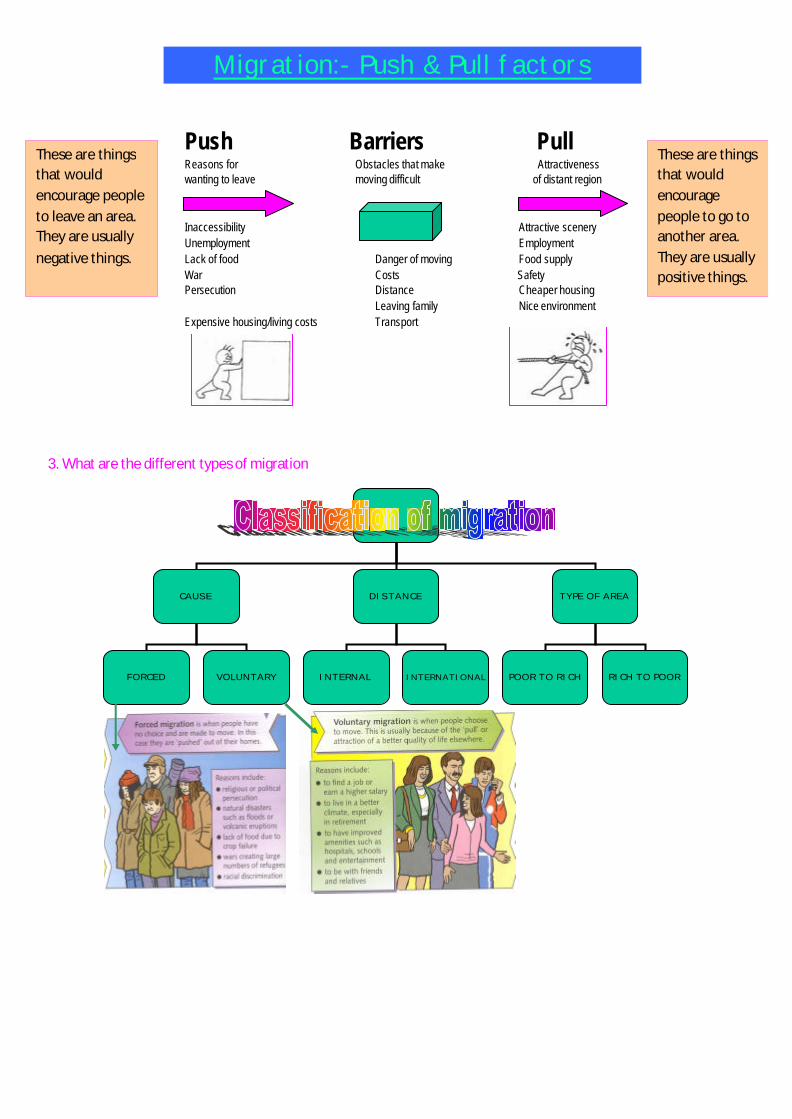
Migration:- Push & Pull factors
Push Barriers PullReasons for Obstacles that make Attractivenesswanting to leave moving difficult of distant region
Inaccessibility Attractive sceneryUnemployment EmploymentLack of food Danger of moving Food supplyWar Costs SafetyPersecution Distance Cheaper housing
Leaving family Nice environmentExpensive housing/living costs Transport
3. What are the different types of migration
CAUSE DISTANCE TYPE OF AREA
FORCED VOLUNTARY INTERNAL INTERNATIONAL POOR TO RICH RICH TO POOR
These are things that would encourage people to leave an area. They are usually negative things.
These are things that would encourage people to go to another area. They are usually positive things.

4. CASE STUDY – ECONOMIC MIGRANTS – MEXICO TO THE USA
Most people who migrate to the USA from Mexico go there to earn a living & to send money back to their families. These people are called “economic migrants”
The reasons people leave one area to go to another is called the PUSH-PULL MODEL
PUSH FACTORS PULL FACTORS
(negative things encouraging them to leave Mexico) (positive things encouraging them to go to the USA)
1. No jobs
2. Poor quality of life
3. Basic infrastructure (roads, hospitals, schools)
4. Lack of education
5. Poor health care
Many people try to cross the border every year……but what is being done about it?
a) Border control crossings have been tightened
b) People have been moved back to Mexico if they outstay their visa
Some people in USA are annoyed as they feel that the Mexicans have taken over their country.
5. CASE STUDY – INTERNATIONAL REFUGEES
1. Good jobs & well paid
2. Better standard of living
3. Good infrastructure
4. Good access to education
5. Good hospitals and access to healthcare
Ethiopia
• Poor rural society and basic lifestyles
• Often affected by natural disasters & crop failures due to droughts and storms/flooding
• People migrate away from Ethiopia and seek REFUGE as refugees in other countries nearby where they hope they will get help and aid to improve their quality of life
Refugees are people who flee their country because of 'a well-founded fear of persecution for reasons of race, religion, nationality, political opinion or membership of a particular social group'.
Rwanda
• Poor country within Africa
• Affected by similar issues as Ethiopia above
• In 2005 thousands of Rwandan people migrated to get away from threats, intimidation and persecution as a result of war crimes
• Conditions at refugee camps were not very good and some people still suffered.

6. What are the advantages and disadvantages of migration?
Impact Place they are leaving from
(ORIGIN COUNTRY)
Place they are going to
(DESTINATION COUNTRY)
Social (to do with people)
- As younger people migrate, it leaves an elderly population behind
- As a result, death rates might rise (due to more old people) and birth rate may fall (due to fewer young people there to have children)
- As young move in, the younger age groups increase in numbers
- Birth rate might rise (due to more younger people having children) and death rates falling (due to fewer elderly people)
Economic (to do with money)
- Those with skills and education leave causing labour shortages
- Those with skills & education arrive – this may put pressure on the jobs available and some locals may not get jobs as they are given to migrant workers who will work longer and for less pay
Environmental - Decline in farming land – more land abandoned
- pressure on resources as more people move in – pollution possibly & more shanty towns to accommodate people
You could always visit - http://www.geographyalltheway.com/ib_geography/ib_population/ib_popn_movement_consequences.html and watch the BBC News movies about the different impacts of migration around the world ☺