Embed Size (px)
Citation preview

Antoine Stevens(1), Marco Nocita(1,2), & Bas van Wesemael(1)
ANALYSIS OF LARGE SCALE SOIL SPECTRAL LIBRARIES
1 Georges Lemaître Centre for Earth and Climate Research, Earth and Life Institute, UCLouvain, Place Louis Pasteur, 3, 1348 Louvain-la-Neuve, Belgium
2 SOIL Action, Land Resource Management Unit, Institute for Environment and Sustainability, Joint Research Centre of the European Commission, Via E. Fermi 2749, 21027 Ispra (VA), Italy

PART I: Large scale soil spectral libraries
State of the Art
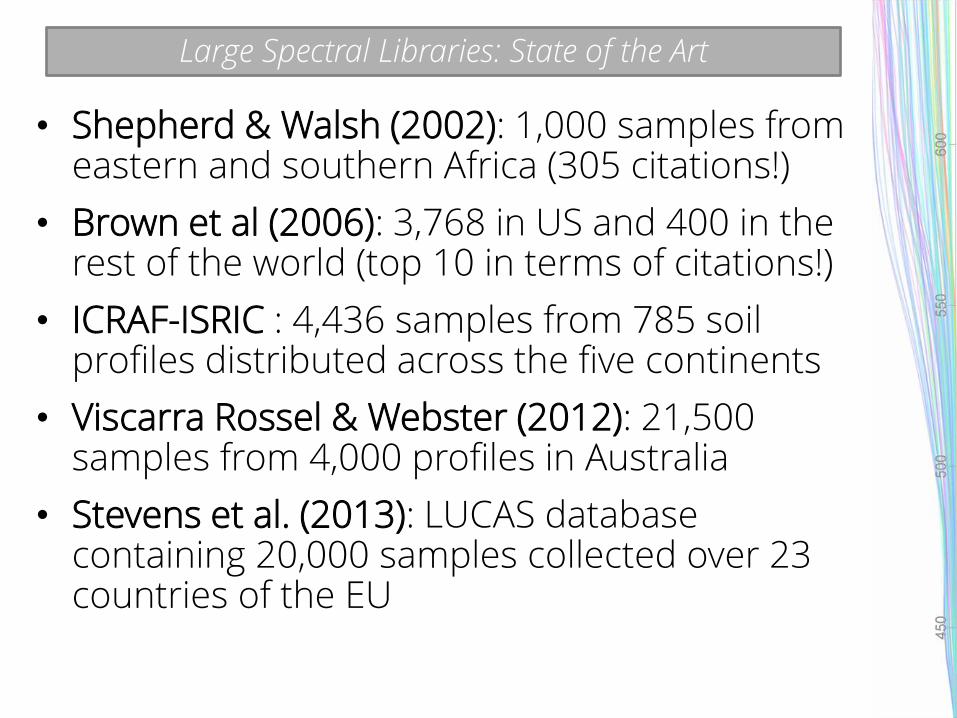
• Shepherd & Walsh (2002): 1,000 samples from eastern and southern Africa (305 citations!)
• Brown et al (2006): 3,768 in US and 400 in the rest of the world (top 10 in terms of citations!)
• ICRAF-ISRIC : 4,436 samples from 785 soil profiles distributed across the five continents
• Viscarra Rossel & Webster (2012): 21,500 samples from 4,000 profiles in Australia
• Stevens et al. (2013): LUCAS database containing 20,000 samples collected over 23 countries of the EU
Large Spectral Libraries: State of the Art

• Rapid Carbon Assessment (2013): 144,833 samples in 6,017 locations across conterminous US
• Africa Soil Information Service (2013): 17,000 so far from 60 sentinel sites of 100 square km in sub-Saharan Africa
• National/Regional Spectral libraries:
– France (Goge et al., 2012): 2,200 samples
– Denmark (Knadel et al., 2012): 2,851 samples
– Czech Republic (Brodsky et al., 2011): 500+ samples
– Florida (Vasques et al., 2010): 7,120 samples
– Many others ….
• Local spectral librairies and spectral librairies made for a specific research objective: impossible to count!
Large Spectral Libraries: State of the Art
• Most of samples have been scanned with an ASD
• Some of them are based on legacy soil databases and others have been build from scratch, on purpose
• Soil analytical measures have been obtained with different methods
• Big spectral libraries are useful to build robust predictions over large areas
Large Spectral Libraries: State of the Art

• Often RPD values are high (~2) for properties having a direct link with the soil chromophores
• However, RMSE are often too high for most applications:
– World: RMSE = 7.9-9.9 g C kg-1 for OC
– Europe: RMSE = 4-15 g C kg-1 for OC
– Florida: RMSE = 6-7 g C kg-1 for OC
• … compared to a SEL of 1-2 g C kg-1 (dry combustion)
• So, what factors influence model performance of BIG libraries ?
Large Spectral Libraries: Prediction Performance

1/ Laboratory conditions!
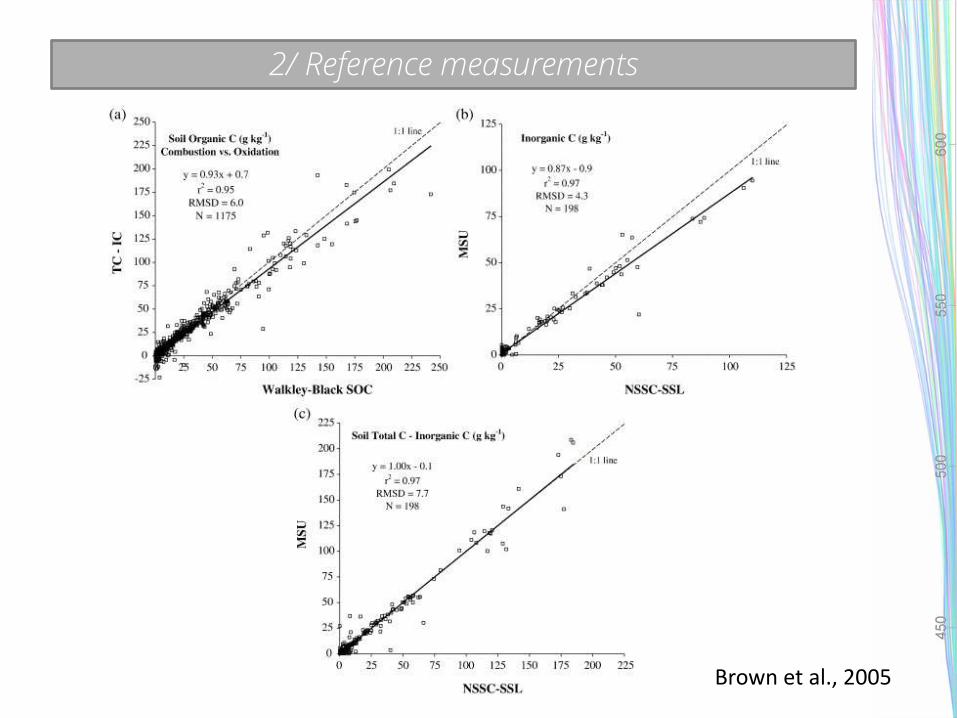
2/ Reference measurements
Brown et al., 2005

Ben Dor et al. (1999)
3/ Nature of soil spectra

Diff in albedo due to OM
OM
OM
H2O
H2O Mineralogy
CaC03
Fe ox
3/ Nature of soil spectra
Fe ox

3/ Nature of soil spectra
Soil samples in the LUCAS database having 2 % C

3/ Nature of soil spectra

3/ Nature of soil spectra
Spectroscopic models relying on cross-correlation with other properties will be highly unstable !
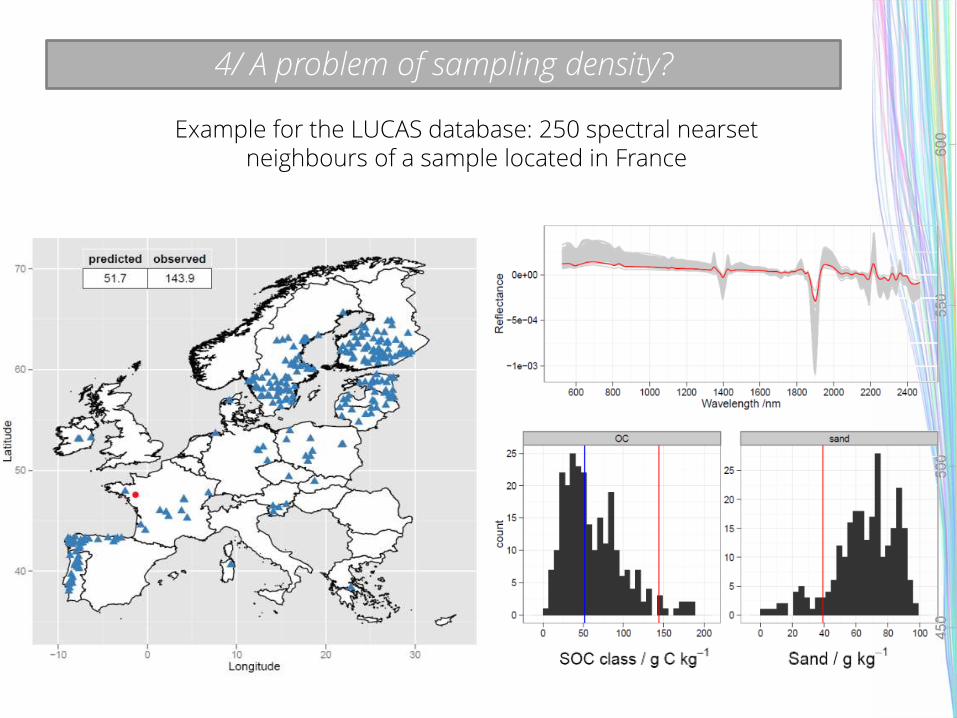
4/ A problem of sampling density?
Example for the LUCAS database: 250 spectral nearset neighbours of a sample located in France

4/ A problem of sampling density?
Soil spectral library of the Walloon region (Genot et al 2011) : Selecting neighbours with sufficient correlation
Genot et al. (2011)
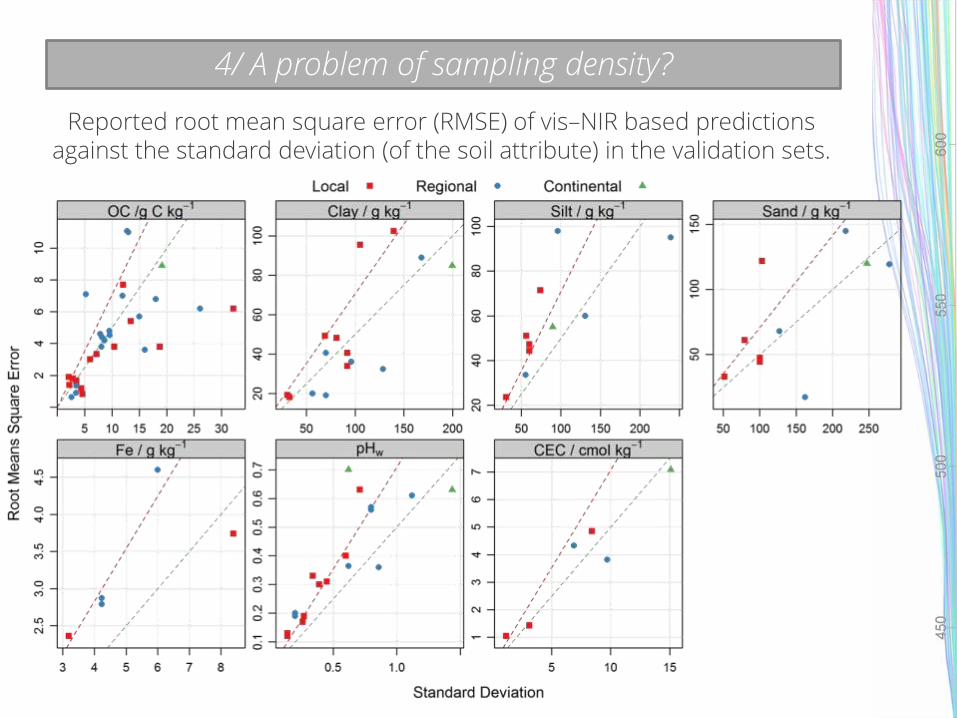
Reported root mean square error (RMSE) of vis–NIR based predictions against the standard deviation (of the soil attribute) in the validation sets.
4/ A problem of sampling density?

• Factors affecting model performance of large spectral databases:
– Variations in measuring conditions within library
– Variations in soil analytical methods
– Complexity of the soil spectra-soil properties relationship at large scale
– Low representativity of the soil diversity
• All these factors can be better controlled for small scale databases !
• Is there any solutions? (1) better protocols: garbage in, garbage out!
(2) appropriate data mining tools
(3) let’s share !
Part I : summary

PART II: Modeling a complex soil spectral
Library
Predicting OC content in the LUCAS dataset

Collected in the framework of the Land Use/Cover Area frame Statistical Survey under the supervision of the JRC to assess the state of soil across Europe.
Current status: 23 European countries
Metadata: Clay, silt, sand, OC, pH, CEC, CaCO3 content Geographical coordinates, land use, etc ~20,000 spectral readings in the vis-NIR region (400-2500 nm)
Modeling a complex Soil Spectral Library
one of the largest, most diverse and complete soil spectral library

Modeling a complex Soil Spectral Library
Spectrometer: FOSS XDS Rapid Content Analyzer
Modeling a complex Soil Spectral Library
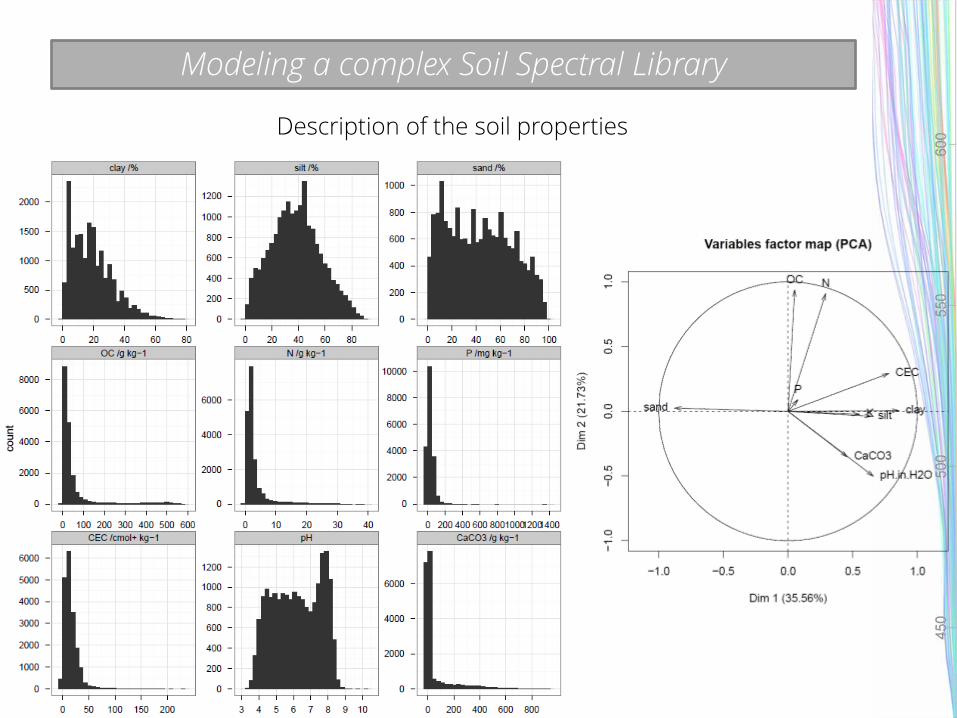
Description of the soil properties

Modeling a complex Soil Spectral Library
Loadings
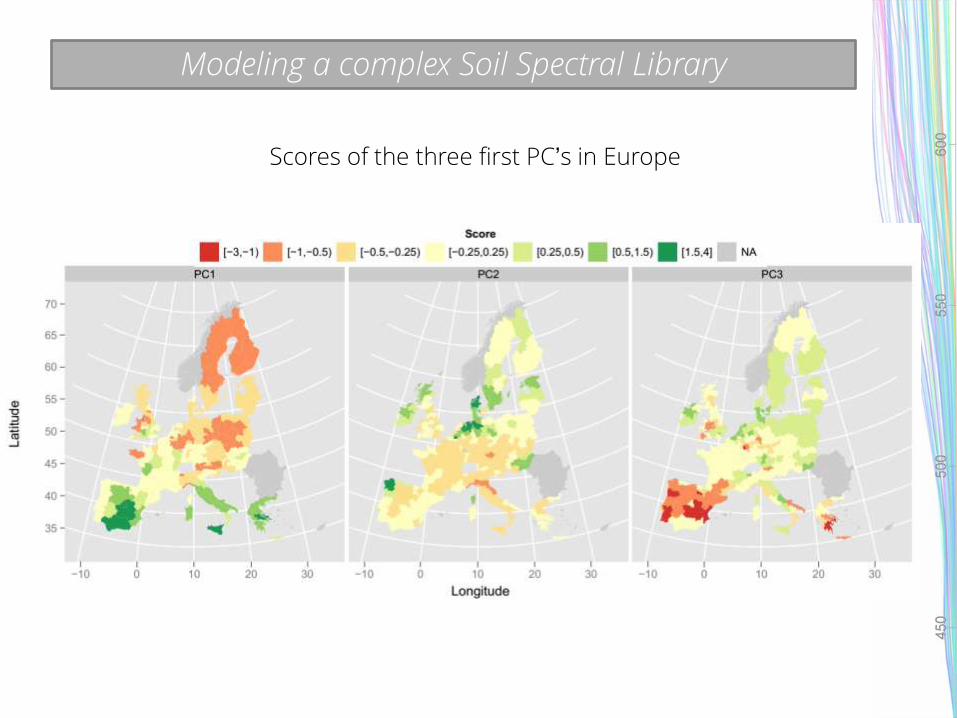
Modeling a complex Soil Spectral Library
Scores of the three first PC’s in Europe
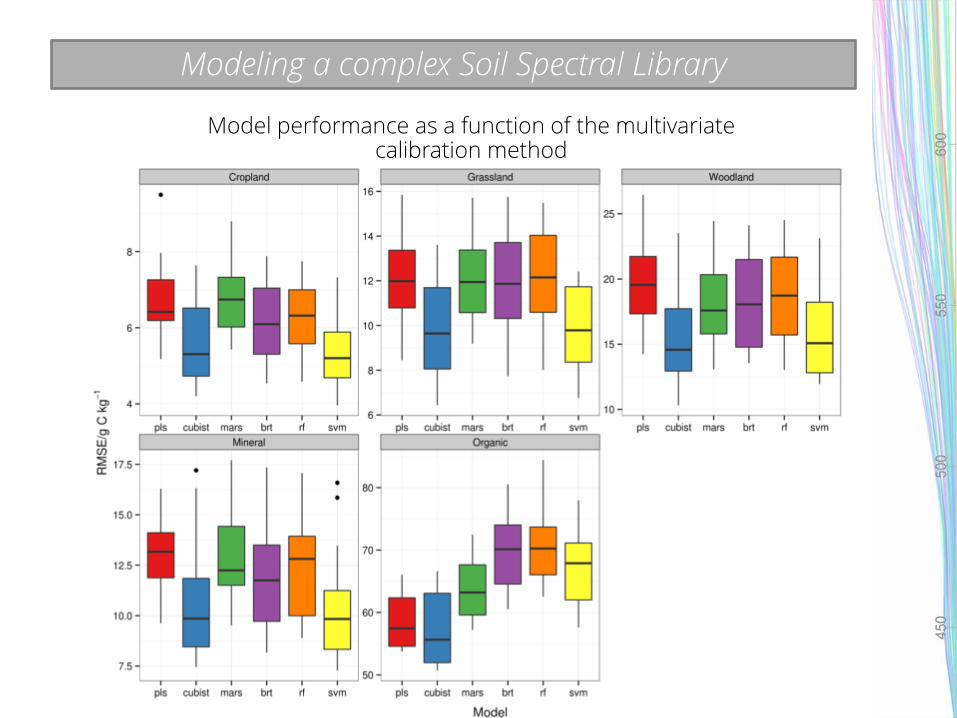
Modeling a complex Soil Spectral Library
Model performance as a function of the multivariate calibration method
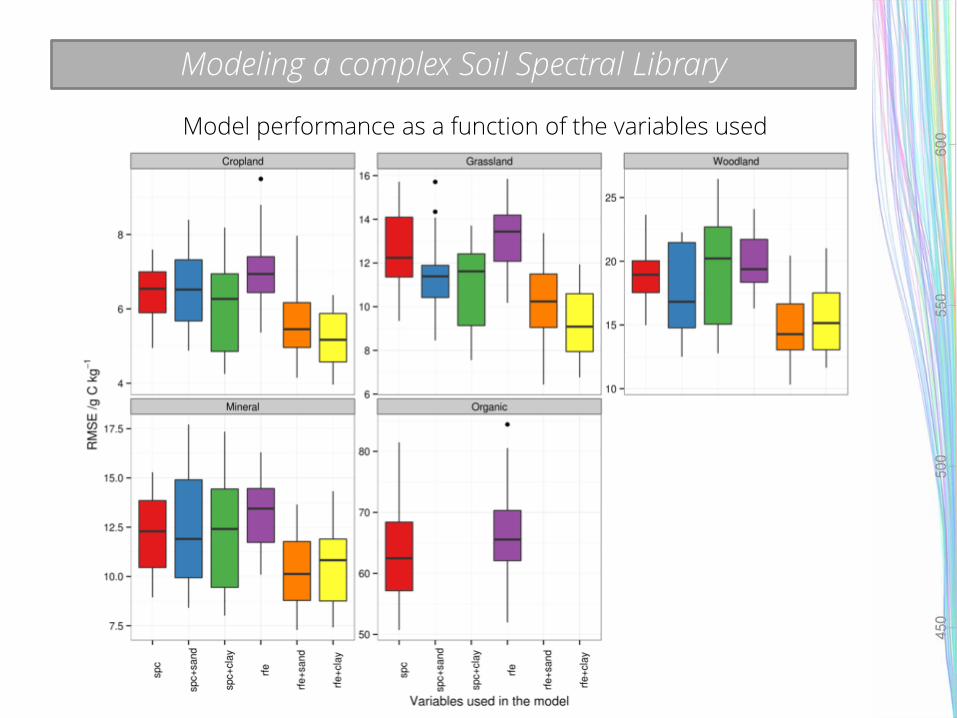
Modeling a complex Soil Spectral Library
Model performance as a function of the variables used
Modeling a complex Soil Spectral Library
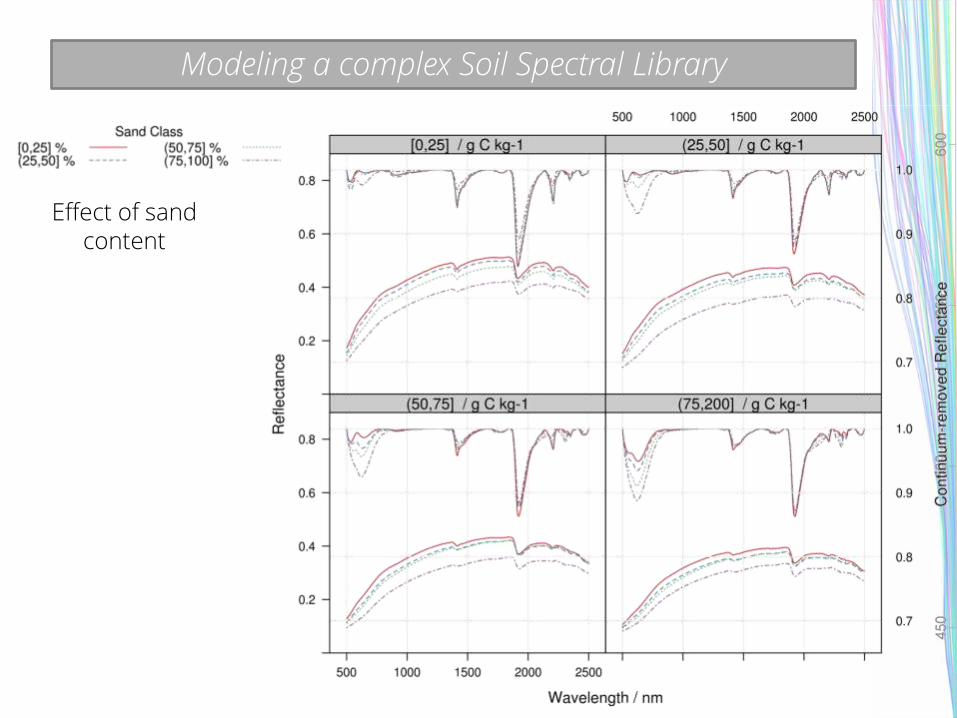
Effect of sand content

Here, we used measured sand content to improve prediction accuracy. When not available, legacy data or digital soil maps could be used to assign sand content ranges to the soil samples
Texture Land use Mineralogy
Modeling a complex Soil Spectral Library
Modeling a complex Soil Spectral Library
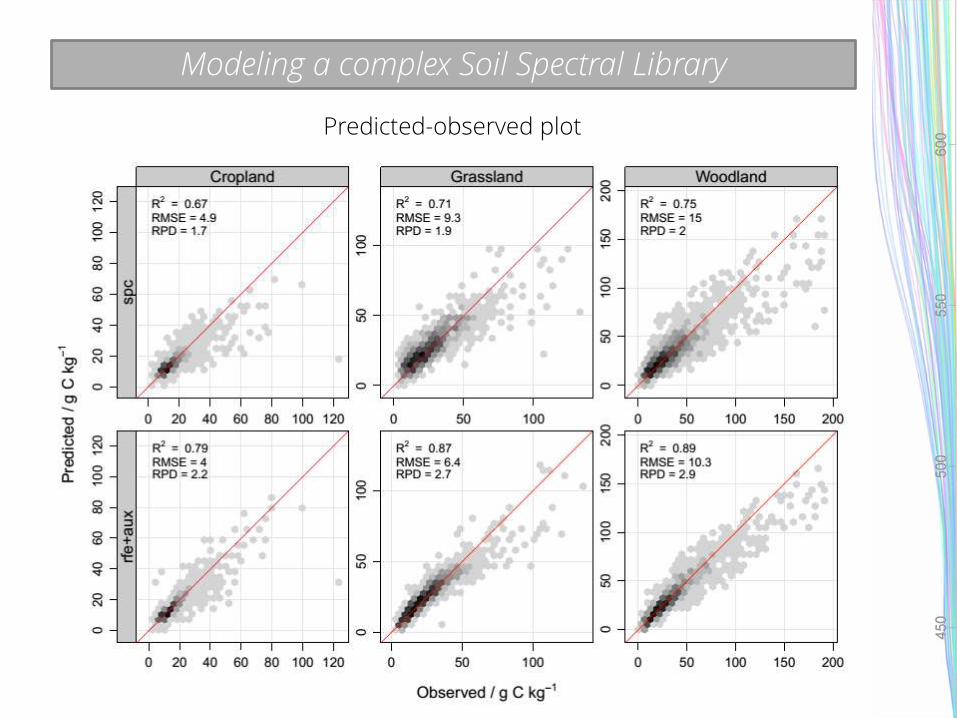
Predicted-observed plot
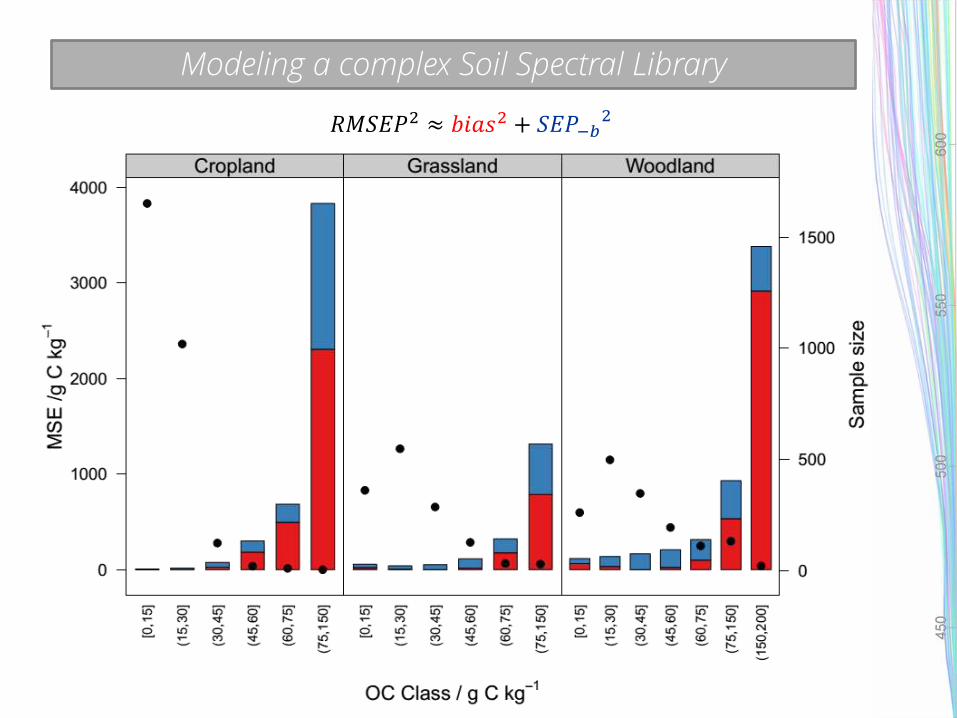
𝑅𝑀𝑆𝐸𝑃2 ≈ 𝑏𝑖𝑎𝑠2 + 𝑆𝐸𝑃−𝑏2
Modeling a complex Soil Spectral Library
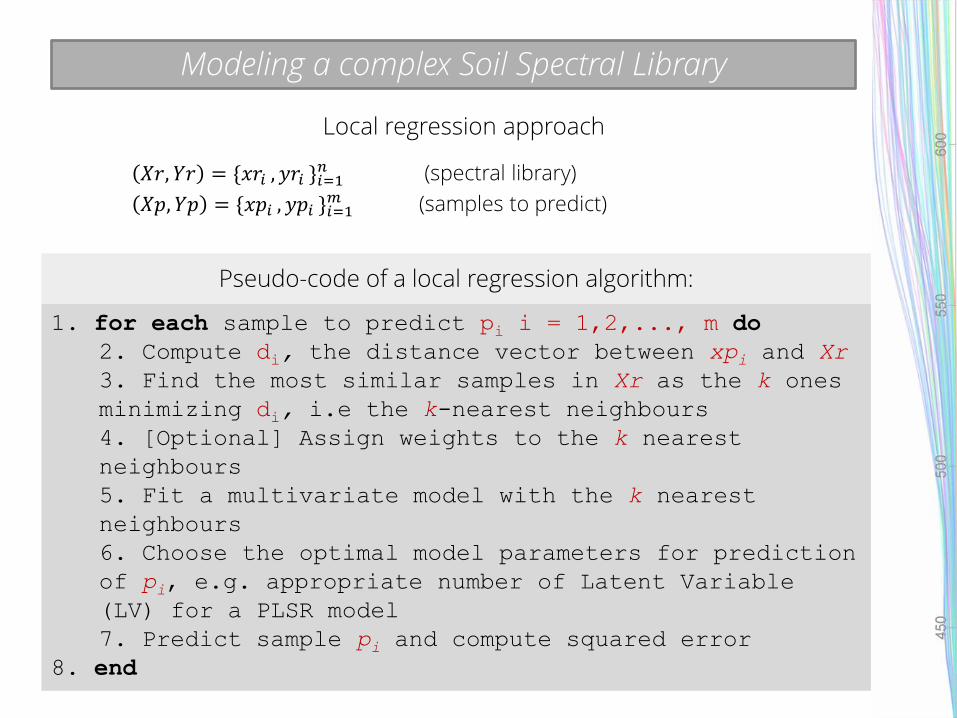
𝑋𝑟, 𝑌𝑟 = {𝑥𝑟𝑖 , 𝑦𝑟𝑖 }𝑖=1𝑛 (spectral library)
𝑋𝑝, 𝑌𝑝 = {𝑥𝑝𝑖 , 𝑦𝑝𝑖 }𝑖=1𝑚 (samples to predict)
1. for each sample to predict pi i = 1,2,..., m do
2. Compute di, the distance vector between xpi and Xr
3. Find the most similar samples in Xr as the k ones
minimizing di, i.e the k-nearest neighbours
4. [Optional] Assign weights to the k nearest
neighbours
5. Fit a multivariate model with the k nearest
neighbours
6. Choose the optimal model parameters for prediction
of pi, e.g. appropriate number of Latent Variable
(LV) for a PLSR model
7. Predict sample pi and compute squared error
8. end
Pseudo-code of a local regression algorithm:
Modeling a complex Soil Spectral Library
Local regression approach

Effect of combining spectral + covariate distance
without sand….
Modeling a complex Soil Spectral Library

with sand….
Effect of combining spectral + covariate distance
Modeling a complex Soil Spectral Library

Modeling a complex Soil Spectral Library
Model performance as a function of predictors
• The relationship between spectra and soil properties is scale-dependent and inherently local
• Metadata are crucial to partition the data into sub-groups where the relationship between spectra and soil properties are less complex.
• Level of accuracy of the models may be acceptable for a rough screening of the soil properties but still insufficient for most applications and in particular the spatial or temporal monitoring of SOC.
• Possible ways for improvement:
– Data mining tools should be developed that are capable of identifying local patterns of spectral variations with the help of readily available covariates linked with pedogenetic factors such as mineralogy, climate and land cover.
– Local modeling approach
– Increase sampling density ?
Part II: Summary

Contact details Antoine Stevens Postdoctoral Researcher Georges Lemaître Centre for Earth and Climate Research Earth and Life Institute UCLouvain Place Pasteur, 3 1348 Louvain-La-Neuve, Belgium [email protected]