Embed Size (px)
Citation preview

A Role for Mathematical Models in Program Science
Sharmistha Mishra
April 30, 2015

The “Science” of Program Science
1) How Mathematical Models could be useful tools in Program Science
2) How Program Science could advance the field of Mathematical Modelling
Examples / Focus: HIV (India, Sub-Saharan Africa)

Program Science
• “collaboration and integration between programs and science to improve the ways programs are designed, implemented and evaluated to accelerate and increase health impact”
Blanchard and Aral. STI. 2011
population
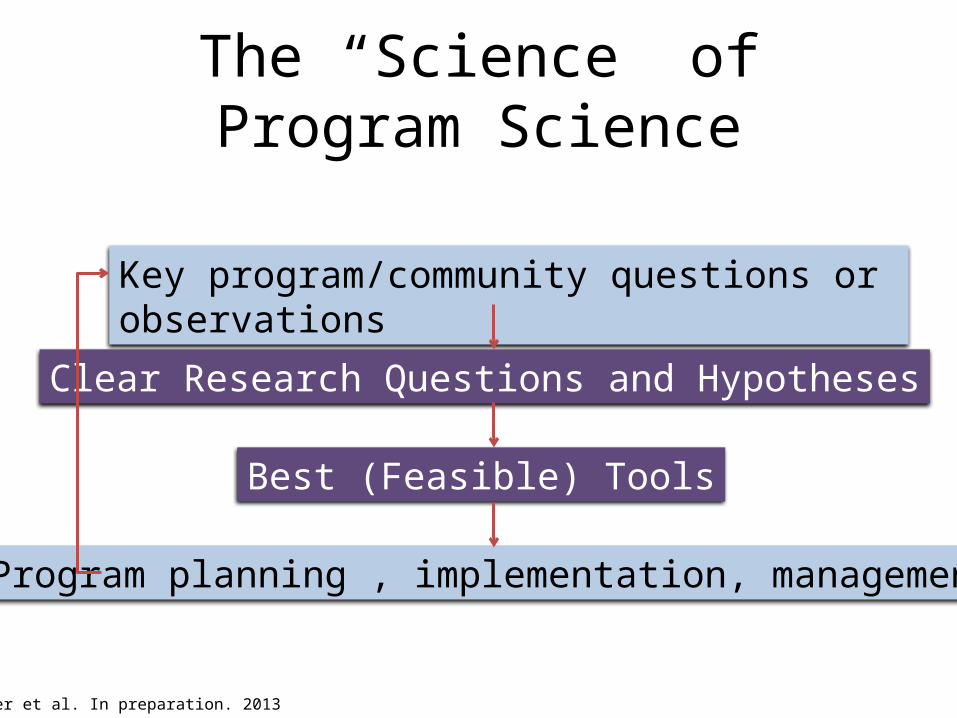
The “Science” of Program Science
Key program/community questions or observations
Clear Research Questions and Hypotheses
Program planning , implementation, management
Best (Feasible) Tools
Becker et al. In preparation. 2013

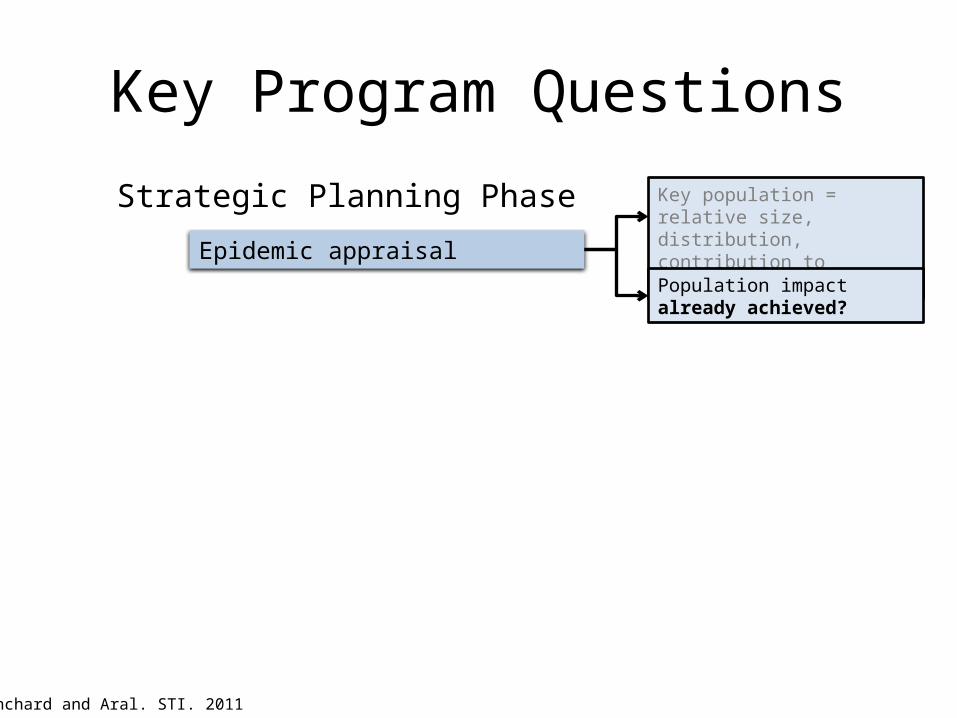
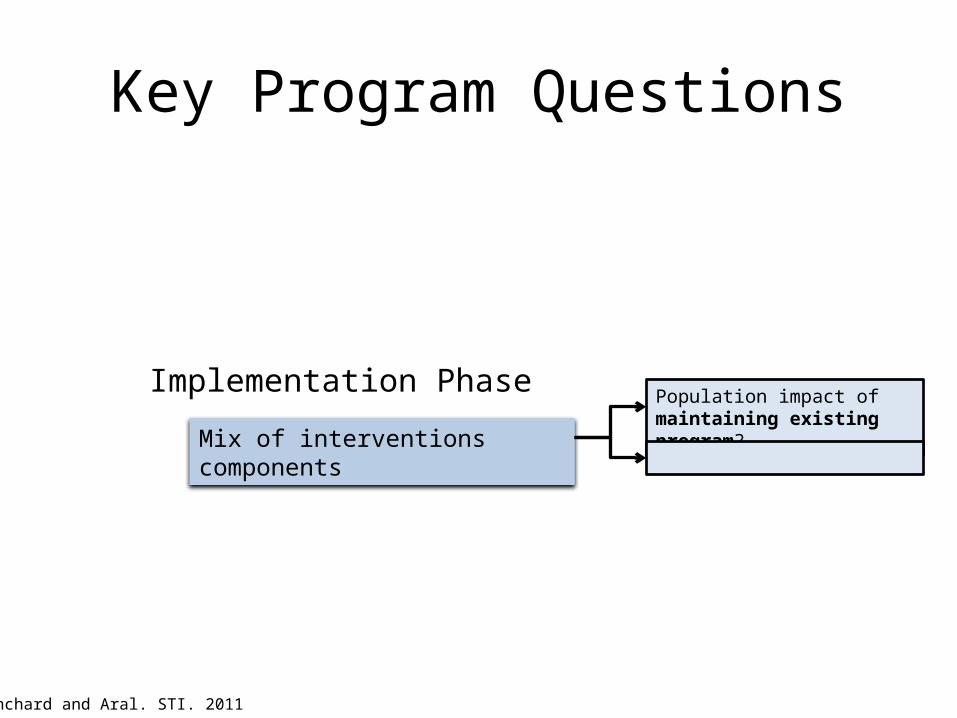
Key Program Questions
Epidemic appraisal
Key population = relative size, distribution, contribution to transmission dynamics?
Population impact already achieved?
Strategic Planning Phase
Mix of interventions components
Population impact of maintaining existing program?
Prioritization? Efficiency?
Implementation Phase
Optimal management
Duration or phases of programs?
Monitoring & EvaluationFuture Data Collection
Consolidation Phase
Blanchard and Aral. STI. 2011; Becker et al. submitted. 2015

Evidence
Empirical
“Classical “ research studies
Clinical
Diagnostic Prognostic
Therapeutic
Biology
PK/PDImmunology
Behaviour Epidemiology
Surveillance Program
Indicator Cost
Socio-political
Knowledge Syntheses
Individual-level & System-level

Evidence
Empirical
“Classical “ research studies
Clinical
Diagnostic Prognostic
Therapeutic
Biology
PK/PDImmunology
Behaviour Epidemiology
Surveillance Program
Indicator Cost
Socio-political
Knowledge Syntheses
Population-level =“More is different”Becker et al. submitted. 2015

Evidence
Empirical
“Classical “ research studies
Clinical
Diagnostic Prognostic
Therapeutic
Biology
PK/PDImmunology
Behaviour Epidemiology
Surveillance Program
Indicator Cost
Socio-political
Knowledge Syntheses
Mathematical Models (Transmission Dynamics)
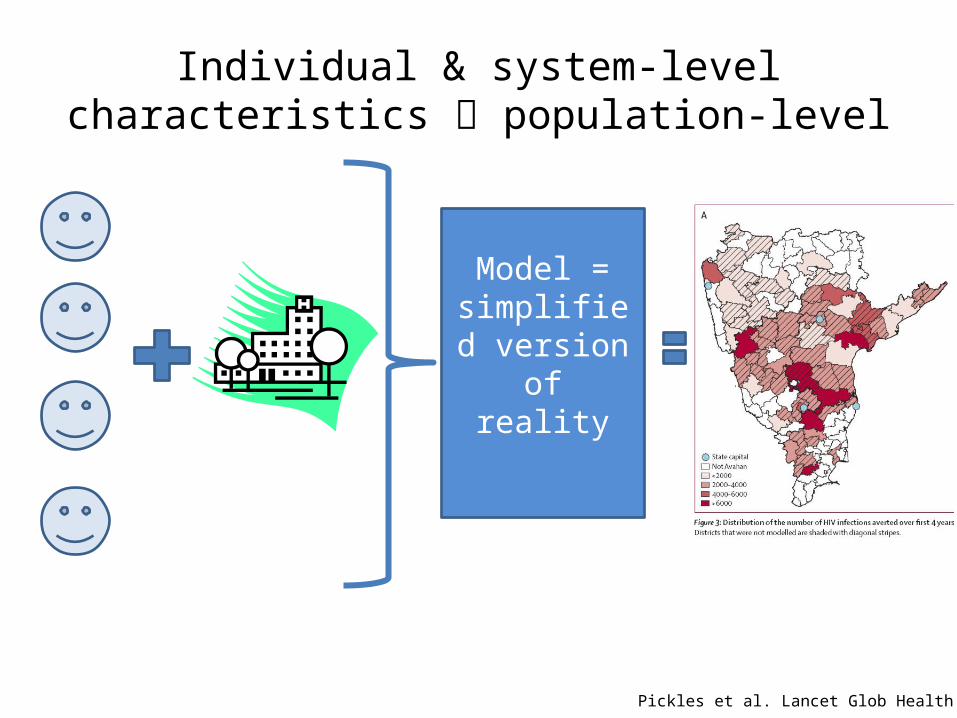
Individual & system-level characteristics population-level
Model =simplified version of
reality
Pickles et al. Lancet Glob Health. 2013

Simplified reality
Simplified version of
reality
Statistical models
Decision-tree models
Cohort models
Simulated “static” populations
Mechanistic and dynamic models
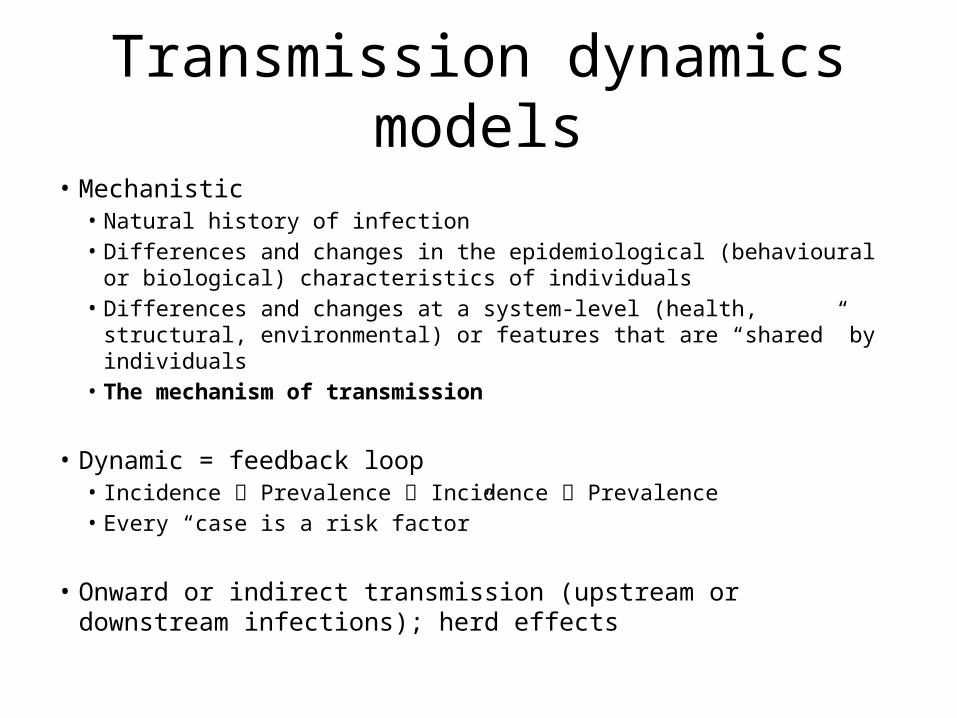
Transmission dynamics models• Mechanistic
• Natural history of infection• Differences and changes in the epidemiological (behavioural or biological)
characteristics of individuals• Differences and changes at a system-level (health, structural, environmental)
or features that are “shared” by individuals • The mechanism of transmission
• Dynamic = feedback loop• Incidence Prevalence Incidence Prevalence• Every “case is a risk factor”
• Onward or indirect transmission (upstream or downstream infections); herd effects
Examples

Key Program Questions
Epidemic appraisal
Key population = relative size, distribution, contribution to transmission dynamics?
Strategic Planning Phase

Epidemic appraisal
• The overall HIV prevalence in my district is 3.3% but 1% of women are sex workers and their HIV prevalence is 38%
• Am I dealing with a generalized HIV epidemic (overall HIV prevalence >1%)?– don’t need to prioritize prevention for sex
workers?
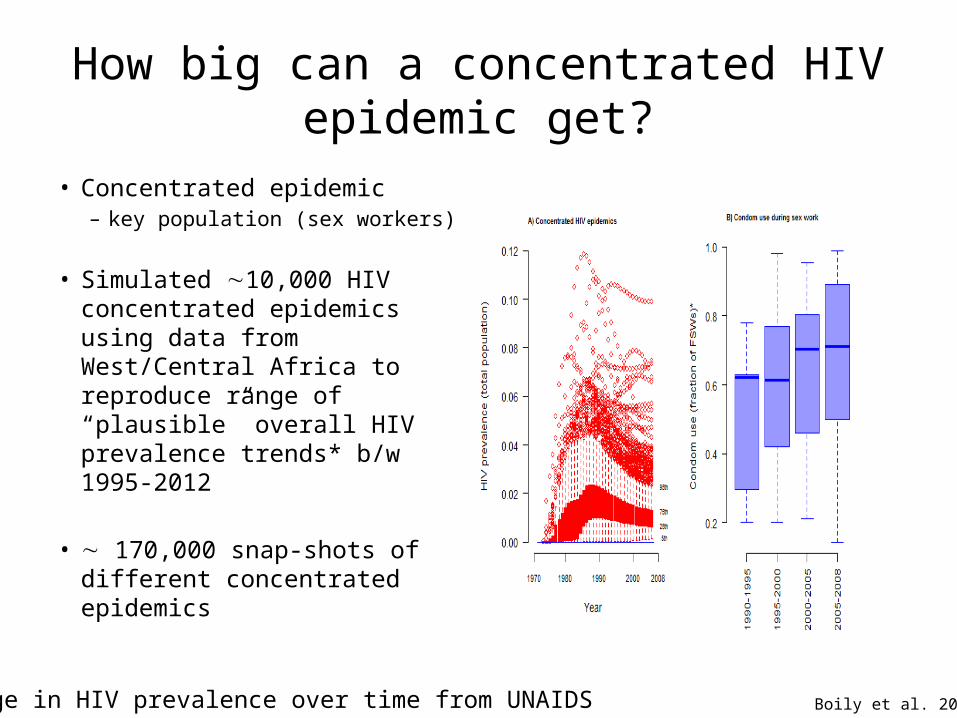
How big can a concentrated HIV epidemic get?
• Concentrated epidemic– key population (sex workers)
• Simulated 10,000 HIV concentrated epidemics using data from West/Central Africa to reproduce range of “plausible” overall HIV prevalence trends* b/w 1995-2012
• 170,000 snap-shots of different concentrated epidemics
* Range in HIV prevalence over time from UNAIDS Boily et al. 2015
Key Program Questions
Epidemic appraisal
Key population = relative size, distribution, contribution to transmission dynamics?
Population impact already achieved?
Strategic Planning Phase
Blanchard and Aral. STI. 2011

FSW HIV prevalence (Belgaum, south India)
Existing condom-based targeted interventionExisting ART program
Mishra et al. AIDS. 2013.

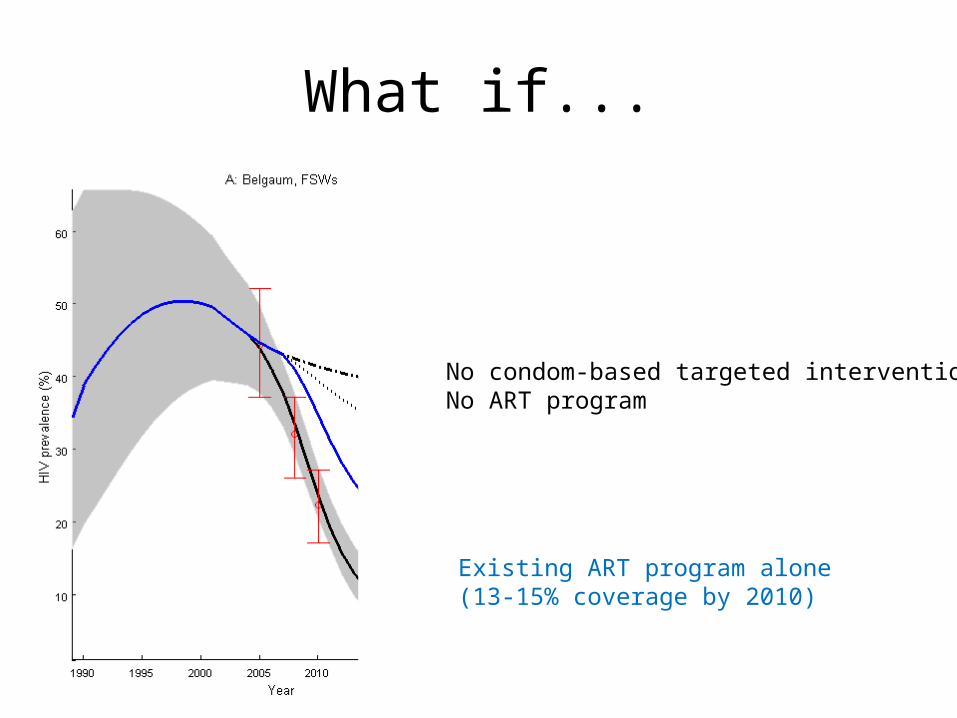
What if...
No condom-based targeted interventionNo ART program

What if...
No condom-based targeted interventionNo ART program
No condom-based targeted interventionPoor ART program (3-5% ART coverage)
What if...
Existing ART program alone(13-15% coverage by 2010)
No condom-based targeted interventionNo ART program

Existing condom-based targeted intervention has had a larger impact than existing ART program to date
No condom-based targeted interventionNo ART program
Existing ART program alone
Existing condom-based targeted Intervention alone

% HIV infections averted up to Jan 2014
% HIV infections averted (total pop.)
Belgaum Mysore Shimoga
Existing ART alone 5-11%(2006-2014)
6-18%(2007-2014)
5-9%(2008-2014)
Existing condom-based TI alone
27-47%(2004-2014)
29-55%(2004-2014)
31-48%(2004-2014)
Existing ART + condom-based TI
30-50% 32-58% 33-55%
Incremental impact of the existing ART program to date: 2-3% infections averted
Mishra et al. AIDS. 2013.
Key Program Questions
Mix of interventions components
Population impact of maintaining existing program?
Implementation Phase
Blanchard and Aral. STI. 2011

Life-years saved over next 10 years due to infections prevented vs. mortality
District (by epidemic size)
Belgaum Mysore Shimoga
Life-years saved per person-year on ART
14-26 8-21 3-5
% of life-years saved due to infections averted
13.6%(5.3-34.9%)
11.9% (4.4-23.4%)
9.7%(2.3-19.1%)
Epidemic size
80-85% of life-years saved due to mortality benefit of ART @ individual-level

Preventive potential of ART largest early in India’s HIV epidemics
1990
1992
1994
1996
1998
2000
2002
2004
2006
2008
2010
2012
2014
0%
10%
20%
30%
40%
50%
60%
70%
80%
90%
100%
% due to HIV prevention% due to increased life-expectancy
Year
%
% of life-years saved over 10 years

Key Program Questions
Mix of interventions components
Population impact of maintaining existing program?
Prioritization? Efficiency?
Implementation Phase
Blanchard and Aral. STI. 2011
0 0.5 1 1.5 2 2.50
0.2
0.4
0.6
0.8
1
1.2
1.4
1.6
500, FSWs
all HIV+, FSWs
access FSWs
access FSWs, all HIV+ FSWs
accessall HIV+
DA
LYs
aver
ted
(tho
usan
ds,
3% d
isco
unt
Additional Cost, millions $US, 3% discount
Cumulative impact over 10 yearsvs. maintain existing access & eligibility
ICER<3*GDP
Strategy on efficieny frontierDominated strategy
ICER>3*GDP
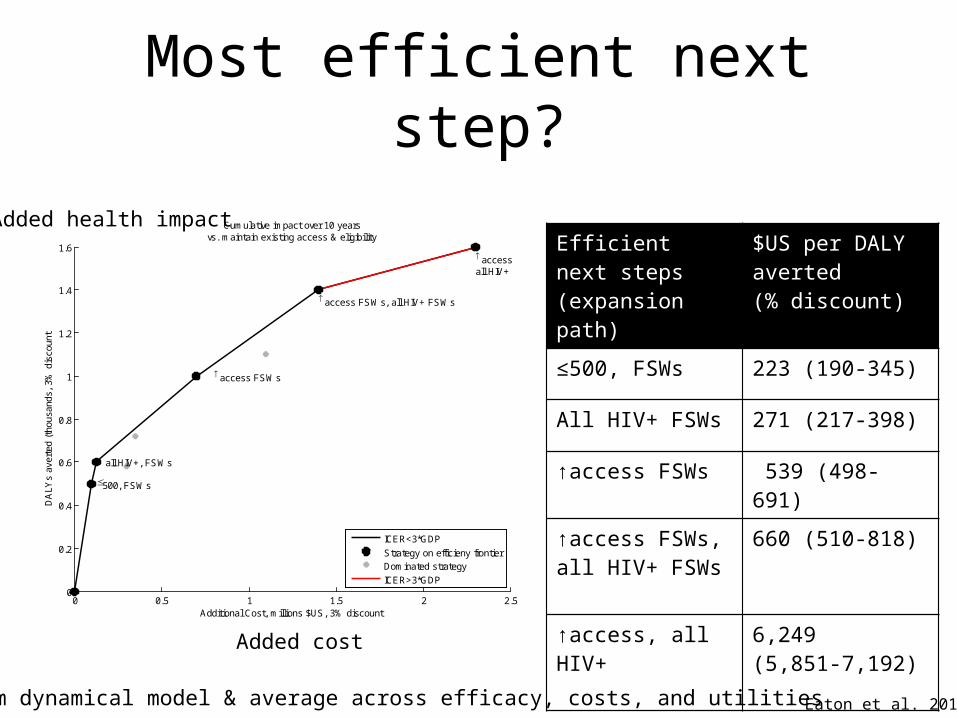
Most efficient next step?
Efficient next steps (expansion path)
$US per DALY averted(% discount)
≤500, FSWs 223 (190-345)
All HIV+ FSWs 271 (217-398)
↑access FSWs 539 (498-691)
↑access FSWs, all HIV+ FSWs
660 (510-818)
↑access, all HIV+ 6,249 (5,851-7,192)
Best fit from dynamical model & average across efficacy, costs, and utilities
Added health impact
Added cost
Eaton et al. 2014.

Key Program Questions
Optimal management
Optimal coverage? Duration or phases of programs?
Consolidation Phase
Blanchard and Aral. STI. 2011

HIV pre-exposure prophylaxis (PreP) for FSWs in Mysore, India
• Impact plateaus after 5-10 years
• Impact of 5 years of PrEP achieves:– 80% impact of 10
years of PrEP– 66% impact of 20
years of PrEP
1 year 5 years 10 years 20 years0
20
40
60
80 PreP for 20 years
Low-risk group
Clients
FSWs
# o
f H
IV in
fec
tio
ns
a
ve
rte
d
1 year 5 years 10 years 20 years0
20
40
60
80
5 years of PreP
# o
f H
IV in
fec
tio
ns
a
ve
rte
d

Key Program Questions
Optimal management
Optimal coverage? Duration or phases of programs?
Monitoring & EvaluationFuture Data Collection
Consolidation Phase
Blanchard and Aral. STI. 2011
0 0.5 1 1.5 2 2.50
0.2
0.4
0.6
0.8
1
1.2
1.4
1.6
500, FSWs
all HIV+, FSWs
access FSWs
access FSWs, all HIV+ FSWs
accessall HIV+
DA
LYs
aver
ted
(tho
usan
ds,
3% d
isco
unt
Additional Cost, millions $US, 3% discount
Cumulative impact over 10 yearsvs. maintain existing access & eligibility
ICER<3*GDP
Strategy on efficieny frontierDominated strategy
ICER>3*GDP
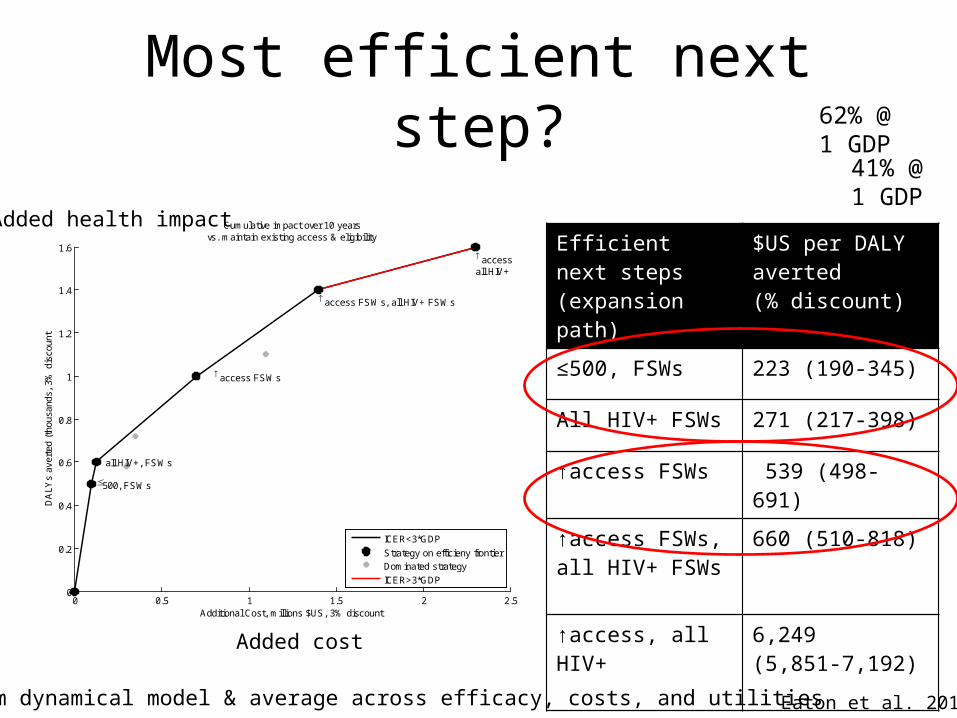
Most efficient next step?
Efficient next steps (expansion path)
$US per DALY averted(% discount)
≤500, FSWs 223 (190-345)
All HIV+ FSWs 271 (217-398)
↑access FSWs 539 (498-691)
↑access FSWs, all HIV+ FSWs
660 (510-818)
↑access, all HIV+ 6,249 (5,851-7,192)
Best fit from dynamical model & average across efficacy, costs, and utilities
Added health impact
Added cost
62% @1 GDP
41% @1 GDP
Eaton et al. 2014.

Value of information
• What data should we collect to help us choose the most cost-effective strategy (willingness to pay = 1 GDP)? re-analyze
For parameters <$20,000 USD
ART effic
acy
Reduc
tion
in m
orta
lity
Discon
tinua
tion
rate
ART re-in
itiatio
n ra
te
Cost:
Reach
ing F
SWs
Cost:
pre-
ART car
e
Cost:
re-in
itiatio
n ART
0
20
40
60
80
100
120
Decision: ≤500 vs. all HIV+ (prioritized to FSWs)
Intervention , utilities, or cost parameter
Pa
rtia
l e
xp
ec
ted
va
lue
of
pe
rfe
ct
info
rma
tio
n (
t-h
ou
sa
nd
s U
S$
)
ART efficacy (adherence)
Reduction in HIV-attributablemortality
ART discontinuation and re-initiation rates
Relative value of additional information
Mishra et al. In preparation. 2015.

A role for Program Science in Mathematical Modelling?

PS generates data
1) Model validation2) Model re-calibration3) Model modification
...models = “moving target”...

Ask first, Choose later
4) PS first asks the question, then chooses the tools will require that we design and build new (novel) mathematical models

Harness data at different scales
5) PS generate and draw from data gathered at very different scales (cellular, host, population) will require that we build the next generation of mathematical models that make best use of different data-including qualitative data
6) Knowledge syntheses could (should) play a larger role in mathematical modelling projects

Strengthen how we conduct and report uncertainty
7) Models designed to meet the needs of decision-makers (program implementers) “absence of data” ignore the mechanism models to “impute” datatest the importance of the “missing” data or “structural” assumptions
8) To inform decisions, we should provide uncertainty bounds pushing transmission dynamics modelling to utilize applications from other fields (Bayesian statistics, Health Economics)
Summary
• Mathematical Models could be useful tools in Program Science– examine the influence of individual biology,
behaviour, and the environment dynamics of disease spread in the population
• Program Science could advance the field of Mathematical Modelling


![Mathematical Models in Biology - Bio · PDF fileMathematical Models in Biology ... J.D., Mathematical Biology, Springer, 1989, [19] Edelstein-Keshet, Leah, Mathematical models in biology,](https://img.dokumen.tips/doc/110x75/5ab3fe3b7f8b9a7c5b8b587a/mathematical-models-in-biology-bio-models-in-biology-jd-mathematical-biology.jpg)