Embed Size (px)
Citation preview

Introduction Methods Results Closing
3D flow patterns at the river–aquifer interface -a case study at Cikapundung watershed |
Asian Physics Symposium 2015
Darul A., Irawan, DE., Trilaksono, NJ.,Pratama, A., andPrabowo, K.
Institut Teknologi Bandung
Aug 19, 2015

Introduction Methods Results Closing
Introduction
Methods
Results
Closing

Introduction Methods Results Closing
Introduction

Introduction Methods Results Closing
Setting• geology and watershed map

Introduction Methods Results Closing
River and the city
Cikapundung river holds a very strategic role:
• water supply: WTP Dago Pakar = 40 L/sec• hydro power (since 1923): 3.7 MW from 2 power plants• main drain for the Bandung City

Introduction Methods Results Closing
Previous researches
• Lubis (1997):• map the interactions between GW-SW measuring only GW
and RW level• completely in analog mode• therefore can’t be used for prediction
Introduction Methods Results Closing
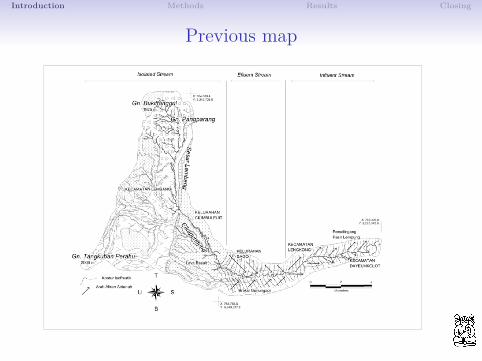
Previous map

Introduction Methods Results Closing
Water quality measurements (1980’s and late 2011)
• decreasing quality• increasing nutrients, some heavy minerals, and organic
matters

Introduction Methods Results Closing
BOD concentration

Introduction Methods Results Closing
COD concentration

Introduction Methods Results Closing
Arising issues
• high population (10,707 and still growing)• mostly lived at the riverbanks (196 ha)

Introduction Methods Results Closing

Introduction Methods Results Closing

Introduction Methods Results Closing
Methods

Introduction Methods Results Closing
Framework
• Base map was built using a total of 32 scenes ofWorldView-2 image, combined with Aster image.
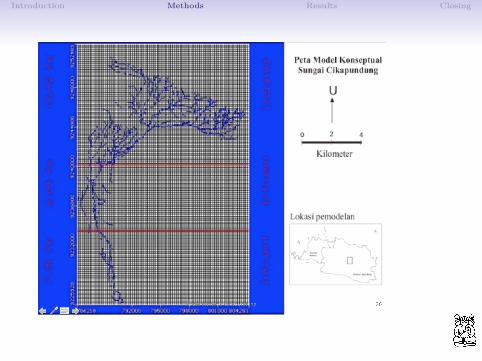
• Model:• one layer model• elevation (Z) 50 to 2000 m, 361 rows (X) and 454 columns
(Y),• covering the area of 21.6 x 27.2 km2.

Introduction Methods Results Closing
Geology
• Volcanic breccias with K=10-6 m/sec; Ss=0.02; Sy=0.02;T=0.5
• Sand and clay intercalations with K=10-8 m/sec; Ss=3.3e-6;Sy=0.08; T=0.11
• Initial head were observed at: 19 dug wells, 24 river points,and two spring points in 2013.

Introduction Methods Results Closing
Model setup
• setting up grid system• correlation• aquifer geometry prediction

Introduction Methods Results Closing
Model grid
• One layer• Model size:
• 21.64 x 27.21 Km2• 361 column x 454 rows• Elevation -50 – 2000 mdpl.
Introduction Methods Results Closing

Introduction Methods Results Closing
Geological transformation

Introduction Methods Results Closing
Color Rockred volcanic 1green volcanic 2yelow volcanic 3pink volcanic 4blue volcanic alluvium

Introduction Methods Results Closing
Samples

Introduction Methods Results Closing

Introduction Methods Results Closing
• Total 45 observasi:• 19 well obs• 24 river obs• 2 spring obs

Introduction Methods Results Closing
Results

Introduction Methods Results Closing
3D conceptual model

Introduction Methods Results Closing
Model segments2
• The conceptual model successfully replicates the previousanalytical model
• The new model shows some local variations that was notspotted in the previous model.

Introduction Methods Results Closing

Introduction Methods Results Closing
Closing

Introduction Methods Results Closing
Future directions
• Hopefully it can be the basis of a more quantitativeapproach to predict the interactions between groundwaterand river water along the stream.
• More analysis on the predictions:• water quality using multivariate analysis (cluster, PCA,
decision tree)• hydrological budget using R packages Hydromad (by
Joseph Guillaume) and Reservoir (by Sean Turner)

Introduction Methods Results Closing
Acknowledgements
• Research funding: ITB• Facility support: Groundwater Engineering Program (Head:
Agus Muhammad Ramdhan, Ph.D)• Data support: Dr. Bambang Sunarwan and Dr. R.F. Lubis

Introduction Methods Results Closing
• Field team: Irvan Febyanto, Wisnu Anugrah Pratama,Nugraha Suryakomara, dan Yoga Prasetyo
• Modeling reviewer: Janner Nababan, MT., AgathonChandra, MT., and Toddy Samuel, MT.
Introduction Methods Results Closing
Thank you
• This slides are made by R-Markdown syntax usingLATEXbackend
• Slides pdf are available at My Slideshare repo• Codes are available at My Github repo• @dasaptaerwin


![[Hydro]geological analysis using open source app: case Cikapundung River](https://img.dokumen.tips/doc/110x75/55baf9c3bb61eb2c508b46c6/hydrogeological-analysis-using-open-source-app-case-cikapundung-river.jpg)