Embed Size (px)
Citation preview

MATH& 146
Lesson 14
Section 2.3
The Hypothesis Test Procedure
1

Make-Up Final
A (semi) well-known story* goes something like this:
Four students missed the final exam for their statistics
class. They went to the professor and said, "Please,
oh please, let us make up the final. We carpool
together, and on our way to the class, we got a flat tire,
and that's why we missed the exam."
2
* Discussion of this story can be found at
http://www.snopes.com/college/exam/flattire.asp
Make-Up Final
The professor didn't believe them, but instead of
arguing he said, "Sure, you make up the exam. Be
in my office tomorrow at 8."
The next day, they met in the office. He sent each
student to a separate room and gave them an
exam. The exam consisted of only one question:
"Which tire?"
3

Make-Up Final
We don't know the outcome of this story, but let's
imagine that all four students answer, "left rear
tire."
The professor is surprised. He had assumed that
the students were lying. "Maybe," he thinks, "they
just got lucky. After all if they just guessed, they
could still all choose the same tire."
4
Make-Up Final
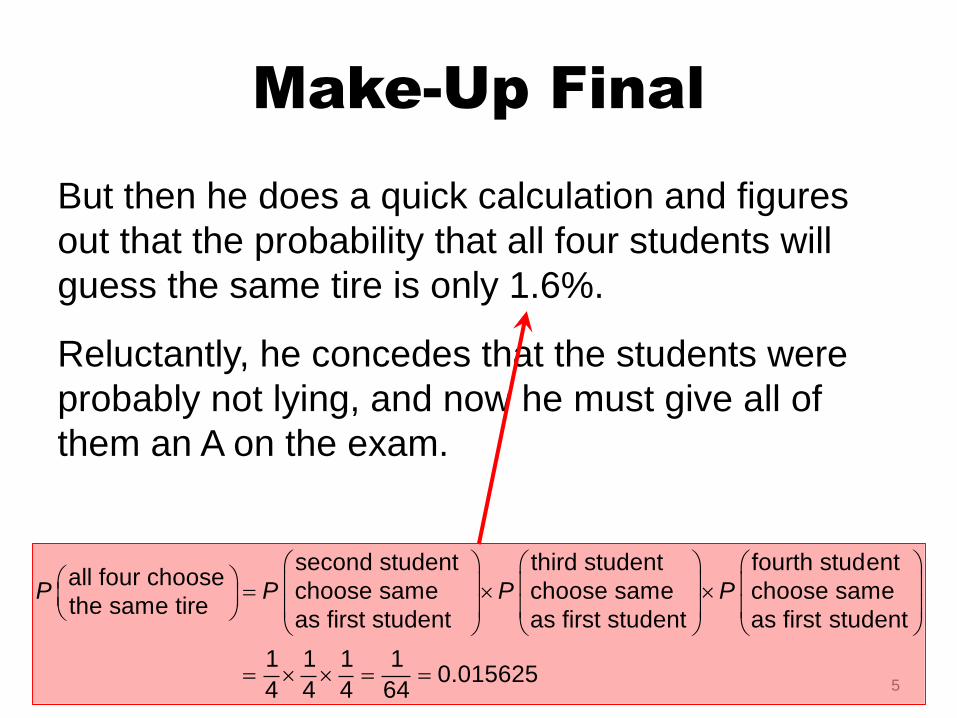
But then he does a quick calculation and figures
out that the probability that all four students will
guess the same tire is only 1.6%.
Reluctantly, he concedes that the students were
probably not lying, and now he must give all of
them an A on the exam.
5
second student third student fourth student all four choose
choose same choose same choose same the same tire
as first student as first student as first student
1 1
4 4
P P P P
1 1
0.0156254 64
Hypothesis Testing
The statistics professor has just performed an
hypothesis test. Hypothesis testing is a formal
procedure that enables us to choose between two
hypotheses when we are uncertain about our
measurements.
Hypothesis testing is called a formal procedure
because it is based on particular terminology and a
rather well-specified set of steps.
6
Hypothesis Testing
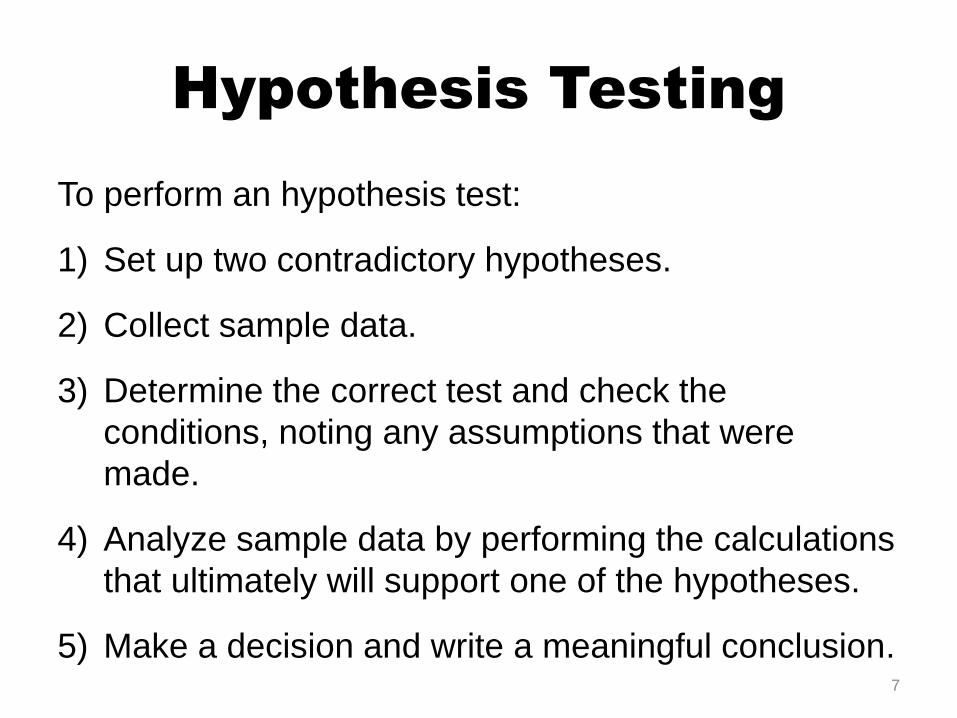
To perform an hypothesis test:
1) Set up two contradictory hypotheses.
2) Collect sample data.
3) Determine the correct test and check the
conditions, noting any assumptions that were
made.
4) Analyze sample data by performing the calculations
that ultimately will support one of the hypotheses.
5) Make a decision and write a meaningful conclusion.7
The Hypotheses
In testing the truthfulness of his students, the
statistics professor had two competing claims:
H0: The students were telling the truth.
HA: The students were not telling the truth.
We call H0 the null hypothesis and HA the
alternative hypothesis.
8
The Hypotheses
The null hypothesis, H0, is the conservative, status-
quo, business-as-usual statement about a population
parameter. In the context of researching new ideas,
the null hypothesis often represents "no change," "no
effect," or "no difference."
The alternative hypothesis, HA, is the research
hypothesis. It is usually a statement about the value of
a parameter that we hope to demonstrate is true.
9

Example 1
State the null and alternative hypotheses.
a) You are testing a new design for airbags used
in automobiles, and you are concerned that
they might not open properly.
b) A US court considers two possible claims about
a defendant: she is either innocent or guilty.
10
Symbols Used in H0
and HA
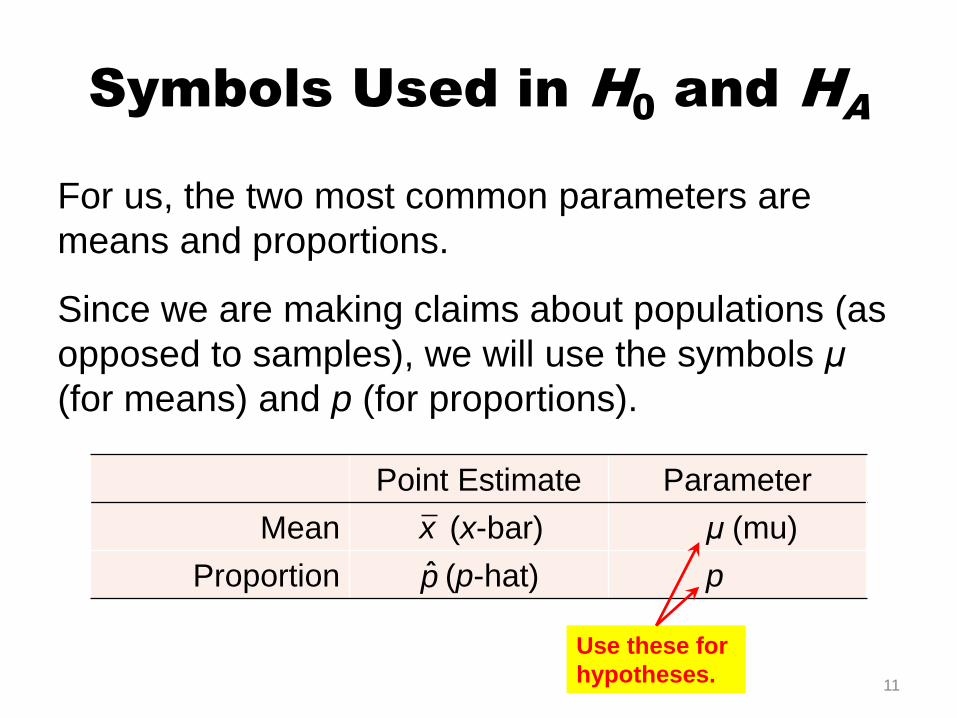
For us, the two most common parameters are
means and proportions.
Since we are making claims about populations (as
opposed to samples), we will use the symbols μ
(for means) and p (for proportions).
11
Point Estimate Parameter
Mean (x-bar) μ (mu)
Proportion (p-hat) p
x
p̂
Use these for
hypotheses.

Symbols Used in H0
and HA
To keep it simple, the null hypothesis is almost
always written with the equal sign (=). This
practice is acceptable because our goal is to prove
the alternative hypothesis, not the null.
12
H0 HA
equal (=) not equal to (≠)
greater than or equal to (≥) less than (<)
less than or equal to (≤) more than (>)

Writing Hypotheses
In general, hypotheses can be written as follows:
13
0 :
: A
H parameter null value
H parameter null value

Example 2
The manufacturer of a new car model advertises that
the car averages 38 miles per gallon on the highway.
A consumer group says that this claim is overstated
and that the actual average (mean) is less than 38
miles per gallon. State the null and alternative
hypotheses for a hypothesis test.
Note: We call 38 the null value since it represents the
value of the parameter if the null hypothesis is true.
14
P-Values
Hypothesis testing is built around rejecting or
failing to reject the null hypothesis. That is, we do
not reject H0 unless we have strong evidence.
But what precisely does strong evidence mean?
15

P-Values
It would be helpful to quantify the strength of the
evidence against the null hypothesis.
In the beginning anecdote, the professor was
trying to determine the truthfulness of his students.
He determined that by chance alone, the
probability that all four students would choose the
same tire was less than 2%, which suggests that
the students were not just guessing.
16
P-Values
When results like these are inconsistent with H0,
we reject H0 in favor of HA. Here, the professor
concluded that the students were not lying.
This 2-in-100 chance is what is called a p-value,
which is the probability quantifying the strength of
the evidence against the null hypothesis and in
favor of the alternative.
17
P-Values
The p-value is the probability of observing data at
least as favorable to the alternative hypothesis as
our current data set, if the null hypothesis is true.
We typically use a summary statistic of the data,
such as the difference in proportions, to help
compute the p-value and evaluate the hypotheses.
This summary value that is used to compute the p-
value is often called the point estimate.
18

Significance Levels
As a general rule of thumb (more on this later), for
those cases where the null hypothesis is actually
true, we do not want to incorrectly reject H0 more
than 5% of the time.
This corresponds to a significance level of 0.05.
We often write the significance level using (the
Greek letter alpha): α = 0.05.
19
P-Values and Decisions
When the p-value is smaller than the significance
level, we say the results are statistically
significant.
This means the data provide such strong evidence
against H0 that we reject the null hypothesis in
favor of the alternative hypothesis.
Note: While the significance level is often set to
α = 0.05, it can vary depending on the field or the
application.
20
P-Values and Decisions
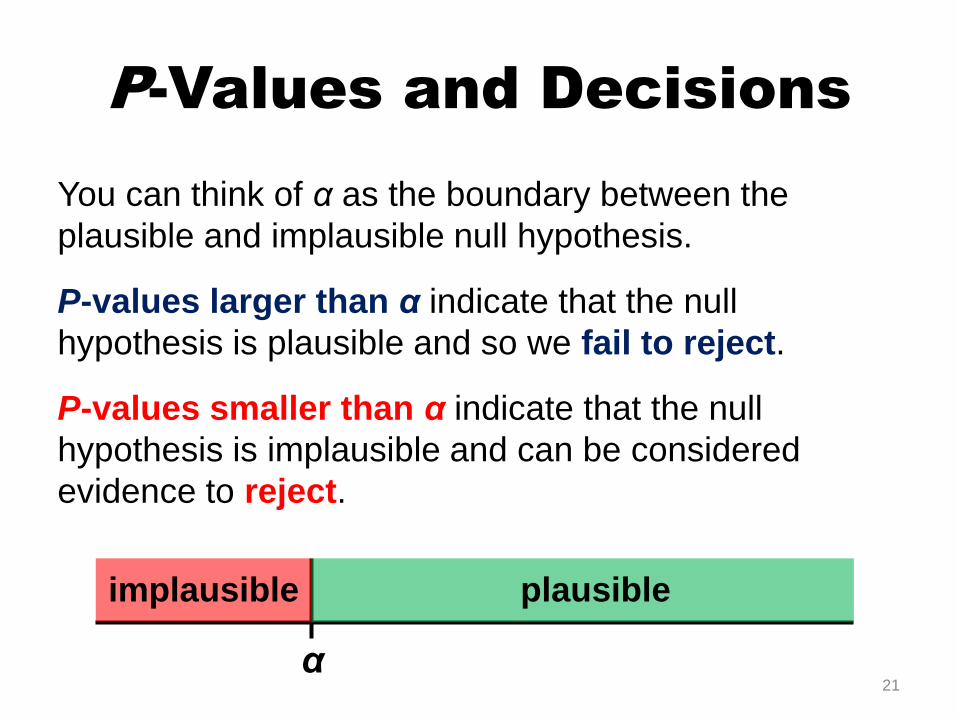
You can think of α as the boundary between the
plausible and implausible null hypothesis.
P-values larger than α indicate that the null
hypothesis is plausible and so we fail to reject.
P-values smaller than α indicate that the null
hypothesis is implausible and can be considered
evidence to reject.
21α
plausibleimplausible
Fail to Reject
A null hypothesis is not accepted just because it is
not rejected. Data not sufficient to show
convincingly the alternative hypothesis do not
prove that the null hypothesis is true.
It might be the null hypothesis is true, or it may be
that the sample was too small. For that reason,
we never accept the null hypothesis, only fail to
reject.
22

Example 3
In the opportunity cost study (Lesson 13), we analyzed
an experiment where study participants were 20% less
likely to continue with a DVD purchase if they were
reminded that the money, if not spent on the DVD,
could be used for other purchases in the future. We
determined that such a large difference would only
occur about 1-in-150 times if the reminder actually had
no influence on student decision-making.
What is the p-value in this study? Was the result
statistically significant?
23
Why 0.05?
We often use a threshold of 0.05 to determine
whether a result is statistically significant. But why
0.05? Maybe we should use a bigger number, or
maybe a smaller number.
If you're a little puzzled, that probably means
you're reading with a critical eye – good job!
24

Why 0.05?
The truth is that 0.05 is an arbitrary, though
universally accepted, cutoff point that dates back
to the early twentieth century and statistics pioneer
R.A. Fisher (1890 – 1962).
The number 0.05 corresponds to 1-in-20 and
borders the boundary between the likely and
unlikely.
Also, as we will see later, 0.05 works nicely with
the normal distribution.
25
Decision Errors
One caution: hypothesis tests are not flawless.
Just think of the court system: innocent people are
sometimes wrongly convicted and the guilty
sometimes walk free. Similarly, we can make a
wrong decision in statistical hypothesis tests.
However, the difference is that we have the tools
necessary to quantify how often we make such
errors.
26

Decision Errors
There are two competing hypotheses: the null and
the alternative. In a hypothesis test, we make a
statement about which one might be true, but we
might choose incorrectly. There are four possible
scenarios in a hypothesis test, which are
summarized below.
27
Test conclusion
do not reject H0 reject H0 in favor of HA
Truth
H0 trueCorrect Outcome
(True Negative)
Type 1 Error
(False Positive)
HA trueType 2 Error
(False Negative)
Correct Outcome
(True Positive)
Type 1 Errors
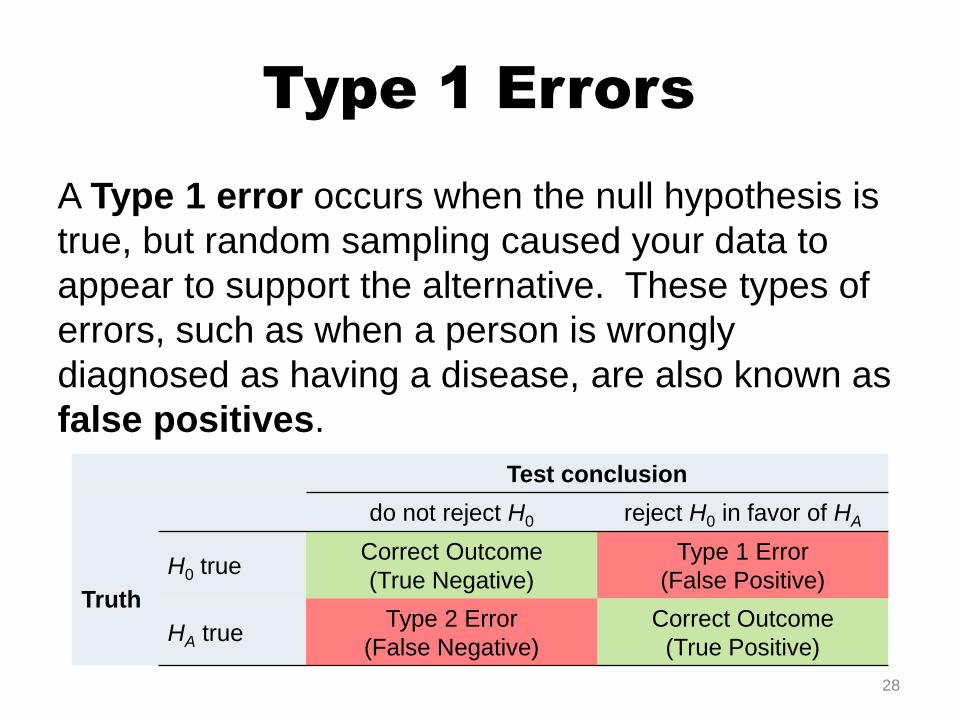
A Type 1 error occurs when the null hypothesis is
true, but random sampling caused your data to
appear to support the alternative. These types of
errors, such as when a person is wrongly
diagnosed as having a disease, are also known as
false positives.
28
Test conclusion
do not reject H0 reject H0 in favor of HA
Truth
H0 trueCorrect Outcome
(True Negative)
Type 1 Error
(False Positive)
HA trueType 2 Error
(False Negative)
Correct Outcome
(True Positive)

Type 2 Errors
A Type 2 error occurs when the null hypothesis
really is false, but random sampling caused your
data to not reject the null. These types of errors,
such as when an infected person is given a clean
bill of health, are also known as false negatives.
29
Test conclusion
do not reject H0 reject H0 in favor of HA
Truth
H0 trueCorrect Outcome
(True Negative)
Type 1 Error
(False Positive)
HA trueType 2 Error
(False Negative)
Correct Outcome
(True Positive)

Example 4
a) In a US court, the defendant is either innocent (H0)
or guilty (HA). What does a Type 1 Error represent
in this context? What does a Type 2 Error
represent?
b) How could we reduce the Type 1 Error rate in US
courts? What influence would this have on the
Type 2 Error rate?
c) How could we reduce the Type 2 Error rate in US
courts? What influence would this have on the
Type 1 Error rate?
30

Error "Tug-of-War"
The previous example provide an important
lesson: if we reduce how often we make one type
of error, we generally make more of the other type.
The only way to reduce both is to take larger
samples. Even then, the errors will rarely be 0.
31
Choosing the Significance Level
Usually when choosing a significance level, we will
use the industry standard of α = 0.05. However, it
is often helpful to adjust the significance level
based on the application.
For example, α = 0.10 and α = 0.01 are also
commonly used levels of significance.
32

Choosing the Significance Level
If making a Type 1 Error is dangerous or especially
costly, we should choose a small significance level
(e.g. 0.01). In this case, we would demand very
strong evidence favoring HA before rejecting H0.
If a Type 2 Error is relatively more dangerous or
much more costly than a Type 1 Error, then we
should choose a higher significance level (e.g.
0.10). In this case, we would want to be cautious
about failing to reject H0 when the null is actually
false.
33

Choosing the Significance Level
The significance level selected for a test should
reflect the real-world consequences associated
with making a Type 1 or Type 2 Error.
• If Type 1 is much worse than Type 2, reduce the
significance level to reduce the false positives.
• If Type 2 is much worse than Type 1, increase
the significance level to reduce the false
negatives.
34

Example 5
A part inside of a machine is very expensive to
replace. However, the machine usually functions
properly even if this part is broken, so the part is
replaced only if we are extremely certain it is
broken based on a series of measurements.
Identify appropriate hypotheses for this test (in
plain language) and suggest an appropriate
significance level.
35

Example 5 Solution
H0: The part is not broken.
HA: The part is broken.
A Type 1 Error would be made if the part really is not
broken but we think it is and replace it (at great
expense).
A Type 2 Error would be made if the part really is
broken but we do not think so and leave it alone (with
no great cost).
Financially, a Type 1 Error is much worse, so reducing
the significance level to 0.01 would be appropriate.36