Embed Size (px)
Citation preview
VISUALIZING EUROZONE BOND CRISIS
London 19 June 2015
FNA
Alan LaubschDirector FNA Ltd. www.fna.fi
2
Agenda
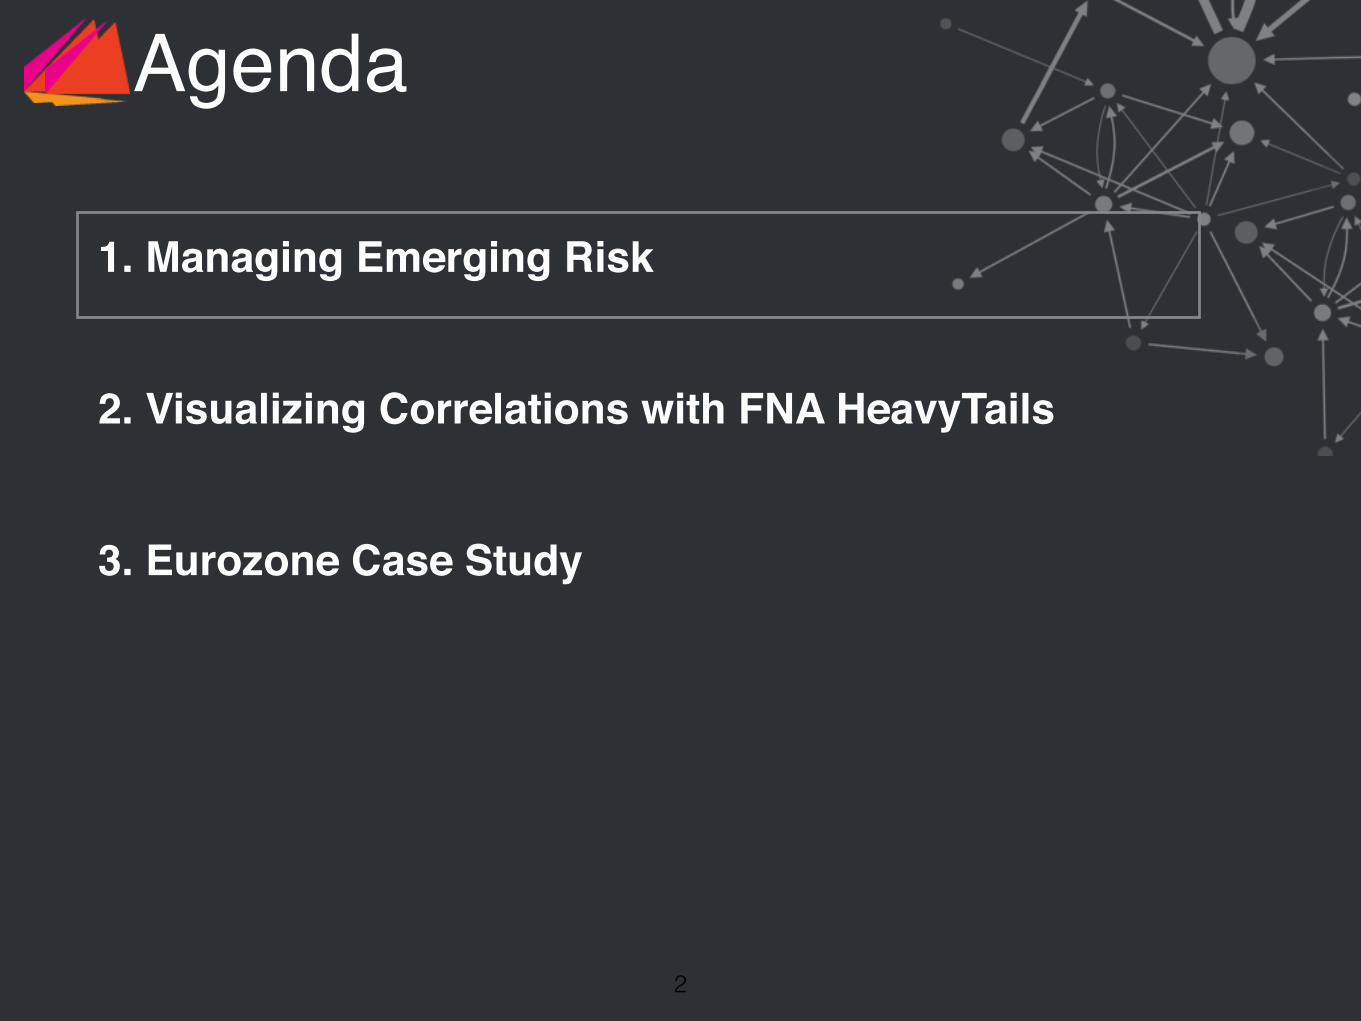
1. Managing Emerging Risk
2. Visualizing Correlations with FNA HeavyTails
3. Eurozone Case Study
3
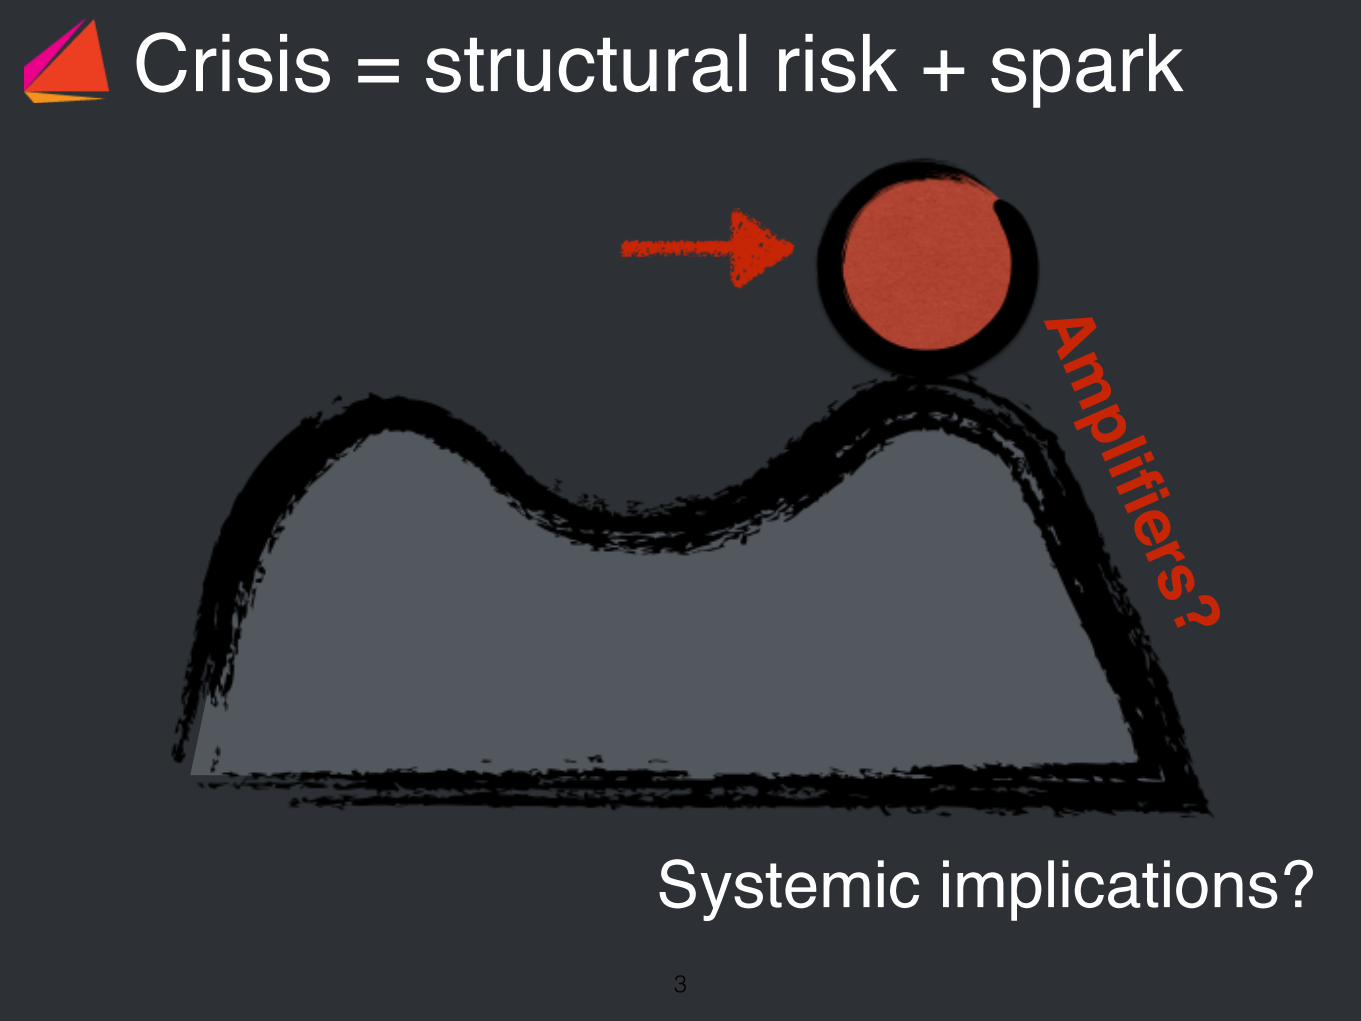
Systemic implications?
Amplifiers?
Crisis = structural risk + spark
4
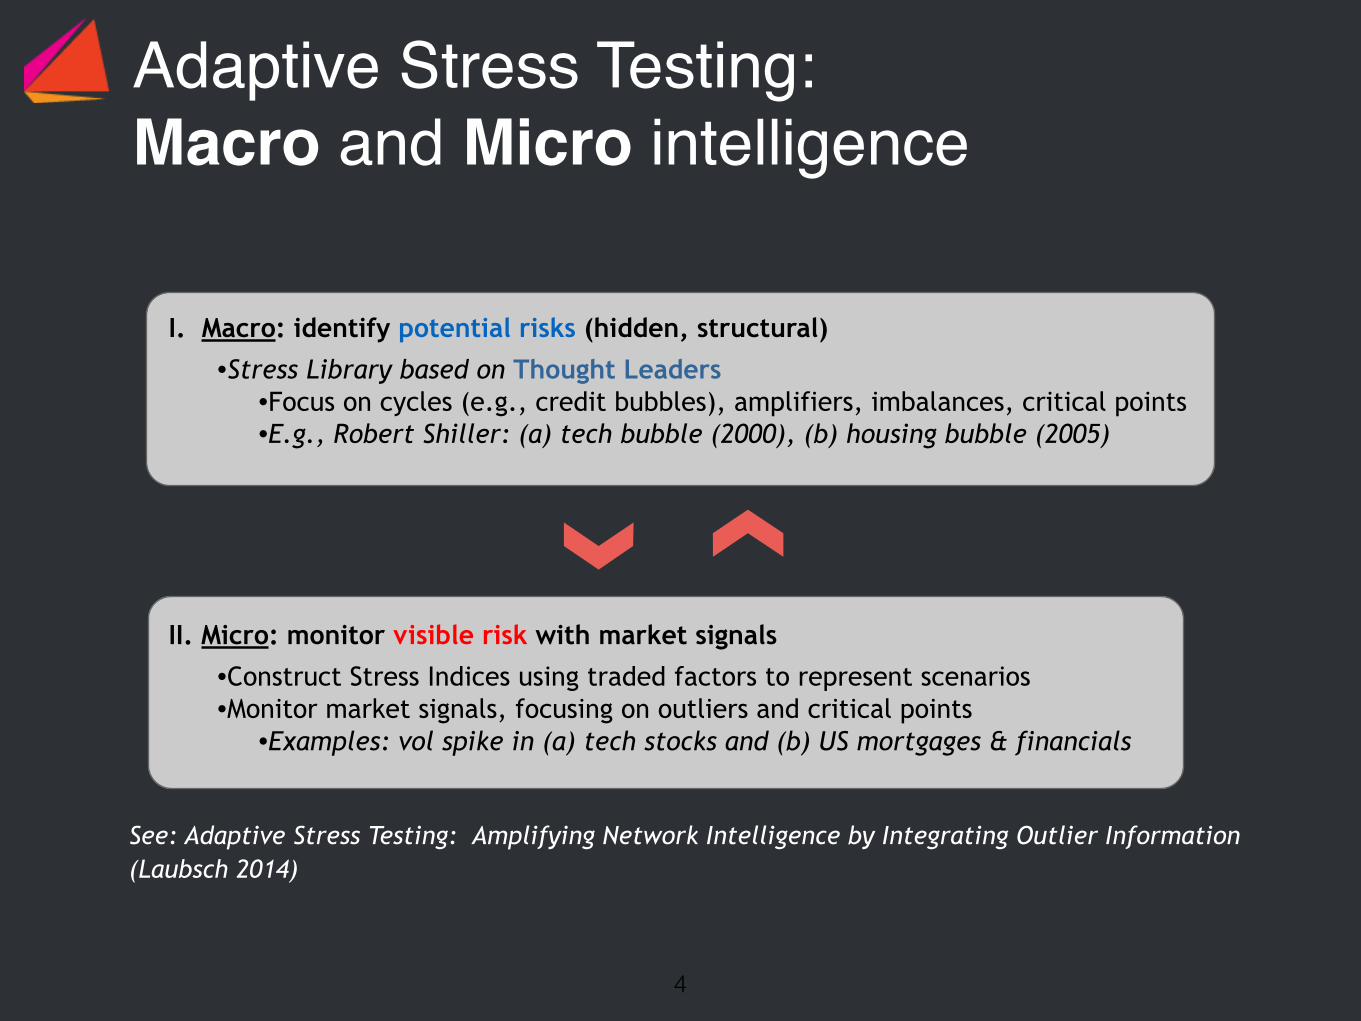
Adaptive Stress Testing: Macro and Micro intelligence
I. Macro: identify potential risks (hidden, structural)
•Stress Library based on Thought Leaders •Focus on cycles (e.g., credit bubbles), amplifiers, imbalances, critical points •E.g., Robert Shiller: (a) tech bubble (2000), (b) housing bubble (2005)
II. Micro: monitor visible risk with market signals
•Construct Stress Indices using traded factors to represent scenarios •Monitor market signals, focusing on outliers and critical points •Examples: vol spike in (a) tech stocks and (b) US mortgages & financials
See: Adaptive Stress Testing: Amplifying Network Intelligence by Integrating Outlier Information (Laubsch 2014)
5
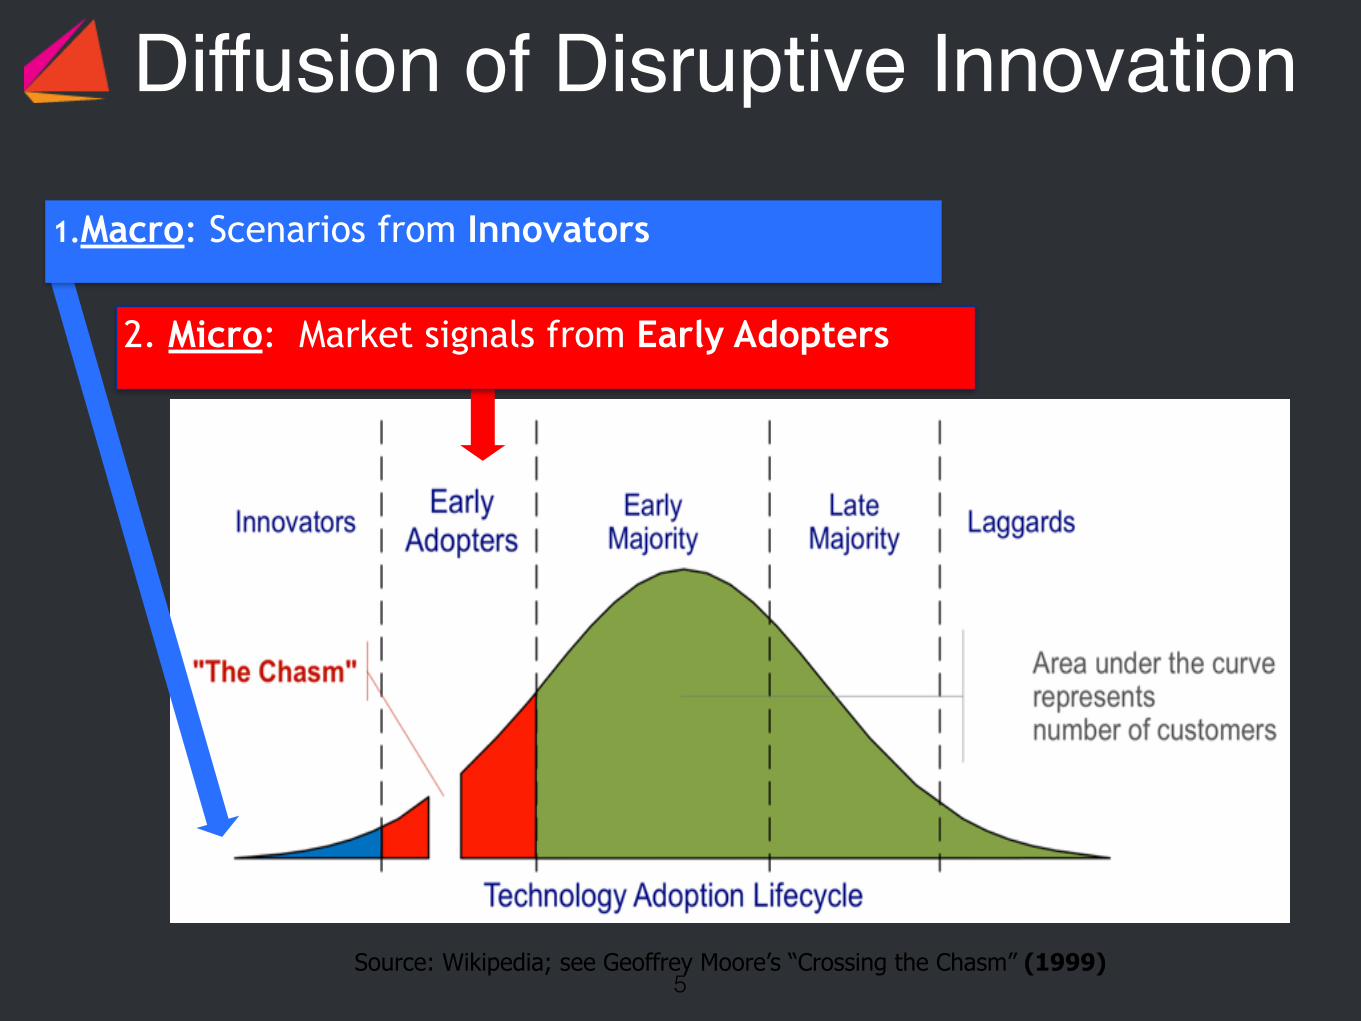
Diffusion of Disruptive Innovation
Source: Wikipedia; see Geoffrey Moore’s “Crossing the Chasm” (1999)
1.Macro: Scenarios from Innovators
2. Micro: Market signals from Early Adopters

6
Agenda
1. Managing Emerging Risk
2. Visualizing Correlations with FNA HeavyTails
3. Eurozone Case Study

Time Series and Correlations
…" Example: Daily returns of asset prices (ETFs)
Difficult to understand large-scale correlation or other dependence structures of financial assets.
Objective is to:
Efficiently represent a complex system moving in time
Visualize and predicts stress events in their context
Overlay multiple dimensions of the data to allow for visual inference
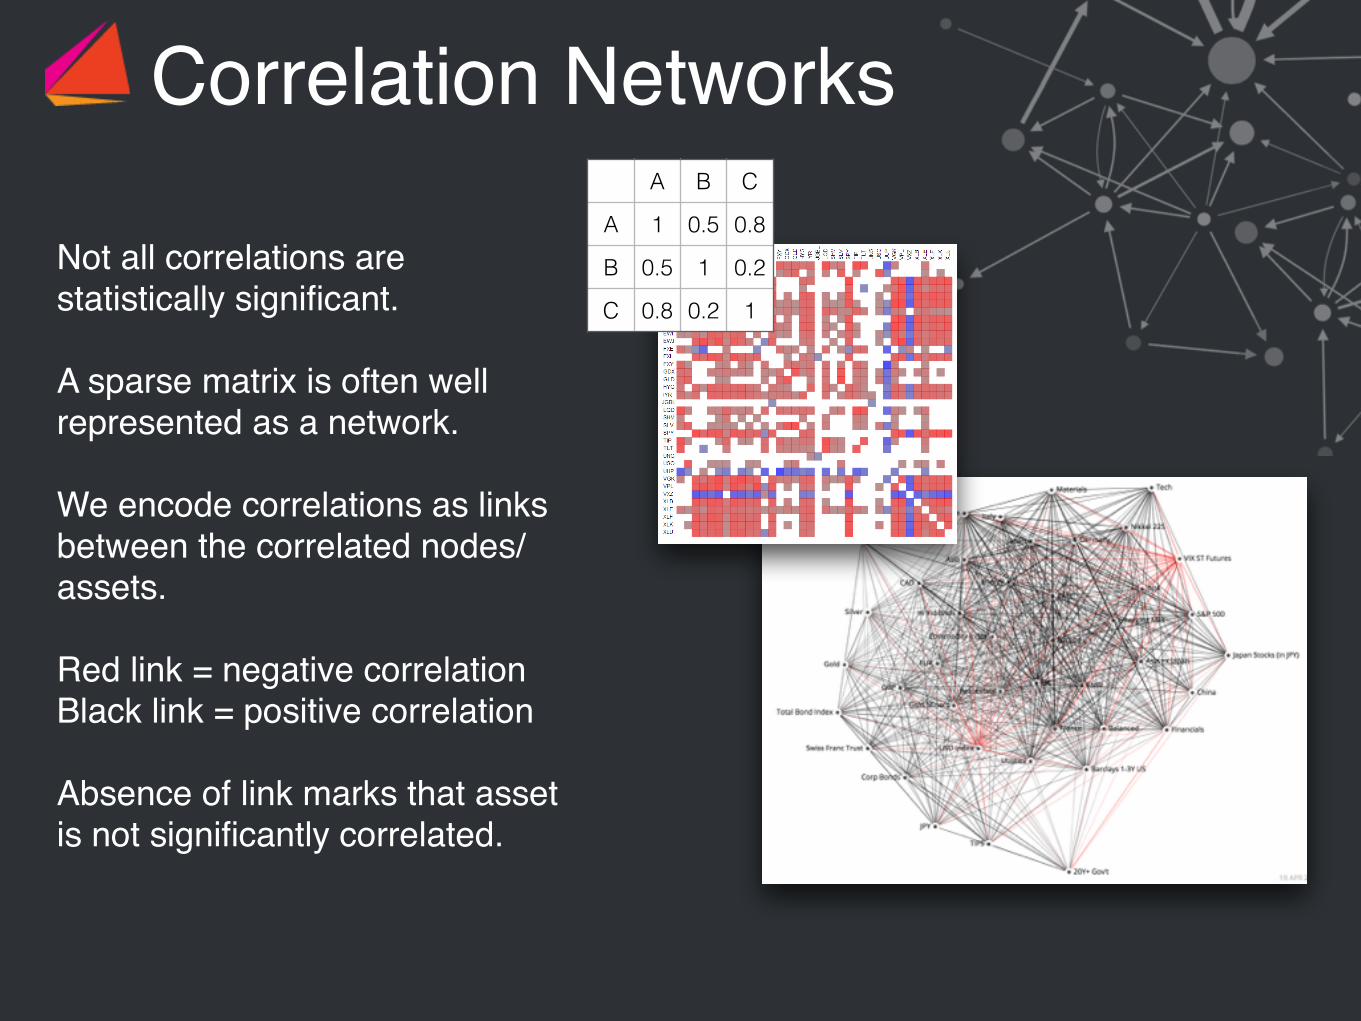
Correlation Networks
Not all correlations are statistically significant.
A sparse matrix is often well represented as a network.
We encode correlations as links between the correlated nodes/assets.
Red link = negative correlation Black link = positive correlation
Absence of link marks that asset is not significantly correlated.
A B C
A 1 0.5 0.8
B 0.5 1 0.2
C 0.8 0.2 1
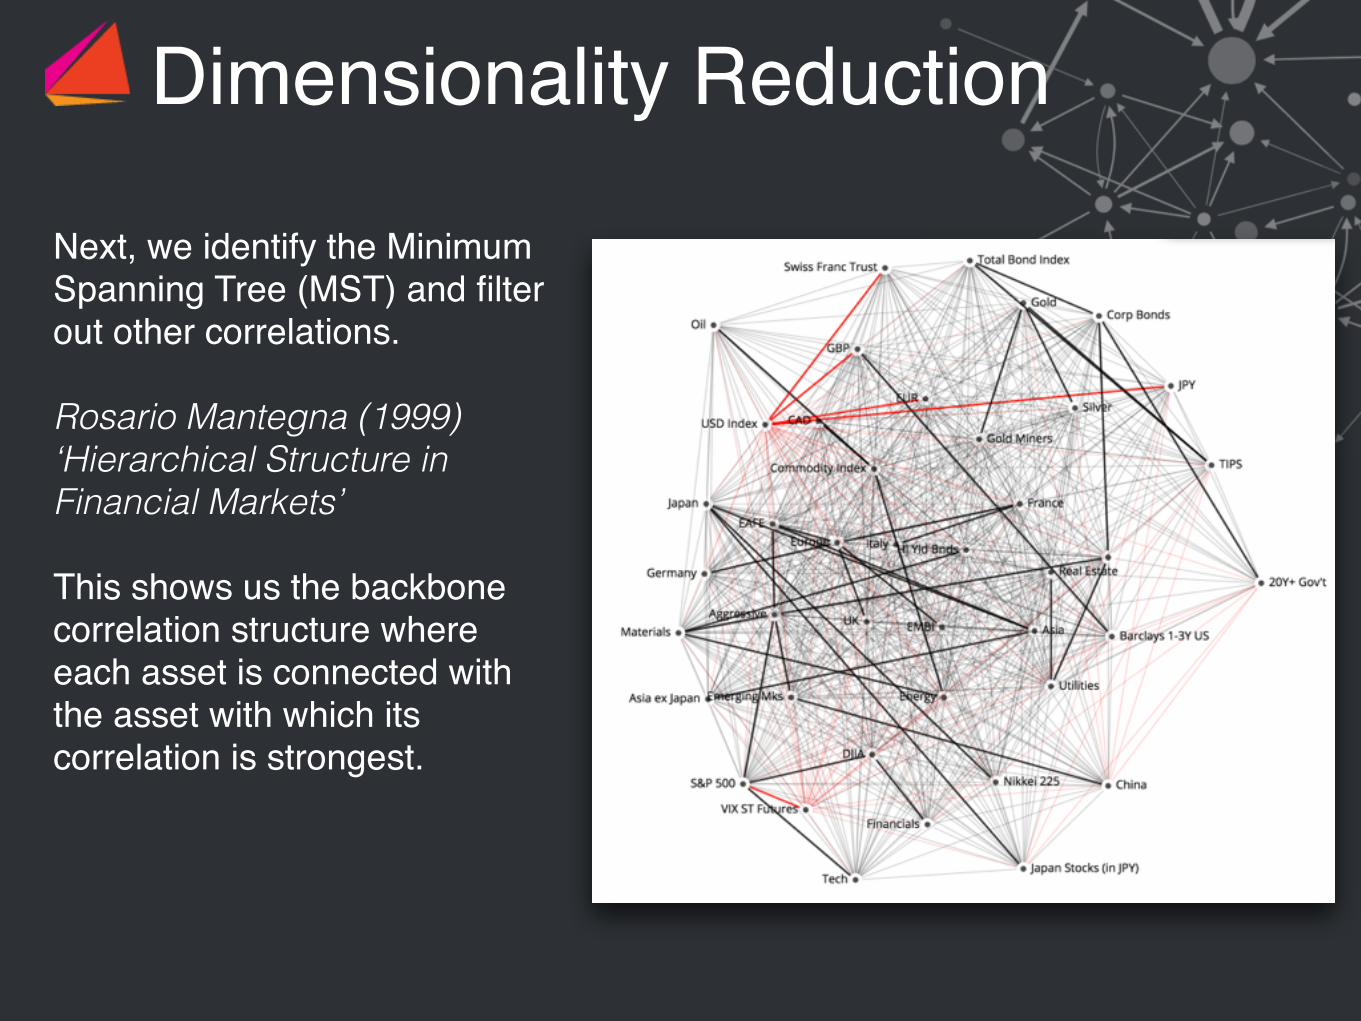
Dimensionality Reduction
Next, we identify the Minimum Spanning Tree (MST) and filter out other correlations.
Rosario Mantegna (1999) ‘Hierarchical Structure in Financial Markets’
This shows us the backbone correlation structure where each asset is connected with the asset with which its correlation is strongest.
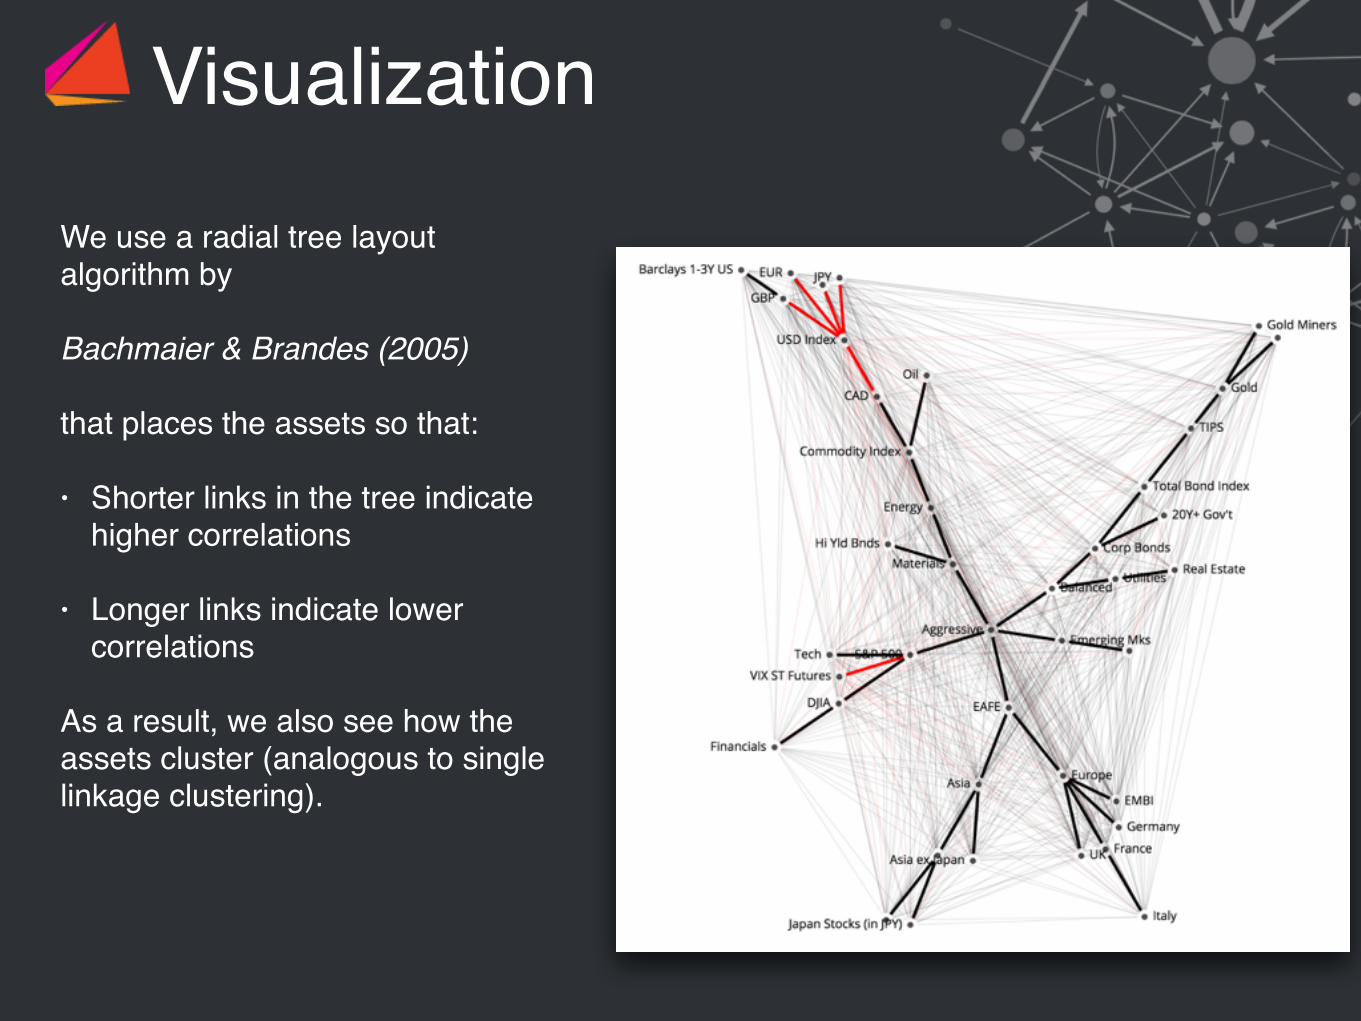
Visualization
We use a radial tree layout algorithm by
Bachmaier & Brandes (2005)
that places the assets so that:
• Shorter links in the tree indicate higher correlations
• Longer links indicate lower correlations
As a result, we also see how the assets cluster (analogous to single linkage clustering).
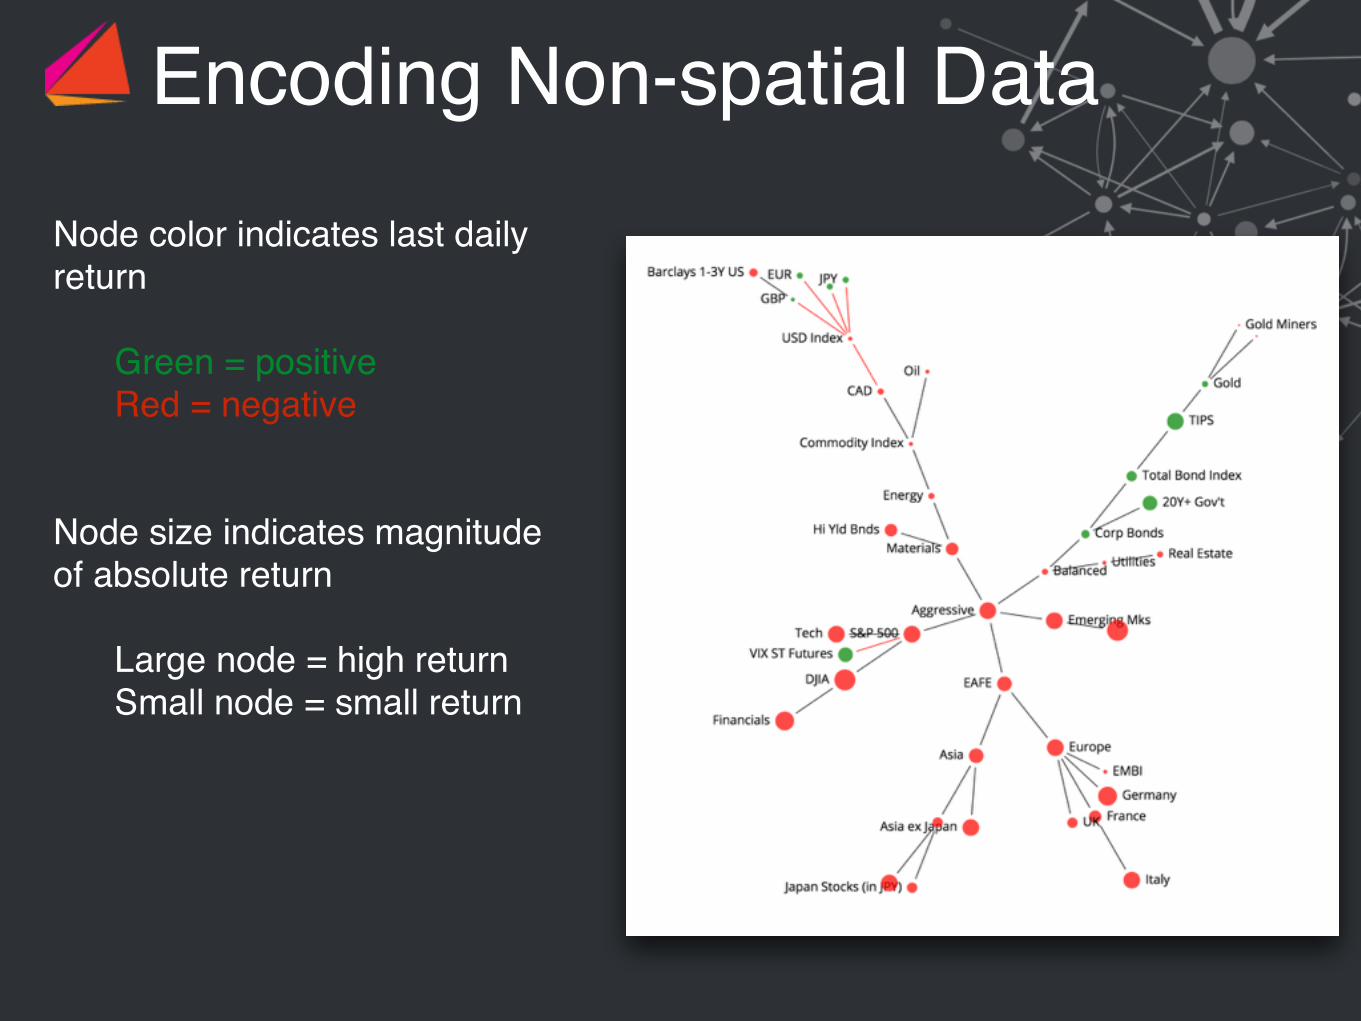
Encoding Non-spatial DataNode color indicates last daily return
Green = positiveRed = negative
Node size indicates magnitude of absolute return
Large node = high returnSmall node = small return
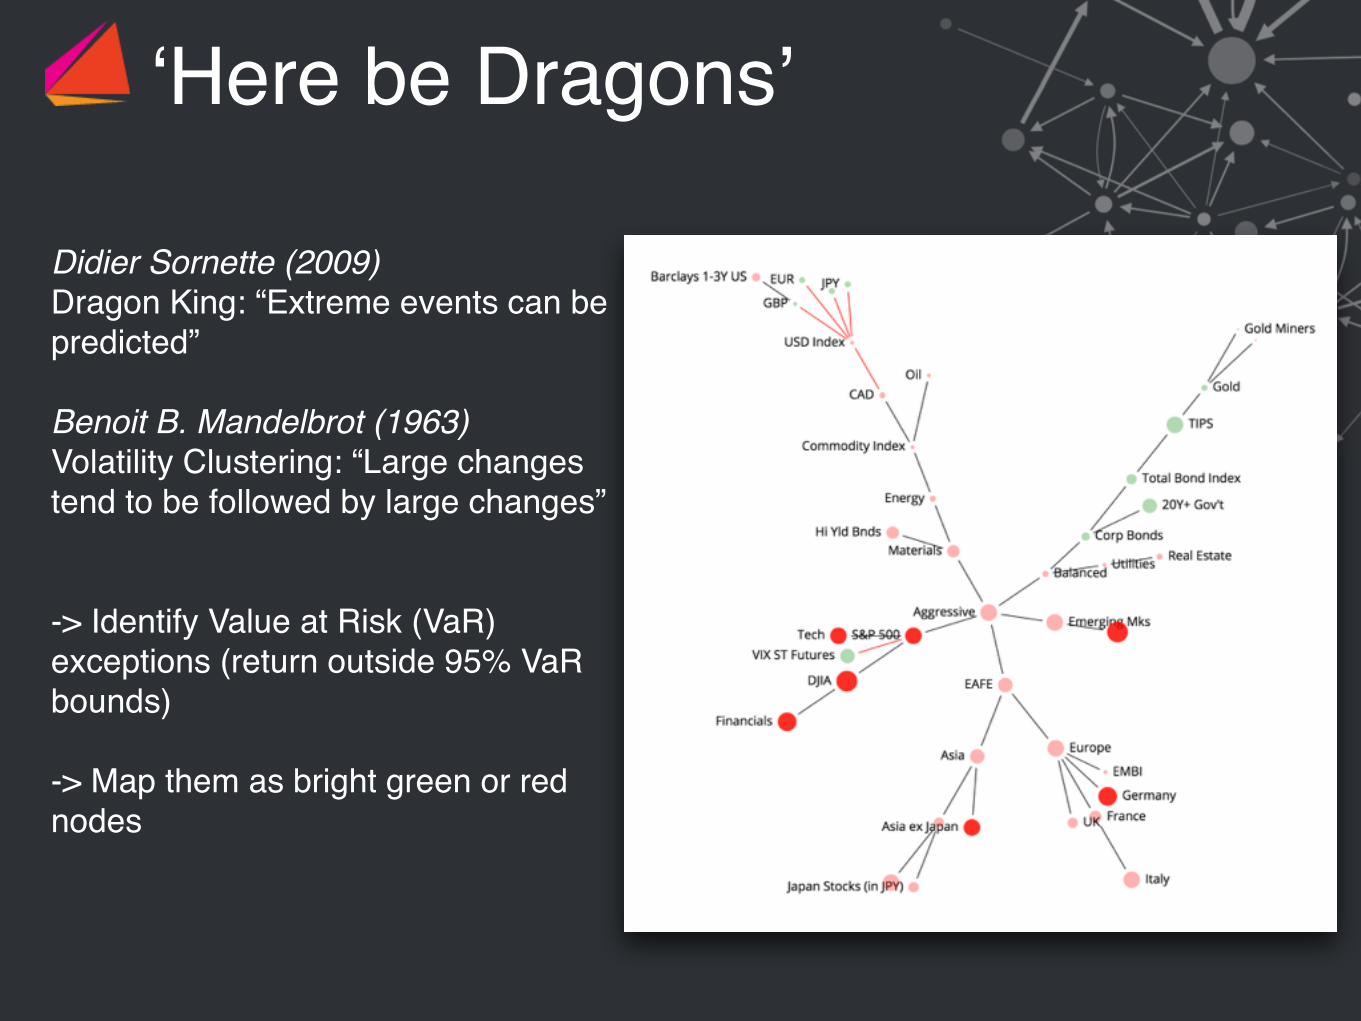
‘Here be Dragons’
Didier Sornette (2009)Dragon King: “Extreme events can be predicted”
Benoit B. Mandelbrot (1963)Volatility Clustering: “Large changes tend to be followed by large changes”
-> Identify Value at Risk (VaR) exceptions (return outside 95% VaR bounds)
-> Map them as bright green or red nodes
Summing up
Linkages are critical: interconnections, covariances, dependencies, flows, exposures, co-occurances, etc …
Challenge: Filter signal from noise, present efficiently
In Summary
Creating a Map - Placing you on Map - Providing Directions

14
Agenda
1. Managing Emerging Risk
2. Visualizing Correlations with FNA HeavyTails
3. Eurozone Case Study

15
Bond Tremors in June 2007
16
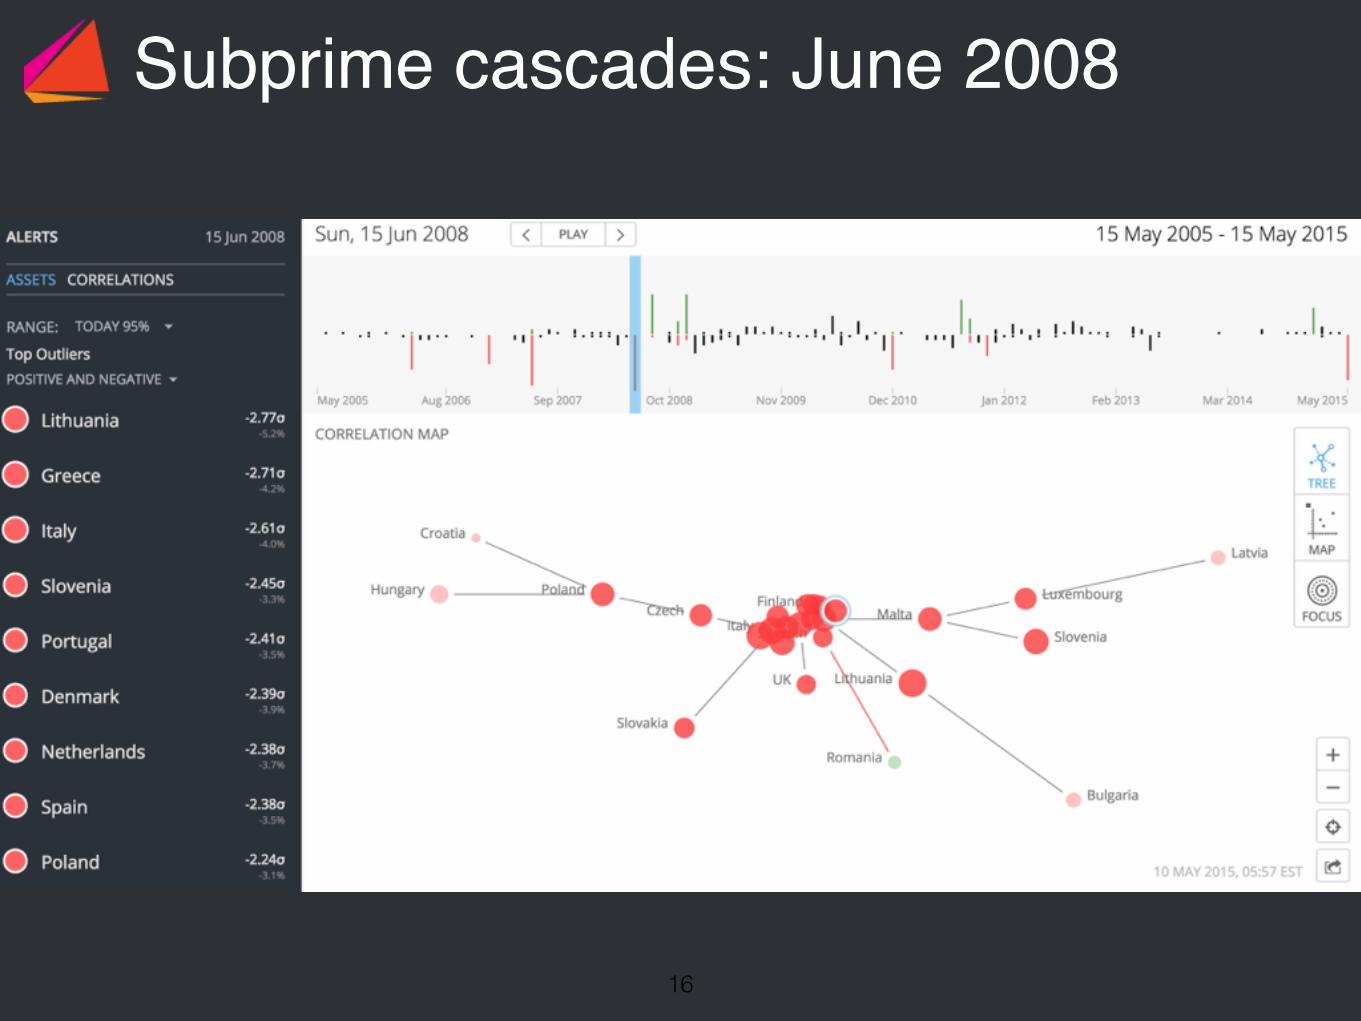
Subprime cascades: June 2008
17
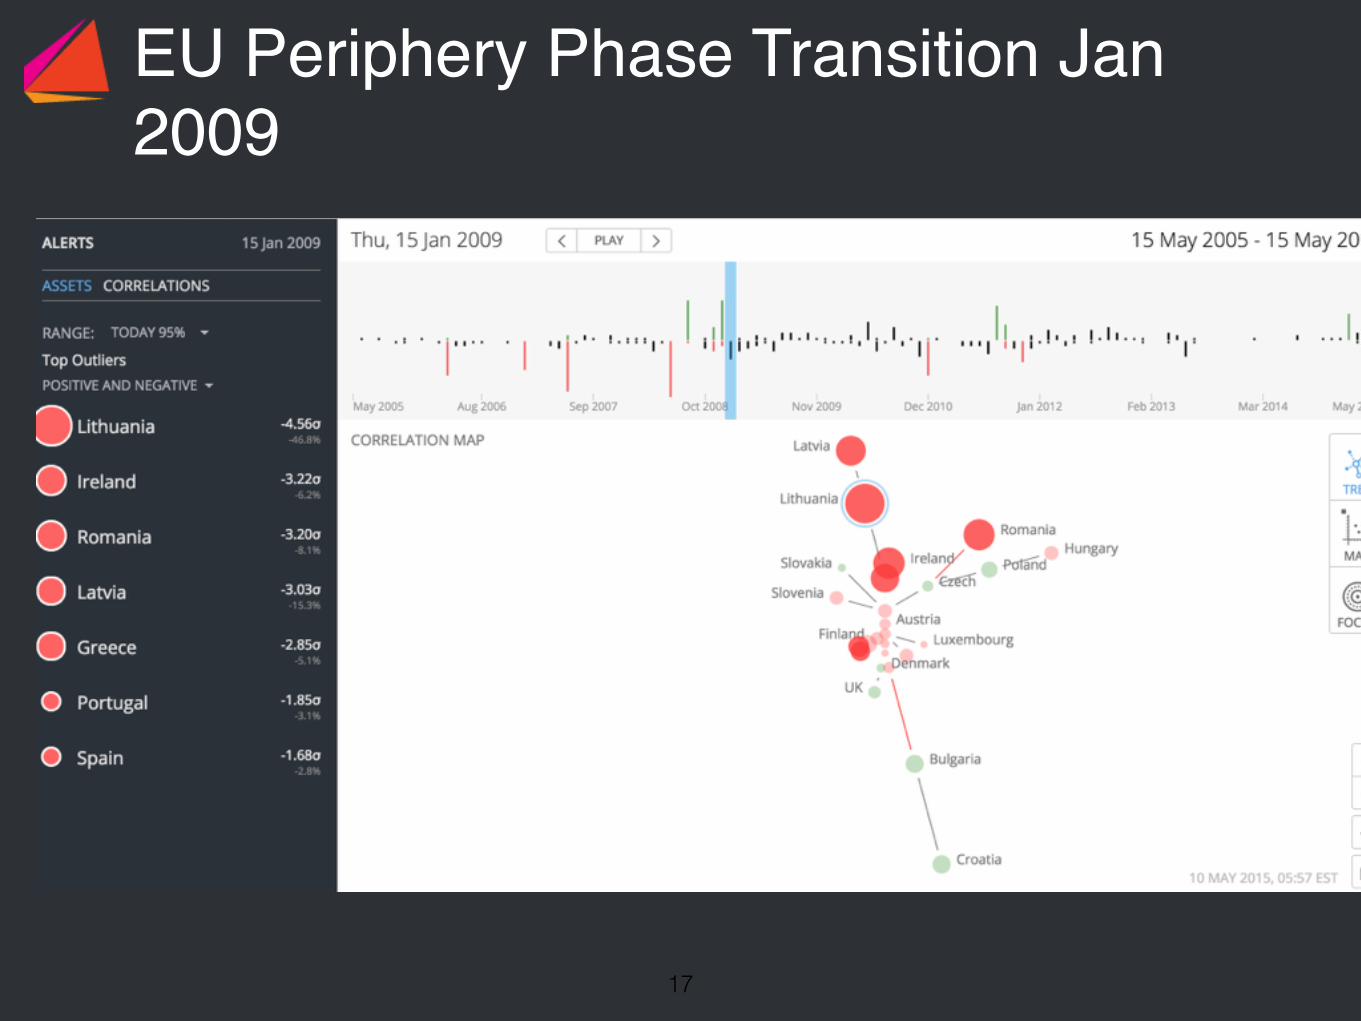
EU Periphery Phase Transition Jan 2009

18
Austerity & Baltic Riots
19
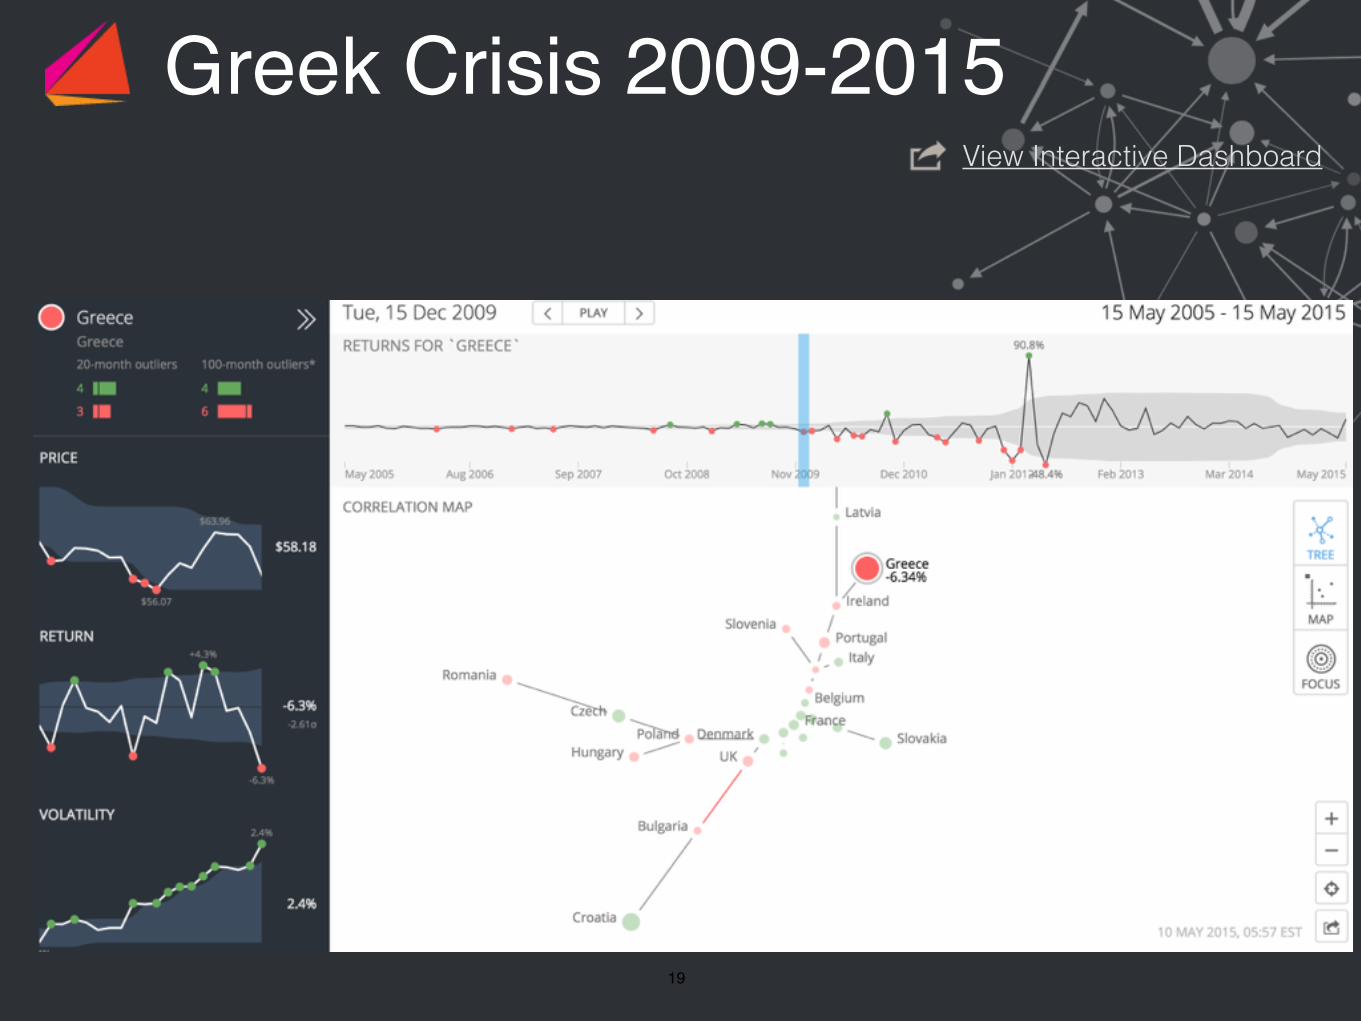
Greek Crisis 2009-2015View Interactive Dashboard
20
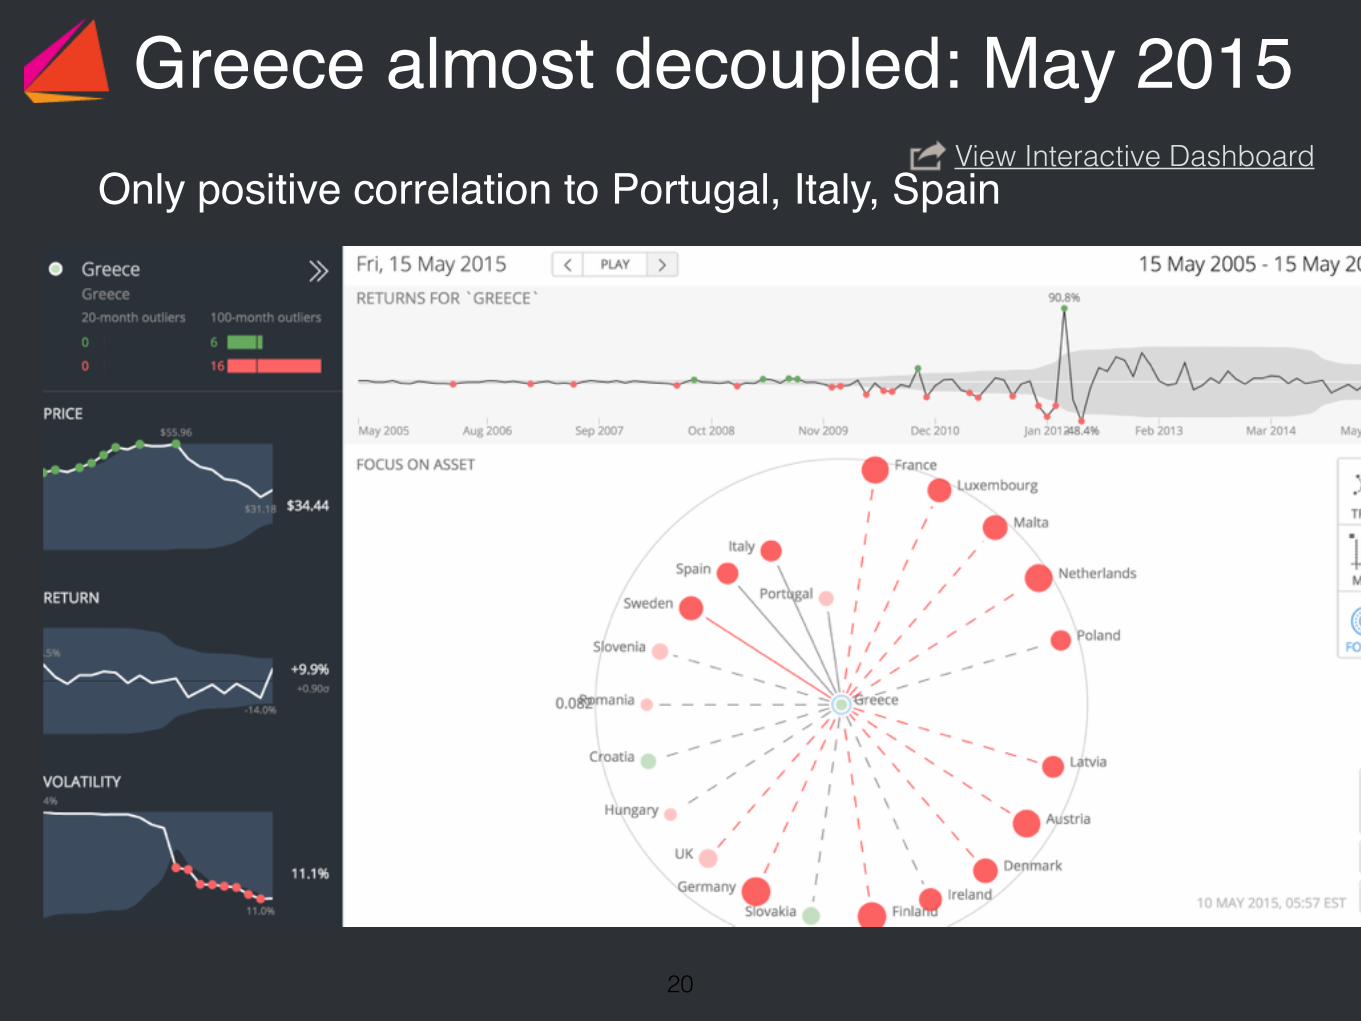
Greece almost decoupled: May 2015View Interactive Dashboard
Only positive correlation to Portugal, Italy, Spain
21
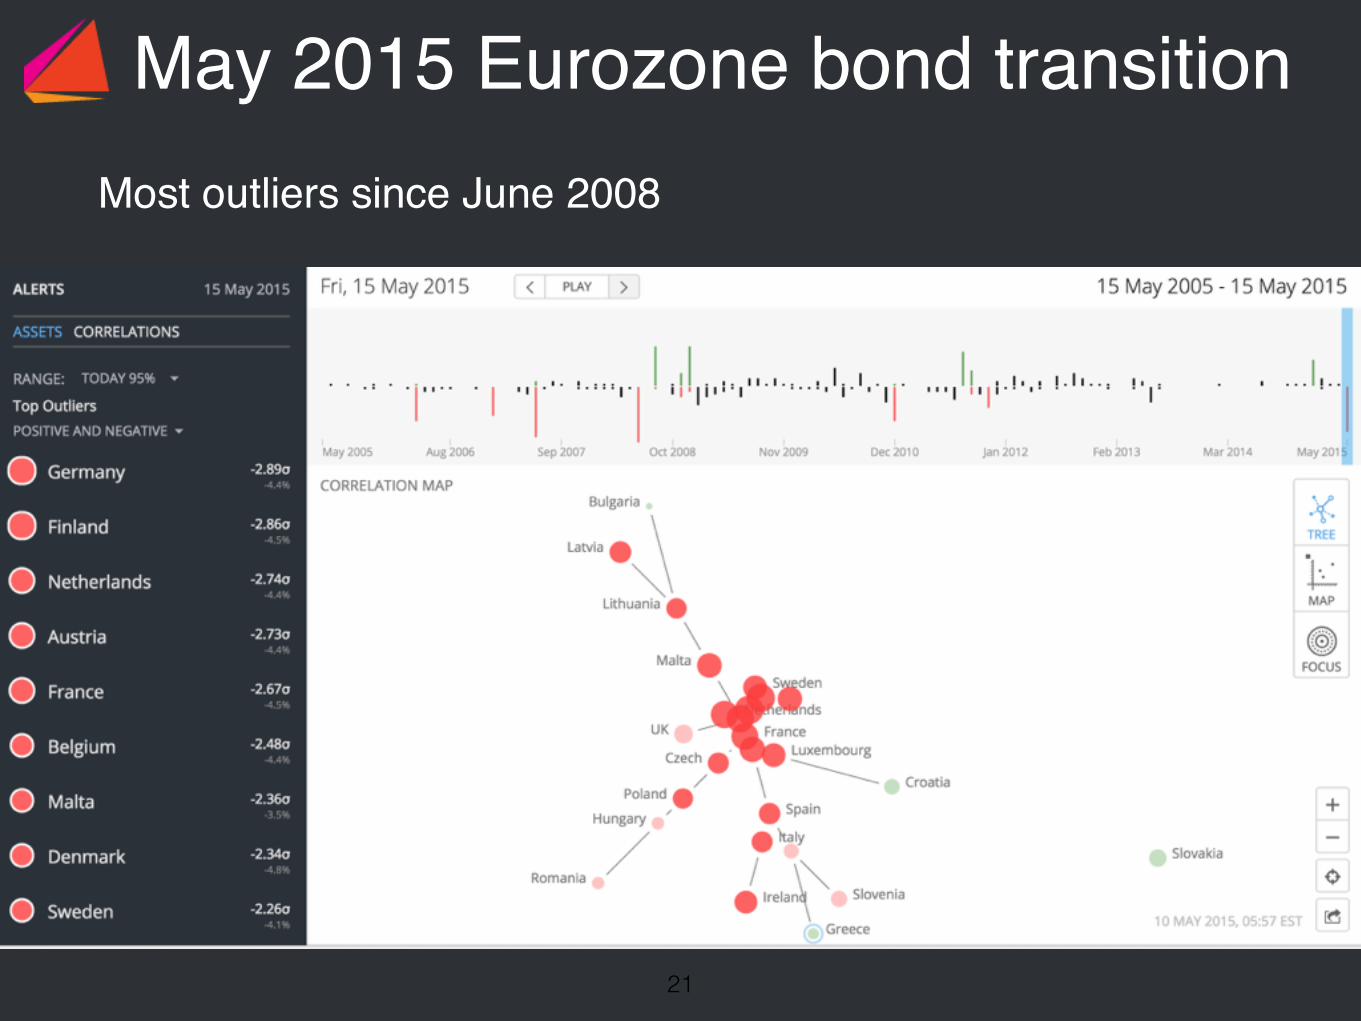
May 2015 Eurozone bond transitionMost outliers since June 2008

22
DAX cascade 16 & 17 April 2015

23
Classic Bund Cascade 22 & 28 April 2015
Record prices & low vol followed by escalating outlier cluster

24
SUMMARY & CONCLUSIONS

25
Current Systemic Risk ObservationsEscalating Eurozone bond volatility + coupling
Credit & liquidity risk amplify systemic fragility
Greece decoupling but connected to Portugal, Italy, Spain
26
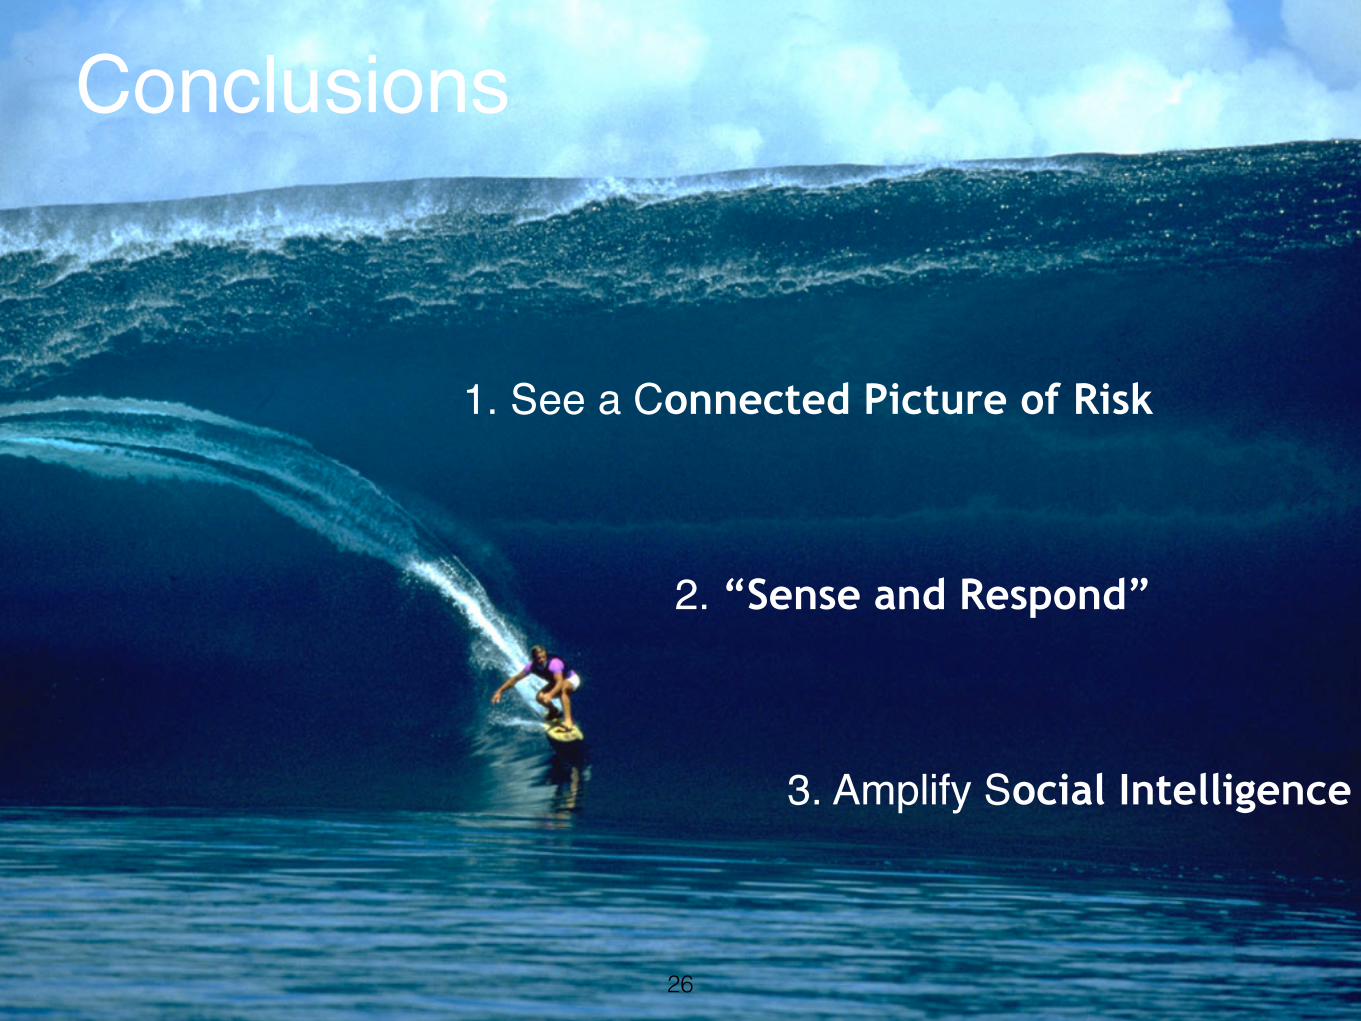
Conclusions
1. See a Connected Picture of Risk
2. “Sense and Respond”
3. Amplify Social Intelligence
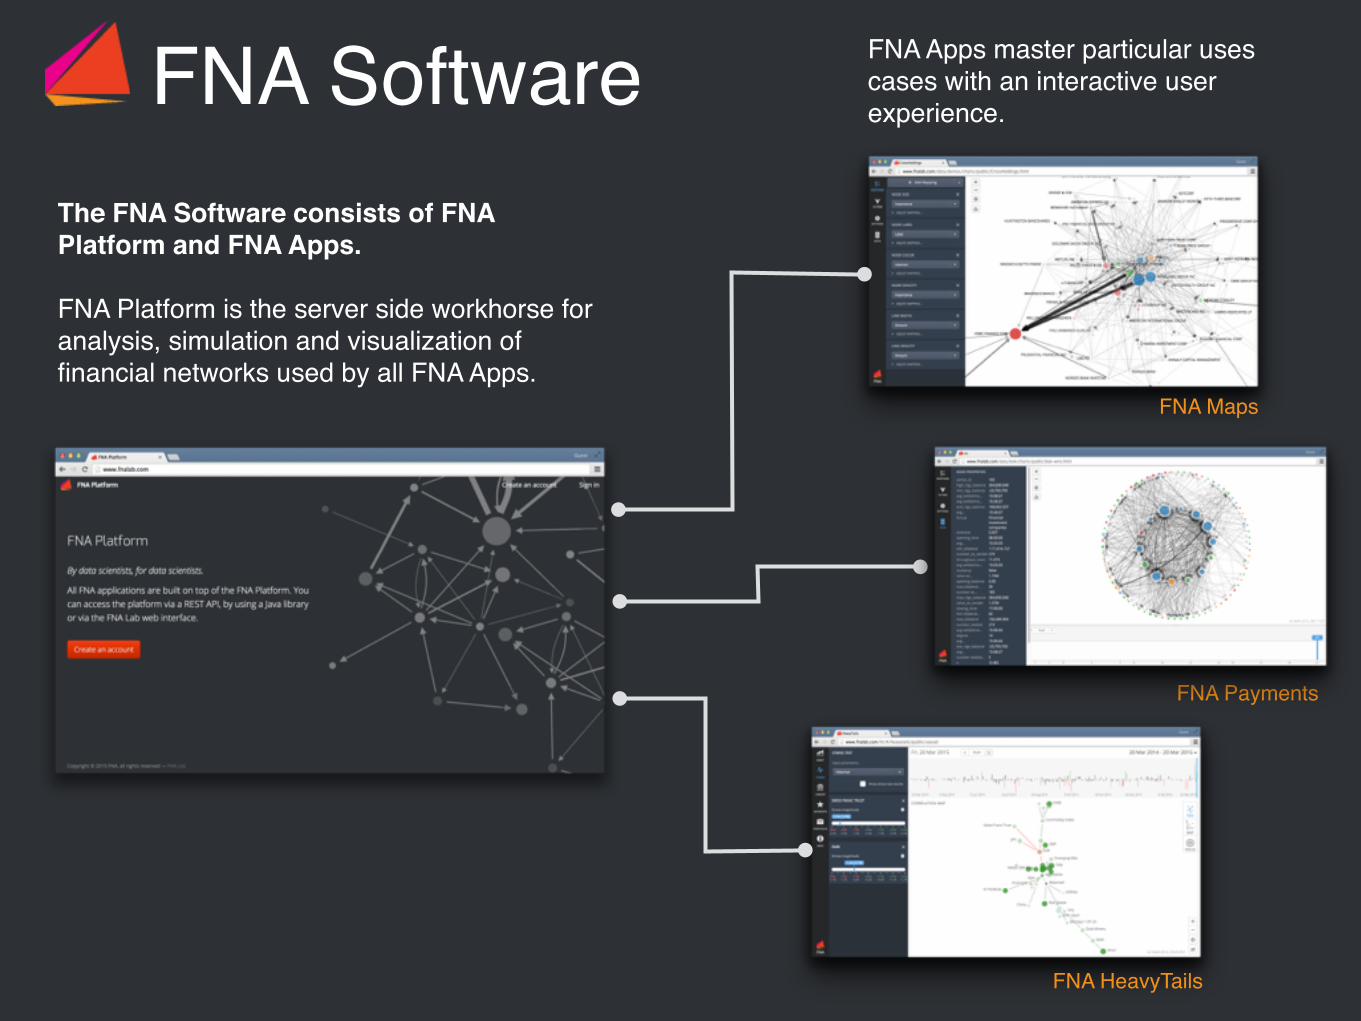
The FNA Software consists of FNA Platform and FNA Apps.
FNA Platform is the server side workhorse for analysis, simulation and visualization of financial networks used by all FNA Apps.
FNA Software FNA Apps master particular uses cases with an interactive user experience.
FNA Maps
FNA Payments
FNA HeavyTails
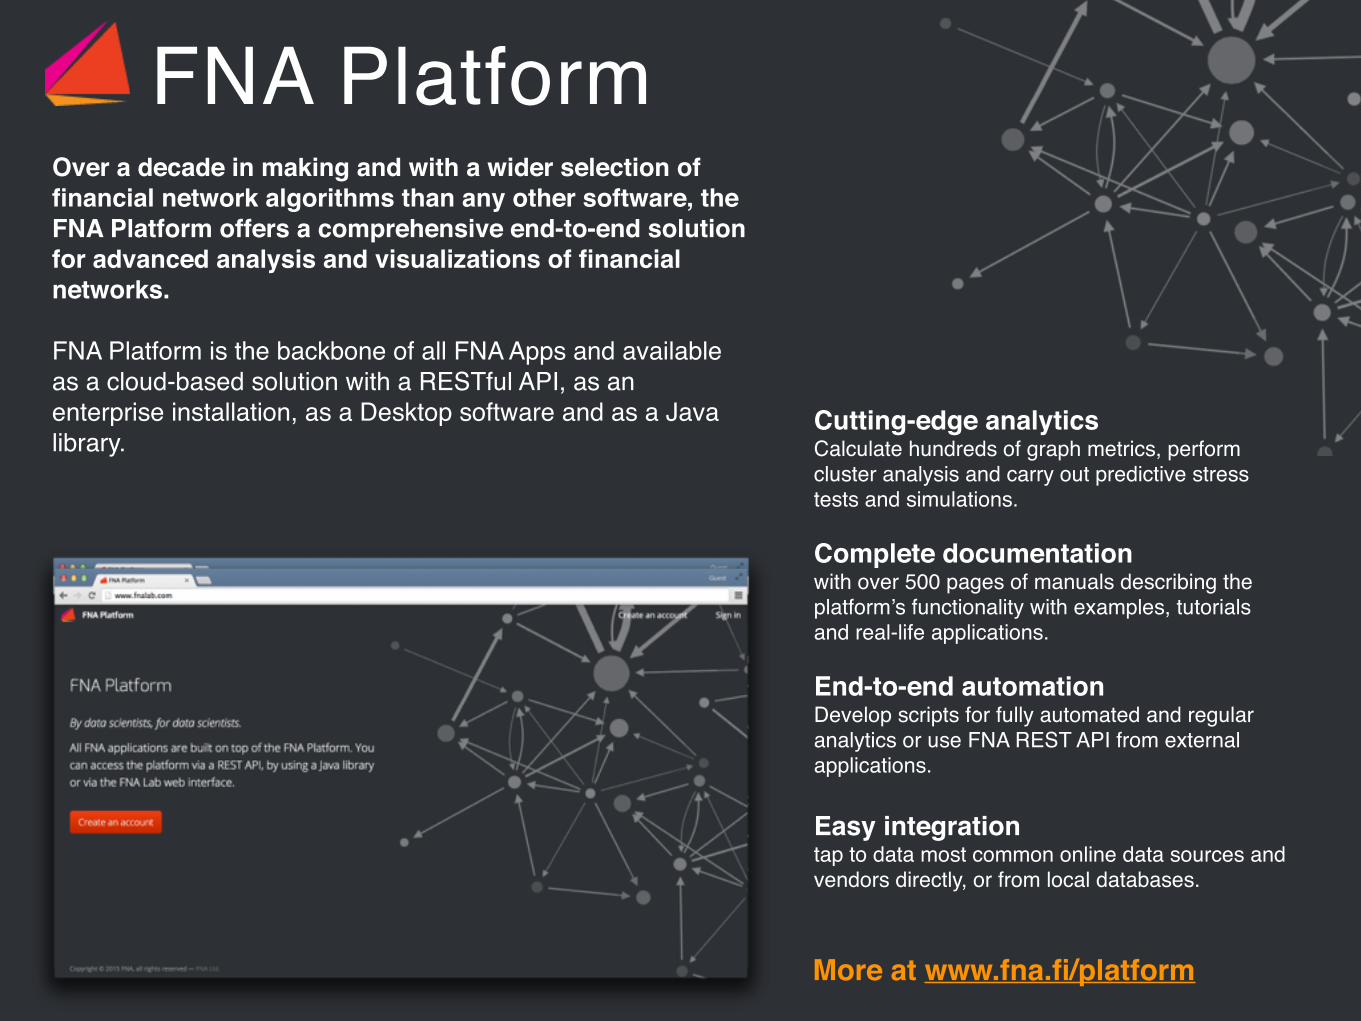
FNA Platform Over a decade in making and with a wider selection of financial network algorithms than any other software, the FNA Platform offers a comprehensive end-to-end solution for advanced analysis and visualizations of financial networks.
FNA Platform is the backbone of all FNA Apps and available as a cloud-based solution with a RESTful API, as an enterprise installation, as a Desktop software and as a Java library.
Cutting-edge analyticsCalculate hundreds of graph metrics, perform cluster analysis and carry out predictive stress tests and simulations.
Complete documentationwith over 500 pages of manuals describing the platform’s functionality with examples, tutorials and real-life applications.
End-to-end automationDevelop scripts for fully automated and regular analytics or use FNA REST API from external applications.
Easy integrationtap to data most common online data sources and vendors directly, or from local databases.
More at www.fna.fi/platform
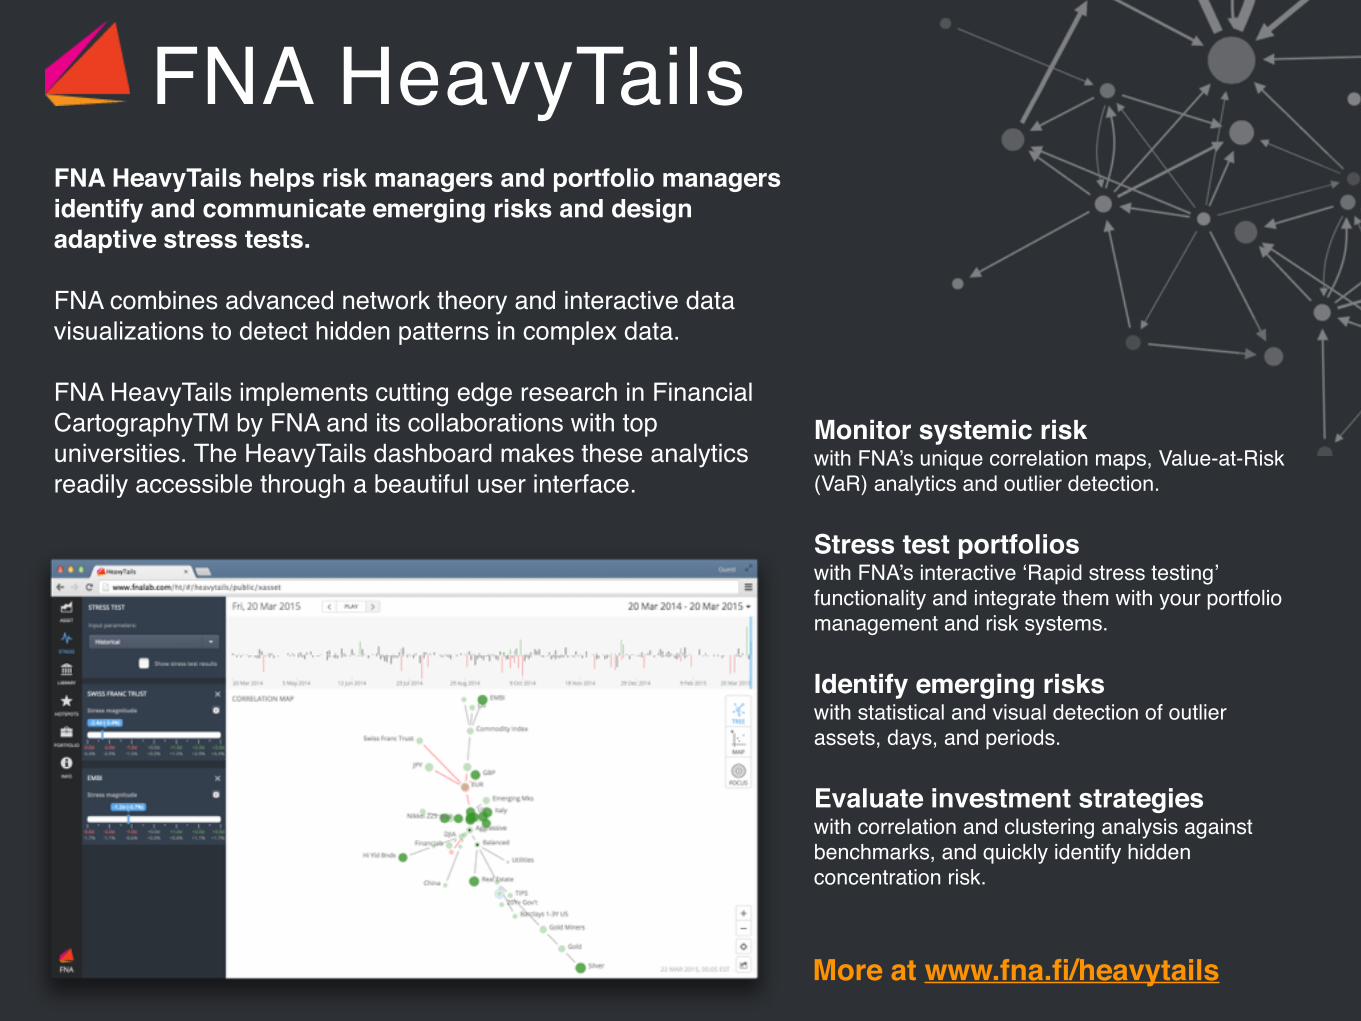
FNA HeavyTails FNA HeavyTails helps risk managers and portfolio managers identify and communicate emerging risks and design adaptive stress tests.
FNA combines advanced network theory and interactive data visualizations to detect hidden patterns in complex data.
FNA HeavyTails implements cutting edge research in Financial CartographyTM by FNA and its collaborations with top universities. The HeavyTails dashboard makes these analytics readily accessible through a beautiful user interface.
Monitor systemic riskwith FNA’s unique correlation maps, Value-at-Risk (VaR) analytics and outlier detection.
Stress test portfolioswith FNA’s interactive ‘Rapid stress testing’ functionality and integrate them with your portfolio management and risk systems.
Identify emerging riskswith statistical and visual detection of outlier assets, days, and periods.
Evaluate investment strategieswith correlation and clustering analysis against benchmarks, and quickly identify hidden concentration risk.
More at www.fna.fi/heavytails
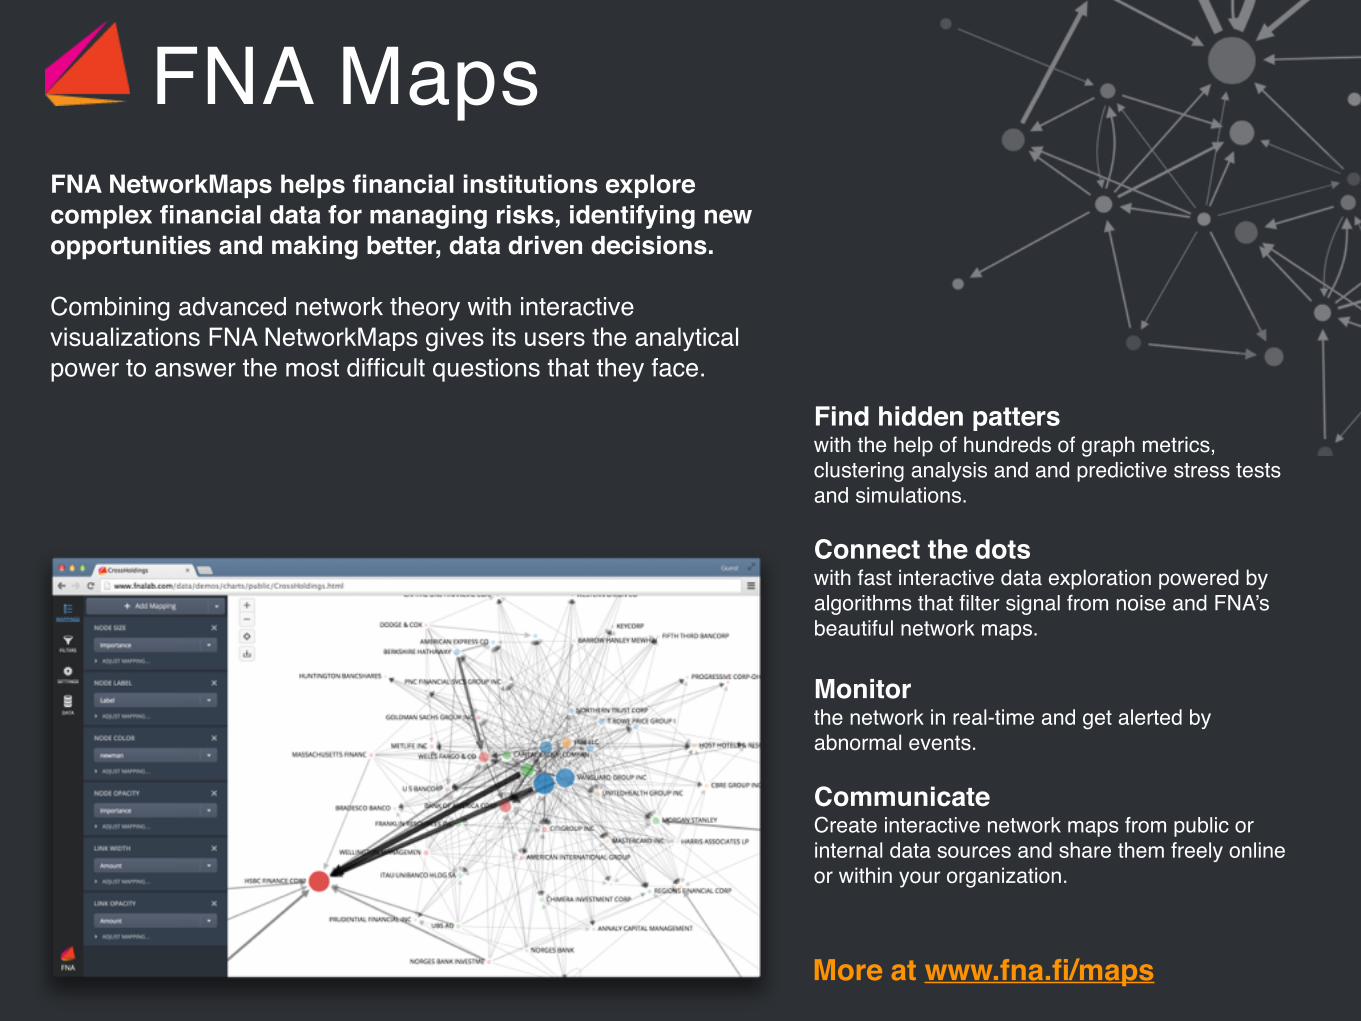
FNA Maps FNA NetworkMaps helps financial institutions explore complex financial data for managing risks, identifying new opportunities and making better, data driven decisions.
Combining advanced network theory with interactive visualizations FNA NetworkMaps gives its users the analytical power to answer the most difficult questions that they face.
Find hidden patterswith the help of hundreds of graph metrics, clustering analysis and and predictive stress tests and simulations.
Connect the dots with fast interactive data exploration powered by algorithms that filter signal from noise and FNA’s beautiful network maps.
Monitorthe network in real-time and get alerted by abnormal events.
CommunicateCreate interactive network maps from public or internal data sources and share them freely online or within your organization.
More at www.fna.fi/maps