Embed Size (px)
Citation preview
Imperial Business in the City
The Long Term Underperformance of
the Chinese Stock Market, the
implications for UK investors
Prof. Franklin Allen
Professor Franklin AllenExecutive Director of the Brevan Howard Centre
Franklin Allen is the Executive Director
of the Brevan Howard Centre and
Professor of Finance and Economics at
Imperial College London. He received
his doctorate from Oxford University.
Dr. Allen's main areas of interest are
corporate finance, asset pricing, financial
innovation, comparative financial
systems, and financial crises.
The Long Term Underperformance of the
Chinese Stock Market and the Implications for
UK investors
Franklin Allen
Imperial College London
(Based on joint work with Jun Qian, Chenyu Shan and
Lei Zhu)
Imperial Business in the City
28 September 2016
Imperial means Intelligent BusinessImperial College Business School 4
Motivation
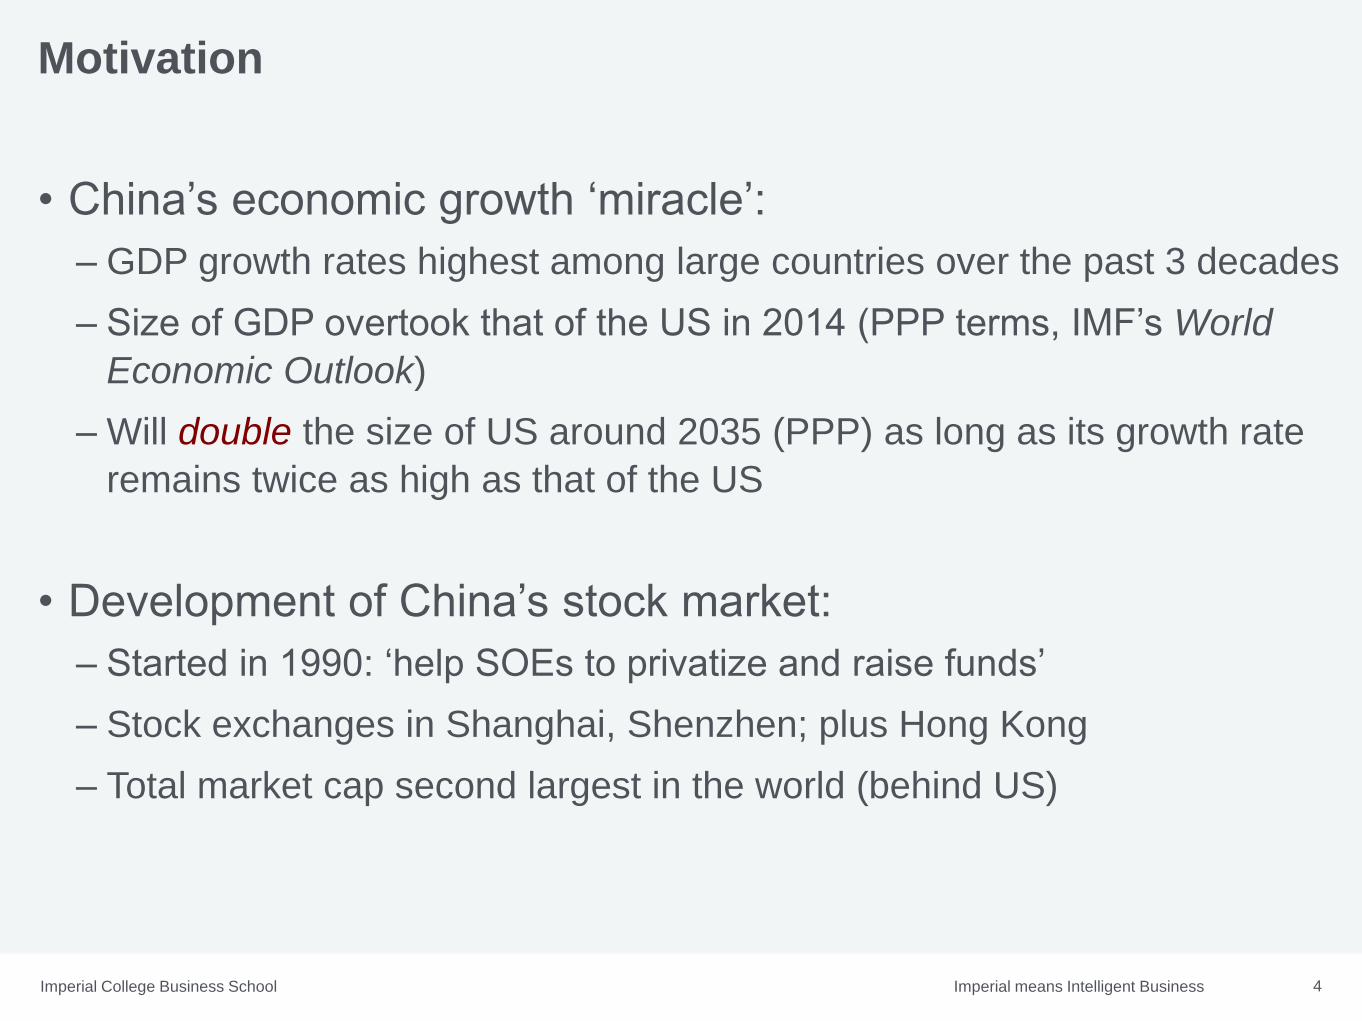
• China’s economic growth ‘miracle’:
– GDP growth rates highest among large countries over the past 3 decades
– Size of GDP overtook that of the US in 2014 (PPP terms, IMF’s World
Economic Outlook)
– Will double the size of US around 2035 (PPP) as long as its growth rate
remains twice as high as that of the US
• Development of China’s stock market:
– Started in 1990: ‘help SOEs to privatize and raise funds’
– Stock exchanges in Shanghai, Shenzhen; plus Hong Kong
– Total market cap second largest in the world (behind US)

Imperial means Intelligent BusinessImperial College Business School 5
Ranking Exchanges (2014) MktCap (US$M) Turnover
1 NYSE 19,351,417.2 82.00%
2 NASDAQ OMX 6,979,172.0 175.34%
3 Japan Exchange Group - Tokyo 4,377,994.4 124.35%
4 Shanghai SE 3,932,527.7 154.74%
5 Euronext 3,319,062.2 58.81%
6 Hong Kong Exchanges 3,233,030.6 47.04%
7 TMX Group 2,093,696.8 67.26%
8 Shenzhen SE 2,072,420.0 286.67%
9 Deutsche Börse 1,738,539.1 84.54%
10 BSE India 1,558,299.7 7.91%
11 National Stock Exchange India 1,520,925.1 41.62%
12 SIX Swiss Exchange 1,495,314.2 53.27%
China’s Stock Market

Imperial means Intelligent BusinessImperial College Business School 6
Buy-and-hold Returns of Major Stock Indices (1992-2014; inflation adjusted; cash dividends included)
0.0
1.0
2.0
3.0
4.0
5.0
6.0
19
92
19
93
19
94
19
95
19
96
19
97
19
98
19
99
20
00
20
01
20
02
20
03
20
04
20
05
20
06
20
07
20
08
20
09
20
10
20
11
20
12
20
13
20
14
SSE China S&P500 US BSE SENSEX Inida
IBOV Brazil Nikkei Japan
Imperial means Intelligent BusinessImperial College Business School 7
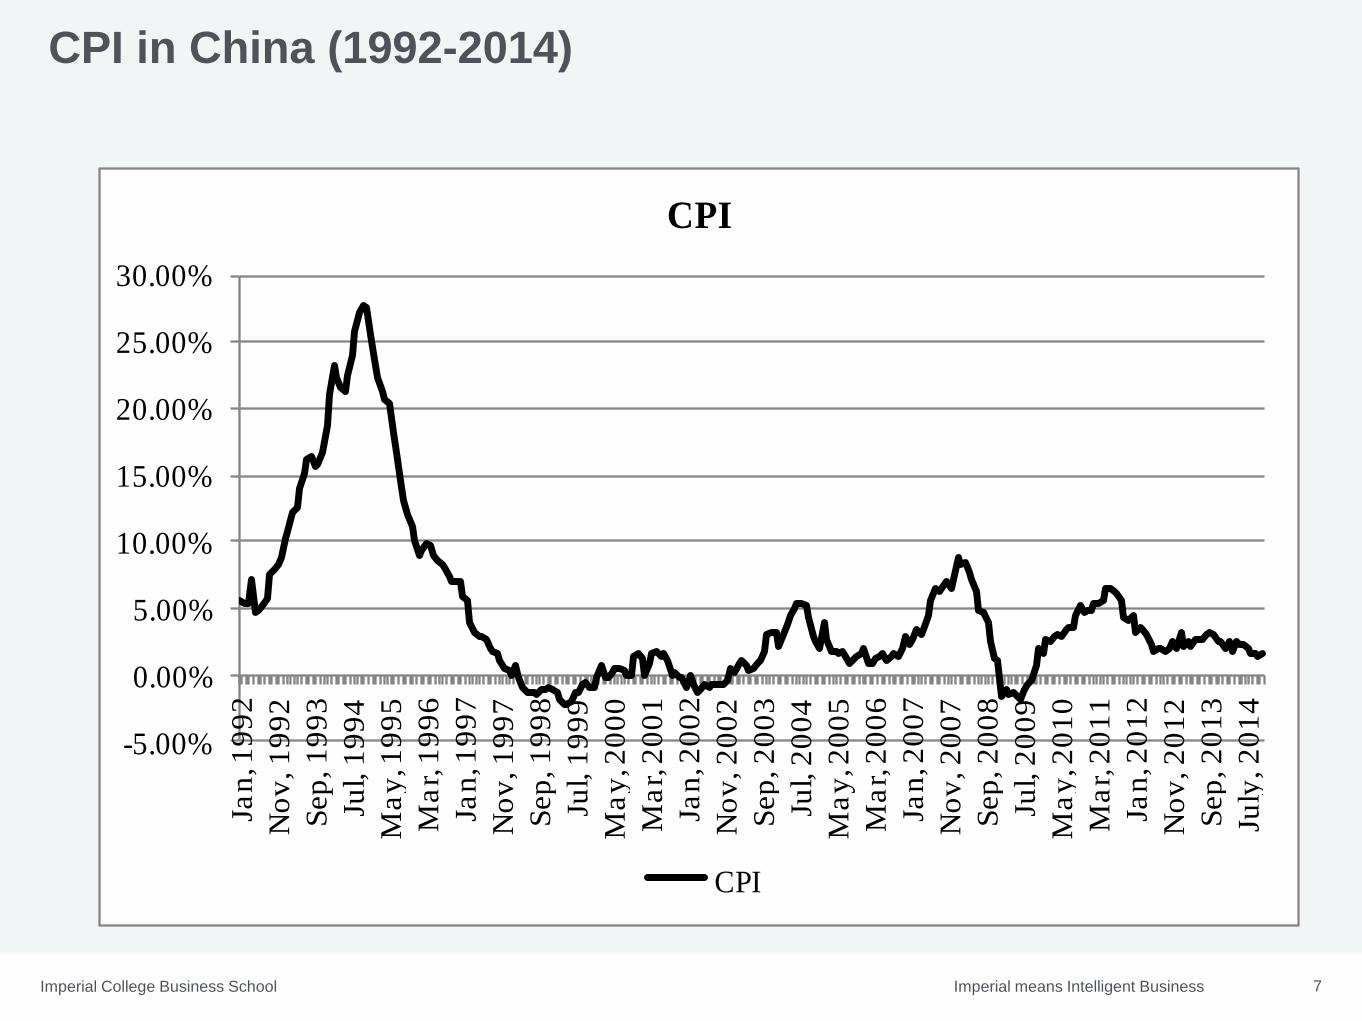
CPI in China (1992-2014)
-5.00%
0.00%
5.00%
10.00%
15.00%
20.00%
25.00%
30.00%Ja
n, 1
99
2
No
v, 1
99
2
Sep
, 1
99
3
Jul, 1
99
4
Ma
y, 1
99
5
Ma
r, 1
99
6
Jan
, 19
97
No
v, 1
99
7
Sep
, 1
99
8
Jul, 1
99
9
Ma
y, 2
00
0
Ma
r, 2
00
1
Jan
, 20
02
No
v, 2
00
2
Sep
, 2
00
3
Jul, 2
00
4
Ma
y, 2
00
5
Ma
r, 2
00
6
Jan
, 20
07
No
v, 2
00
7
Sep
, 2
00
8
Jul, 2
00
9
Ma
y, 2
01
0
Ma
r, 2
01
1
Jan
, 20
12
No
v, 2
01
2
Sep
, 2
01
3
July
, 2
01
4
CPI
CPI

Imperial means Intelligent BusinessImperial College Business School 8
GDP Growth in Large Countries(2000-2014; inflation adjusted)
0.0
0.5
1.0
1.5
2.0
2.5
3.0
3.5
4.0
2000 2001 2002 2003 2004 2005 2006 2007 2008 2009 2010 2011 2012 2013 2014
Panel B. Real GDP in Large Countries from 2000 to 2014
China United States India Brazil Japan
Imperial means Intelligent BusinessImperial College Business School 9
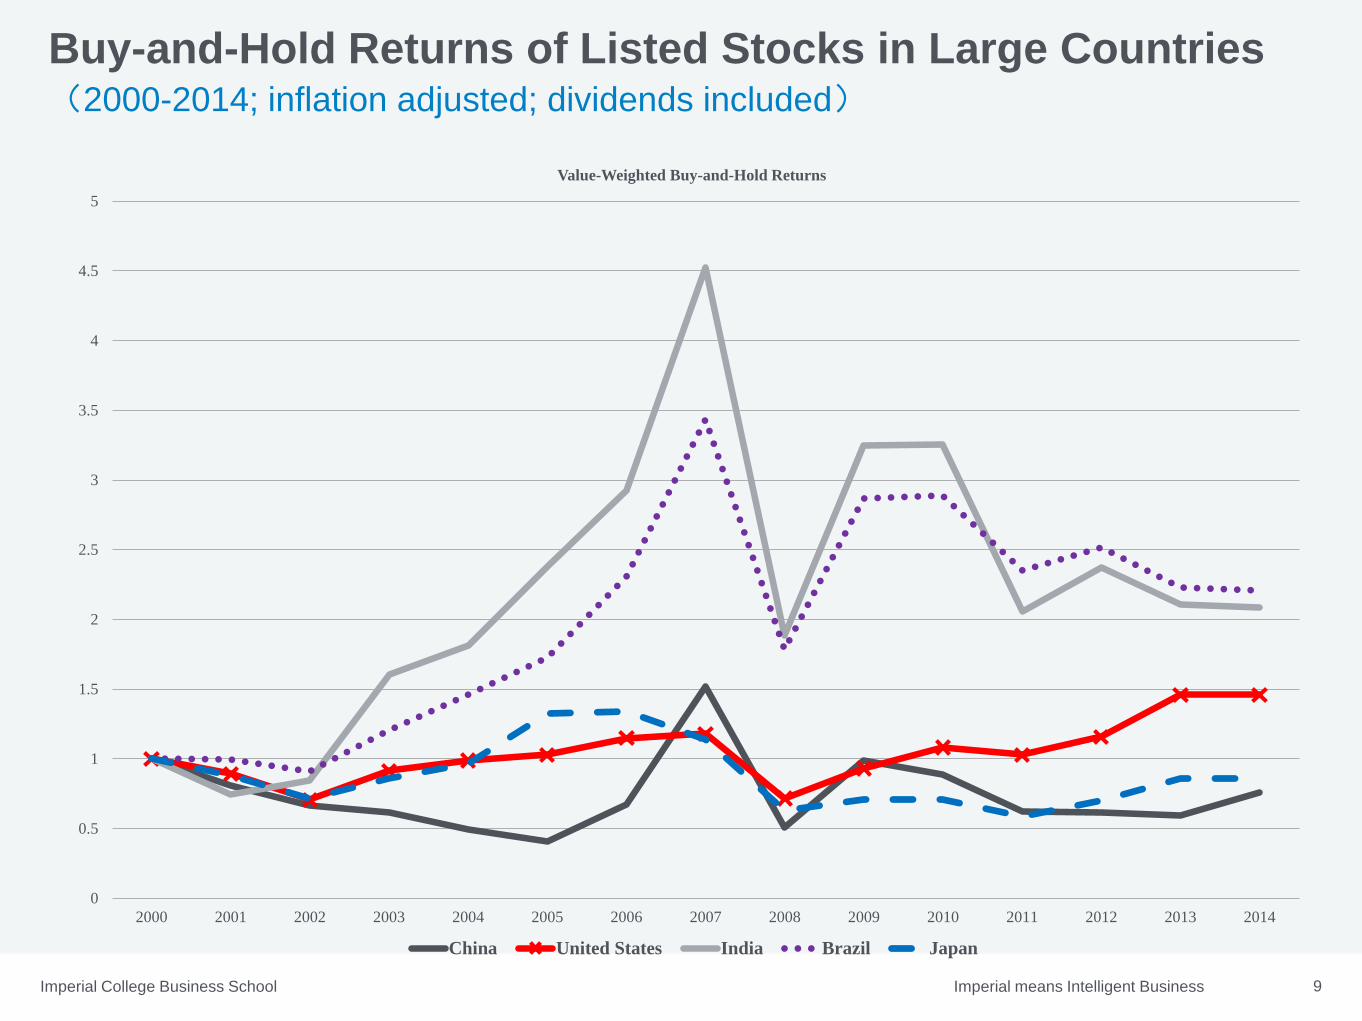
Buy-and-Hold Returns of Listed Stocks in Large Countries (2000-2014; inflation adjusted; dividends included)
0
0.5
1
1.5
2
2.5
3
3.5
4
4.5
5
2000 2001 2002 2003 2004 2005 2006 2007 2008 2009 2010 2011 2012 2013 2014
Value-Weighted Buy-and-Hold Returns
China United States India Brazil Japan

Imperial means Intelligent BusinessImperial College Business School 10
Buy-and-hold Returns of Stocks vs. Bank Deposits in China(2000-2014;inflation adjusted)
0
0.2
0.4
0.6
0.8
1
1.2
1.4
1.6
2000 2001 2002 2003 2004 2005 2006 2007 2008 2009 2010 2011 2012 2013 2014
Demand Deposit 1-Year Deposit 5-Year Deposit Buy-and-Hold Stock Returns
Imperial means Intelligent BusinessImperial College Business School 11
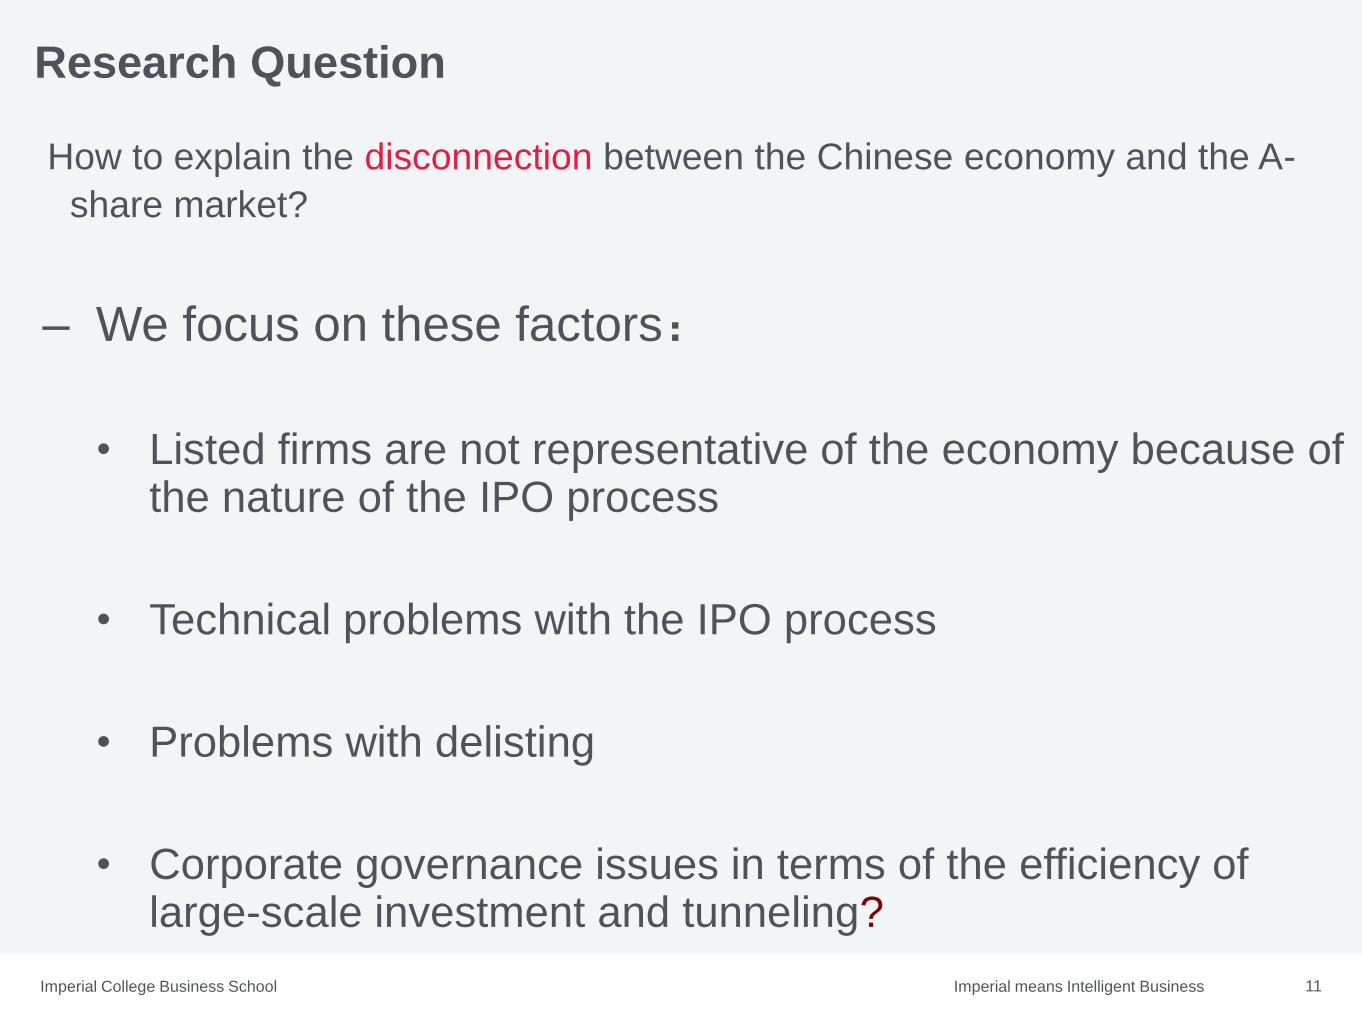
Research Question
How to explain the disconnection between the Chinese economy and the A-
share market?
– We focus on these factors:
• Listed firms are not representative of the economy because of the nature of the IPO process
• Technical problems with the IPO process
• Problems with delisting
• Corporate governance issues in terms of the efficiency of large-scale investment and tunneling?

Imperial means Intelligent BusinessImperial College Business School 12
Correlation between 5-Year Stock Returns and Future Growth
IMF GDP Ranking Country
Individual Stock
or Index Returns Sample Period Correlation p-value
1 United States Stock Return 1991-2014 0.565*** 0.004
2 China Stock Return 1991-2014 0.012 0.958
3 Japan Stock Return 1991-2014 0.418** 0.046
4 Germany Stock Return 1991-2014 0.697*** <0.001
5 United Kingdom Stock Return 1991-2014 0.322 0.133
6 France Stock Return 1991-2014 0.602*** 0.003
7 Brazil Stock Return 1995-2014 0.560** 0.012
8 Italy Stock Return 1991-2014 0.286 0.195
9 India Stock Return 1991-2014 0.573*** 0.006
10 Russian Federation Stock Return 1996-2014 0.547** 0.032
11 Canada Stock Return 1991-2014 0.524** 0.014
12 Australia Stock Return 1991-2014 0.469** 0.023
13 South Korea Index Return 1991-2014 -0.156 0.793
14 Spain Stock Return 1991-2014 0.593*** 0.002
15 Mexico Stock Return 1991-2014 0.322 0.143
16 Indonesia Stock Return 1991-2014 0.349 0.121
17 Netherlands Stock Return 1991-2014 0.735*** <0.001
18 Turkey Stock Return 1991-2014 0.414* 0.054
19 Saudi Arabia Index Return 1995-2014 0.196 0.524
20 Switzerland Stock Return 1991-2014 0.288 0.182
21 South Africa Stock Return 1991-2014 0.619*** 0.002
Difference Group Mean of Correlation China
Difference (Other
p-ValueCountries-China)
Developed 0.568 0.012 0.556*** <0.001
Emerging 0.567 0.012 0.555*** <0.001

Imperial means Intelligent BusinessImperial College Business School 13
Level and Growth of Net Income of Chinese Firms by Sector
Panel A. Net Income Percentage
Year SOE/All Listed/All Listed SOE/Listed All
Unlisted Non-
SOE/Unlisted All
2000 53.74% 35.10% 89.94% 65.84%
2001 49.03% 24.96% 94.50% 66.09%
2002 44.10% 24.23% 90.71% 70.81%
2003 43.66% 25.42% 88.31% 71.55%
2004 41.41% 25.85% 89.85% 75.47%
2005 39.58% 23.72% 92.46% 76.87%
2006 39.92% 22.15% 90.26% 74.40%
2007 36.63% 21.20% 86.68% 76.84%
2008 27.98% 17.45% 85.02% 84.07%
2009 26.02% 15.73% 80.97% 84.24%
2010 27.34% 15.14% 79.88% 82.04%
2011 25.65% 14.42% 77.43% 83.08%
2012 23.48% 13.70% 78.17% 85.20%
2013 21.25% 17.62% 79.20% 91.14%
2014 20.01% 19.32% 75.55% 82.31%

Imperial means Intelligent BusinessImperial College Business School 14
Level and Growth of Net Income of Chinese Firms by
Sector (cont.)
Panel B. Net Income Growth
Year All SOE Non-SOE Listed Unlisted
Listed
SOE
Listed
Non-SOE
Unlisted
Non-SOE
2001 0.060 -0.033 0.168 -0.246 0.225 -0.208 -0.588 0.230
2002 0.217 0.095 0.335 0.182 0.229 0.134 0.998 0.317
2003 0.474 0.459 0.485 0.546 0.451 0.505 0.944 0.466
2004 0.424 0.350 0.480 0.448 0.415 0.473 0.257 0.493
2005 0.243 0.188 0.282 0.141 0.279 0.174 -0.152 0.302
2006 0.336 0.347 0.328 0.247 0.363 0.217 0.611 0.319
2007 0.408 0.292 0.486 0.349 0.426 0.295 0.843 0.472
2008 0.128 -0.138 0.282 -0.071 0.182 -0.089 0.044 0.294
2009 0.145 0.064 0.176 0.031 0.168 -0.018 0.311 0.171
2010 0.552 0.631 0.524 0.494 0.563 0.474 0.579 0.522
2011 0.150 0.078 0.176 0.095 0.159 0.061 0.229 0.174
2012 0.005 -0.080 0.035 -0.045 0.014 -0.036 -0.077 0.040
2013 0.104 0.000 0.137 0.420 0.054 0.439 0.353 0.128
2014 0.019 .-0.115 0.019. 0.038 -0.073 -0.010 0.220 0.034.
Average 0.233 0.152 0.279 0.188 0.247 0.172 0.327 0.283
Correlation 0.687*** 0.554** 0.643** 0.390 0.713*** 0.361 0.411 0.627**
P-Value 0.007 0.049 0.018 0.168 0.004 0.204 0.144 0.022
Imperial means Intelligent BusinessImperial College Business School 15
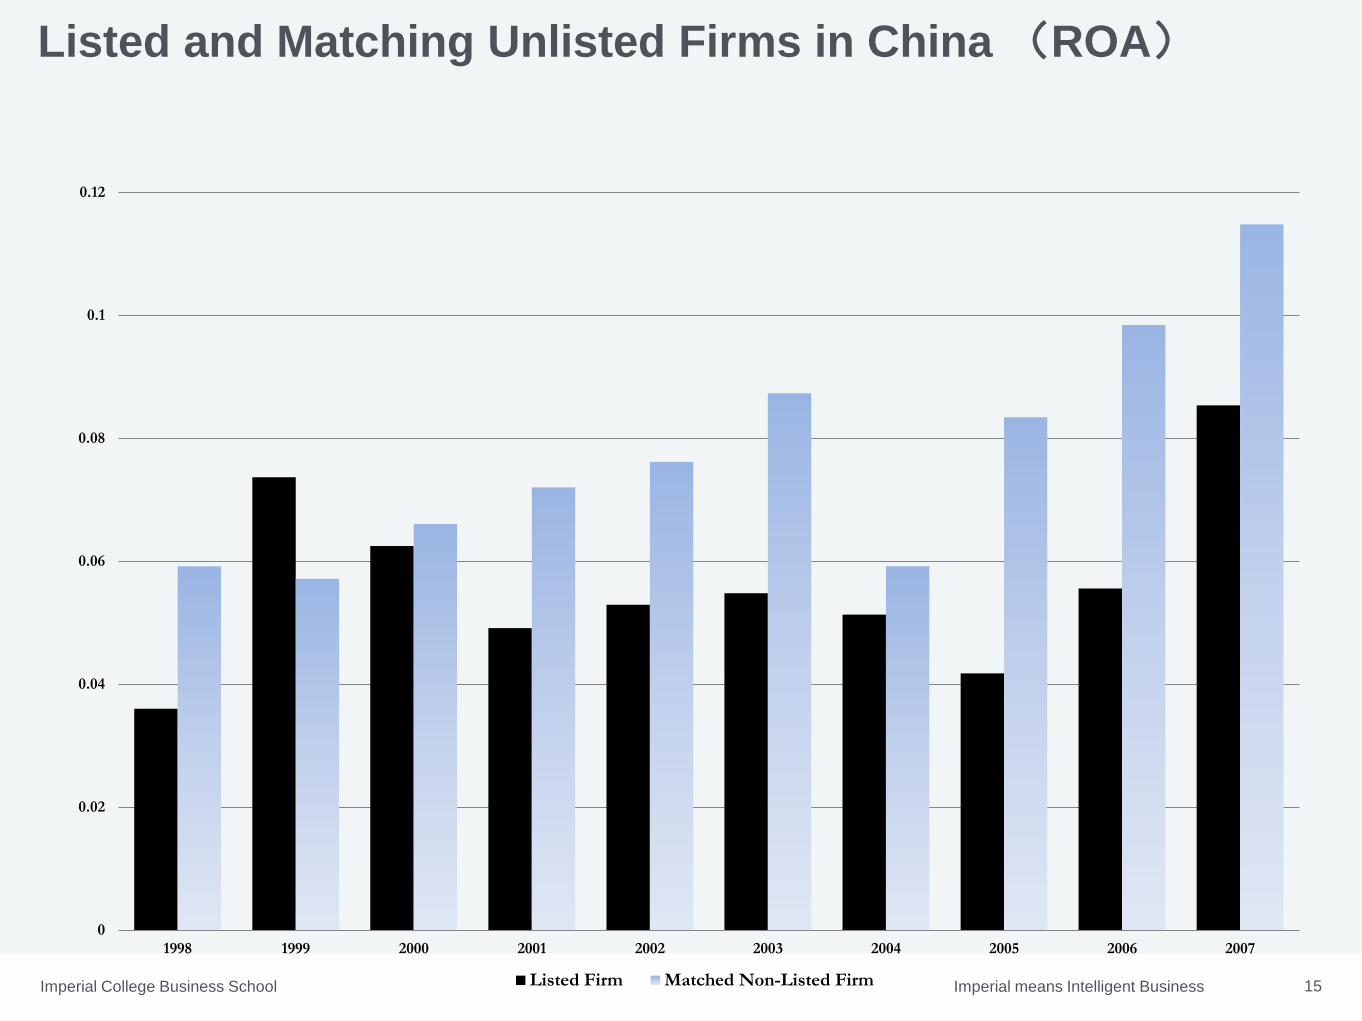
Listed and Matching Unlisted Firms in China (ROA)
0
0.02
0.04
0.06
0.08
0.1
0.12
1998 1999 2000 2001 2002 2003 2004 2005 2006 2007
Listed Firm Matched Non-Listed Firm

Imperial means Intelligent BusinessImperial College Business School 16
• The evidence in the tables above suggest that the firms that are listed are not representative of
the economy as a whole
• The process for listing is different from other countries. Rather than firms with good prospects
being listed, the process has been political in nature:
– Each IPO must be approved by the CSRC
– In earlier years this took on the form of an explicit quota every year allocated to different
regions across the nation
– One of the main original purposes of the stock market was to provide funds for SOEs so firms
from mature industries with good political connections tended to be listed
• There are also technical problems with the conditions that firms must satisfy to be eligible for
an IPO such as positive earnings for three years prior to listing that lead to distorted incentives

Imperial means Intelligent BusinessImperial College Business School 17
ROA around IPO: Listed firms
0.04
0.05
0.06
0.07
0.08
0.09
0.1
0.11
0.12
0.13
-5 -4 -3 -2 -1 0 1 2 3 4 5
China US India Brazil South Africa
Imperial means Intelligent BusinessImperial College Business School 18
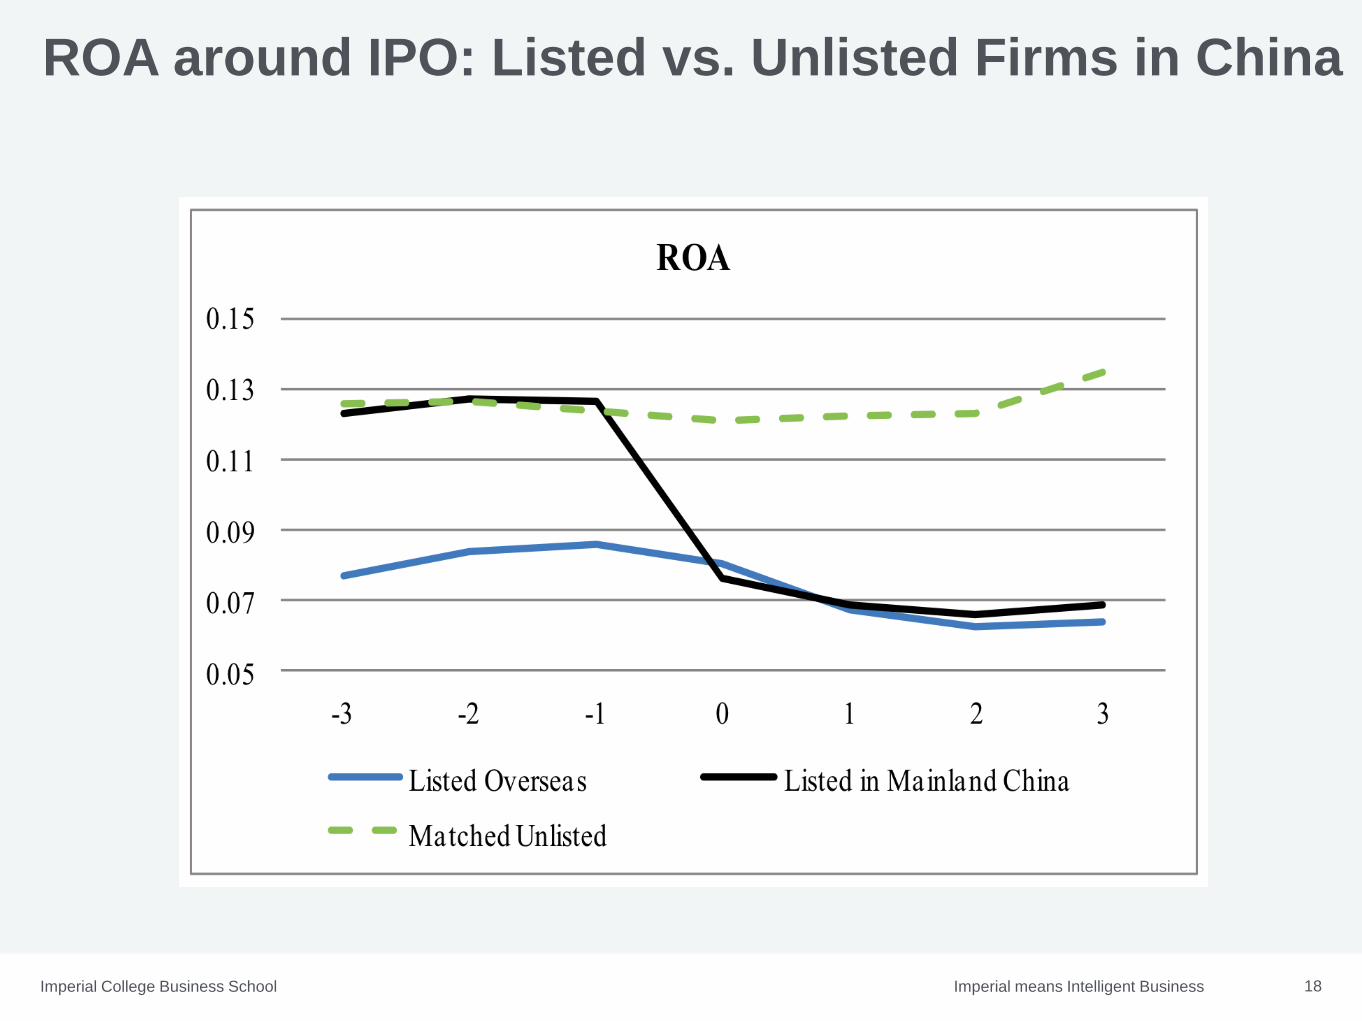
ROA around IPO: Listed vs. Unlisted Firms in China
Imperial means Intelligent BusinessImperial College Business School 19
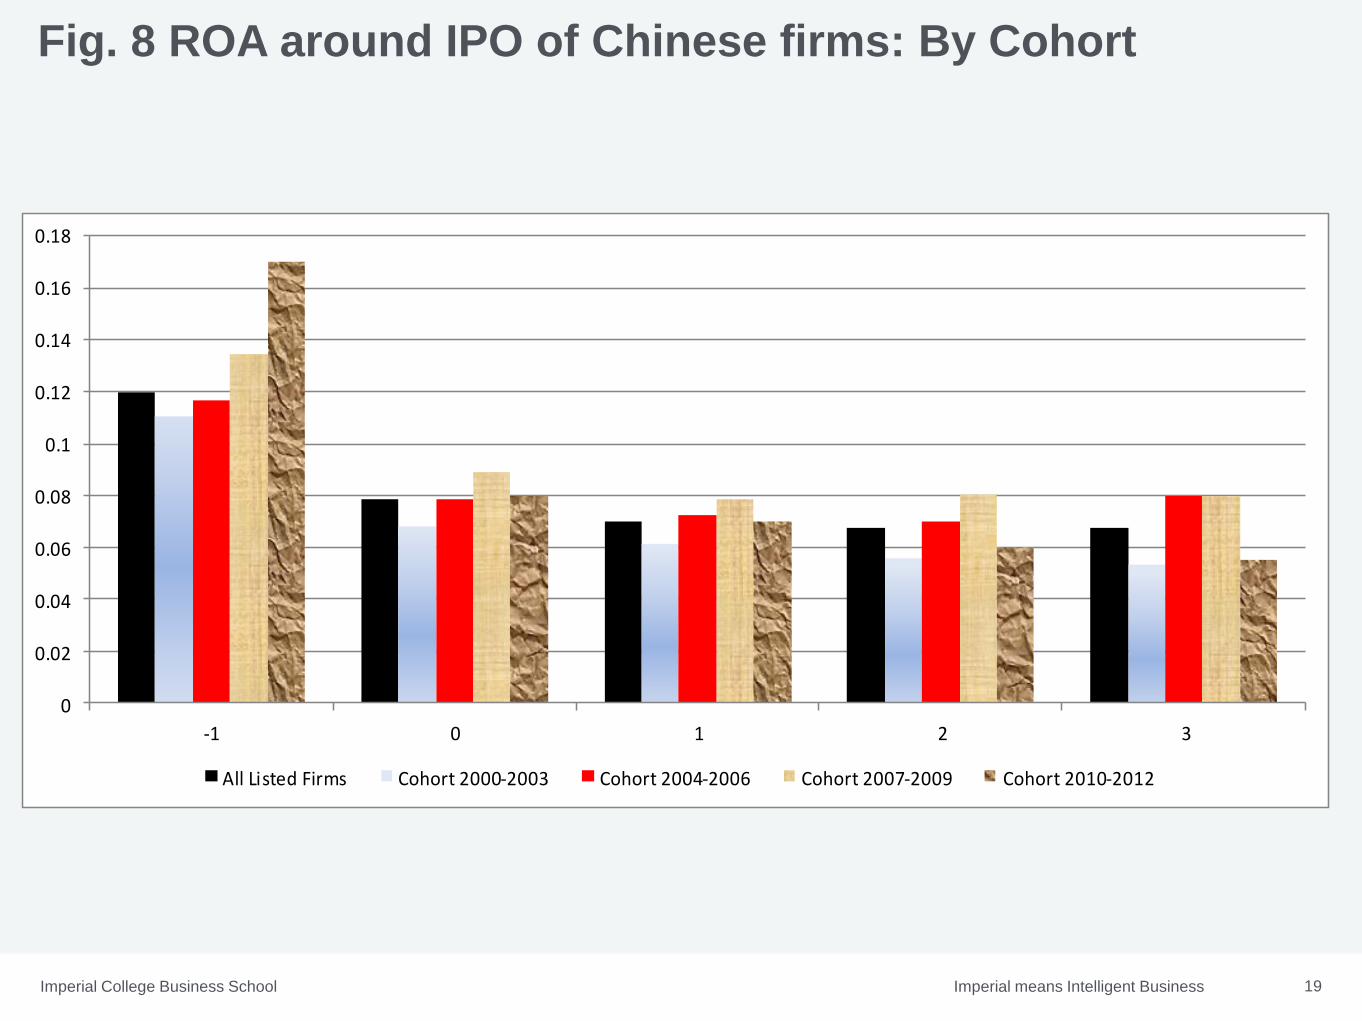
Fig. 8 ROA around IPO of Chinese firms: By Cohort
0
0.02
0.04
0.06
0.08
0.1
0.12
0.14
0.16
0.18
-1 0 1 2 3
All Listed Firms Cohort 2000-2003 Cohort 2004-2006 Cohort 2007-2009 Cohort 2010-2012
Imperial means Intelligent BusinessImperial College Business School 20
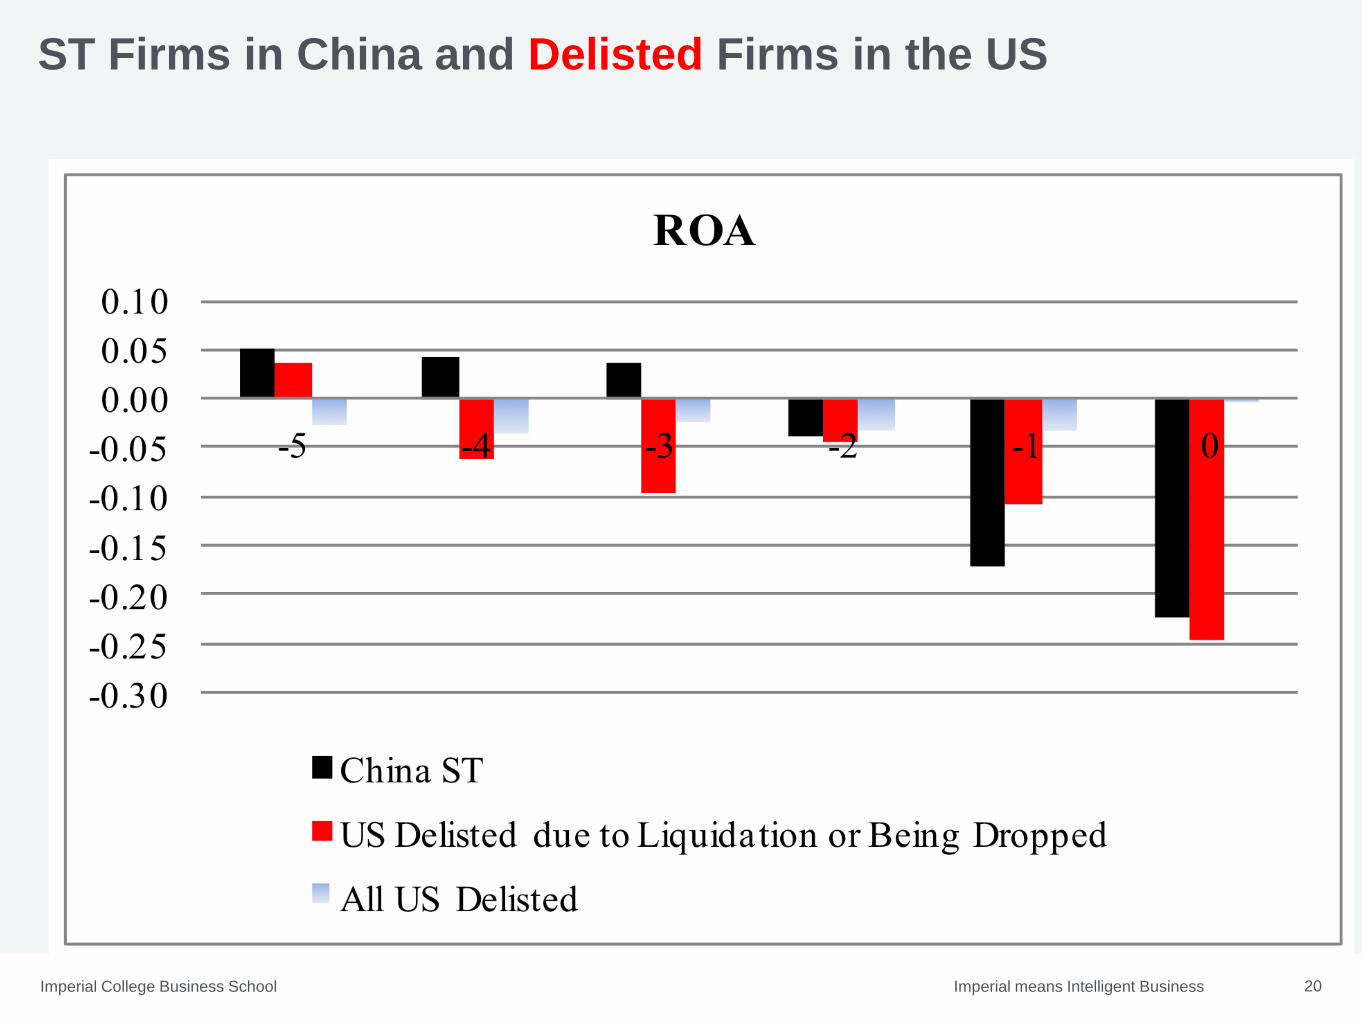
ST Firms in China and Delisted Firms in the US

Imperial means Intelligent BusinessImperial College Business School 21
Comparison of Investment of Listed Firms: Capital Expenditure/Assets
Imperial means Intelligent BusinessImperial College Business School 22
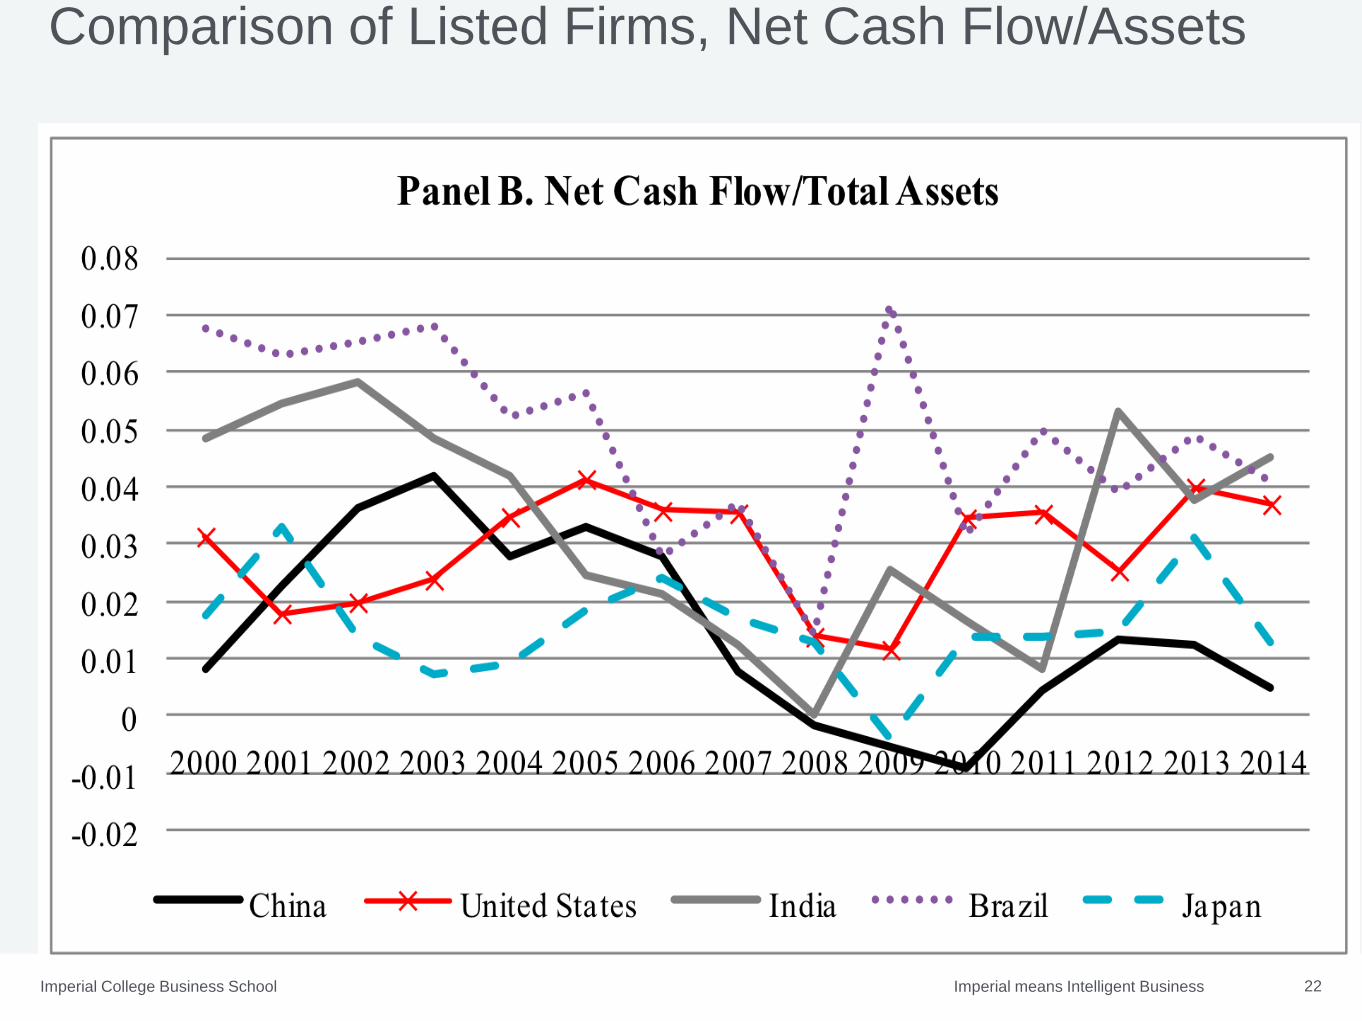
Comparison of Listed Firms, Net Cash Flow/Assets
Imperial means Intelligent BusinessImperial College Business School 23
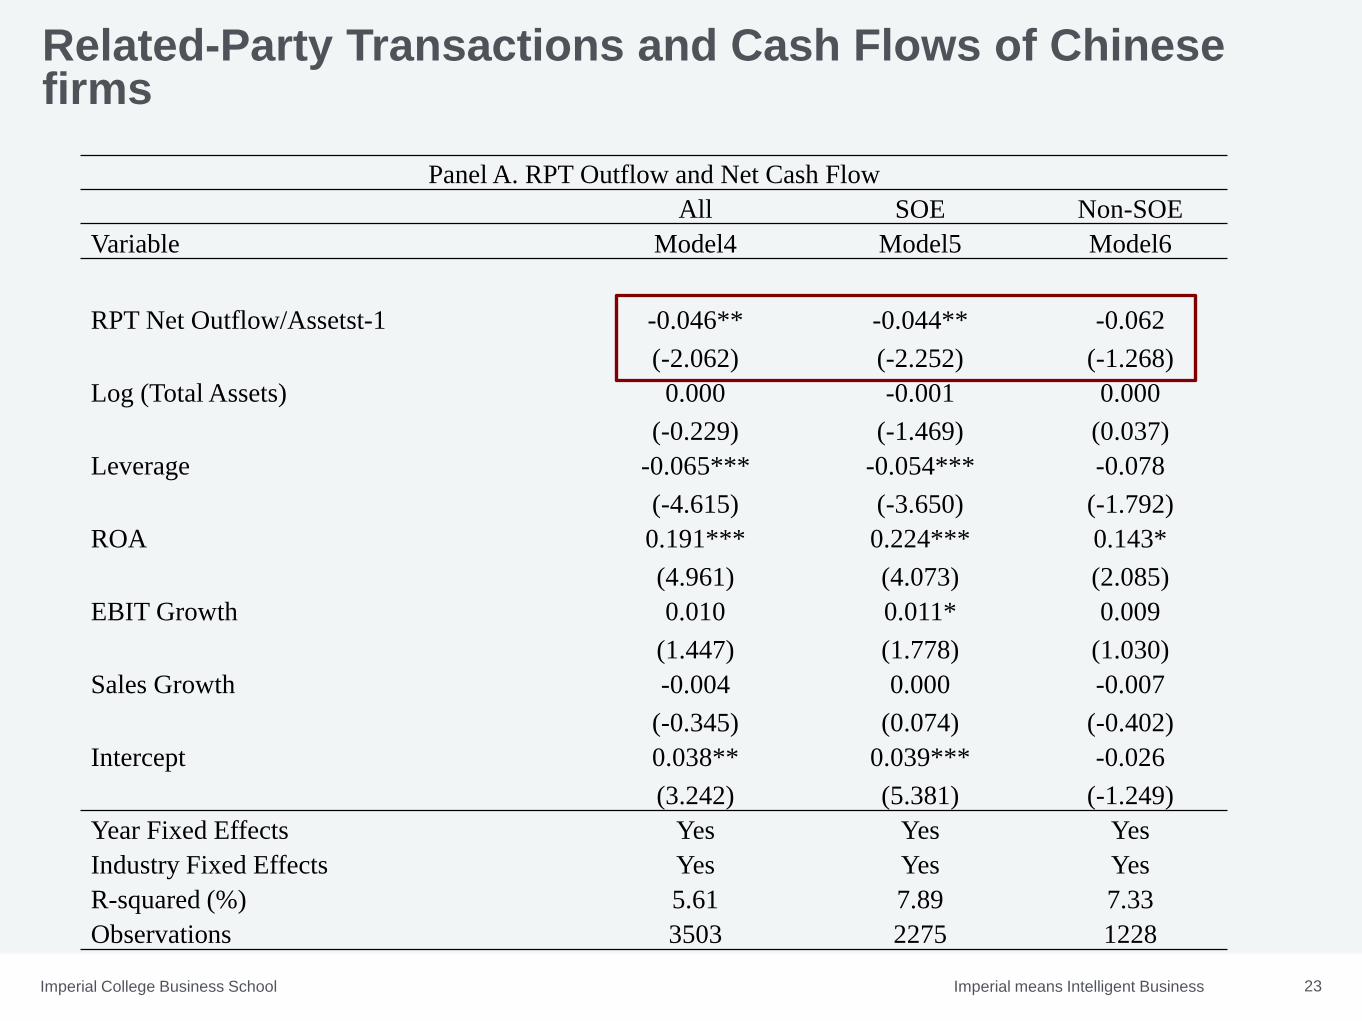
Related-Party Transactions and Cash Flows of Chinese firms
Panel A. RPT Outflow and Net Cash Flow
All SOE Non-SOE
Variable Model4 Model5 Model6
RPT Net Outflow/Assetst-1 -0.046** -0.044** -0.062
(-2.062) (-2.252) (-1.268)
Log (Total Assets) 0.000 -0.001 0.000
(-0.229) (-1.469) (0.037)
Leverage -0.065*** -0.054*** -0.078
(-4.615) (-3.650) (-1.792)
ROA 0.191*** 0.224*** 0.143*
(4.961) (4.073) (2.085)
EBIT Growth 0.010 0.011* 0.009
(1.447) (1.778) (1.030)
Sales Growth -0.004 0.000 -0.007
(-0.345) (0.074) (-0.402)
Intercept 0.038** 0.039*** -0.026
(3.242) (5.381) (-1.249)
Year Fixed Effects Yes Yes Yes
Industry Fixed Effects Yes Yes Yes
R-squared (%) 5.61 7.89 7.33
Observations 3503 2275 1228
Imperial means Intelligent BusinessImperial College Business School 24
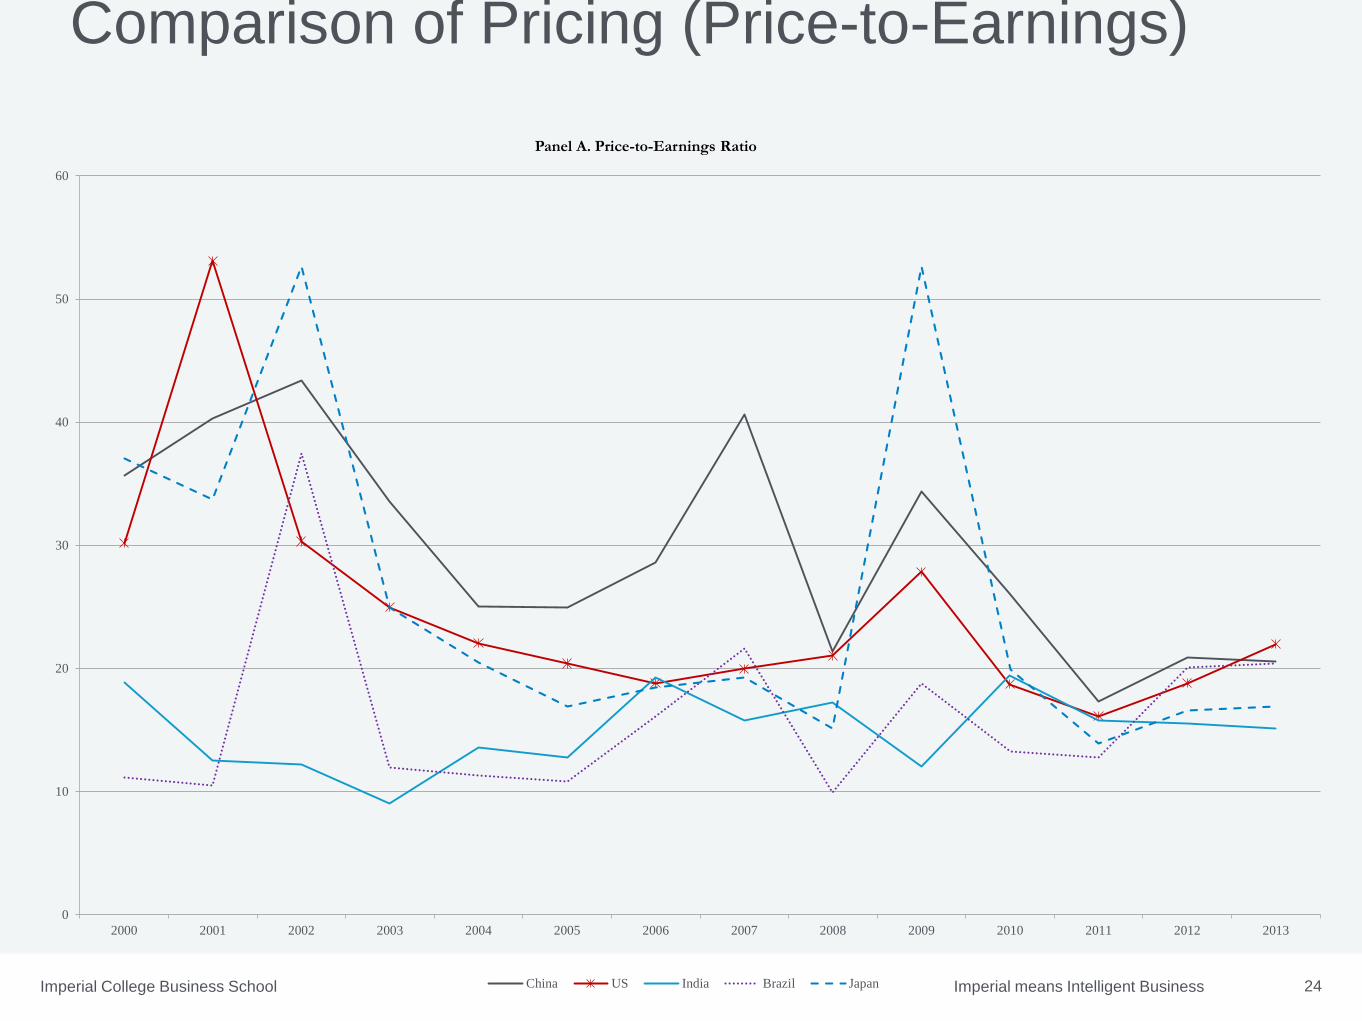
Comparison of Pricing (Price-to-Earnings)
0
10
20
30
40
50
60
2000 2001 2002 2003 2004 2005 2006 2007 2008 2009 2010 2011 2012 2013
Panel A. Price-to-Earnings Ratio
China US India Brazil Japan

Imperial means Intelligent BusinessImperial College Business School 25
Comparison of Pricing (Market-to-Book)
0
1
2
3
4
5
6
2000 2001 2002 2003 2004 2005 2006 2007 2008 2009 2010 2011 2012 2013
Panel B. Market-to-Book
China US India Brazil Japan
Imperial means Intelligent BusinessImperial College Business School 26
Concluding remarks
• Disconnection between economic growth and stock market in China
• Explaining the poor performance
– Firms that are listed are not representative of the economy as a whole
– Problems with the IPO listing process;
– Problems with the delisting process
– Corporate governance problems: either investment decisions are very bad
or there is tunneling or (probably) both

Imperial means Intelligent BusinessImperial College Business School 27
Concluding remarks (cont.)
• Implications:
– IPO listing process: Lowering standards, encourage the listing of more
privately owned and growth firms, administrative process => market
process
– Delisting process: Tougher regulations on delisting
– Improve corporate governance
• The 2015 bubble in the Chinese stock market
• Implications for UK investors