Embed Size (px)
Citation preview
Social Affairs. Vol.1 No.2, 59-94, Spring 2015
59
Factors aFFecting the UnderperFormance oF employees*
Nadeeka Amarasinghe**Brandix Intimate Apparel Ltd., Mirigama, Sri Lanka
AbstrAct
BASL Intimate Apparel Mirigama is the largest factory of Brandix Group of Companies catering to VS Pink. It has a labour force of 1250 employees including a direct labour force of 659. Production capabilities have been extended to in-house printing and embroidery sections in addition to cutting and shipping facilities.
Like other apparel manufacturers in the industry, BASL Intimate Apparel Mirigama also faces much competition and problems in its day to day business operations. One of the major issues so faced is On-Time-Delivery due to underperformance of the employees.
Therefore, with the objectives of studying factors affecting the underperformance of the employees of the production department, analysing and identifying such factors, and providing recommendations, a few variables i.e. machines and methods, skill level, financial incentives, leadership practices and working conditions were identified as having a potential impact over the performance of the production employees. Stratified random sampling method was used to select 64 team members from the 32 production modules, and research work continued to collate primary data through administrating a structured questionnaire among selected associates.
Null and alternative hypotheses were tested using correlations, and the data is presented as graphical pictures, tables, and in narrative form. However, there were a few limitations such as management influence, sample basis selection, service period, level of understating, time availability and commitment, time availability for the study etc. which may have had an impact over the research findings.
Key Words: Underperformance, On-Time-Delivery, Apparel Industry, Sri Lanka, Brandix Apparel Solutions
* This paper is a condensed version of a research report submitted for the Professional Qualification in Human Resource Management to the Institute of Personnel Management Sri Lanka
** Author [email protected] [email protected]©2015 Social Affairs Journal. This work is licensed under a Creative Commons Attribution-NonCommercial 4.0 International License.
social Affairs: A Journal for the social sciencesISSN 2362-0889 (online)
www.socialaffairsjournal.com
60
Social Affairs. Vol.1 No.2, 59-94, Spring 2015
INtroductIoN
In Sri Lanka, there are few major export products such as textiles and apparel, pharmaceuticals, tea, diamonds, emeralds, rubies, coconut and rubber products, and fish. The main overseas buyers include the United States, United Kingdom, India, Belgium, Germany and Italy.
Sri Lanka plays a major role in the industry of textiles and apparel providing quality garments in a reliable way compared to regional competitors such as India, Bangladesh and China. It has become one of the biggest industries in Sri Lanka and it earns the most amount of foreign exchange. Further, it employs more than 15% of the workforce of the country, of which nearly 85% are women. In addition to these direct job opportunities, there are many indirect job opportunities offered to the general public by this industry.
Major players in the industry include MAS Holdings, Brandix Group of Companies, Hydramani, Courtaulds Clothing, Hela Clothing etc. Especially MAS and Brandix have become apparel solution providers
for popular brands in the world like Victoria’s Secret, Marks and Spencer, Nike, Gap etc.
Of these, the Brandix Group of Companies was chosen for the study due to convenience making it perfect grounds to explore the conditions that may affect employee performance levels through changing times and circumstances. In particular, the Mirigama branch of Brandix called the Brandix Apparel Solutions Limited (BASL) Intimate Apparel Mirigama was chosen due to a few reasons: Convenience, the magnitude of the plant (with 1300 employees), and the use of KPIs (Key Performance Indicators) that enabled easy access to performance data of the employees in the plant.
Starting in 1969 with few sewing machines, Brandix gradually became a garment manufacturing organization and has now transformed into an apparel solutions provider. It has also invested in various sectors like ICT and education. Presently, Brandix has expanded its operations to India and Bangladesh as well. The company Vision is “To be the inspired solution for Branded Clothing”.
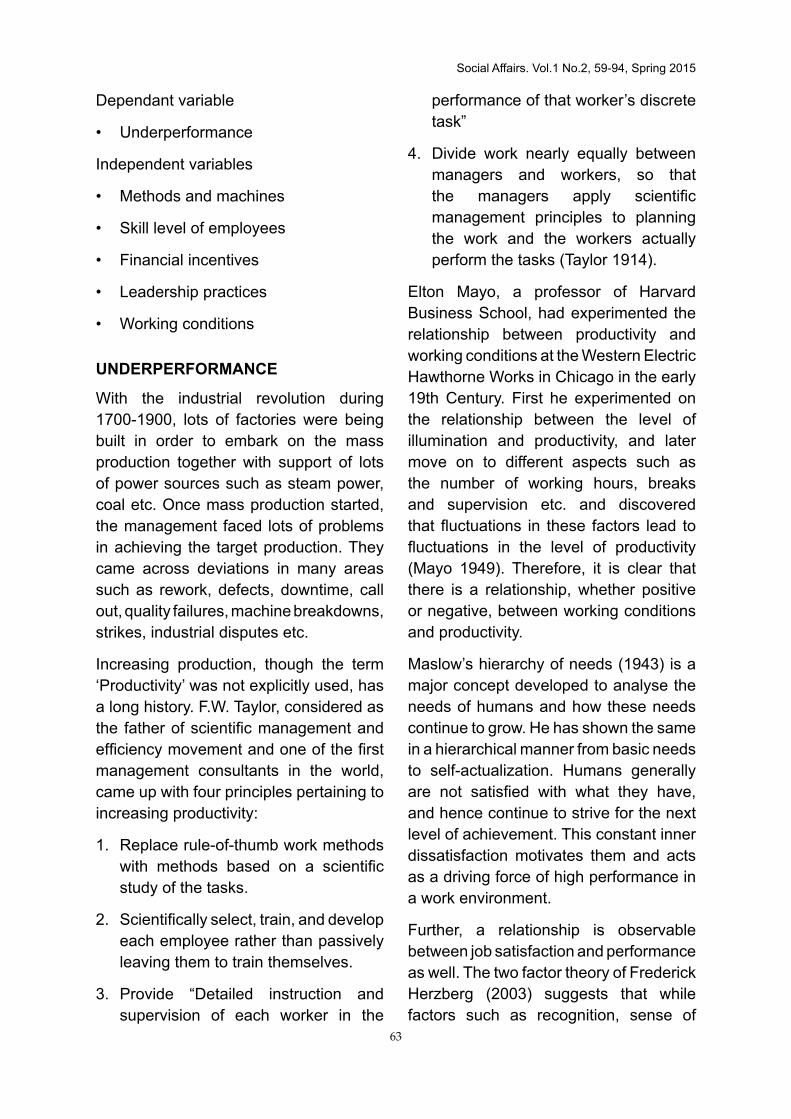
brandix Group
Fabric manufacturing and printing
Accessories and services
Garment manufacturing
Foreign investments
Figure 1.1structure of brandix Group
BASL – Intimate Apparel Mirigama is the biggest plant of the apparel sector that caters to the requirements of Pink brand of LBrands, formerly known as Limited Brands. It has a labour strength of 1250 employees, out of whom 659 are direct employees in 32 production
modules. It has maintained Labour Turn Over and Absenteeism at the rate of 3%-5% consecutively for the last few months of the year 2014. In terms of operation, it has in-house cutting facility and shipping, and with the support of two other outsource companies it provides

Social Affairs. Vol.1 No.2, 59-94, Spring 2015
61
printing and embroidery facilities in the same premises.
stAtemeNt oF problem
The plant is currently practicing the LEAN manufacturing concept and its results are measured based upon five pillars namely Safety, Quality, Cost, Delivery and Morale commonly named as SQDCM. Under the pillars Quality and Delivery, it is common to see that the trend line of On
time Delivery, rework rate, achievement of Standard Actual Hours (SAH), On time Reconciliation etc. are not in line with the expected level due to various reasons, requiring associates and the management team to continuously solve problems using PDCAs (Plan-Do-Check-Act) and other systematic problem solving methods. Further if it is carefully analysed, there is a drop in quality output from the production lines.
Description April 14
May 14
June 14
July 14
August 14
September 14
Actual Efficiency %
52.28 53.43 55.21 53.05 53.05 48.78
Planned Efficiency %
60.08 64.40 63.98 59.18 60.53 58.73
Efficiency drop % 7.80 10.97 8.77 6.13 7.48 9.95
Table 1.1 Efficiency drop in the last few months – Source from Production department
The above table makes it clear that production is not achieving the planned efficiency, and this may impact on the production output and lead to overtime working with an additional cost to the company. There are various reasons that
lead to the drop of production efficiency i.e. the output by the production department. The following graph shows the lost hours that were reported from April 14, 2014 to September 2014.
Figure 1.2 Lost hours in the last few months – Source: Production Department, BASL – Intimate Apparel Mirigama

62
Social Affairs. Vol.1 No.2, 59-94, Spring 2015
Many are of the opinion that production lines that consist of machine operators are not performing well, leading to production drop per day and per month. Therefore, it is necessary to analyse the factors affecting the underperformance of employees of the production department of BASL- Intimate Apparel Mirigama in order to find ways to address the problem and bring up the level of production.
prActIcAl relevANce oF the study.
In a garment factory, the production department is considered to be the ‘Heart’. Nearly no entrepreneur hesitates to feed the maximum expecting the maximum in return. Hence lots of benefits such as incentives almost equalling the basic salary, attendance incentives, team bonus, Christmas and April New Year allowances, etc. are given to production department employees including machine operators.
The apparel industry has become the most foreign exchange earning business of the country, which can be maintained if quality products with faster service at lower retail prices are provided. In order to make this happen, the heart of a factory (production department) makes the biggest effort, though admittedly other supporting services also play a large role. It is very common to see team leaders updating the production control board with their hourly actual achievement against the pre-planned pieces. They are also responsible for any drop in production. PDCAs need to be alert about recurring problems in the lines. For any small accident to a team member, they need to investigate the accident in order to prevent it from recurring. They are
persuaded to maintain in-station quality rather than costly rework, since the latter is a de-motivating factor. Instead, they need to achieve First Time Through (FTT), i.e. the extent to which the production modules achieve the required quality level at first. Likewise there are lots of standards that should be maintained in order to achieve the planned production targets. Safety, Quality, Cost, Delivery and Morale are the five objectives that a production module focuses on.
To sustain in the competitive market, it is required to cater the products at the required quality standard, and within minimum lead-time with on time delivery. To do all these, the production department needs to perform at the planned level and at required standards. In this endeavour, single minute drop of production is monitored and recorded as it is very important. The management is eager to look into the issues that drop production because such drop may convert sea cargo into air cargo in order to ensure on time delivery, but at double the cost.
In generel, it can be seen employee performance being affected by many factors. The actual performance level has serious implications for the final production capacity of the factory. Though there are n number of factors that may directly and/or indirectly have an impact on the underperformance of the production department, it is important to study the function of at least the most important variables in order to contribute to the enhancement of employee performance. Towards this end, the following variables have been identified:
Social Affairs. Vol.1 No.2, 59-94, Spring 2015
63
Dependant variable
• Underperformance
Independent variables
• Methods and machines
• Skill level of employees
• Financial incentives
• Leadership practices
• Working conditions
uNderperFormANce
With the industrial revolution during 1700-1900, lots of factories were being built in order to embark on the mass production together with support of lots of power sources such as steam power, coal etc. Once mass production started, the management faced lots of problems in achieving the target production. They came across deviations in many areas such as rework, defects, downtime, call out, quality failures, machine breakdowns, strikes, industrial disputes etc.
Increasing production, though the term ‘Productivity’ was not explicitly used, has a long history. F.W. Taylor, considered as the father of scientific management and efficiency movement and one of the first management consultants in the world, came up with four principles pertaining to increasing productivity:
1. Replace rule-of-thumb work methods with methods based on a scientific study of the tasks.
2. Scientifically select, train, and develop each employee rather than passively leaving them to train themselves.
3. Provide “Detailed instruction and supervision of each worker in the
performance of that worker’s discrete task”
4. Divide work nearly equally between managers and workers, so that the managers apply scientific management principles to planning the work and the workers actually perform the tasks (Taylor 1914).
Elton Mayo, a professor of Harvard Business School, had experimented the relationship between productivity and working conditions at the Western Electric Hawthorne Works in Chicago in the early 19th Century. First he experimented on the relationship between the level of illumination and productivity, and later move on to different aspects such as the number of working hours, breaks and supervision etc. and discovered that fluctuations in these factors lead to fluctuations in the level of productivity (Mayo 1949). Therefore, it is clear that there is a relationship, whether positive or negative, between working conditions and productivity.
Maslow’s hierarchy of needs (1943) is a major concept developed to analyse the needs of humans and how these needs continue to grow. He has shown the same in a hierarchical manner from basic needs to self-actualization. Humans generally are not satisfied with what they have, and hence continue to strive for the next level of achievement. This constant inner dissatisfaction motivates them and acts as a driving force of high performance in a work environment.
Further, a relationship is observable between job satisfaction and performance as well. The two factor theory of Frederick Herzberg (2003) suggests that while factors such as recognition, sense of

64
Social Affairs. Vol.1 No.2, 59-94, Spring 2015
achievement, personal growth, high wages, and employee-friendly company policies lead to job satisfaction, their absence may lead to dissatisfaction and a decline of performance.
Underperformance is the gap between the target performance and the actual performance. For instance, as far as the production module is concerned, it is the negative difference of the actual output against the target production of the particular day. As per Gill (2013) underperformance or poor performance is a failure to perform the duties of the role or the failure to perform them to the standard required by the business. Bourke (2011) says that underperformance is where the level of performance achieved by an employee is below the standard of performance expected within the role. This may be in terms of skill, aptitude and/or application. As per the report by Haycroft Workplace Solutions (2012);
a. underperformance is unsatisfactory work performance, that is, a failure to perform the duties of the position or to perform them to the standard required,
b. non-compliance with workplace policies,
c. rules and regulations, unacceptable behaviour in the workplace,
d. disruptive or negative behaviour that impact on co-workers.
Weintraub (as cited in Yakowicz n.d.) states that underperformance is like infection. You have to treat it and help it heal, or else it will spread.
methods ANd mAchINes
The apparel industry is usually known as a labour intensive manufacturing industry as opposed to a machine intensive one. However, if we carefully analyse it is possible to detect the use of sewing machines, cutting machines, spreader machines, fabric inspection machines, printing machines and embroidery machines throughout the production process.
In this study, the researcher has taken machines and methods as an independent variable since the production floor employees’ performance is dependent on machine availability and the smooth functioning of such machines. If the machines are not smoothly operating, it may lead to a drop in the production since the machine operators cannot continue with their target performance of the module of the particular day and claim the predefined incentive. For a module to hit their target of the day, there few requirements need to be met.
i. The relevant machine should be available
ii. The machine should be available on time
iii. Machine layout should be prepared well in advance
iv. Pre-setting of machines needs to be done before the feeding
v. No changes should be done after the feeding
Parkhamson (2010) states that the industrial sewing machine has revolutionised the clothing industry by allowing manufacturers of assorted garments to enjoy a higher quality

Social Affairs. Vol.1 No.2, 59-94, Spring 2015
65
of output while affording increased productivity. Any tool that can increase the quality and speed simultaneously will quickly become an important asset to a business. He also states that industrial sewing machines provide more quality as well as faster outputs compared with home models.
Typically, business establishments perform various types of activities in order to enjoy the following benefits:
i. Reduce machine breakdowns and support continuous flow in the production module
ii. Lower the maintenance cost by introducing PM (Planned Maintenance) and AM (Autonomous Maintenance)
iii. Lower the product cost
iv. Improve machine performance
Sarkar (n.d) divides these activities into two categories namely machine breakdown maintenance and preventive maintenance. In machine pre-setting, mechanics check all the components of the sewing machine in order to minimise the production losses that might take place during the production running. Any production drop may compromise the ability to achieve On Time Delivery (OTD), which can damage the goodwill between the buyer and the seller, resulting in negative outcomes for the business in the long run.
sKIll level oF employees
A skilled labour force will guarantee better market opportunities for the supplier due to maintaining better quality standards. Dictionary.com defines skill as “the ability
coming from one’s knowledge, practice, aptitude etc. to do something well”. As per a report of the International Labour Organization (2011), “Equipping the workforce with the skills required for the jobs of today and those of tomorrow is a strategic concern in the national growth”(p.1).
Multi-skilled labour, rather than specializing in a particular field or specific task, is likely to benefit the organization in greater proportions. Kelchner (n.d.) notes that if a company possesses multi-skilled employees, it can get the benefit of a flexible workforce which provides the employer with the ability to schedule and arrange workers to best suit the needs of business. Such workers could be deployed for absent covering and where the company needs more manpower. Further, a multi-skilled work force will decreased labour costs as otherwise they may become idle when their specialized departments do not have adequate work to engage them in. Efficiency in planning is also one of the benefits of a multi-skilled workforce since a single employee will be equipped to perform multiple tasks.
FINANcIAl INceNtIves
Incentive is an instrument that provides motivation to the workforce. There are two types of incentives, i.e. financial incentives and non-financial incentives. It is generally agreed that neither financial incentive nor non-financial incentives alone can motivate employees and hence a balance is always maintained between these two. It is presumed that the employees at the higher level of an organizational hierarchy get motivated mostly by non-monetary rewards and incentives.

66
Social Affairs. Vol.1 No.2, 59-94, Spring 2015
According to Gratton (2004) (as cited in Silverman 2004), motivation is determined by both monetary and non-monetary factors. Bryson et al (2011) cite individual rated schemes, group incentive schemes, profit-sharing bonuses, developed employee stock ownership programs etc. as examples of employee incentives.
Cherry (n.d.) identifies two types of incentives: extrinsic and intrinsic. Extrinsic motivation occurs when we are motivated to perform behaviour or engage in an activity in order to earn a reward or avoid a punishment. Intrinsic motivators are those that involve engaging in behaviour since it is personally rewarding and you find it interesting. As an example, people engage in sports as they really find it interesting.
However, there are findings that contradict the assumption that incentives boost performance. For instance, Gneezy & Rustichini (2000) and Heyman & Ariely (2004) (as cited in Kamenica 2012) illustrate a case in point: In the absence of any monetary incentives, somebody solves two puzzles per week. If offered $5 per puzzle solved, no puzzles were solved. This means that there are instances where the incentives backfire.
Notwithstanding these exceptions, it is generally believed that there is a strong positive relationship between the production incentive and the achievement of the target. Hence in this research financial incentive is taken in to consideration as an independent variable to study its bearing on employee performance.
leAdershIp prActIces Another important aspect in this research is how leadership practices relate to employee performance. Mills (2005) states that leadership is a process by which one person influences the thoughts, attitudes and behaviours of others and without leadership, group of human beings quickly degenerate into arguments and conflicts.
Why is leadership so important in the business sector? Managers are principal administrators and they write business plans, set budgets and monitor the progress. Leaders actualize these plans (Maccoby 2000). A good leader can make a success of a weak business plan, but a poor leader can ruin the best plan (Oracle Taleo Cloud Service 2012). A survey reveals that as a result, companies fill as little as 36 per cent of their leadership positions (Oracle Taleo Cloud Service 2012). This is primarily because a failure in leadership would magnify and reflect itself in great losses to the company since in the absence of proper guidance and supervision employees will have no reason to perform to standard, and therefore appointing able leaders should be done with greatest care.
WorKING coNdItIoNs
In the context of working conditions, working hours play a major role. In Sri Lanka, working hours been limited to 45.5 hour per week and 60 hours including overtime per week. A female employee can work maximum of 12 hours per day. However, this would be impacted by the vendors. For instance, most of apparel manufactures have to obey to the Suppliers’ Code of Conduct where working hours are specially mentioned.
Social Affairs. Vol.1 No.2, 59-94, Spring 2015
67
Kelly et al (as cited in Golden 2012) states that the common problem identified in all literature is that there is no coherent theory of exactly how, through which pathways various working time arrangements influence employee productivity, directly or indirectly. As per the International Labour Office (2004) poor work time arrangements may lead to productivity losses and improved work time arrangements lead to benefits. Further it says that the impact comes from not only the length of working hours but also how the working time changes are implemented. According to it numerous enterprise-level studies show that businesses gain advantages by allowing employees to adjust their work time in a way that promotes work-life balance. These policies would increase the cost, but will benefit in other ways (Koening n.d.).
Sometimes organizations have to provide some welfare benefits to their employees in order to be compliant with the law. Social security taxes are one instance. In the apparel industry, free transport has become a norm and organizations in the industry allocate a significant amount out of their annual budget for transportation. These benefits have transformed into a tool of survival in the business because employee interest in and enthusiasm for the company depend largely on these policies. To lose such interest and enthusiasm would amount to corporate suicide.
The International Labour Organization (2009) estimates that each year about 2.3 million men and women die from work related accidents and deceases including close to 360,000 fatal accidents and an estimated 1.95 million fatal work related
diseases. In economic terms, roughly 4% of the annual global gross domestic product or US$ 1.25 trillion is lost as direct and indirect costs of occupational accidents and deceases such as loss of working time, workers’ compensation, interruption of the production process, and medical expenses.
In this light, the provision of welfare facilities would create a good image within the industry while supporting the recruitment and retention of employees as on the other hand it might be a hot topic among potential candidates to select their employer (Koening n.d.) and the other might have a bearing on how employees perform following recruitment. Hence the study aims to look at the relationship between working conditions and employee performance, taking the former to be an independent variable.
obJectIves oF the study ANd lImItAtIoNs
This research has three main objectives:
• To identify the factors affecting the performance level of employees
• To analyse the relationship between such factors and the performance level of employees
• To provide recommendations to the management in order to minimise potential impact of employee underperformance on target output
A main limitation of this research was the service period. The random sampling method was employed for the study, and hence employees with varying lengths of service periods were included in the sample. If the selected respondent does not possess reasonable experience
68
Social Affairs. Vol.1 No.2, 59-94, Spring 2015
within the organization, the feedback might have been less than accurate.
The primary data collection method used in the research was an open-ended questionnaire. In this exercise, the level of understanding of individual employees very likely affected their responses. The level of understanding in turn is dependent on their education, family background, and socio-cultural context, which limits my capacity to construct an objective picture out of their responses.
Regular production operations in the plant restricted the time team members had to spend on answering the questionnaire. This meant that their logical reasoning was also somewhat arrested due to the lack of time. Therefore, there is a possibility of this factor to be reflected in the results.
Additionally, this research was carried out within a short span of time (3 months).
This compelled to overlook certain areas pertaining to the study, which might have affected the final result.
coNceptuAl FrAmeWorK
There are many factors affecting the performance of employees such as financial benefits, skills, attitudes, leadership practices, experience, satisfaction and work life balancing etc. However, focus has been narrowed down to the following variables that were identified as the most significant influences on the performance level of employees.
a. Methods and machinery
b. Skill level of team members
c. Financial incentives
d. Leadership practices
e. Working conditions
Figure 03.1 Conceptual framework.

Social Affairs. Vol.1 No.2, 59-94, Spring 2015
69
Independent variables dependent variable
X1 - Machine and methods
Y - Underperformance
X2 - Skill level of team members
X3 - Financial incentives (Production incentive)
X4 - Leadership practices
X5 - Working conditions
table 03.1 dependent and independent variables
This can be further explained in a formula as follow.
Y = f( x1, x2, x3, x4, x5)
3.2 Hypothesis tested
Following null hypothesis H0 and alternative hypothesis H1 were formulated to be tested.
H0
a. Methods and machinery do not relate to the performance of team members.
b. Skill level of team members does not relate to their performance.
c. Financial incentives (production incentives) do not relate to the performance of the team members.
d. Leadership practices of supervisory associates and management team do not relate to the performance of team members.
e. Working conditions do not relate to the performance of team members.
H1
a. Methods and machinery relate to the performance of team members.
b. Skill level of team members relates to their performance.
c. Financial incentives (production incentives) relate to the performance of team members.
d. Leadership practices of supervisory associates and management team relate to the performance of team members.
e. Working conditions relate to the performance of team members.
populAtIoN ANd sAmplING
The entire cadre consists of 659 team members including 32 team leaders who were promoted from team members to team leaders. These team leaders report to supervisors and team members report to team leaders. Each team consists of 20-21 team members who report to their respective team leader.
The sample is limited to 64 respondents who are full time actively involved in the production process. The 32 team leaders participate in stitching whenever required and they fully engage in the achievement of production targets.
The selection of the sample was based on stratified random sampling in order to represent all the team members as below.

70
Social Affairs. Vol.1 No.2, 59-94, Spring 2015
Sampling method = No of team members / No of respondents of the module
= 19/2
= 9.5 round up to 10
Select first respondent randomly from 1 to 10 persons and next
respondent is next 10th person from the selected person.
Example,
Select first one randomly, i.e. 5th person and next would be 15th person
in the production module.
Total sample = No of respondents x 32
= 2 x 32
= 64
methods oF dAtA collectIoN
Two sources were consulted for information in this research namely primary data and secondary data.
prImAry dAtA
Primary data is more significant to the research because they give a first-hand account of the ground situation. This was collected through a questionnaire. The questionnaire was developed based upon the variables identified previously, in order to test the hypotheses. The Likert scale with five different choices namely strongly disagree, disagree, neither agree
nor disagree, agree and strongly agree was used for this purpose. Further in order to gain an in-depth understanding of the situation, focus group discussions were held and scheduled meetings by others relating to the topic were attended: Nerve Centre Meeting is the weekly review meeting of the plant KPIs. Significant drops in the KPIs are specially discussed and action plans are agreed upon in order to rectify the issues. Delivery meeting is another meeting which is held to review the status of the deliveries in relation to the production.
secoNdAry dAtA
Secondary data was collected through sources available in the production department and other departments such as Industrial Engineering Department, Method-Study Lab and HR department. Related articles, internet, books etc. were also consulted in the search for secondary data.
Further, production data was taken with amendments to show the real picture. Here, pieces produced during unplanned overtime hours were avoided as the drop of production was made up for during such time in order to deliver the shipment on time. Depending on the efficiency of the module, a rate ranging from 1 to 5 was given to analyse the production data.
dAtA ANAlysIs ANd preseNtAtIoN
The analysis of gathered data was done using SPSS and MS Excel.
Bar charts, pie charts and scatter diagrams were used in order to support the narrative interpretations of each variable.

Social Affairs. Vol.1 No.2, 59-94, Spring 2015
71
Pearson correlation was used to show the relationship between the independent variables and the dependant variable, and narrations were provided to explain them in detail.
INtroductIoN to dAtA ANAlysIs
A sample on stratified basis was selected for the research. Since it was a sample that represented the total group of the target workforce, it was vital to have an understanding of the sample selected.
Hence the following analyses were done in order to understand the backgrounds of the respondents.
ANAlysIs oF the respoNdeNts
Analysis of age
BASL Intimate Apparel Mirigama plant employs 659 sewing associates. In the research, 64 sewing associates were taken based on stratified random sampling. The sample consists of three age categories: 18-30, 31-40 and 41-55.
Age No of respondents %
18-30 42 65.63%
31-40 19 29.69%
41-55 3 4.69%
Grand total 64 100%
table 4.1 Age analysis of respondents
AGe oF the respoNdeNts
Figure 4.1 pie chart of age analysis of respondents
72
Social Affairs. Vol.1 No.2, 59-94, Spring 2015
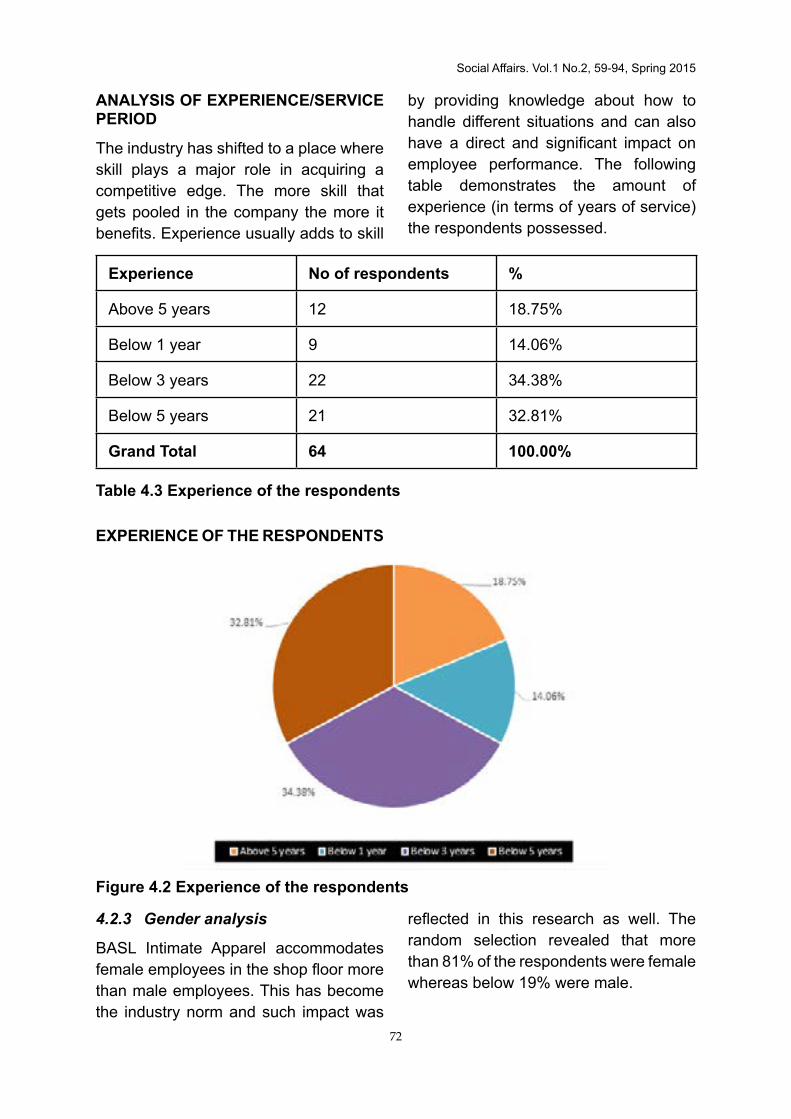
ANAlysIs oF experIeNce/servIce perIod
The industry has shifted to a place where skill plays a major role in acquiring a competitive edge. The more skill that gets pooled in the company the more it benefits. Experience usually adds to skill
by providing knowledge about how to handle different situations and can also have a direct and significant impact on employee performance. The following table demonstrates the amount of experience (in terms of years of service) the respondents possessed.
experience No of respondents %
Above 5 years 12 18.75%
Below 1 year 9 14.06%
Below 3 years 22 34.38%
Below 5 years 21 32.81%
Grand total 64 100.00%
table 4.3 experience of the respondents
experIeNce oF the respoNdeNts
Figure 4.2 experience of the respondents
4.2.3 Gender analysis
BASL Intimate Apparel accommodates female employees in the shop floor more than male employees. This has become the industry norm and such impact was
reflected in this research as well. The random selection revealed that more than 81% of the respondents were female whereas below 19% were male.

Social Affairs. Vol.1 No.2, 59-94, Spring 2015
73
Gender No of respondents %
Female 52 81.25%
Male 12 18.75%
Grand total 64 100.00%
table 4.4 Gender analysis
GeNder oF the respoNdeNts
Figure 4.3 Gender of the respondents
ANAlysIs oF educAtIoNAl quAlIFIcAtIoNs
The following table and pie chart illustrate the formal educational qualifications of the respondents.
Educational qualifications No of respondents %
A/L Passed 15 23.44%O/L Passed 14 21.88%Up to O/L 35 54.69%Grand total 64 100.00%
Table 4.5 Educational qualifications

74
Social Affairs. Vol.1 No.2, 59-94, Spring 2015
educAtIoN level oF respoNdANts
Figure 4.4 educational level of respondents
ANAlysIs oF perFormANce oF employees
The performance of the employees of the selected sample was derived based on their particular production module. The
performance of the production line for a week’s time was analysed and employees were rated accordingly. Considering the achievement of the production plan, they have been assigned a rating as shown in table 4.6.
performance criterion Achievement level No of observations
%
Top performance 100% of the plan
5 4 6.25%
Exceed expectation Above 95% 4 10 15.63%
Meet expectation Above 90% 3 10 15.63%
Average performance Above 85% 2 32 50.00%
Poor performance Below 85% 1 8 12.50%
64 100%
table 4.6 performance

Social Affairs. Vol.1 No.2, 59-94, Spring 2015
75
Figure 4.5 performance summary
Figure 4.6 Team wise performance
ANAlysIs oF vArIAbles
mAchINe ANd methods
mAchINe

76
Social Affairs. Vol.1 No.2, 59-94, Spring 2015
In the questionnaire, there were five questions related to machine capability
and availability. The feedback has been summarised as follows.
Methods St rong ly disagree
Disagree N e i t h e r agree nor disagree
Agree Strongly Agree
Question N % N % N % N % N %
Q6 2 3% 14 22% 7 11% 36 56% 5 8%
Q7 6 9% 14 22% 11 17% 30 47% 3 5%
Q8 1 2% 8 13% 7 11% 42 66% 6 9%
Q9 3 5% 21 33% 13 20% 27 42% 0 0%
Q10 3 5% 31 48% 10 16% 18 28% 2 3%
5% 28% 15% 48% 5%
table 4.7 summary of machine capability and availability
mAchINe
Figure 4.7 summary of machine capability and availability

Social Affairs. Vol.1 No.2, 59-94, Spring 2015
77
mAchINe vs perFormANce
Figure 4.8 scatter diagram
Mean of Methods Performance levelMean of Methods 1Performance level 0.20211 1
table 4.8 correlation test
As per table 4.8, the correlation test states there is a positive correlation between the performance of employees and the
machine. However as it falls within the category of “0” to “0.5”, it can be viewed as a positive weak relationship.
methods
Five questions were included in the questionnaire concerning the Standard Work Sheet (STW) through which the sewing method is passed to the team members. Respondents were asked to rate their responses with regard to questions such as whether STWs are readily available when required, whether they can be understood, their completeness, their practicability etc.

78
Social Affairs. Vol.1 No.2, 59-94, Spring 2015
methods strongly disagree
disagree N e i t h e r agree nor disagree
Agree strongly Agree
Questions N % N % N % N % N %
Q1 9 14% 14 22% 10 16% 26 41% 5 8%
Q2 6 9% 22 34% 6 9% 26 41% 4 6%
Q3 3 5% 15 23% 14 22% 26 41% 6 9%
Q4 6 9% 16 25% 19 30% 17 27% 4 6%
Q5 4 6% 25 39% 14 22% 17 27% 4 6%
9% 29% 20% 35% 7%
table 4.9 summary of methods
methods vs perFormANce
Figure 4.9 Feedback percentage of methods

Social Affairs. Vol.1 No.2, 59-94, Spring 2015
79
perFormANce level
Figure 4.10 scatter diagram of methods
There is a positive relationship between performance and methods as per the trend line drawn in the scatter diagram (Figure 4.10).
mean of methods performance level
mean of methods 1
performance level 0.331875 1
table 4.10 correlation test
Correlation value is between “0” to “0.5”. Therefore, there is a positive weak relationship as it falls below “0.5” and above “0”.
sKIll level oF the teAm members
Five questions in the questionnaire talked about the management’s commitment towards addressing the needs of team members and decision-making in that regard. Team member terminology was used in order to obtain the most accurate possible feedback.

80
Social Affairs. Vol.1 No.2, 59-94, Spring 2015
methods strongly disagree
disagree N e i t h e r agree nor disagree
Agree strongly Agree
Questions N % N % N % N % N %
Q1 0 0% 10 16% 12 19% 37 58% 5 8%
Q2 0 0% 14 22% 13 20% 30 47% 7 11%
Q3 0 0% 17 27% 10 16% 31 48% 6 9%
Q4 2 3% 11 17% 15 23% 29 45% 7 11%
Q5 2 3% 7 11% 10 16% 34 53% 11 17%
1% 18% 19% 50% 11%
table 4.11 summary of skill related questions
sKIll level
Figure 4.11 summary of skill related questions

Social Affairs. Vol.1 No.2, 59-94, Spring 2015
81
sKIll level vs perFormANce
Figure 4.12 skill level vs performance
mean performance
mean of skill level 1
performance 0.20215 1
table 4.12 correlation test
In accordance with the slope and the correlation results, there is a positive relationship between the skill level and performance of the employees. The correlation result falls between “0” to “0.5”.
FINANcIAl INceNtIves
This set of questions focussed on the production incentive scheme existing at present. The effectiveness of the existing incentive scheme provides motivation and questions were designed in order to get feedback on how the respondents felt about the relevance of the present incentive scheme in relation to the present production style of the plant, whether changes are required to make it more effective, their understanding of the incentive scheme and whether
the production targets are realistic and achievable etc.

82
Social Affairs. Vol.1 No.2, 59-94, Spring 2015
methods strongly disagree
disagree N e i t h e r agree nor disagree
Agree st rong ly Agree
Questions N % N % N % N % N %
Q1 10 16% 40 63% 8 13% 2 3% 4 6%
Q2 5 8% 45 70% 4 6% 6 9% 4 6%
Q3 1 2% 8 13% 17 27% 29 45% 9 14%
Q4 0 0% 3 5% 9 14% 34 53% 18 28%
Q5 2 3% 4 6% 8 13% 32 50% 18 28%
6% 31% 14% 32% 17%
Table 4.13 Summary of financial incentives.
FINANcIAl INceNtIves
Figure 4.13 Summary of financial incentives

Social Affairs. Vol.1 No.2, 59-94, Spring 2015
83
FINANcIAl INceNtIve vs perFormANce
Figure 4.14 Financial incentive vs performance
mean performance
mean of Fin Incentives 1
performance 0.513998 1
table 4.14 correlation test
The slope of the scatter diagram (Figure 4.14) shows a positive relationship between financial incentive and employee performance, and also as per the correlation test there is a moderate positive relationship between these two.
leAdershIp prActIces
The present business context strongly illustrates that leadership practices can make a significant impact on the performance of employees. Hence there were 5 questions relating to best leadership practices included in the questionnaire. Questions relating to how respectfully the leadership team treats team members, how considerate they are of one’s dignity, whether the management
make decisions based on practicability and not just opinions, whether they respect others’ ideas irrespective of the designation, and whether they probe into the ‘why’ of a situation instead of ‘who’ were asked.

84
Social Affairs. Vol.1 No.2, 59-94, Spring 2015
methods strongly disagree
disagree N e i t h e r agree nor disagree
Agree st rong ly Agree
Questions N % N % N % N % N %
Q1 1 2% 5 8% 8 13% 44 69% 5 8%
Q2 0 0% 7 11% 9 14% 44 69% 4 6%
Q3 1 2% 7 11% 7 11% 44 69% 5 8%
Q4 1 2% 6 9% 12 19% 40 63% 5 8%
Q5 0 0% 3 5% 13 20% 38 59% 10 16%
1% 9% 15% 66% 9%
table 4.15 summary of leadership practices
leAdershIp prActIces
Figure 4.14 leadership practice vs performance

Social Affairs. Vol.1 No.2, 59-94, Spring 2015
85
leAdershIp prActIces vs perFormANce
Figure 4.15 leadership practice vs performance
mean of leadership practices
performance
mean of leadership practices
1
performance 0.02884 1
table 4.16correlation test
There is no significant slope of the scatter diagram on leadership practices and there is only a little difference with the ‘X’ axis. Even in the correlation test, it resulted 0.02884 and as a percentage it’s only almost 3%.
WorKING coNdItIoNs
The garment sector is being continuously demanded to improve workplace conditions by buyers as well as local and international governing bodies. Reflecting this development, questions in relation to productive working hours, welfare facilities, illumination and ventilation, safe atmosphere, and level of organisation were asked.

86
Social Affairs. Vol.1 No.2, 59-94, Spring 2015
methods strongly disagree
disagree N e i t h e r agree nor disagree
Agree s t r o n g l y Agree
Questions N % N % N % N % N %
Q1 0 0% 14 22% 2 3% 43 67% 5 8%
Q2 0 0% 4 6% 7 11% 44 69% 9 14%
Q3 0 0% 4 6% 5 8% 47 73% 8 13%
Q4 0 0% 2 3% 7 11% 49 77% 6 9%
Q5 0 0% 0 0% 0 0% 52 81% 12 19%
0% 8% 7% 73% 13%
Table 4.17Summary of working conditions
WorKING coNdItIoNs
Figure 4.16 Summary of working conditions
Social Affairs. Vol.1 No.2, 59-94, Spring 2015
87
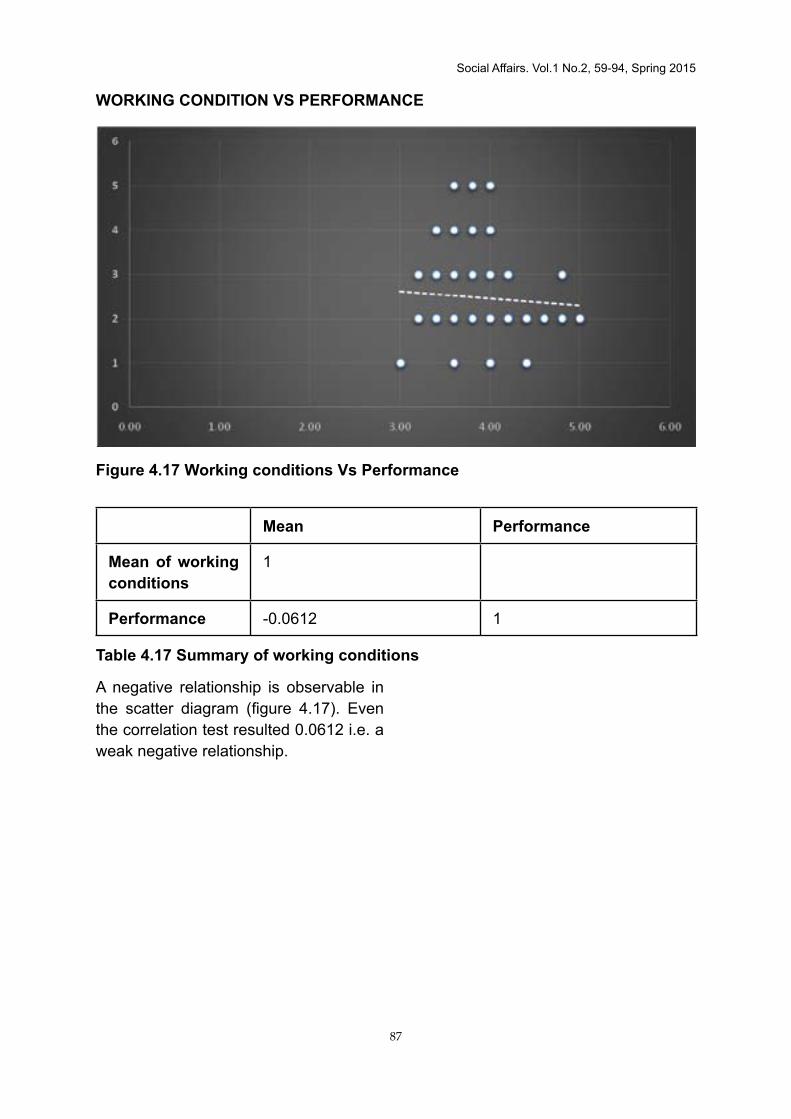
WorKING coNdItIoN vs perFormANce
Figure 4.17 Working conditions vs performance
mean performance
Mean of working conditions
1
performance -0.0612 1
Table 4.17 Summary of working conditions
A negative relationship is observable in the scatter diagram (figure 4.17). Even the correlation test resulted 0.0612 i.e. a weak negative relationship.

88
Social Affairs. Vol.1 No.2, 59-94, Spring 2015
ANAlysIs oF hypotheses
Independent variable
Correlation test results against Performance
Interpretation Impact of results towards performance
-0.8 to -0.1
-0.5 to -0.2
-0.2 to 0
0 0 to 0.5
0.5 to 0.8
0.8 to 1
Machine 0.20 Weak positive
Methods 0.33 Weak positive
Skill level 0.20 Weak positive
Financial Incentives
0.51 Moderate positive
Leadership practices
0.03 Weak positive
Working conditions
-0.06 Weak negative
table 4.18 summary of results
relAtIoNshIp betWeeN INdepeNdeNt vArIAbles ANd uNderperFormANce
Figure 4.18 Relationship between variables and underperformance

Social Affairs. Vol.1 No.2, 59-94, Spring 2015
89
Correlation results vary from -1>0>1.
The relationship is dependent on the results. Any value between -1 and 0 signals a negative relationship, whereas a strong negative relationship is indicated by any value up to -0.8. Moderate negative will be any value up to -0.5 and weak negative any value between -0.5 to 0. On the positive side, 0-0.5 is weak positive, 0.5-0.8 moderate positive and up to 1 strong positive relationship.
The analysis of the hypotheses presented in graph form above reveals that all the null hypotheses except for the ‘e’ hypothesis (working conditions do not relate to the performance of team members) are disproved. Conversely, the alternative hypotheses except for the ‘e’ hypothesis (working conditions are related to the performance of team members) are proved.
In sum,
H0
a. Methods and machinery do not relate to the performance level of the team members
b. Skill level of the team members do not relate to the performance level of team members.
c. Financial incentives do not relate to performance of the team members.
d. Leadership practices of supervisory staff and management do not relate to the performance level of team members.
e. Working conditions do not relate to the performance of the team members.
H1
a. Methods and machinery relate to the performance of the team members
b. Skill level of the team members relates to the performance of the team members
c. Financial incentives of the team members relate to the performance of the team members.
d. Leadership practices of supervisory associates and management relate to the performance of team members
e. Working conditions relate to the performance of the team members.
coNclusIoN
The most difficult challenge that manufacturers face is meeting the On-Time-Delivery requirement within the clutches of their managerial constraints. In this light, it is important for them to have guiding recommendations that would enable them to enhance the performance of their employees, which would ultimately benefit the company. Hence studying the factors that influence employee performance is important from a managerial perspective, which was the main focus of this research.
Towards this end, five variables that influence employee performance were identified namely machine and methods,

90
Social Affairs. Vol.1 No.2, 59-94, Spring 2015
skill level, financial incentives, leadership practices and working conditions. In order to test the impact of these variables on the dependent variable, i.e. employee performance, a sample of 64 team members was selected on the stratified random sampling method to represent all team members of the shop floor. All respondents hold the designation of ‘Sewing associates’. The performance level of the employees was identified as the module performance as team members are directly involved in the production process. The overtime work effect reflected in production data was removed when assigning ratings to team members.
Machine and methods was the first variable that was studied. Though there was a positive relationship between machines and performance, it is not very important since correlations show it as 0.02. However, machine pre-setting and changes to machines after line feeding had a mean value of 3 and 2.8 which says that pre-setting is not done properly and changes are done after feeding the lines. As per the responses, other areas should also be improved as results indicate a considerable gap to achieve. For instance, machines were at –3.4, while machine availability and machine layout availability were at –3.1 and-3.6 respectively.
Methods also play a significant role. Presently the method of sewing is communicated to team members with the support of STW and team members are helped by the technical team, supervisors and team leaders. Despite this being the case, there are gaps of understanding and application of such finalised methods. The relationship
between these two has a positive weak correlation of 0.33. ‘Sewing methods changing’ possesses a mean value of 2.8. It means that it has been a common thing to change the method of sewing after the feeding. STW is the sheet which provides instructions for sewing. However, it has a mean value of 2.9, which means that it needs to improve a lot to come to the standard level. Completeness of the STW is exactly at the mid-point (3) where the respondents neither agree nor disagree. STW availability, its simplicity and whether it can be understood just passes point 3.
Skill sewing operators are significant in a shop floor. Therefore, the management needs to take necessary steps to improve and upgrade their sewing skills. The five questions asked in this regard, i.e skill grading measurement, decision making based on skill and cycle time, use of skill matrix, training plan and management concern and commitment received an overall response of almost ‘Agree’ level. This, however, suggests that the management needs to take actions in order to fill the skill gap since the correlation test has given a rate of only 0.20, indicating a weak positive relationship.
On-Time-Delivery of garments finished in line with required quality standards is the target challenge for the management team. Therefore, various types of incentives have been introduced in order to provide required motivation to team members. Out of these incentives, the production incentive seemed to have the largest and most direct impact. A correlation test figure of 0.51says that the production incentive is more vital and important than other variables tested

Social Affairs. Vol.1 No.2, 59-94, Spring 2015
91
earlier. The questions as to whether the existing incentive scheme matches with the present production model and whether any changes are required for the existing incentive scheme rated mean values of 2.21 and 2.35 respectively, whereas the mean value for the other three questions were above 4 and/or almost 4. Therefore, the management needs to make necessary amendments to the existing incentive scheme to make it more attractive.
Five questions were asked in order to study the relationship between leadership practices and employee performance, and all five recorded mean values above 3 with some cases recording almost 4. The correlation test recorded 0.03 which is indicative of a weak positive relationship. It means that there still is a gap to be filled in terms of leadership practices.
The five questions concerning working conditions touched on productive work hours, welfare facilities, illumination and ventilation, well-organised work place and the management’s concern about creating a safe work place, all of which recorded a mean value of almost 4 and sometimes even 4.The correlation test provides a weak negative relationship of -0.06. Though there is a negative relationship, the mean value says that the organization is in the process of creating a better work place.
In sum, it was discovered that methods and machinery, employee skills, financial incentives, and leadership practices relate to employee performance, while working conditions do not.
Since this study only focused on BASL Intimate Apparel Mirigama, the situation in other apparel facilities was not taken
into consideration when arriving at conclusions. Hence the conclusions may not widely apply. Further, this study only concentrated on the impact of five factors on employee performance, but there are lots of untouched areas for other researchers to research. Also managerial presence may have resulted in inaccurate data being reported.
recommeNdAtIoNs
1. Machines and methods are one of the major factors that determine the performance of the production line or a module to a great extend. There are some machines with specific capabilities and new technology whereas some not. Therefore, instead of only defining the method of sewing, it is important to define both machine and method at the preproduction meeting where all the technical aspects of the style are discussed and finalised.
2. Mechanics of the line and the pilot zone where the machine pre-setting is done should get involved in the pre-production meeting in order to come up with solutions that would effectively avoid any changes that may arise after line feeding.
3. The work on incentives revealed an important insight: Employees are more sensitive to the incentives that they receive based on hourly production targets rather than monthly incentives. Therefore the management needs to study the existing incentive scheme and rectify any issues prevalent in it in order to provide required motivation to team members. Otherwise, unaddressed

92
Social Affairs. Vol.1 No.2, 59-94, Spring 2015
issues may lead to negative impacts that the organization does not expect to happen.
4. It is recommended to have a training plan which acts as a means of enhancing people skills such as non-discrimination, customer care, and other core values of the company, especially on the part of team leaders. The disposition of leaders towards their members will necessarily influence the latter’s performance. For instance, if a supervisor is interested only in the ‘why’ of a mistake rather than ‘who’, and takes corrective action without pinning the blame personally on a member, team members will likely start relating to their leader’s need to arrive at a solution that is not based on personal opinions. Such thought would definitely create a positive impression towards team leaders whilst motivating the team members.
5. It is a great challenge for organizations to create better and safer work places. Safe and well-organised workplaces contribute to improved performance of employees. Though measures are being taken to create a safe and better work place, safety is all about learning continuously. Therefore it is recommended to have processes and procedures in place to continue the safety network and constantly upgrade it.
reFereNces
Bourke, A. (2011). Management of underperformance FAQs. Retrieved from www.port.au.uk:http://www.port.ac.uk/accesstoinformation/
p o l i c i e s / h u m a n r e s o u r c e s /filetodownload,123159,en.pdf
Bryson, A., R. Freeman, C. Lucifora, M. Pellizari, and V. Perotin (February 2011). Paying for Performance: Incentive Pay Schemes and Employees’ Financial Participation. Paper presented at the Annual Fondazione Rodolfo De Benedetti Conference: Cagliari, Italy. London: London School of Economics. Retrieved from http://cep.lse.ac.uk/conference_papers/26_05_2011/pellizzari.pdf.
Cherry, K. (n.d.). What is the Difference between Extrinsic and Intrinsic Motivation? Retrieved from http://psychology.about.com/od/motivation/f/difference-between-extrinsic-and-intrinsic-motivation.htm
Gill, S. (2013, December 3). How to identify and manage underperformance [web blog message]. Retrieved from http://www.plushr.com/how- to- ident i fy -and-manage-underperformance/
Golden, L. (2012). The Effects of Working Time on Productivity and Firm performance: A Research Synthesis Paper. Conditions of Work and Employment Branch of the International Labour Office. Retrieved from http://www. i lo .o rg /wcmsp5/g roups /public/---ed_protect/---protrav/---travail/documents/publication/wcms_187307.pdf
Haycroft Workplace Solutions. (2012 November). Bets Practice Guide to: Performance Management.

Social Affairs. Vol.1 No.2, 59-94, Spring 2015
93
Retrieved from http://haycroft .com.au/si tes/default /f i les/121109%20Managing%20U n d e r p e r f o r m a n c e % 2 0% 2 0 % 2 8 r e b r a n d e d % 2 0050411%29%20ver3.pdf
Herzberg, F. (2003). One More time: How Do You Motivate Employees? Retrieved from https://hbr.org/2003/01/one-more-time-how-do-you-motivate-employees
International Labour Office. (2004). Working Time and Productivity. Retrieved from http://www.ilo.o r g / w c m s p 5 / g r o u p s / p u b l i c / -- - e d _ p r o t e c t / - - - p r o t r a v / - - -travai l /documents/publ icat ion/wcms_170702.pdf
International Labour Organization. (2009). World Day for Safety and Health at Work 2009: Facts on Safety and Health at Work. Retrieved from http://www.ilo.org /wcmsp5/groups/pub l ic /@dgreports/@dcomm/documents/publication/wcms_105146.pdf
International labour Organization. (2011). A Skilled Workforce for a Strong, Sustainable and Balanced Growth: AG20 Training Strategy. Retrieved from http://www.oecd.org/g20/meetings/toronto/G20-Skills-Strategy.pdf
Kamenica, E. (2012). Behavioral Economics and Psychology of Incentives. Annual Review of Economics, 4, pp.13.1-13.26
Kelchner, L. (n.d.). The Advantages of Multi-Skilled Labour. Retrieved from http://smallbusiness.chron.com/advantages-mul t isk i l led-
labor-18280.html
Koening, E. (n.d.). Importance of Employee Welfare. Retrieved from http://smallbusiness.chron.c o m / i m p o r t a n c e - e m p l o y e e -welfare-12998.html
Maccoby, M. (2000). Understanding the Difference between Management and Leadership. Research Technology Management, 43(1), pp.57-59.
Maslow, A.H. (1943). A Theory of Human Motivation. Psychological Review, 50, pp.370-396.
Mayo, E. (1949). Hawthorne and the Western Electric Company. Retrieved from http://www.practicesurvival.com/wa_files/Hawthorne_20Studies_201924_20Elton_20Mayo.pdf
Mills, D.Q. (2005). Leadership: How to Lead, How to Live. Waltham, MA: Mindedge Press.
Oracle Taleo Cloud Service. (2012). Seven Steps for Effective Leadership Development. Retrieved from http://www.oracle.com/us/media1/steps-effective-leadership-dev-1657106.pdf
Sarkar, P. (n.d.). Performance Improvement of the Maintenance Department in the Apparel Industry. Retrieved from http://www.onlineclothingstudy.com/2014/12/p e r f o r m a n c e - i m p r o v e m e n t -maintenance-department.html
Silverman, M. (2004). Non-Financial Recognition – The Most Effective of Rewards? Institute for Employment Studies, Brighton, UK. Retrieved

94
Social Affairs. Vol.1 No.2, 59-94, Spring 2015
from http://www.employment-s t u d i e s . c o . u k / s y s t e m / f i l e s /resources/files/mp4.pdf
Taylor, F. W. (1914). The principles of scientific management. New York: Harper.
Yakowicz, W. (n.d.). How to Motivate an Underperforming Employee? Retrieved from http://www.inc.com/will-yakowicz/how-to-motivate-an-under-performer.html