Embed Size (px)
Citation preview

1
netwealth educational webinar series
October 15, 2015
Strategies for a constantly changing market
Presented by Tracey McNaughton, UBS

Q3 2015
ConfidentialGlobal Asset Management
Tracey McNaughton
Head of Investment Strategy, Australia
Economic and Market Outlook
Ch-ch-ch-changes
3
This slide relates to UBS Balanced Investment Fund, UBS Defensive Investment Fund and UBS Tactical Beta Funds, * Indicates UBS Tactical Beta Fund position only
Source: UBS Global Asset Management.
As at 31 August 2015
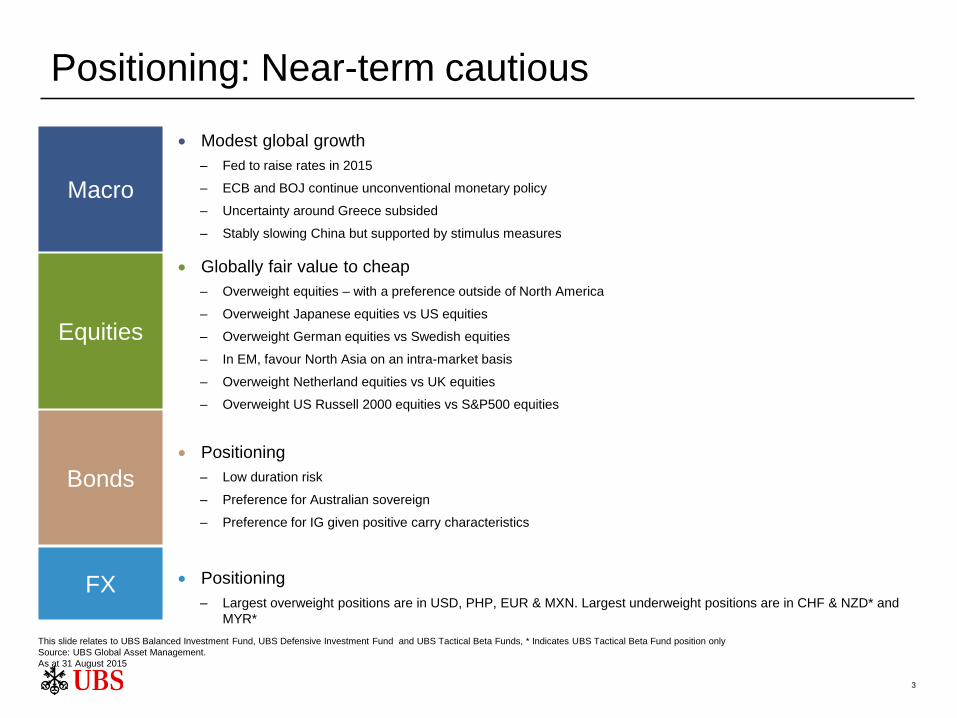
Modest global growth
– Fed to raise rates in 2015
– ECB and BOJ continue unconventional monetary policy
– Uncertainty around Greece subsided
– Stably slowing China but supported by stimulus measures
Globally fair value to cheap
– Overweight equities – with a preference outside of North America
– Overweight Japanese equities vs US equities
– Overweight German equities vs Swedish equities
– In EM, favour North Asia on an intra-market basis
– Overweight Netherland equities vs UK equities
– Overweight US Russell 2000 equities vs S&P500 equities
Positioning
– Low duration risk
– Preference for Australian sovereign
– Preference for IG given positive carry characteristics
Positioning
– Largest overweight positions are in USD, PHP, EUR & MXN. Largest underweight positions are in CHF & NZD* and
MYR*
Positioning: Near-term cautious
Macro
Equities
Bonds
FX

Now what?– Volatility to stay
Source: UBS, Bloomberg
4
US
Rates lift off Dec;
tightening cycle slow
& shallow
2015: 2.3%
2016: 2.7%
EU
Growth improving,
deflation risk easing;
geopolitical risk
2015: 1.8%
2016: 2.0%
China
7% target growth,
inflation low, room to
ease policy further
2015: 6.9%
2016: 6.7%
Japan
Growth helped by
weak yen, inflation
falling
2015: 0.8%
2016: 1.4%
AU
Mining inv down,
exports and housing
strong, unemp falling
2015: 2.5%
2016: 2.9%
UK
Growth driven by
consumption &
investment; rates
steady until early-16
2015: 2.6%
2016: 2.4%

5
Global reflation - central bank policy easing
50 central bank rate cuts thus far in 2015 (some more than once) and many
unexpected
Uzbekistan
Romania
India Egypt
Peru
Turkey
Canada
Eurozone
Pakistan
Singapore
AlbaniaRussia
Australia
China
Switzerland
Denmark
Sweden
Indonesia
Botswana
Israel
China
India
Australia
Poland
South Korea
Serbia
Thailand
NZ
South
KoreaCanada
Australia
China

6
Global reflation
Other central banks are picking up where the Federal Reserve left off
Change in weighted average of central bank interest rates
since August 2007 (2013 current USD GDP weights)
Source: Bloomberg Finance LP, IMF, UBS Global Asset Management
Note: Excluded countries are Russia, Brazil, Venezuela and Nigeria
Change in M1 money supply as % GDP since August 2007
Source: ThomsonReuters DataStream, IMF, UBS Global Asset Management
-2
0
2
4
6
8
10
12
14
16
2007 2008 2009 2010 2011 2012 2013 2014 2015
DM EM World
-5
-4
-3
-2
-1
0
1
2007 2008 2009 2010 2011 2012 2013 2014 2015
DMEMEMex Rus, Bra, Ven, Nig

7
Asset prices experiencing equity reversal
The drop in equities is coinciding, but harshest in China
Yield on 10-year government bonds, %
Source: Thomson Reuters DataStream
Equity market indices relative to pre-crisis peak
Source: Thomson Reuters DataStream

8
Oil prices remain weak
Creates clear winners and losers, and the losers are concentrated
Net oil exports as % of GDP, 2013
Source: ThomsonReuters DataStream, UBS Global Asset Management
-20
-10
0
10
20
30
40
50
60
70
Sin
gapore
Ukra
ine
Mo
rocco
Tha
iland
South
Kore
aH
ung
ary
Ho
ng
Ko
ng
Slo
vakia
Ch
ileS
loven
iaIn
dia
So
uth
Afr
ica
Cze
ch
Rep
ub
licJa
pan
Be
lgiu
mP
hili
ppin
es
Sp
ain
Ge
rma
ny
Po
rtu
gal
Gre
ece
Au
str
iaIr
ela
nd
Ita
lyP
ola
nd
Fra
nce
Ne
w Z
ea
land
Fin
land
Ch
ina
Sw
itze
rla
nd
Sw
ede
nT
urk
ey
US
Indo
ne
sia
Arg
entin
aB
razil
Ne
therla
nd
sA
ustr
alia UK
Eg
ypt
Pe
ruD
enm
ark
Me
xic
oC
an
ad
aG
han
aM
ala
ysia
Co
lom
bia
Ecu
ado
rN
igeria
Ira
nR
ussia
No
rway
Ka
zakh
sta
nA
lgeria
Aze
rbaija
nU
AE
Ve
ne
zu
ela
Ira
qS
aud
i A
rabia
Om
an
An
go
laQ
ata
rK
uw
ait
US-I

9
Less financial system leverage = less growth
8
10
12
14
16
18
20
22
2006 2007 2008 2009 2010 2011 2012 2013 2014
*Average of Citibank, BankAmerica, JPMorgan, Morgan Stanley, Goldman Sachs, Citi
Source: Citibank, BofA, Morgan Stanley, Goldman Sachs, Citi
Average Bank Assets over Equity Ratio*
Lower leverage may increase frequency of events but reduce severity of
movements

Lost in transition
Australia

11Source: Bloomberg, ABS, UBS
Brother, can you spare a dime?
-2
-1
0
1
2
3
4
5
6
7
90 92 93 95 96 98 99 01 02 04 05 07 08 10 11 13 14
%
Australian GDP
QoQ YoY
7
8
9
10
11
12
13
14
88 90 92 94 96 98 00 02 04 06 08 10 12 14
Th
ou
san
ds
Real net national disposable income/capita
2
2.5
3
3.5
4
4.5
00 01 02 03 04 05 06 07 08 09 10 11 12 13 14
Wage Cost Index(yoy%)
1990: Recession we had to have
2002: Resources-led
China boom starts
2008: GFC

12
Source: Bloomberg, ABS, UBS
Weaker dollar is helping to rebalance the economy
50
70
90
110
130
150
170
Dec-11 Aug-12 Apr-13 Dec-13 Aug-14 Apr-15
Iron ore ($US)
0.6
0.7
0.8
0.9
1
1.1
07 08 09 10 11 12 13 14 15
AUD/USD Exchange rate
-62%
-35%

13Source: Bloomberg, ABS, UBS
Business conditions – responding to weaker AUD
-20
-15
-10
-5
0
5
10
15
20
25
00 01 02 04 05 06 08 09 10 12 13 14
NAB Business Conditions Index

From producer to consumer
China

China – growth and inflation easing
Source: Bloomberg, UBS,15
0
2
4
6
8
10
12
14
16
79 84 89 94 99 04 09 14
China: Real GDP(yoy%)
-4
-2
0
2
4
6
8
10
08 09 10 11 12 13 14 15
Consumer Price Index (yoy%)
0.0
5.0
10.0
15.0
20.0
25.0
30.0
05 06 07 08 09 10 11 12 13 14 15
China Li Ke Qiang Index (composite electricity output, rail freight and loan growth)
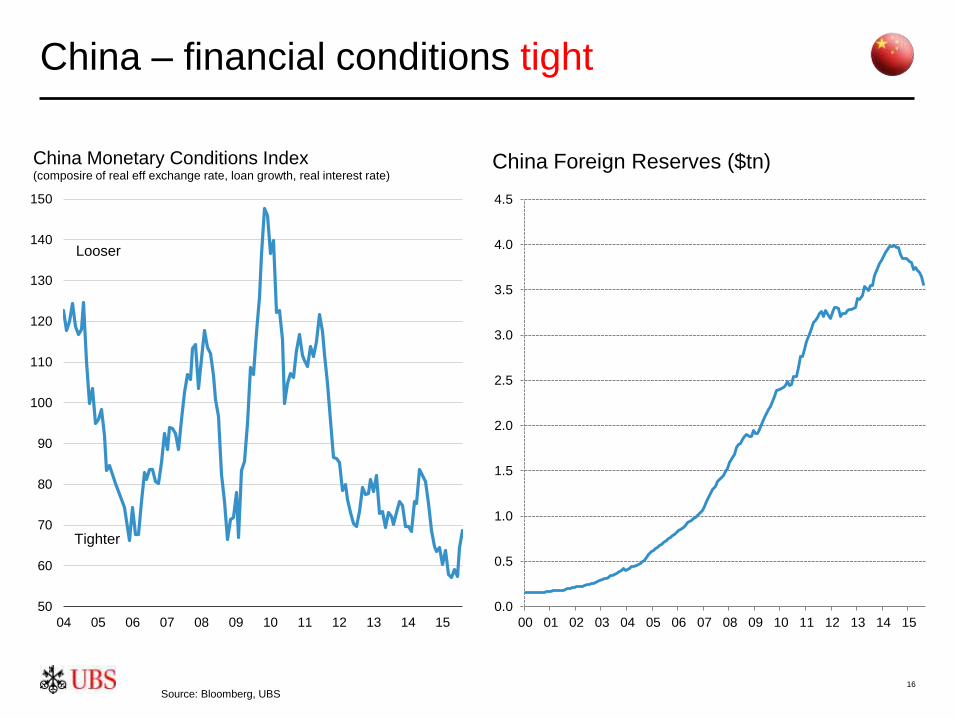
China – financial conditions tight
Source: Bloomberg, UBS16
50
60
70
80
90
100
110
120
130
140
150
04 05 06 07 08 09 10 11 12 13 14 15
China Monetary Conditions Index(composire of real eff exchange rate, loan growth, real interest rate)
Looser
Tighter
0.0
0.5
1.0
1.5
2.0
2.5
3.0
3.5
4.0
4.5
00 01 02 03 04 05 06 07 08 09 10 11 12 13 14 15
China Foreign Reserves ($tn)

17
Real effective exchange rates %
Deviations from 10-year average – CNY significantly overvalued
Source: UBS estimates, Haver
-30%
-20%
-10%
0%
10%
20%
30%
CN
Y
PH
P
CH
F
SG
D
ILS
US
D
TH
B
GB
P
PE
N
KR
W
TW
D
NZ
D
MY
R
IDR
AU
D
CL
P
INR
RO
N
PLN
CZ
K
SE
K
TR
Y
HU
F
MX
N
CA
D
RU
B
EU
R
NO
K
BR
L
ZA
R
CO
P
JP
Y

18
Property prices stabilising; equities not so much
Source: Bloomberg, National Bureau of Statistics, China
0
1,000
2,000
3,000
4,000
5,000
6,000
02 03 04 05 06 07 08 09 10 11 12 13 14 15
China A shares
-8
-6
-4
-2
0
2
4
6
8
10
12
05 06 08 09 10 11 13 14 15
House prices (yoy%)
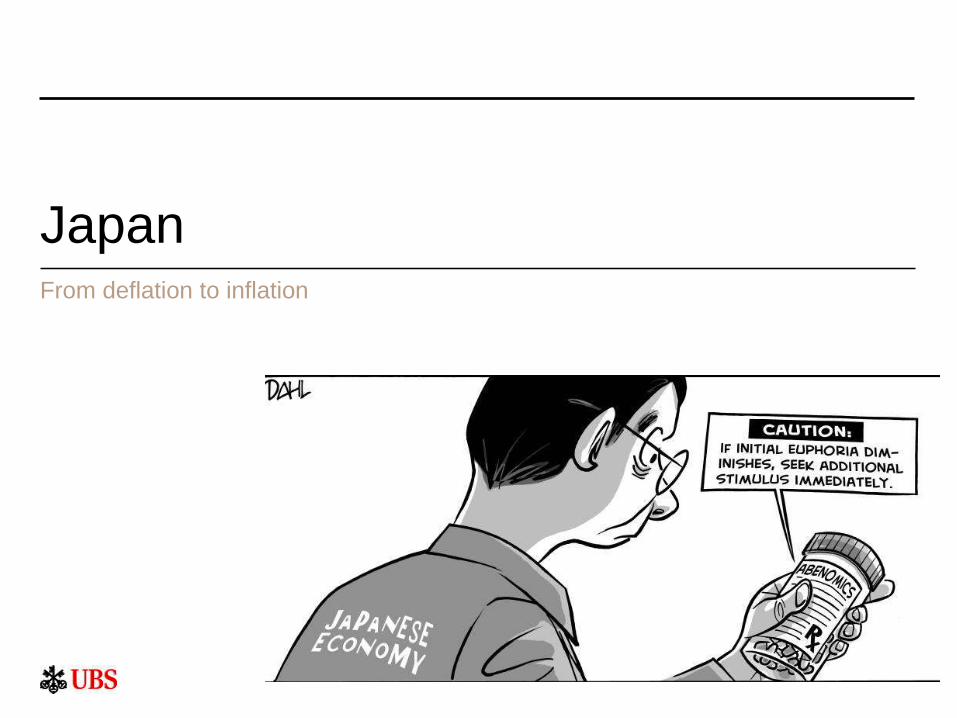
From deflation to inflation
Japan

20
Japanese confidence
Weak JPY makes large firms happy, but small firms and households are still
cautiousNormalised confidence surveys in Japan, standard deviations from the mean
Source: Bank of Japan, Shoko Chukin Bank, Cabinet Office (Japan), UBS Global Asset Management

2121
Japanese QE driving weaker yen
The scale of quantitative easing should not be underestimated
Central bank balance sheets as % of GDP, cumulative
change since Q3 2007
Source: National central banks, IMF, UBS Global Asset Management, data through 4 Nov 2014. Note: ECB projection assumes an addition EUR 1 trillion added to the balance sheet
0
10
20
30
40
50
60
70
80
90
2007 2009 2011 2013 2015 2017
USA Eurozone Japan
US-I
75
85
95
105
115
125
135
Jan-12 Jul-12 Jan-13 Jul-13 Jan-14 Jul-14 Jan-15 Jul-15
USD v Yen

From unconventional to conventional monetary policy
United States

US – quantitative easing has worked
Source: Bloomberg, UBS
23
-6
-4
-2
0
2
4
6
90 92 94 96 98 00 02 04 06 08 10 12 14
US GDP (yoy%)
53.351
57
61.9
67.1
70.768.8
53.1
56 56.458.4
66.1
77.7
82.9
50
55
60
65
70
75
80
85
01 02 03 04 05 06 07 08 09 10 11 12 13 14
US Household Net Worth ($tn)
-20
-15
-10
-5
0
5
10
15
20
01 02 04 05 07 08 10 11 13 14
Case Shiller US House Prices (yoy%)
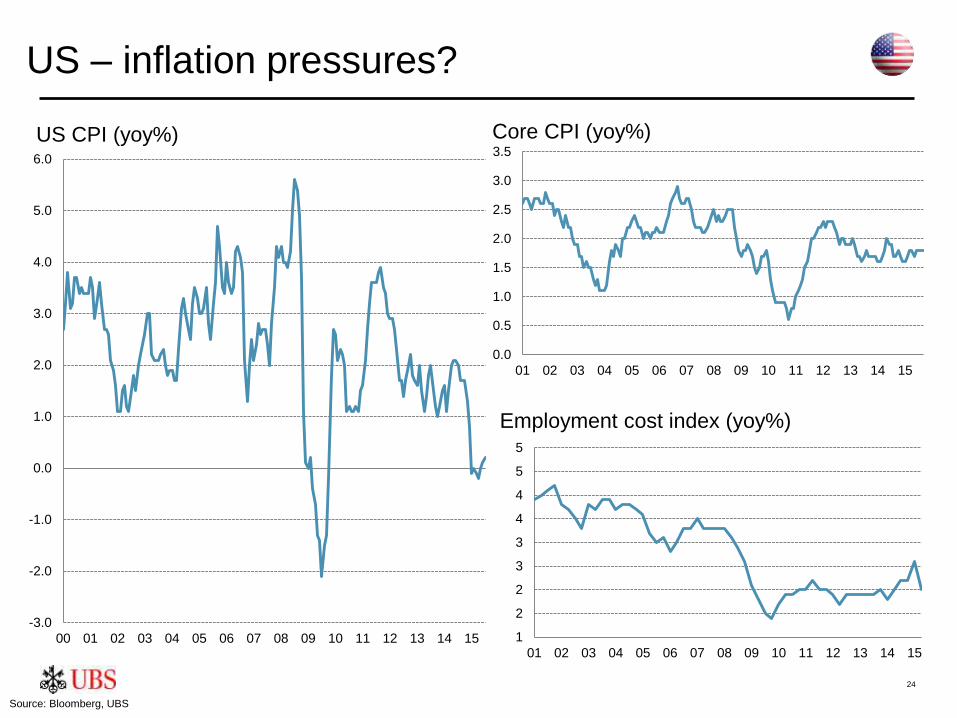
US – inflation pressures?
Source: Bloomberg, UBS
24
1
2
2
3
3
4
4
5
5
01 02 03 04 05 06 07 08 09 10 11 12 13 14 15
Employment cost index (yoy%)
-3.0
-2.0
-1.0
0.0
1.0
2.0
3.0
4.0
5.0
6.0
00 01 02 03 04 05 06 07 08 09 10 11 12 13 14 15
US CPI (yoy%)
0.0
0.5
1.0
1.5
2.0
2.5
3.0
3.5
01 02 03 04 05 06 07 08 09 10 11 12 13 14 15
Core CPI (yoy%)

US – employment growth solid
Source: Bloomberg, UBS
25
4
5
6
7
8
9
10
11
00 01 02 03 04 05 06 07 08 09 10 11 12 13 14 15
US Unemployment rate (%)
-1000
-800
-600
-400
-200
0
200
400
600
91 92 94 95 97 98 00 01 03 04 06 07 09 10 12 13 15
US Non-farm payrolls(%)

From crisis to stability
Europe

27
Europe – recovering
Source: Bloomberg, UBS 27
-6
-4
-2
0
2
4
07 08 09 10 11 12 13 14 15
Europe GDP (yoy%)
-8
-6
-4
-2
0
2
4
6
8
99 01 02 03 04 05 06 08 09 10 11 12 13 15
Core Europe GDP (yoy%)
Germany France Italy
-6
-4
-2
0
2
4
6
8
99 00 01 02 03 04 05 06 07 08 09 10 11 12 13 14
Peripheral Europe GDP (yoy%)
Portugal Spain

28
Europe – lead indicators improving
Source: Bloomberg, UBS28
44
46
48
50
52
54
Sep-12 Mar-13 Sep-13 Mar-14 Sep-14 Mar-15
Eurozone composite PMI (Index)
Services
Manufacturing
Composite
-8
-4
4
8
12
16
03 04 06 07 09 10 12 13 15
Eurozone bank lending - Non-financial corporates (yoy%)
80
85
90
95
100
105
110
115
05 06 08 09 11 12 14 15
IFO Business Expectations (Index)

29
Europe – deflation easing as an issue
Source: Bloomberg, UBS29
-1.0
-0.5
0.0
0.5
1.0
1.5
2.0
2.5
3.0
3.5
4.0
00 01 02 03 04 05 06 07 08 09 10 11 12 13 14 15
Eurozone CPI (yoy%)
1
1.05
1.1
1.15
1.2
1.25
1.3
1.35
1.4
1.45
Jan-12 Jan-13 Jan-14 Jan-15
EUR/USD
0
0.5
1
1.5
2
Jan-12 Nov-12 Sep-13 Jul-14 May-15
German 10 year bond yield (%)

The world is healing but …volatility remains
30

31
Tactical Beta Fund – Conservative
Asset
Allocation
Limits
Strategic
Weights
Tactical
Weights
INCOME ASSETS
Cash 0-30 5.0% 13.6%
Australian Government Bonds
20-90
20.0% 20.5%
International Government
Bonds25.0% -0.1%
Investment Grade Credit 0-40 13.0% 18.3%
High Yield Credit 0-10 4.0% 4.2%
Emerging Market Debt 0-10 3.0% 1.7%
TOTAL 40-90 70.0% 58.2%
GROWTH ASSETS
Property securities 0-10 2.0% 2.0%
Australian Equities 0-30 15.0% 13.2%
International Equities 0-50 13.0% 26.6%
TOTAL 10-60 30.0% 41.8%
Alternative Strategies
Foreign Currency Exposure 0-15 0.0% 0.0%
*May exceed upper limit of this range for extended periods due to market movements
or significant cash flows.
Source: UBS Global Asset Management.
As at 31 August 2015
Portfolio strategy
This Fund aims to provide a total return (after
management costs) in excess of its Neutral
Allocation. Over a full investment cycle
(usually three to five years), this Neutral
Allocation displays performance
characteristics of CPI + 4.5% pa on average.
Access to a broad range of asset classes.
Neutral (average over cycle) asset exposure:
– 70% Income
– 30% Growth
Fund size: $103.4 million
Distributions: Quarterly
Total MER: 0.35% pa

32
Tactical Beta Fund – Balanced
Asset
Allocation
Limits
Strategic
Weights
Tactical
Weights
INCOME ASSETS
Cash 0-30 4.0% 6.6%
Australian Government Bonds
10-70
14.0% 15.1%
International Government
Bonds18.0% -2.3%
Investment Grade Credit 0-35 9.0% 14.8%
High Yield Credit 0-10 3.0% 3.3%
Emerging Market Debt 0-10 2.0% 0.9%
TOTAL 25-75 50.0% 38.4%
GROWTH ASSETS
Property securities 0-13 4.0% 4.0%
Australian Equities 8-45 23.0% 21.1%
International Equities 8-60 23.0% 36.5%
TOTAL 25-75 50.0% 61.6%
Alternative Strategies 0-10 0.0% 0.0%
Foreign Currency Exposure 0-25 0.0% 0.0%
*May exceed upper limit of this range for extended periods due to market movements
or significant cash flows.
Source: UBS Global Asset Management.
As at 31 August 2015
Portfolio strategy
This Fund aims to provide a total return (after
management costs) in excess of its Neutral
Allocation. Over a full investment cycle
(usually three to five years), this Neutral
Allocation displays performance
characteristics of CPI + 5% pa on average.
Access to a broad range of asset classes.
Neutral (average over cycle) asset exposure:
– 50% Income
– 50% Growth
Fund size: $200.6 million
Distributions: Quarterly
Total MER: 0.35% pa

33
Tactical Beta Fund – Growth
Asset
Allocation
Limits
Strategic
Weights
Tactical
Weights
INCOME ASSETS
Cash 0-30 2.0% 2.3%
Australian Government Bonds
0-50
8.0% 7.4%
International Government
Bonds10.0% -6.1%
Investment Grade Credit 0-30 5.0% 10.2%
High Yield Credit 0-10 3.0% 3.1%
Emerging Market Debt 0-10 2.0% 1.0%
TOTAL 10-60 30.0% 17.9%
GROWTH ASSETS
Property securities 0-15 5.0% 5.0%
Australian Equities 15-60 30.0% 28.4%
International Equities 15-70 35.0% 48.7%
TOTAL 40-90 70.0% 82.1%
Alternative Strategies 0-20 0.0% 0.0%
Foreign Currency Exposure 0-35 0.0% 0.0%
*May exceed upper limit of this range for extended periods due to market movements
or significant cash flows.
Source: UBS Global Asset Management.
As at 31 August 2015
Portfolio strategy
This Fund aims to provide a total return (after
management costs) in excess of its Neutral
Allocation. Over a full investment cycle
(usually three to five years), this Neutral
Allocation displays performance
characteristics of CPI + 6% pa on average.
Access to a broad range of asset classes.
Neutral (average over cycle) asset exposure:
– 30% Income
– 70% Growth
Fund size: $97.6 million
Distributions: Quarterly
Total MER: 0.35% pa

Disclaimer
This presentation and accompanying documents is intended to provide general information only and has been prepared by UBS Global
Asset Management (Australia) Ltd (ABN 31 003 146 290) (AFS Licence No. 222605) without taking into account any particular person’s
objectives, financial situation or needs. Investors should before acting on the information provided in this presentation, consider the
appropriateness of the information having regard to their personal objectives, financial situation or needs.
Any opinions expressed in this material are those of UBS Global Asset Management (Australia) Ltd, a member of the Global Asset
Management division of UBS AG, and are subject to change without notice. Although all information in this presentation and documents
is obtained in good faith from sources believed to be reliable no representation of warranty, express or implied is made as to its
accuracy or completeness. Neither UBS AG nor any of its affiliates, directors, employees or agents accepts any liability for any loss or
damage arising out of the use of all or any part of this material.
The information provided during this presentation must not be relied on to make an investment decision. It is not an offer or
recommendation to acquire an interest in the UBS Managed Investment Funds (UBS Funds) or recommendation to purchase or sell
any particular security. Offers of interests in the UBS Funds are contained in the relevant current Product Disclosure Statement (PDS).
An investment in any of the UBS Funds does not represent deposits or other liabilities of UBS AG or any other member company of the
UBS Group. Your investment is subject to investment risk, including possible delays in repayment and loss of income and capital
invested. The repayment of capital or income is not guaranteed by any company in the UBS Group.
Performance can be volatile and future returns can vary from past returns. Up-to-date performance information can be obtained by
contacting UBS Global Asset Management (Australia) Ltd. A copy of the PDS is available from UBS Global Asset Management
(Australia) Ltd, the issuer of the UBS Funds, on (02) 9324 3222 or freecall on 1800 023 043. You should consider that PDS and obtain
professional advice before making any decision about whether to acquire or continue to hold an investment in the Fund(s).
This document may not be reproduced or copies circulated without prior authority from UBS Global Asset Management (Australia) Ltd.
© UBS 2011. The key symbol and UBS are among the registered and unregistered trademarks of UBS. All rights reserved.

35
DISCLAIMER
FOR FINANCIAL ADVISER USE ONLY
This information has been prepared and issued by netwealth Investments
Limited (“netwealth”), ABN 85 090 569 109, AFSL 230975, ARSN 604 930
252 for the general information of its advisor clients only. It is a general
summary only and contains opinions on some publically released
information and is not advice.
While care has been taken in the preparation of this information (using
sources believed to be reliable and accurate), netwealth does not warrant or
represent that the information is accurate, complete or current. netwealth,
any other member of the netwealth group of companies, their officers,
employees or representatives will not be liable for any loss or damage
suffered by any person arising from reliance on any of this information.
Anyone proposing to rely on or use the information should first obtain
appropriate independent professional advice.