Embed Size (px)
Citation preview

13 April 2013

National Institute of Management, Islamabad
15th Midcareer Management Course
“Rise in Fuel Price and its Repercussions”
• Presented By: Muhammad Shahid Dayo (ExCadre) • Sponsor DS: Raja Afshain Afzal
13 April 2013 2

Sequence of Presentation Statement of Problem Introduction Issues & Challenges Analysis Conclusion Recommendation Thanks/Q&A
13 April 2013 3

Statement of Problem Since last one decade, Pakistan’s economy has
witnessed a persistently upward trend in fuel prices. To understand the severity of problem it is envisaged to identify and analyze issues and challenges of rising fuel prices and their socio-economic repercussions.
Based on the analysis, policy recommendations
will be offered to solve and/or to mitigate the problem.
13 April 2013 4

Introduction (Cont’d) Fuels
Chemical Nuclear fuels
13 April 2013 5
Primary (Natural) Secondary (Artificial)
Solid fuels wood, coal, peat, dung coke, charcoal
Liquid fuels petroleum diesel, gasolines, kerosene, LPG, coal tar, naphtha, ethanol
Gaseous fuels Natural gas hydrogen, propane, coal gas, water gas, blast furnace gas, CNG

Introduction Legal Framework Policy making by Federal Government Petroleum Policies by Ministry of P&NR.
Policy Administration by OGRA under OGRA Ordinance 2002 Pricing of petroleum including petroleum surcharge
and petroleum levy under Petroleum Products (Petroleum Development Levy) Ordinance, 1961
Price administration under Section 6 of OGRA Ordinance
13 April 2013 6

Issues & Challenges (Cont’d) Supply & Demand Imbalances Low oil reserves Low exploration Low refining capacity Low production Huge consumption
Greater dependence on oil imports High vulnerability to world oil price shocks High domestic prices
13 April 2013 7

Issues & Challenges (Cont’d) Oil a Major Source of Energy High share of oil in energy mix Escalating power generation cost Rising price of electricity Tough times for major engines of economy;
Industry Transport Agriculture
13 April 2013 8

Issues & Challenges (Cont’d) Oil Fueled Depreciation & Ineffective Monetary Policy
High import bill Pressure of forex reserves Decline in rupee dollar parity Oil fueled inflation limits effectiveness of monetary policy
Agriculture Rising cost of operating agricultural tube wells Transporting agricultural produce becoming expensive Rising cost
electricity/seed/implements/machinery/fertilizer. Agricultural imports flooding local market
13 April 2013 9

Issues & Challenges (Cont’d) Trade Increase in cost of industrial and agricultural
production driving export prices up Decline in demand for exports Competing countries capturing our export markets Imports outstrip exports in both volume and value Failure to compete in High Value Exports Chronic Trade deficits Unfavorable Terms of trade Dwindling forex reserves
13 April 2013 10

Issues & Challenges (Cont’d) Industry Increase in primary input costs Low profitability Dismal BMR investments by textile-the backbone Low value addition Low demand for exports Industries operate below capacity Low demand for Industrial credit hampers capacity
utilization/expansion Industrial output stagnates/declines
13 April 2013 11
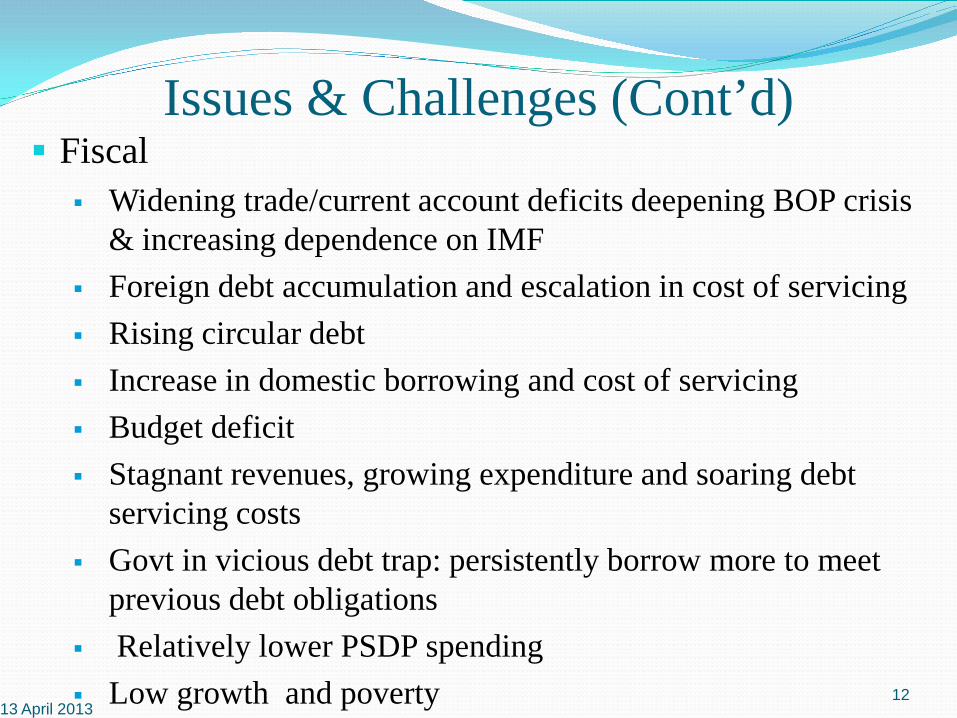
Issues & Challenges (Cont’d) Fiscal
Widening trade/current account deficits deepening BOP crisis & increasing dependence on IMF
Foreign debt accumulation and escalation in cost of servicing Rising circular debt Increase in domestic borrowing and cost of servicing Budget deficit Stagnant revenues, growing expenditure and soaring debt
servicing costs Govt in vicious debt trap: persistently borrow more to meet
previous debt obligations Relatively lower PSDP spending Low growth and poverty
13 April 2013
12

Issues & Challenges (Cont’d) Employment Idle industrial capacity impedes employment
generation Industries losing export markets to other countries Factory workers face layoffs causing unemployment
Fragile Investment Climate Investors avoiding exposure to long term investment
Low growth in LSM Dried up FDI
Growing Speculative Activities Booming bourses 13 April 2013 13

Issues & Challenges Growing social unrest Widespread protests Rampant Crime Violent tendencies Growing corruption
High political uncertainty State’s orientation to profiting from fuel price hike Onslaught from judiciary, opposition and media Survival speculation
Economic slump
13 April 2013 14

Analysis (Cont’d)
13 April 2013 15
Proven Oil Reserves 481 mn barrels Oil Production 63,000 barrels/day Oil Consumption 410,000 barrels/day Net Imports 347,000 barrels/day
410000
63000
Oil Demand & Supply Gap (Barrels/day)
Daily Oil Consumption
Daily Oil production
Source: CIA World Fact Book

Analysis (Cont’d)
13 April 2013 16
$31 $41
$56 $66 $72
$100
$62
$79
$95 $94 $107
2002 2004 2006 2008 2010 2012 2014
World Crude Oil Price (US$ per barrel)
Data Source: ww.forecast-chart.com/forecast-crude-oil.html
Analysis (Cont’d)
13 April 2013 17
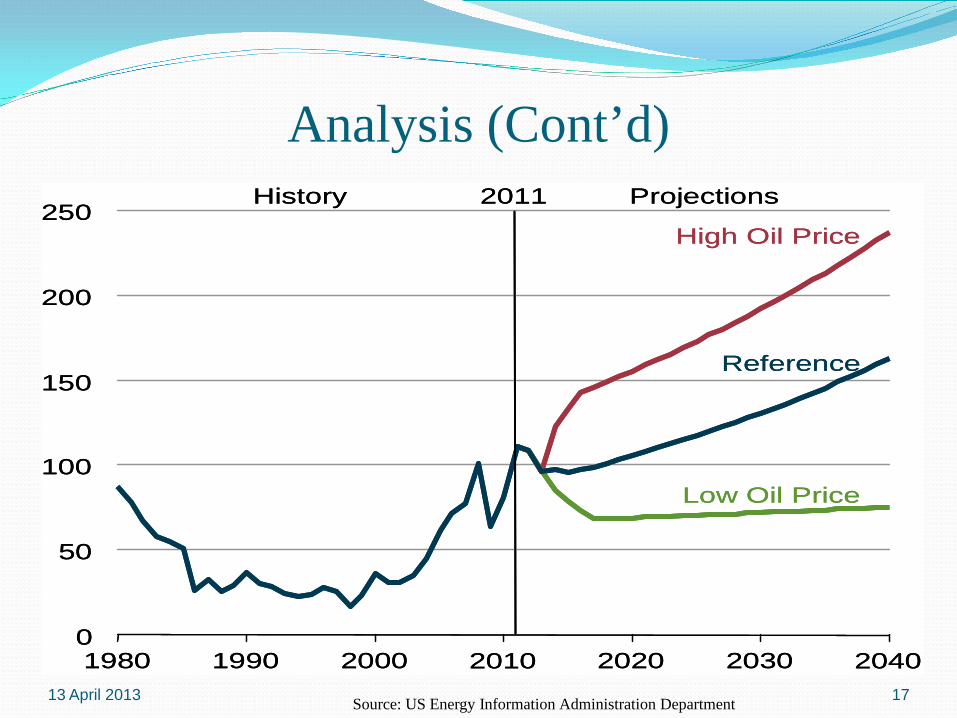
History 2011 Projections
0
50
100
150
200
250
1980 1990 2000 2020 2030 2040
Low Oil Price
Reference
High Oil Price
2010
History 2011 Projections
0
50
100
150
200
250
1980 1990 2000 2020 2030 2040
Low Oil Price
Reference
High Oil Price
2010
Source: US Energy Information Administration Department
Analysis (Cont’d)
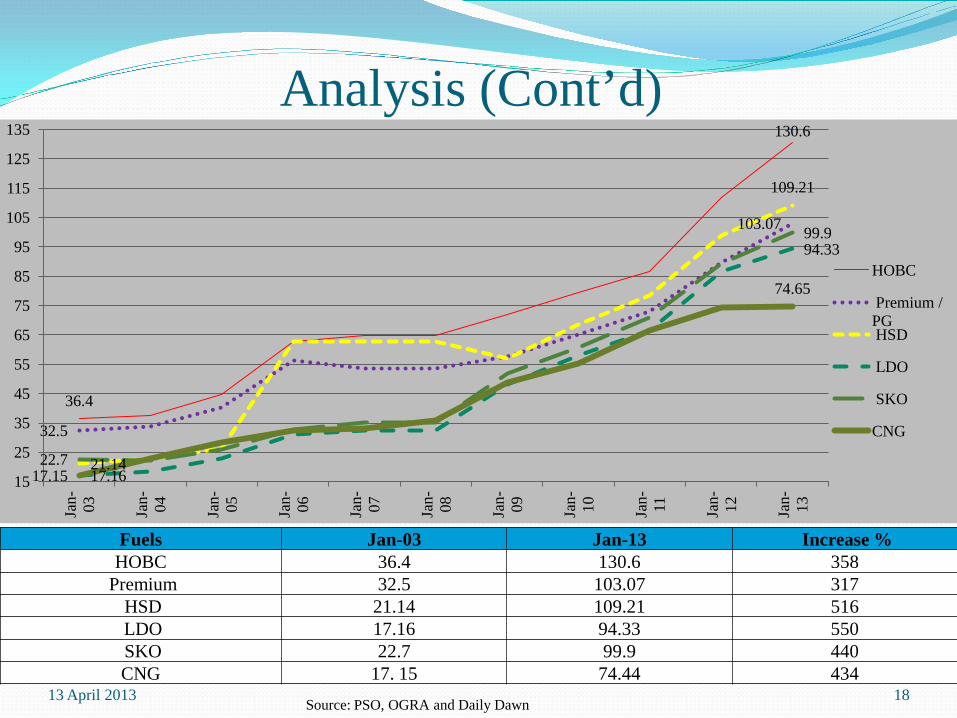
13 April 2013 18 Source: PSO, OGRA and Daily Dawn
36.4
130.6
32.5
103.07
21.14
109.21
17.16
94.33
22.7
99.9
17.15
74.65
15
25
35
45
55
65
75
85
95
105
115
125
135
Jan- 03
Jan- 04
Jan- 05
Jan- 06
Jan- 07
Jan- 08
Jan- 09
Jan- 10
Jan- 11
Jan- 12
Jan- 13
HOBC
Premium / PG HSD
LDO
SKO
CNG
Fuels Jan-03 Jan-13 Increase % HOBC 36.4 130.6 358
Premium 32.5 103.07 317 HSD 21.14 109.21 516 LDO 17.16 94.33 550 SKO 22.7 99.9 440 CNG 17. 15 74.44 434

Analysis (Cont’d)
13 April 2013 19
3240400
12644000
7264700
2935525 2921
868
9008
980
6026
611
1638
457
3185
32
3635
020
1238
089
1297
068
0
2000000
4000000
6000000
8000000
10000000
12000000
14000000
000 Kgs 000 M2 Tonnes Nos.
Cotton Yarn Cotton Cloth Fertilizer Motorcycles
No.
of M
easu
re
Items & Unit of Measure
Extent of Capacity Underutilization Installed Capacity Capacity Utilization Unutilized Capacity
Source: Pakistan Economic Survey 2011-12
Analysis (Cont’d)
13 April 2013 20
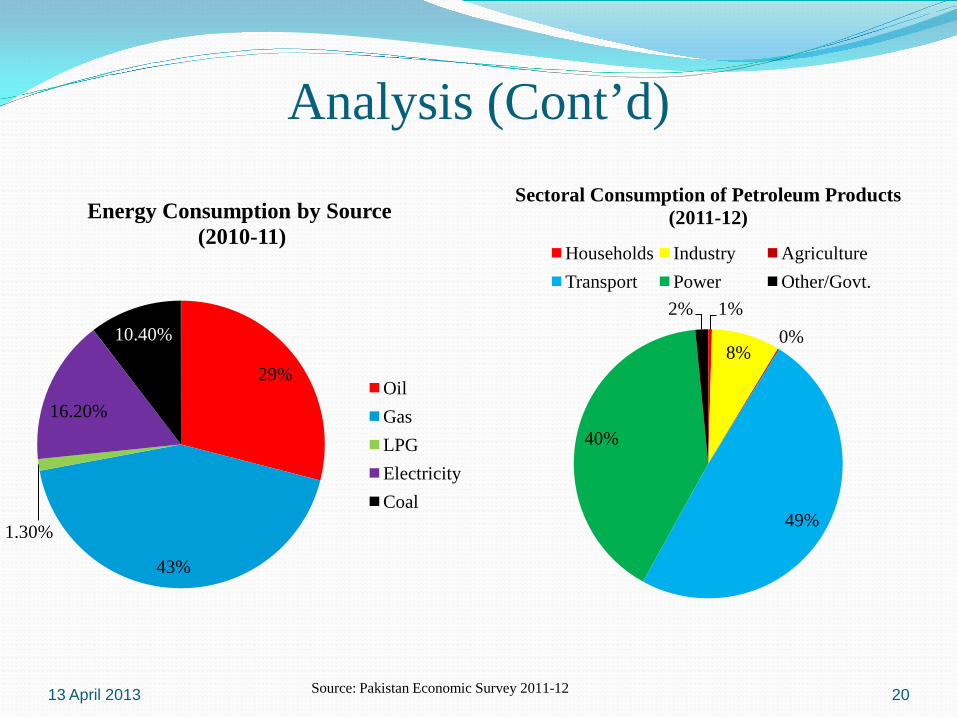
29%
43%
1.30%
16.20%
10.40%
Energy Consumption by Source (2010-11)
Oil Gas LPG Electricity Coal
1%
8% 0%
49%
40%
2%
Sectoral Consumption of Petroleum Products (2011-12)
Households Industry Agriculture Transport Power Other/Govt.
Source: Pakistan Economic Survey 2011-12

Analysis (Cont’d) Crude oil prices as a primary driver up by over 3 times Persistent rise in inflation Decline and stagnation in economic growth
13 April 2013 21
2.9
7.4 9.1 7.9 7.6
20.3
13.7 13.9 12.2
10.1 9
4.8 7.4 7.7 6.2 5.7
1.6 3.6 4.1 3.3 4.1 4.4
0
5
10
15
20
25
2002 2004 2006 2008 2010 2012 2014
Inflation and Economic Growth Rate in Pakistan
inflation Real GDP Growth Rate Source: World Economic Situation & Prospects 2012 , UN

Analysis (Cont’d)
13 April 2013 22
10.8 9.5 10.1
5.5
0
2
4
6
8
10
12
Pakistan India Bangladesh Srilanka
YoY
Incr
ease
Countries
Regional Countries Inflation (2012)
Source: Pakistan Economic Survey 2011-12

Analysis (Cont’d)
13 April 2013 23 Source: Pakistan Economic Survey 2011-12
29 30 25 39 30 31 22 42 24 27 30 37 25 27 40 39
0 50
100 150 200 250 300 350 400 450 500
Pric
e
Item
Essential Item Prices 2002-03 2011-12 Per year Increase %
Analysis (Cont’d)
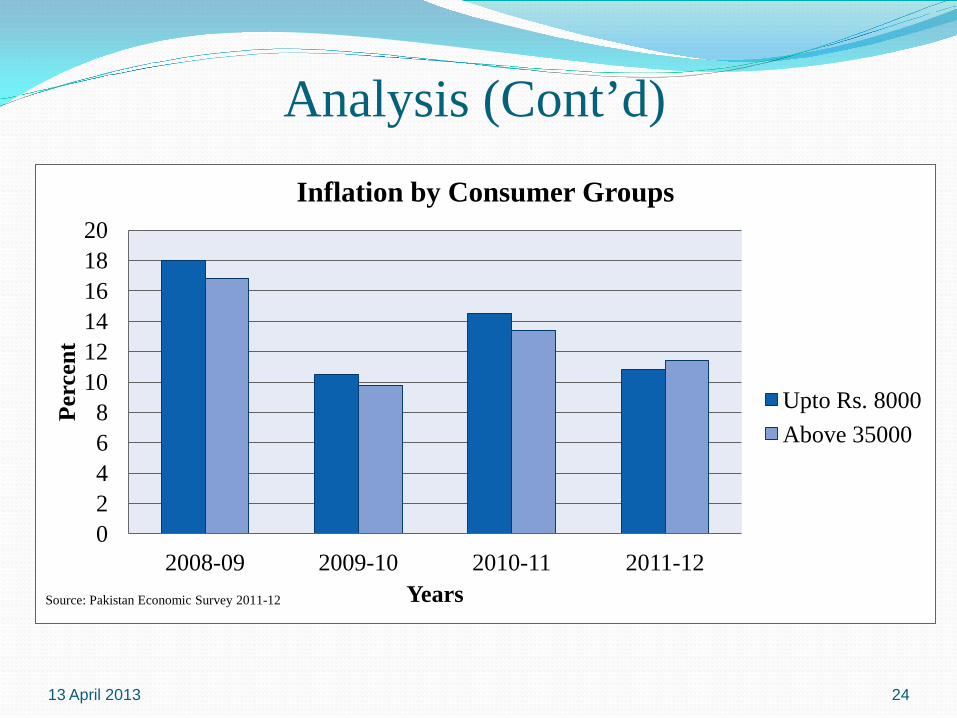
13 April 2013 24
0 2 4 6 8
10 12 14 16 18 20
2008-09 2009-10 2010-11 2011-12
Perc
ent
Years
Inflation by Consumer Groups
Upto Rs. 8000 Above 35000
Source: Pakistan Economic Survey 2011-12

Analysis (Cont’d)
602.39
238.77
699.99
482.50
16.20
102.08
0.00
100.00
200.00
300.00
400.00
500.00
600.00
700.00
800.00
Machinary & Transport equipment
Mfg goods
Rs.
Bill
ion
Growth in Import of Consumer and Capital Goods
2007-08 2011-12 Growth (times)
13 April 2013 25 Data Source: External Trade Statistics, PBS (2011-12)

Analysis (Cont’d)
13 April 2013 26
1196.64
897.88
75.03
2110.61
1487.99
70.50
-4.53
Primary/Semi Manufactured
Manufactured
Mfg Goods a %age of P/S Mfg Goods
Rs. Billion
Growth in Export of Primary & Manufactured Goods
Growth 2011-12 2007-08
Data Source: External Trade Statistics, PBS (2011-12)

Analysis (Cont’d)
13 April 2013 27
602.39 238.77 121.76 364.14
773.20
115.46
699.99
482.50 179.56 637.82
1420.17
228.73
0.00
500.00
1000.00
1500.00
2000.00
2500.00
Machinary & Transport equipment
Mfg goods Food & Live Animals
Chemicals Fuels & Lubricants
Animal/Veg Oils & Fats
Rs.
Bill
ion
Import by Commodity Groups
2007-08 2011-12
Data Source: External Trade Statistics, PBS (2011-12)

Analysis (Cont’d) Another BOB crisis in the making
13 April 2013
import bill repayment Forex Series1 -7.4 -1 7.2
-10 -8 -6 -4 -2 0 2 4 6 8
US$
Bill
ion
BOP Crisis
Sources: SBP’s latest Economic Statistics

Analysis (Cont’d)
13 April 2013 29
0 1
2
3
4
5
6
2007-08
2012-13
5.5
0.525 US$
Bill
ion Dried up FDI
Source: Daily Dawn

Analysis (Cont’d)
13 April 2013 30
0 10 20 30 40 50 60 70 80 90
Price Effect Quantity Effect
%ag
e
Sources of Changes in Petroleum Imports (July-April 2011-12)
Sources: Pakistan Economic Survey 2011-12

Analysis(Cont’d)
13 April 2013 31
85877 9%
834911 91%
1358
No. of Diesel/Electric PoweredTubewells in Pakistan
Electric Diesel Others
Per Hectare Irrigation Cost of Tubewell
Crop Electric powered
Diesel powered
Area cultivated by Tubewell
Electric to Diesel Tubewell ratio
Wheat 815 2150 6/19
million hectares
1:10 Maize 710 2020
Sugarcane 2230 7245
Source: Sarhad J. Agric. Vol. 23, No. 1, 2007
Source: PBS 2011-12 Agri Statistics

Analysis Pakistan Homicide Rate
2000 2001 2002 2003 2004 2005 2006 2007 2008 2009
6.2 6.5 6.2 6.1 6.2 6.1 6.2 6.4 7.2 7.3
13 April 2013 32
NAB Chief revealed corruption of Rs. 10-12 billion a day Fuel hike led price instability and unchecked corruption
being major economic failures of government brought government and judiciary on collision course sparking political uncertainty which further compounded economic problems.
Conclusion Rise in fuel prices has affected economy at both macro and micro
level. The major direct effects at macro level are deteriorating trade balance due to higher import bill, reflecting a worsening terms of trade; and a weakening fiscal balance. At micro level, investment uncertainty results from higher risks of engaging in new projects which slows down economic growth. The major indirect effects are rising inflation which reduces household spending and disrupts long term investment plans due to loss of competitiveness from higher power generation and transport costs, leading to decreased international competitiveness.
Rising trend in fuel prices in our country is driven by international
oil prices, hence unavoidable. However, with a well thought out short-medium-long term strategy focusing on mitigating risks of future increases; achieving energy efficiency and conservation; and diversifying energy mix, enhancing refining capacities, shoring up exploration and production, the problem can be mitigated in the short run and greatly solved in the long run.
13 April 2013 33

Recommendations (Cont’d) Short-medium term strategy The government should move from spot buying to hedge buying
of oil Medium-long term strategy Fuel conservation and Energy efficiency Electricity conservation by offering bulk consumers rebates on
reduced consumption Discouraging fuel guzzling vehicles by banning their
import/taxing heavily Vehicle fitness rules may be enforced to deter old vehicles. Restricting CNG to public transport Phased and targeted conversion of big office buildings
including government to solar power through enabling legislation so as to penalize non compliers.
13 April 2013 34

Recommendations Medium-long term strategy Diversification of energy mix Blending ethanol in petrol Enhancing coal power Duty free import of quality coal for power generation by
industry Enhance exploration/production specially in Baluchistan Providing security to investors Giving guarantees to pay royalty to locals Training, educating and engaging local workers Promoting and incentivizing local investors/ consortium of
overseas Pakistani investors Enhancing refining capacity of existing refineries Regional integration with countries endowed with abundant oil
and gas
13 April 2013 35

Implementation Time Frame
13 April 2013 36
Developing & prioritizing plans to cope with future oil price shocks so as to contain domestic fuel price increases
Short Term Medium Term Long Term
Hedge buying of oil
Energy efficiency/conservation
Diversification; enhancing refining capacity; Increasing exploration & production

13 April 2013 37


![Presentation on toyota_motors[1]](https://img.dokumen.tips/doc/110x75/541293428d7f72314e8b4629/presentation-on-toyotamotors1.jpg)


![Presentation on toyota motors[1]](https://img.dokumen.tips/doc/110x75/55d4df86bb61ebff298b4700/presentation-on-toyota-motors1.jpg)