Embed Size (px)
Citation preview

Positioned for Success Today…
Building for Success Tomorrow
42nd EEI Financial ConferenceNovember 4 – 7, 2007
2
Safe Harbor Statement
Some of the statements contained in today’s presentation are forward-looking statements within the meaning of Section 21E of the Securities Exchange Act of 1934 and are subject to the safe harbor created by the Private Securities Litigation Reform Act of 1995. These statements include all financial projections and any declarations regarding management’s intents, beliefs or current expectations. In some cases, you can identify forward-looking statements by terminology such as “may,” “will,” “should,” “expects,” “plans,” “anticipates,” “believes,”“estimates,” “predicts,” “potential” or “continue” or the negative of such terms or other comparable terminology. Any forward-looking statements are not guarantees of future performance, and actual results could differ materially from those indicated by the forward-looking statements. Forward-looking statements involve estimates, assumptions, known and unknown risks, uncertainties and other factors that may cause actual results, levels of activity, performance or achievements to be materially different from any future results, levels of activity, performance or achievements expressed or implied by such forward-looking statements. Each forward-looking statement speaks only as of the date of the particular statement, and we undertake no obligation to publicly update or revise any forward-looking statement, whether as a result of new information, future events or otherwise. A number of factors could cause actual results or outcomes to differ materially from those indicated by the forward-looking statements contained in this presentation. These factors include, but are not limited to, prevailing governmental policies and regulatory actions affecting the energy industry, including with respect to allowed rates of return, industry and rate structure, acquisition and disposal of assets and facilities, operation and construction of plant facilities, recovery of purchased power expenses, and present or prospective wholesale and retail competition; changes in and compliance with environmental and safety laws and policies; weather conditions; population growth rates and demographic patterns; competition for retail and wholesale customers; general economic conditions, including potential negative impacts resulting from an economic downturn; growth in demand, sales and capacity to fulfill demand; changes in tax rates or policies or in rates of inflation; rules and changes in accounting standards or practices; changes in project costs; unanticipated changes in operating expenses and capital expenditures; the ability to obtain funding in the capital markets on favorable terms; restrictions imposed by Federal and/or state regulatory commissions, PJM and other regional transmission organizations (NY ISO, ISO New England), the North American Electric Reliability Council and other applicable electric reliability organizations; legal and administrative proceedings (whether civil or criminal) and settlements that affect our business and profitability; pace of entry into new markets; volatility in market demand and prices for energy, capacity and fuel; interest rate fluctuations and credit market concerns; and effects of geopolitical events, including the threat of domestic terrorism. Readers are referred to the most recent reports filed with the Securities and Exchange Commission.
3
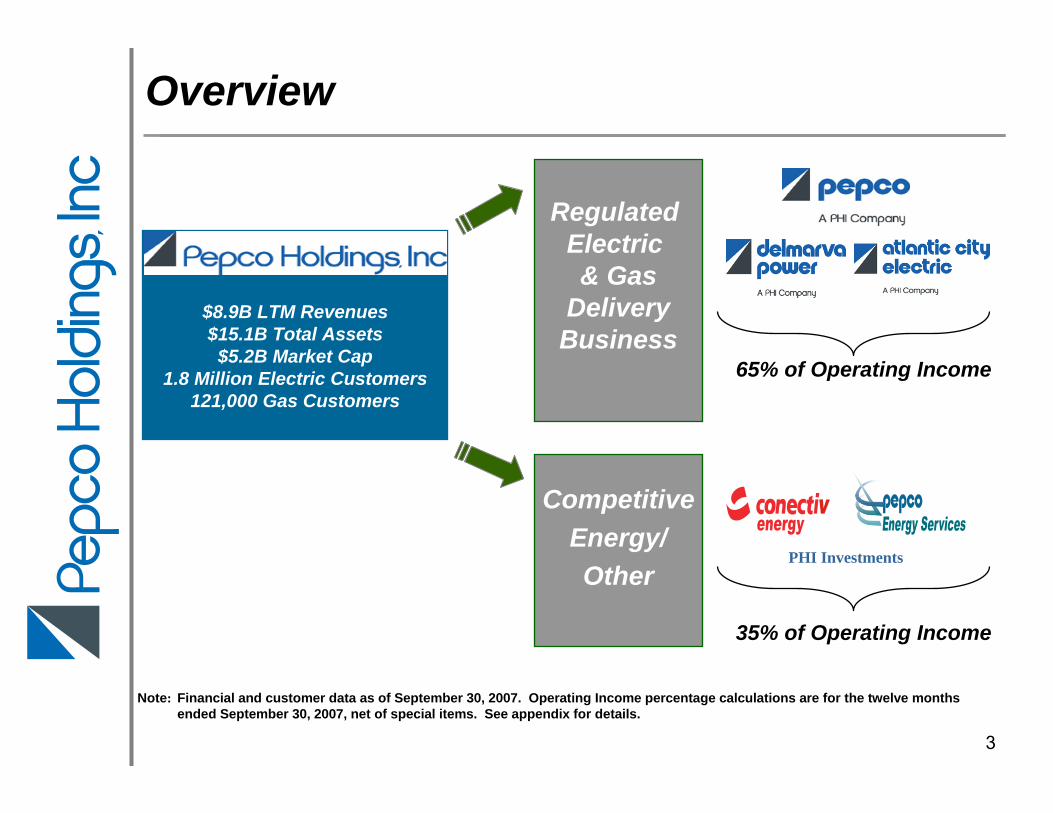
Overview
$8.9B LTM Revenues $15.1B Total Assets$5.2B Market Cap
1.8 Million Electric Customers121,000 Gas Customers
Regulated Electric & Gas
DeliveryBusiness
Regulated Electric & GasDeliveryBusiness
CompetitiveEnergy/Other
65% of Operating Income
35% of Operating Income
Financial and customer data as of September 30, 2007. Operating Income percentage calculations are for the twelve months ended September 30, 2007, net of special items. See appendix for details.
PHI Investments
Note:

4
Total Return – 2004 through YTD 2007
Source: Thomson Financial – data shown through October 26, 2007
Pepco Holdings Total Shareholder Return vs. S&P 400 MidCap Electrics and S&P 500
80
90
100
110
120
130
140
150
160
170
180
19012
/31/03
2/29/0
44/3
0/04
6/30/0
48/3
1/04
10/31
/0412
/31/04
2/28/0
54/3
0/05
6/30/0
58/3
1/05
10/31
/0512
/31/05
2/28/
064/3
0/06
6/30/0
68/3
1/06
10/31
/0612
/31/06
2/28/0
74/3
0/07
6/30/0
78/3
1/07
Tota
l Sha
reho
lder
Ret
urn
(Inde
xed
to 1
00 a
t 12/
31/0
3)
POM (+68.70%) S&P 400 MidCap Electrics (+47.23%) S&P 500 (+47.95%)

5
● Higher utility infrastructure investments (T&D)
– Implementation of MAPP and Blueprint
● Constructive rate case outcomes
● Stable service territory with organic growth
● Continued robustness of the PJM wholesale energy and capacity markets (Conectiv Energy)
● Continued C&I load growth and measured expansion (Pepco Energy Services)
Drivers of Growth
Note: See Safe Harbor Statement at the beginning of today’s presentation.
6
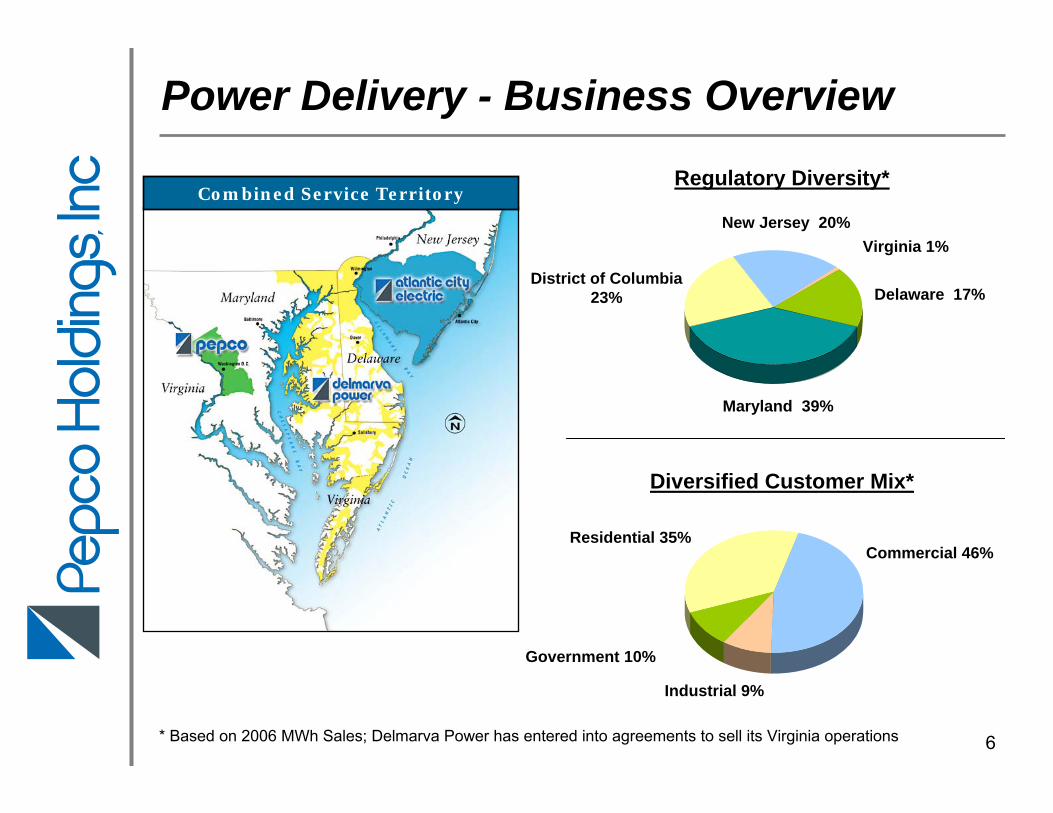
Power Delivery - Business Overview
Commercial 46%
Diversified Customer Mix*
Residential 35%
Government 10%
Industrial 9%
* Based on 2006 MWh Sales; Delmarva Power has entered into agreements to sell its Virginia operations
Regulatory Diversity*
District of Columbia 23%
New Jersey 20%Virginia 1%
Delaware 17%
Maryland 39%
Combined Service Territory

7
Mid-Atlantic Power Pathway (MAPP) Project
• PJM Board approved the 500kV portion of the project on 10/17/07
• PJM still evaluating the 230kV portion of the project; decision expected early 2008
• 230 mile, 500 kV line originating in northern Virginia, crossingMaryland, traveling up the Delmarva Peninsula and into southern New Jersey
• Significant 230 kV lines that support Maryland, Delaware and New Jersey
• Preliminary cost estimate - $1.2 billion (total project); completion by 2014
• ROE authorized in FERC formula rate settlement - 11.3% for new facilities
Status of the MAPP Project
500kV
230kV
Note: See Safe Harbor Statement at the beginning of today’s presentation.

8
Permitting & Right of WayConstruction
Oct. 2007 2008 2009 2010 2011 2012 2013 2014
Possum Pt. to Calvert Cliffs 24 Months
60 Months
48 Months
20 Months
24 Months
36 Months
Vienna to Indian River
Indian River to Salem
Calvert Cliffs to Vienna (Chesapeake Bay Crossing)
66 Months 18 Months
Mid-Atlantic Power Pathway Project – Timeline
Note: See Safe Harbor Statement at the beginning of today’s presentation.

9
Mid-Atlantic Power Pathway Project –Next Steps
● Remaining 230 kV portions under review by PJM with approval expected early 2008
● PHI and PJM are reviewing different technologies for performing the Chesapeake Bay crossing; PHI expected to have recommendation to PJM in December 2007
● Environmental studies starting in early 2008
● Certificate of Public Convenience and Necessity (CPCN) is expected to be applied for with the Maryland PSC in late 2008 into 2009
● Maryland PSC coordinates all studies and approves construction of the line in Maryland via the issuance of the CPCN
● No single agency performs the coordination role in Delaware; PHI will work with the individual agencies to obtain the necessary permits and approvals
● PHI will work with the BPU as well as municipalities for the public need approval in NJ
10
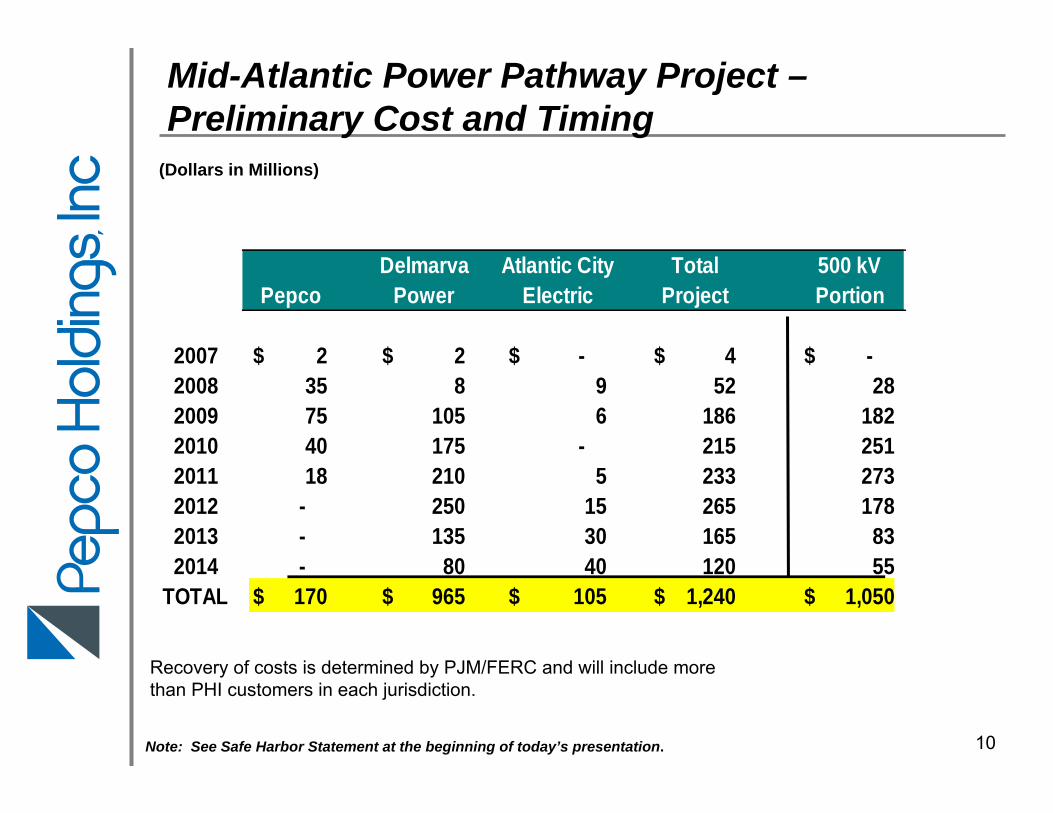
Mid-Atlantic Power Pathway Project –Preliminary Cost and Timing
Note: See Safe Harbor Statement at the beginning of today’s presentation.
(Dollars in Millions)
Pepco Power Electric
Recovery of costs is determined by PJM/FERC and will include morethan PHI customers in each jurisdiction.
Delmarva Atlantic City Total 500 kV
Pepco Power Electric Project Portion
2007 2$ 2$ -$ 4$ -$ 2008 35 8 9 52 28 2009 75 105 6 186 182 2010 40 175 - 215 251 2011 18 210 5 233 273 2012 - 250 15 265 178 2013 - 135 30 165 83 2014 - 80 40 120 55
TOTAL 170$ 965$ 105$ 1,240$ 1,050$

11
Blueprint for the Future• Responsive to customer expectations:
– Managing energy costs– Enhancing reliability– Protecting the environment
• Includes significant investment:
– Advanced metering– Demand side management
applications– Distribution automation– Customer information systems
• Programs will provide the tools customers need to move into the future:
• Multi-year effort across PHI service territory
• Regulatory support is essential
Energy Efficiency• Energy Star Appliances• Efficient Heat Pumps• Efficient Lighting
Demand Response• Smart Thermostats• Innovative Rate Structures
Renewable Energy• Net Energy Metering• Green Choice

12
Blueprint for the Future -Estimated Peak Load Reductions*
0
200
400
600
800
1000
2009 2010 2011 2012 2013 2009 2010 2011 2012 2013
MW
AMI-Enabled Critical Peak
AMI-Enabled Direct Load Control
CPP-DefaultCPP-Voluntary
Energy Efficiency
Note: See Safe Harbor Statement at the beginning of today’s presentation.
* PHI territoriesAMI – Advanced Metering InfrastructureCPP – Critical Peak Pricing
13
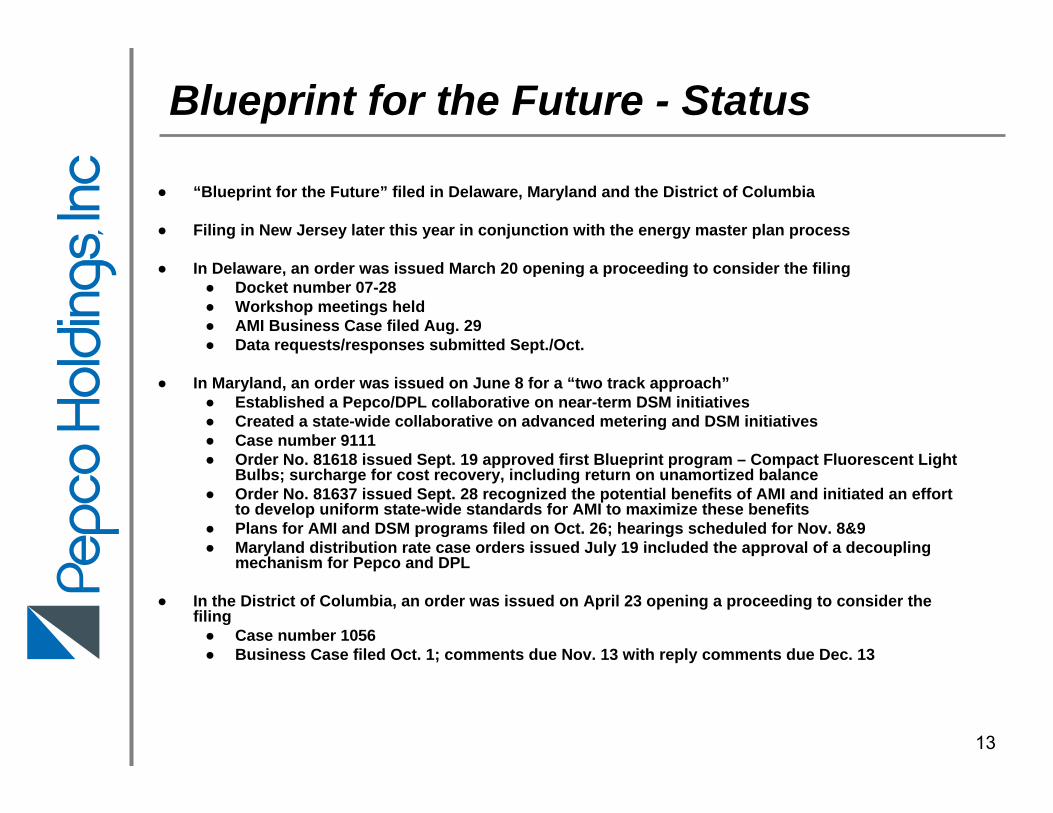
● “Blueprint for the Future” filed in Delaware, Maryland and the District of Columbia
● Filing in New Jersey later this year in conjunction with the energy master plan process
● In Delaware, an order was issued March 20 opening a proceeding to consider the filing● Docket number 07-28● Workshop meetings held● AMI Business Case filed Aug. 29● Data requests/responses submitted Sept./Oct.
● In Maryland, an order was issued on June 8 for a “two track approach”● Established a Pepco/DPL collaborative on near-term DSM initiatives● Created a state-wide collaborative on advanced metering and DSM initiatives● Case number 9111● Order No. 81618 issued Sept. 19 approved first Blueprint program – Compact Fluorescent Light
Bulbs; surcharge for cost recovery, including return on unamortized balance● Order No. 81637 issued Sept. 28 recognized the potential benefits of AMI and initiated an effort
to develop uniform state-wide standards for AMI to maximize these benefits● Plans for AMI and DSM programs filed on Oct. 26; hearings scheduled for Nov. 8&9● Maryland distribution rate case orders issued July 19 included the approval of a decoupling
mechanism for Pepco and DPL
● In the District of Columbia, an order was issued on April 23 opening a proceeding to consider the filing● Case number 1056● Business Case filed Oct. 1; comments due Nov. 13 with reply comments due Dec. 13
Blueprint for the Future - Status

14
Blueprint for the Future -Preliminary Estimated Capital Cost and Timing (1)
Note: See Safe Harbor Statement at the beginning of today’s presentation.
2008 2009 2010 2011 2012 - 2014 Total
Advanced Metering Infrastructure 44$ 115$ 118$ 106$ 93$ 476$
Distribution Automation 6 12 18 14 14 64
Meter Data Management System 10 - - - - 10
Smart Thermostat (2) 2 21 21 22 30 96
Total 62$ 148$ 157$ 142$ 137$ 646$
(Dollars in Millions)
(1) Excludes CIS improvement
(2) May be capitalized or expensed depending on program design

15
Power Delivery –Infrastructure Investment Strategy
Construction Forecast *Construction Forecast *
* The MAPP and Blueprint construction costs reflected above are preliminary estimates and are not included aspart of the projection of construction expenditures reflected in PHI’s filed Forms 10-K and 10-Q.
Note: See Safe Harbor Statement at the beginning of today’s presentation.
5 Year(Dollars in Millions) 2007 2008 2009 2010 2011 TotalsDistribution: Customer Driven (new service connections, 175$ 156$ 161$ 162$ 168$ 822$ meter installations, highway relocations) Reliability 109 167 151 141 181 749 (facility replacements/upgrades for system reliability) Load 98 72 59 92 122 443 (new/upgraded facilities to support load growth)
Transmission 156 117 73 58 50 454
Gas Delivery 19 20 20 21 20 100
Information Technology 16 17 17 17 17 84 Corporate Support and Other 8 11 8 13 15 55
Total Power Delivery 581$ 560$ 489$ 504$ 573$ 2,707$
Mid-Atlantic Power Pathway (MAPP) 4 52 186 215 233 690
Blueprint - 62 148 157 142 509
Total Including MAPP and Blueprint 585$ 674$ 823$ 876$ 948$ 3,906$

16
Power Delivery – A Driver of Growth
Note: See Safe Harbor Statement at the beginning of today’s presentation.
Rate ConstructionBase Expenditures
12/31/2006 2007-2011*
Electric Distribution Rate Bases:Pepco 1,799$ 1,362$ Delmarva Power 703 756 Atlantic City Electric 822 544 Total 3,324 2,662
Gas Distribution Rate Base:Delmarva Power 239 100
Electric Transmission Rate Bases:Pepco 305 299 Delmarva Power 240 657 Atlantic City Electric 224 188 Total 769 1,144
Total Regulated Assets 4,332$ 3,906$
(Dollars in Millions)
* Includes MAPP and Blueprint projects.

17
Distribution Rate Case Status
(Dollars in Millions) Pending
DPL DPL Pepco PepcoGas Electric Electric ElectricDE MD MD Total DC (3)
Rate Base N/A $267 $896 $980 Equity Ratio 46.90% 48.63% 47.69% 46.55%
ROE 10.25% 10.00% 10.00% 10.75% (4)
BSA No (1) Yes Yes Yes
Rate Increase $9.0 (2) $14.9 $10.6 $34.5 $43.5 (4)
Depreciation Expense Reduction $2.1 $0.9 $30.7 $33.7
Effective Date 4/1/2007 6/16/2007 6/16/2007
Orders Received
Notes:
(1) Parties to the settlement are participating in a generic statewide proceeding initiated by the Commission for the purpose of investigating decoupling mechanisms for electric and gas distribution utilities.
(2) Includes the $2.5 million increase that was put into effect on November 1, 2006.
(3) Pepco’s position.
(4) Requested with adoption of the BSA; without the BSA, the requested ROE is 11.0% and the revenue requirement is $47.9 million.
18
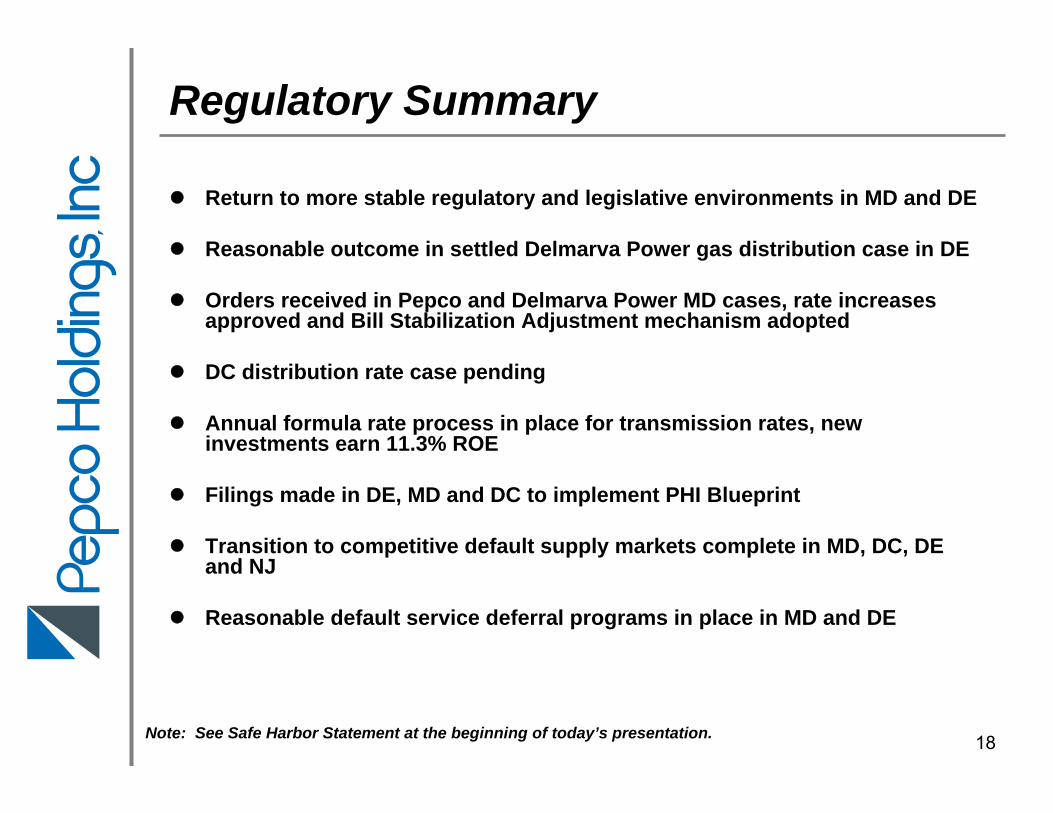
Return to more stable regulatory and legislative environments in MD and DE
Reasonable outcome in settled Delmarva Power gas distribution case in DE
Orders received in Pepco and Delmarva Power MD cases, rate increases approved and Bill Stabilization Adjustment mechanism adopted
DC distribution rate case pending
Annual formula rate process in place for transmission rates, newinvestments earn 11.3% ROE
Filings made in DE, MD and DC to implement PHI Blueprint
Transition to competitive default supply markets complete in MD, DC, DE and NJ
Reasonable default service deferral programs in place in MD and DE
Regulatory Summary
Note: See Safe Harbor Statement at the beginning of today’s presentation.
19
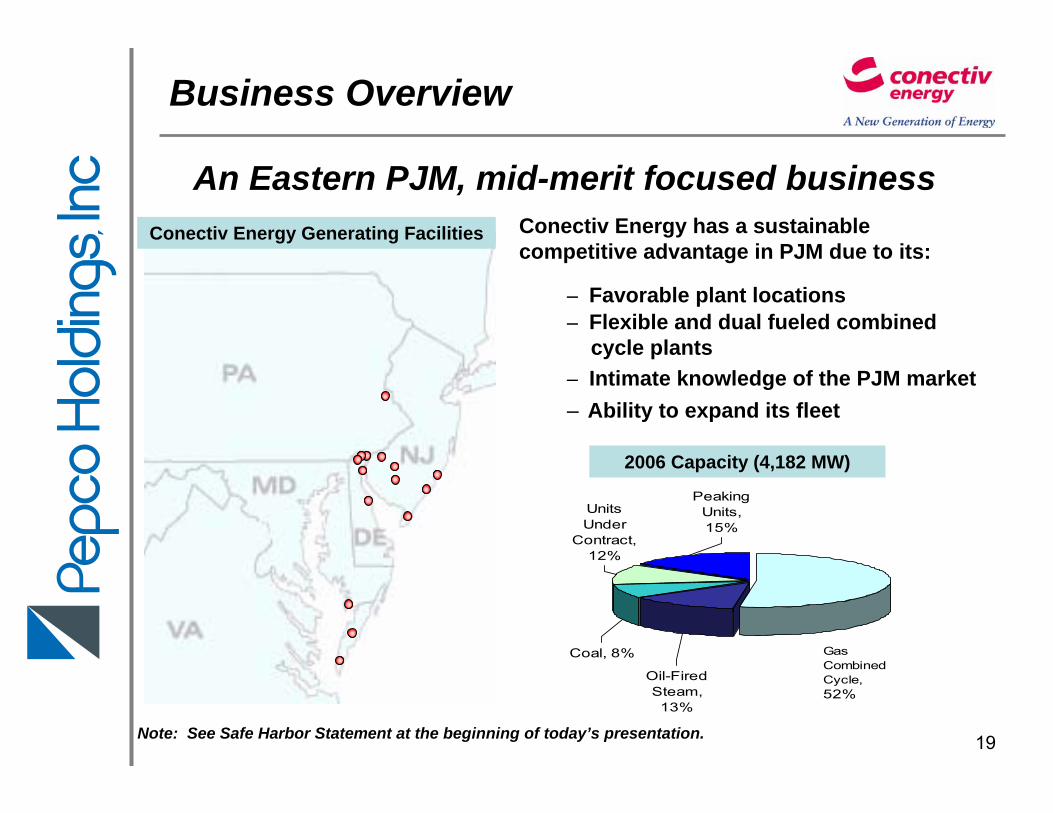
Business Overview
Conectiv Energy Generating Facilities
An Eastern PJM, mid-merit focused business
2006 Capacity (4,182 MW)
Conectiv Energy has a sustainable competitive advantage in PJM due to its:
– Favorable plant locations– Flexible and dual fueled combined
cycle plants– Intimate knowledge of the PJM market– Ability to expand its fleet
Units Under
Contract, 12%
Coal, 8%
Oil-Fired Steam, 13%
Gas Combined Cycle, 52%
Peaking Units, 15%
Note: See Safe Harbor Statement at the beginning of today’s presentation.

20
Financial Performance
$ 33$ 57Net Income without Gain
$ 8$ -Gain on Asset Disposition
$ 41$ 57Net Income
$ 117$ 127Operating Expenses
$ 197$ 243Gross Margin
$1,551$1,608
(Dollars in Millions)
Revenue
20062007Conectiv Energy
Nine Months EndedSeptember 30,
Earnings Drivers• Merchant Generation
and Load Service gross margin increased $52M in 2007.
• Energy Marketing gross margin decreased $5M in 2007.
• Operating Expenses increased $10M in 2007 primarily due to planned increases in power plant maintenance.

21
Hedge Update
Ancillary Services (5%)Fuel Switching (2%)
Locational Value (15%)
Capacity (18%)
Energy (58%)
Hedging and Load Service (2%)
Percentage of Total Merchant Generation & Load Service
• Products such as locational value and ancillary products can only be partially hedged.
• Hedges are designed to reduce the risk of the overall portfolio. Therefore, the value of hedges needs to be considered in the context of the rest of the portfolio.
2007-YTD Gross Marginsby Source (est.)
Note: See Safe Harbor Statement at the beginning of today’s presentation.
24%0-50%Months 25-36
98%25-75%Months 13-24
113%50-100%Months 1-12
9/30/07TargetHedge PeriodOn Peak Power Hedges (MWh basis)

22
Merchant Generation &Load Service Gross Margins*
Note: See Safe Harbor Statement at the beginning of today’s presentation.
-$40
$10
$60
$110
$160
$210
$260
$310
$360
2004 2005 2006 2007 Forecast 2008 Forecast
Dol
lars
in M
illio
ns
$283
$360$310
$240$300
$200$191
$231$248
$260
Actual Forecast
$270
In addition to the gross margins above, Energy Marketing Gross Margins are forecasted to be $15-$25 million in 2007 and 2008.
*
$214September 2007 YTD
23
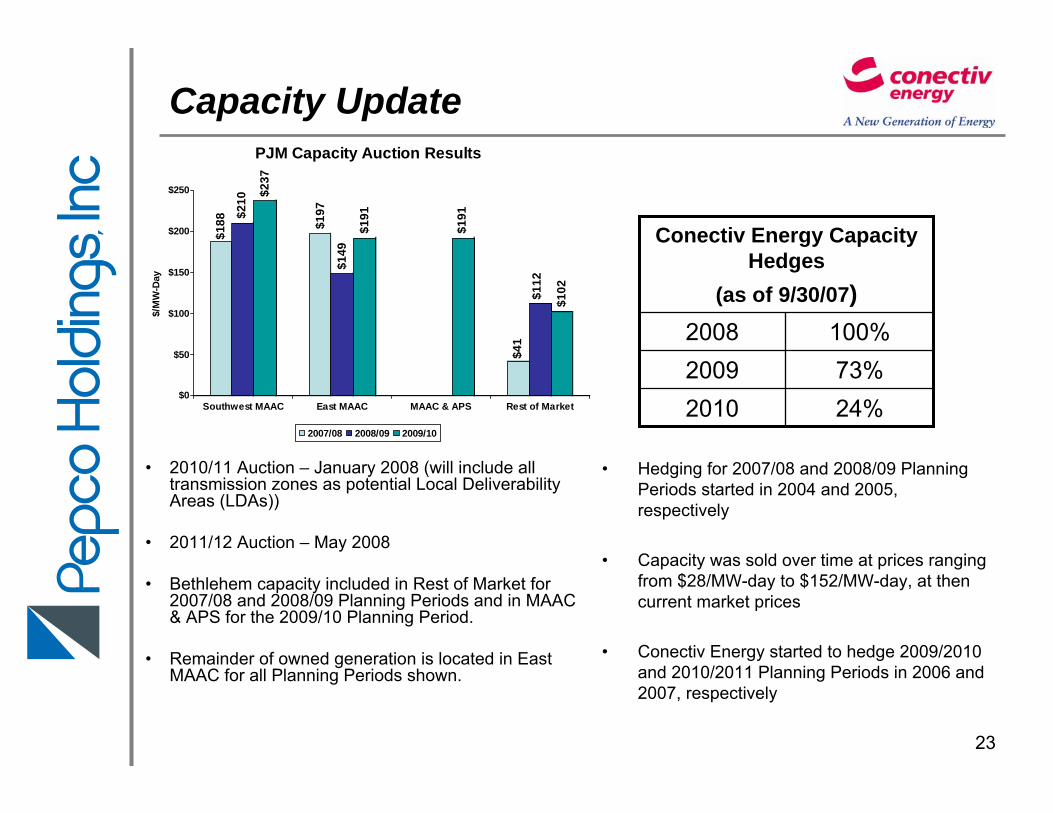
Capacity Update
• 2010/11 Auction – January 2008 (will include all transmission zones as potential Local Deliverability Areas (LDAs))
• 2011/12 Auction – May 2008
• Bethlehem capacity included in Rest of Market for 2007/08 and 2008/09 Planning Periods and in MAAC & APS for the 2009/10 Planning Period.
• Remainder of owned generation is located in East MAAC for all Planning Periods shown.
• Hedging for 2007/08 and 2008/09 Planning Periods started in 2004 and 2005, respectively
• Capacity was sold over time at prices ranging from $28/MW-day to $152/MW-day, at then current market prices
• Conectiv Energy started to hedge 2009/2010 and 2010/2011 Planning Periods in 2006 and 2007, respectively
$188 $2
10
$237
$197
$149
$191
$191
$41
$112
$102
$0
$50
$100
$150
$200
$250
$/M
W-D
ay
Southwest MAAC East MAAC MAAC & APS Rest of Market
PJM Capacity Auction Results
2007/08 2008/09 2009/10
24%201073%2009
100%2008
Conectiv Energy Capacity Hedges
(as of 9/30/07)
24
Generation Projects
Note: See Safe Harbor Statement at the beginning of today’s presentation.
• Committed Project– Stand-alone CT Project (Cumberland Project)
• 100 MW dual fuel combustion turbine at existing Cumberland County, New Jersey site (35 miles southwest of Atlantic City, NJ)
• Based on GE LMS100 technology – very flexible and efficient CT unit
• $75 million; commercial operation in early 2009
• Potential Project– Delta Site
• Utilizes combustion turbines in inventory• 540 MW dual fuel combined cycle plant at new Delta, PA site (55
miles southeast of Harrisburg, PA, near the Susquehanna River) • Air permits received• $350 - $400 million cost, 2010-2012 commercial operation date

25
Business Overview
PES RetailElectric Supply Markets
Independent System Operator
PJM
New York ISO
New England ISO
Provides retail energy supply and energy services to C&I customers
• Retail electric supply is PES’s main business driver– Complements PHI’s regulated utility business; opportunity to serve customers
who choose to shop
• Additional product offerings differentiate PES from its competitors and provide additional earnings
– Retail natural gas supply– Energy efficiency services
• PES also owns:– 800 MW of peaking generation in
Washington, DC; scheduled forretirement in 2012
– Two transmission and distribution construction/service companies serving utility and infrastructure needs
PES RetailElectric Supply Markets
26
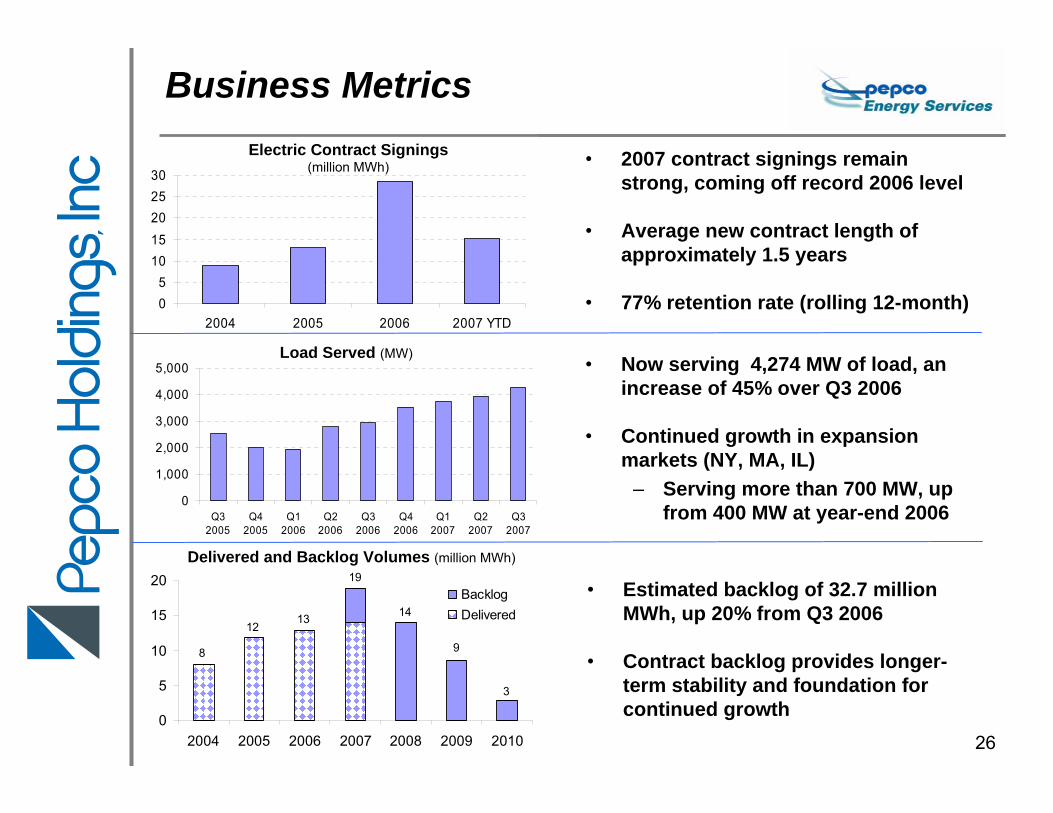
13
3
9
14
19
8
12
0
5
10
15
20
2004 2005 2006 2007 2008 2009 2010
BacklogDelivered
Business Metrics
0
1,000
2,000
3,000
4,000
5,000
Q32005
Q42005
Q12006
Q22006
Q32006
Q42006
Q12007
Q22007
Q32007
05
1015202530
2004 2005 2006 2007 YTD
• 2007 contract signings remain strong, coming off record 2006 level
• Average new contract length of approximately 1.5 years
• 77% retention rate (rolling 12-month)
Electric Contract Signings(million MWh)
Load Served (MW)
• Estimated backlog of 32.7 million MWh, up 20% from Q3 2006
• Contract backlog provides longer-term stability and foundation for continued growth
Delivered and Backlog Volumes (million MWh)
• Now serving 4,274 MW of load, an increase of 45% over Q3 2006
• Continued growth in expansion markets (NY, MA, IL)
– Serving more than 700 MW, up from 400 MW at year-end 2006
27
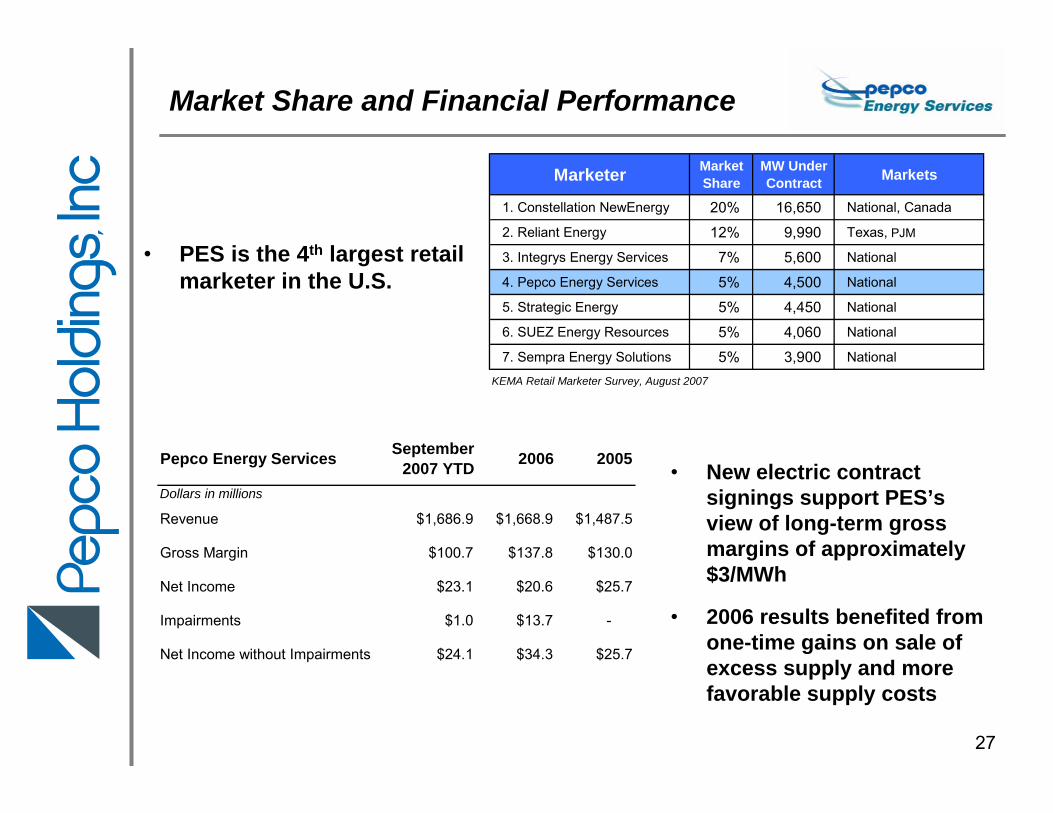
• PES is the 4th largest retail marketer in the U.S.
• New electric contract signings support PES’s view of long-term gross margins of approximately $3/MWh
• 2006 results benefited from one-time gains on sale of excess supply and more favorable supply costs
Market Share and Financial Performance
Marketer Market Share
MW Under Contract Markets
1. Constellation NewEnergy 20% 16,650 National, Canada
2. Reliant Energy 12% 9,990 Texas, PJM
3. Integrys Energy Services 7% 5,600 National
4. Pepco Energy Services 5% 4,500 National
5. Strategic Energy 5% 4,450 National
6. SUEZ Energy Resources 5% 4,060 National
7. Sempra Energy Solutions 5% 3,900 National
KEMA Retail Marketer Survey, August 2007
Dollars in millions
Revenue $1,686.9 $1,668.9 $1,487.5
Gross Margin $100.7 $137.8 $130.0
Net Income $23.1 $20.6 $25.7
Impairments $1.0 $13.7 -
Net Income without Impairments $24.1 $34.3 $25.7
2006 2005September 2007 YTDPepco Energy Services
28
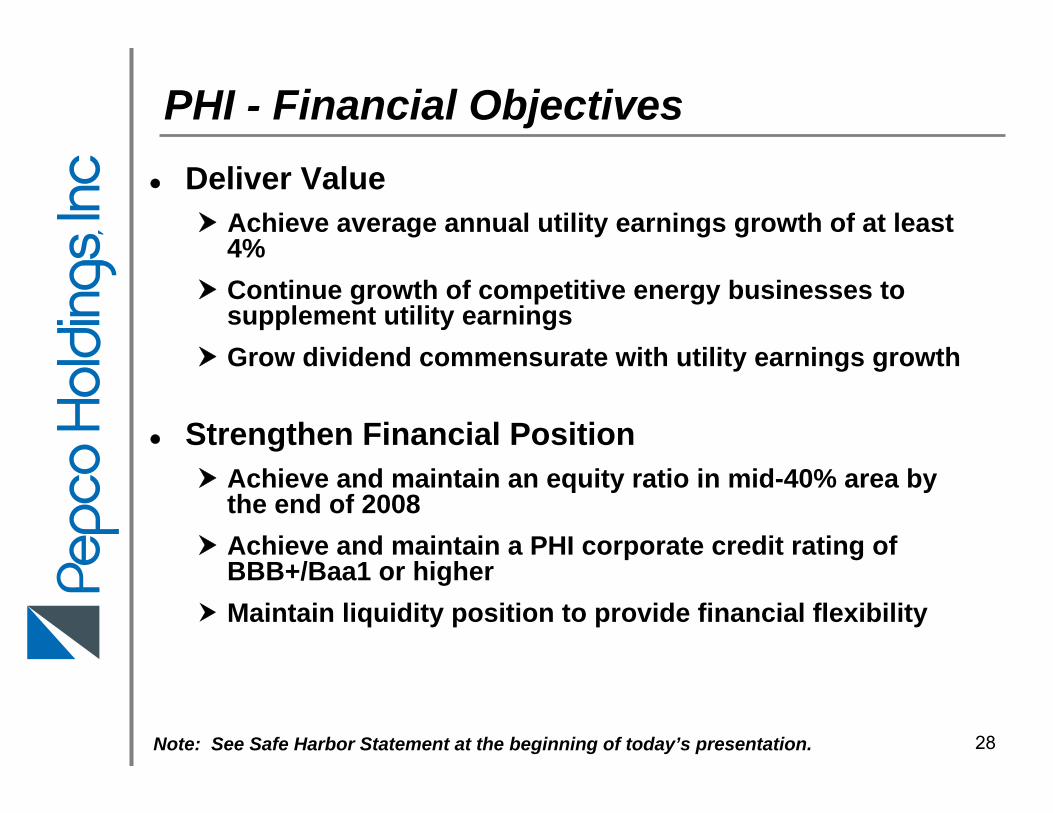
PHI - Financial ObjectivesDeliver Value
Achieve average annual utility earnings growth of at least 4%Continue growth of competitive energy businesses to supplement utility earningsGrow dividend commensurate with utility earnings growth
Strengthen Financial PositionAchieve and maintain an equity ratio in mid-40% area by the end of 2008Achieve and maintain a PHI corporate credit rating of BBB+/Baa1 or higherMaintain liquidity position to provide financial flexibility
Note: See Safe Harbor Statement at the beginning of today’s presentation.

29
2007 2006 2007 2006
$0.63 $0.44 Power Delivery $0.44 $0.44
$0.19 $0.12 Conectiv Energy $0.19 $0.12
$0.05 $0.00 Pepco Energy Services $0.05 $0.04
$0.06 $0.05 Other Non-Regulated $0.06 $0.05
($0.06) ($0.07) Corporate & Other ($0.06) ($0.07)
GAAP Earnings Per Share Excluding Special Items
$0.68 $0.58$0.87 $0.54 Total PHI
Quarter Ended September 30,
Quarter Ended September 30,
Management believes the special items are not representative of the Company’s ongoing business operations. See appendix for details.
Third Quarter 2007 Financial Performance
Note:

30
Power Delivery• Network Transmission Revenue 0.04• Depreciation – MD Rate Orders Impact 0.04 • Distribution Revenue – MD Rate Orders Impact 0.03• Operation and Maintenance Expense (0.04)• Income Tax Adjustments (0.05)• Other, net (0.02)
Conectiv Energy• Merchant Generation & Load Service 0.09• Energy Marketing (0.03)• Operating Costs, net 0.01
Pepco Energy Services• Retail Energy Supply 0.03• Energy Services (0.02)
Other, net 0.02
Third Quarter 2007 Financial Performance - Drivers
Third Quarter 2006 Earnings Per Share* $0.58
Third Quarter 2007 Earnings Per Share* $0.68
* Excluding special items. See appendix for details.

31
● Stable Earnings Base - Derived primarily from regulated T&D utility businesses
● Earnings Growth Potential - Driven by T&D utility infrastructure investments, constructive regulatory outcomes and competitive energy businesses
● Secure Dividend - Current dividend yield is 17% higher than the average dividend yield for companies in the S&P Electric Utilities index*
Why Invest in PHI?
Note: See Safe Harbor Statement at the beginning of today’s presentation.* Pricing data as of October 29, 2007

32
Appendix
33
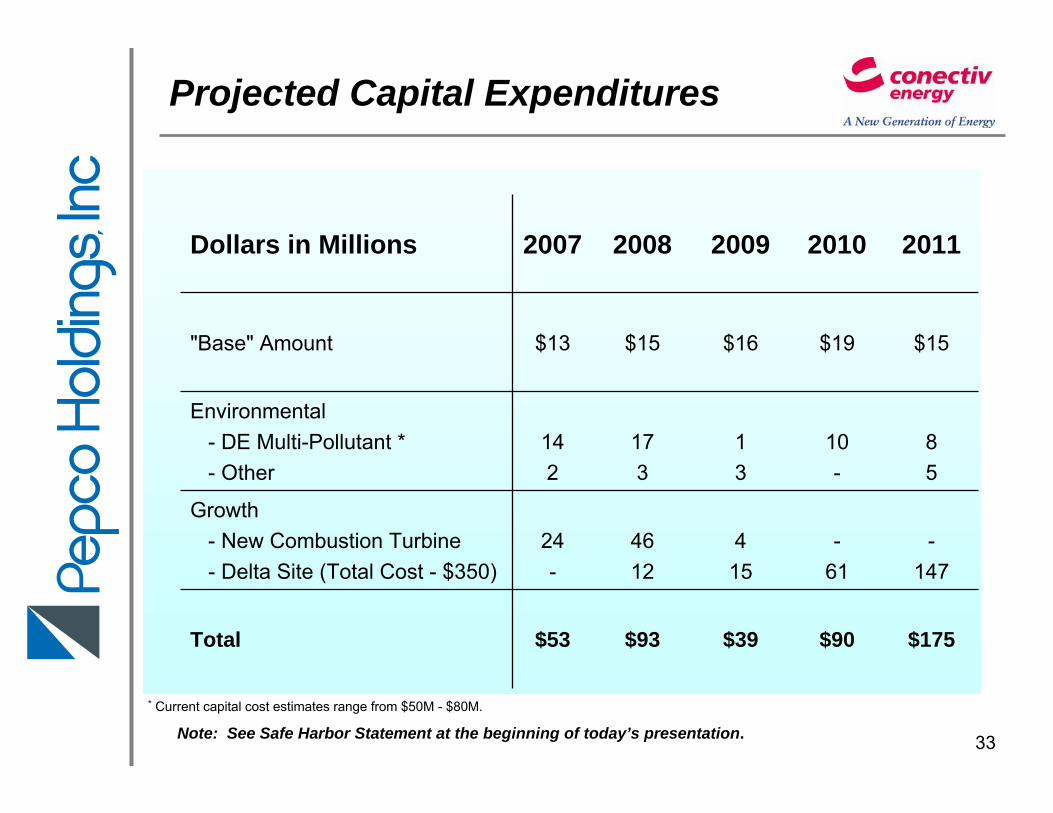
Projected Capital Expenditures
Note: See Safe Harbor Statement at the beginning of today’s presentation.
$15$19$16$15$13"Base" Amount
$93
4612
173
2008
$175$90$39$53Total
-147
-61
415
24-
Growth- New Combustion Turbine- Delta Site (Total Cost - $350)
85
10-
13
142
Environmental- DE Multi-Pollutant *- Other
2011201020092007Dollars in Millions
* Current capital cost estimates range from $50M - $80M.
34
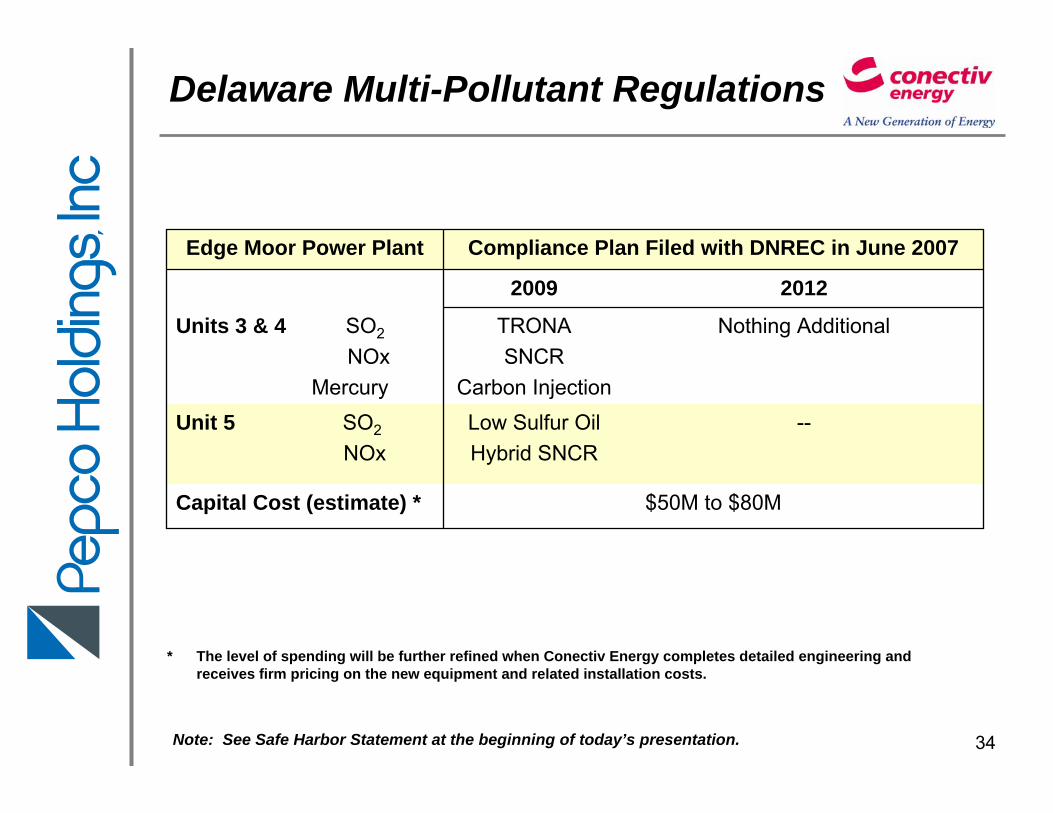
Delaware Multi-Pollutant Regulations
$50M to $80MCapital Cost (estimate) *
--Low Sulfur OilHybrid SNCR
Unit 5 SO2
NOx
Nothing AdditionalTRONASNCR
Carbon Injection
Units 3 & 4 SO2
NOxMercury
20122009
Compliance Plan Filed with DNREC in June 2007Edge Moor Power Plant
* The level of spending will be further refined when Conectiv Energy completes detailed engineering and receives firm pricing on the new equipment and related installation costs.
Note: See Safe Harbor Statement at the beginning of today’s presentation.

35
Annual capacity factors and output by fuel type (2002-2008)*
Output (GWh)
Capacity Factor
Output (GWh)
Capacity Factor
Output (GWh)
Capacity Factor
Output (GWh)
Capacity Factor
Coal Fired Baseload 1,777 59% 1,934 64% 1,854 62% 1,757 59%Oil/Gas Fired Steam 653 14% 922 21% 523 11% 675 15%Combined Cycle 1,740 17% 2,290 13% 2,635 13% 2,976 16%Peaking Units 188 4% 117 2% 150 3% 191 3%
20052002 2003 2004
* Excludes contracted assets.
Output (GWh)
Capacity Factor Output (GWh)
Capacity Factor Output (GWh)
Capacity Factor
Coal Fired Baseload 1,814 61% 1,800-2,050 61%-69% 1,790-2,030 60%-68%Oil/Gas Fired Steam 115 2% 175-280 4%-6% 175-465 4%-10%Combined Cycle 2,082 11% 2,500-3,400 13%-17% 2,340-3,500 12%-18%Peaking Units 132 2% 110-300 2%-5% 110-400 2%-6%
2006 2007 estimate 2008 estimate
Note: See Safe Harbor Statement at the beginning of today’s presentation.
Capacity Factors

36
Combined Cycle Unit Operation
PJM M AAC CC Average Hourly Capacity Factors vs. PJM East Hub Prices for Jul&Aug, 2005
0%
20%
40%
60%
80%
100%
1 3 5 7 9 11 13 15 17 19 21 23
Hour of Day
0
28
56
84
112
140
CESI CCs
PJM Price
Other CCs
Combined Cycle Design
12 or 3Multi-Pipeline Access
NoYes
Multi-fuel Capability
(natural gas and No. 2 oil)
12Allowable Starts per Day
8-164Minimum Run Time (hours)
NoYesAbility to Run only CT's
2 Hours20 MinutesTime for CT's to Reach Full Load
Typical Combined
Cycle Design
Conectiv Energy
Combined Cycle Design
PJM MAAC CC Average Hourly Capacity Factors vs. PJM East Hub Prices for Jan&Feb, 2005
0%
20%
40%
60%
80%
100%
1 3 5 7 9 11 13 15 17 19 21 23
Hour of Day
0
28
56
84
112
140
PJM PriceCESI CCs
Other CCs

37
$116 $156 $117$73 $58 $50
$365
$425$443
$416 $446$523
$26
$74 $104
$50$99
$185
$0
$100
$200
$300
$400
$500
$600
$700
$800
2006 Actual 2007 2008 2009 2010 2011
Mill
ions
Transmission Distribution Competitive
Construction Expenditures (1)
Note: See Safe Harbor Statement at the beginning of today’s presentation.
$655 $664
$539$603
$758
PHI Construction Expenditures –Driver of Earnings Growth
$507
Excludes Mid-Atlantic Power Pathway (MAPP) and Blueprint projects. Includes increased capital spending approved in the 1st quarter 2007 for new combustion turbine power plant at Conectiv Energy.
Construction expenditures include cash and accruals.
(2)
(1)
(2)
38
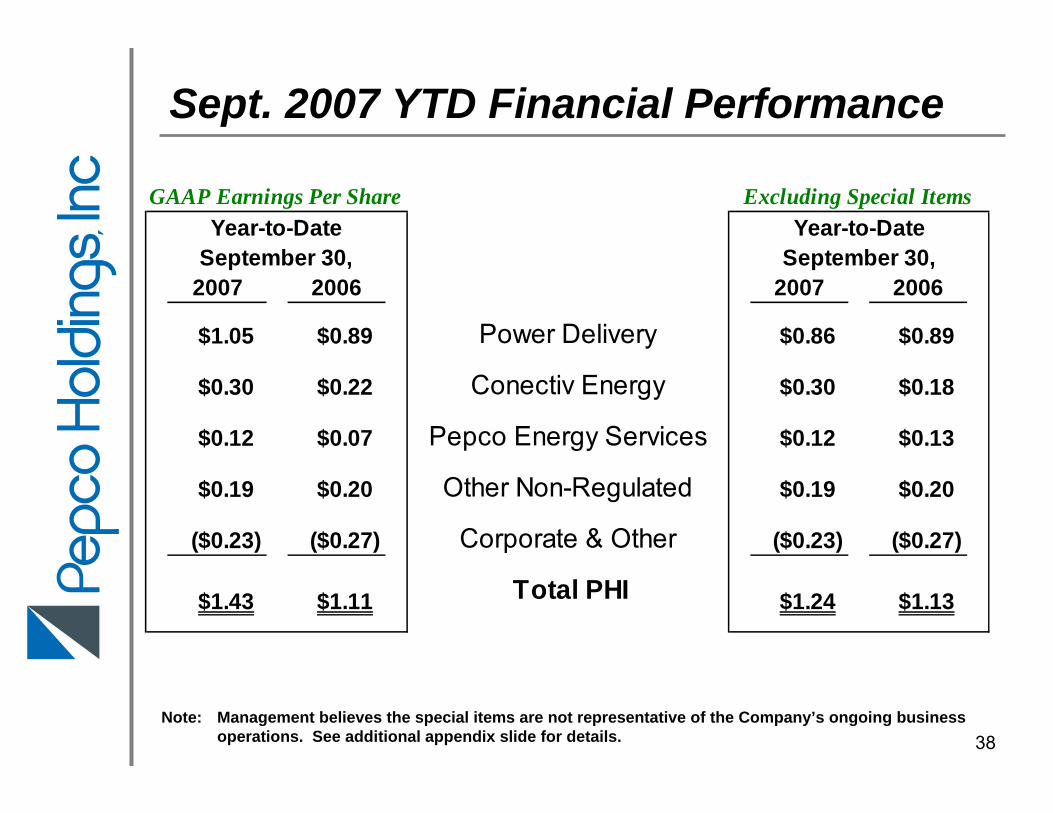
2007 2006 2007 2006
$1.05 $0.89 Power Delivery $0.86 $0.89
$0.30 $0.22 Conectiv Energy $0.30 $0.18
$0.12 $0.07 Pepco Energy Services $0.12 $0.13
$0.19 $0.20 Other Non-Regulated $0.19 $0.20
($0.23) ($0.27) Corporate & Other ($0.23) ($0.27)
GAAP Earnings Per Share Excluding Special Items
$1.24 $1.13$1.43 $1.11 Total PHI
Year-to-Date September 30,
Year-to-Date September 30,
Management believes the special items are not representative of the Company’s ongoing business operations. See additional appendix slide for details.
Sept. 2007 YTD Financial Performance
Note:

39
Power Delivery• Higher kWh sales due to weather 0.09• Depreciation – MD Rate Orders Impact 0.04• Distribution Revenue – MD Rate Orders Impact 0.03• Operation and Maintenance Expense (0.08)• Network Transmission Revenue (0.03)• Default Electricity Supply Margin (0.03)• Income Tax Adjustments (0.04)• Other, net (0.01)
Conectiv Energy• Merchant Generation & Load Service 0.16• Energy Marketing (0.02)• Other, net (0.02)
Pepco Energy Services• Retail Energy Supply (0.01)
Other, net 0.03
Sept. 2007 YTD Financial Performance - DriversSept. 2006 YTD Earnings Per Share* $1.13
Sept. 2007 YTD Earnings Per Share* $1.24
* Excluding special items. See additional appendix slide for details.

40
Reconciliation of Operating IncomeReported Operating Income Reconciled to Operating Income Excluding Special Items
For the twelve months ended September 30, 2007
Pepco OtherPower Conectiv Energy Non- Corporate PHI
Delivery Energy Services Regulated & Other ConsolidatedReported Segment Operating Income $504.8 $134.2 $49.3 $73.4 $1.1 $762.8
Percent of operating income 66.2% 17.6% 6.5% 9.6% 0.1% 100.0%
Special Items included in Operating Income Impairment loss on energy services assets 0.2 0.2 Mirant damage claims settlement (33.4) (33.4) Maryland income tax refund fees 2.9 2.9
Operating Income excluding Special Items $474.3 $134.2 $49.5 $73.4 $1.1 $732.5
Percent of operating income excluding special items 64.8% 18.3% 6.8% 10.0% 0.1% 100.0%
(Dollars in Millions)
Note: Management believes the Special items are not representative of the Company’s ongoing business operations.

41Note: Management believes the special items are not representative of the Company’s ongoing business operations.
Reconciliation of Earnings Per Share
2007 2006 2007 2006
Reported (GAAP) Earnings per Share 0.87$ 0.54$ 1.43$ 1.11$
Special Items:
Gain on disposition of co-generation facility - - - (0.04)
Impairment loss on energy services assets - 0.04 - 0.06
Mirant bankruptcy damage claims settlement (0.10) - (0.10) -
Maryland Income Tax settlement (0.09) - (0.09) -
Net Earnings per Share, excluding Special Items 0.68$ 0.58$ 1.24$ 1.13$
Three Months EndedSeptember 30,
Nine Months EndedSeptember 30,
GAAP EPS to EPS Excluding Special Items