Embed Size (px)
Citation preview

The Right StuffWe Deliver
Positioned for Success in a Dynamic Industry
Investor MeetingsAugust 17, 2006
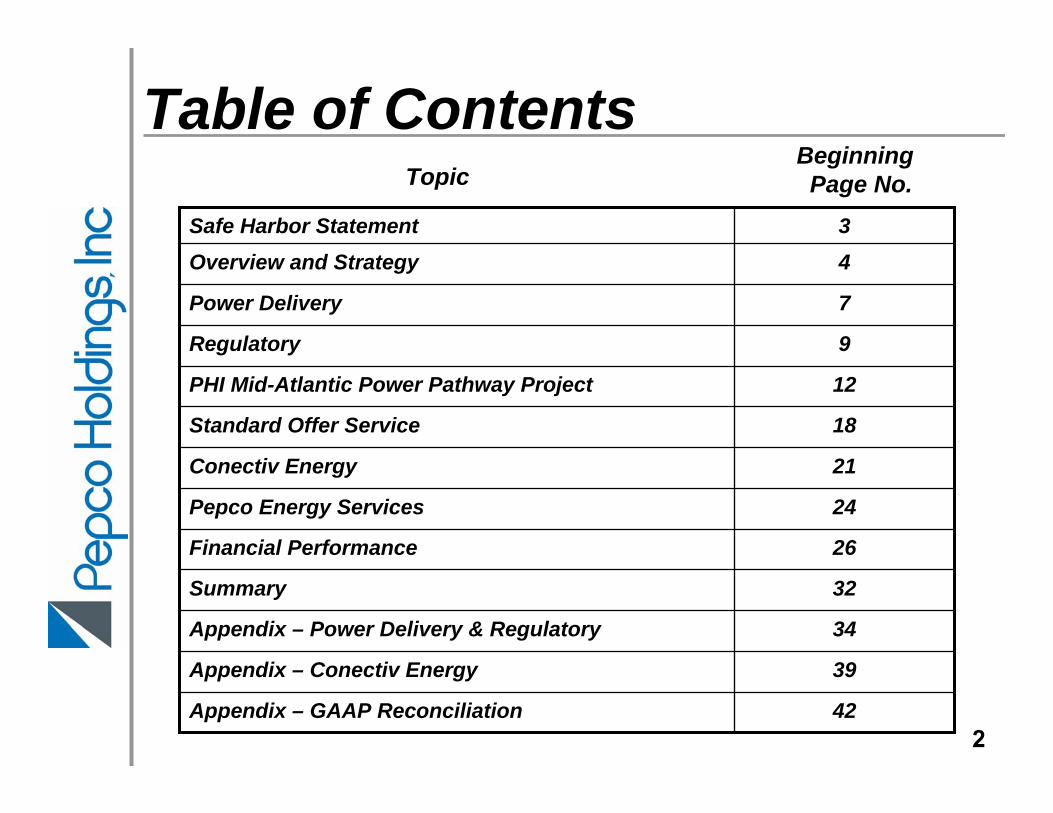
Table of Contents
34Appendix – Power Delivery & Regulatory
39Appendix – Conectiv Energy
42Appendix – GAAP Reconciliation
21Conectiv Energy
24Pepco Energy Services
26Financial Performance
32Summary
18Standard Offer Service
12PHI Mid-Atlantic Power Pathway Project
4Overview and Strategy
9Regulatory
7Power Delivery
3Safe Harbor Statement
BeginningPage No.
2
Topic

Safe Harbor Statement
Some of the statements contained in today’s presentation are forward-looking statements within the meaning of Section 21E of the Securities Exchange Act of 1934 and are subject to the safe harbor created by the Private Securities Litigation Reform Act of 1995. These statements include all financial projections and any declarations regarding management’s intents, beliefs or current expectations. In some cases, you can identify forward-looking statements by terminology such as “may,” “will,” “should,” “expects,” “plans,” “anticipates,” “believes,”“estimates,” “predicts,” “potential” or “continue” or the negative of such terms or other comparable terminology. Any forward-looking statements are not guarantees of future performance, and actual results could differ materially from those indicated by the forward-looking statements. Forward-looking statements involve estimates, assumptions, known and unknown risks, uncertainties and other factors that may cause actual results, levels of activity, performance or achievements to be materially different from any future results, levels of activity, performance or achievements expressed or implied by such forward-looking statements. Each forward-looking statement speaks only as of the date of the particular statement, and we undertake no obligation to publicly update or revise any forward-looking statement, whether as a result of new information, future events or otherwise. A number of factors could cause actual results or outcomes to differ materially from those indicated by the forward-looking statements contained in this presentation. These factors include, but are not limited to, prevailing governmental policies and regulatory actions affecting the energy industry, including with respect to allowed rates of return, industry and rate structure, acquisition and disposal of assets and facilities, operation and construction of plant facilities, recovery of purchased power expenses, and present or prospective wholesale and retail competition; changes in and compliance with environmental and safety laws and policies; weather conditions; population growth rates and demographic patterns; competition for retail and wholesale customers; general economic conditions, including potential negative impacts resulting from an economic downturn; growth in demand, sales and capacity to fulfill demand; changes in tax rates or policies or in rates of inflation; potential changes in accounting standards or practices; changes in project costs; unanticipated changes in operating expenses and capital expenditures; the ability to obtain funding in the capital markets on favorable terms; restrictions imposed by Federal and/or state regulatory commissions; legal and administrative proceedings (whether civil or criminal) and settlements that influence our business and profitability; pace of entry into new markets; volatility in market demand and prices for energy, capacity and fuel; interest rate fluctuations and credit market concerns; and effects of geopolitical events, including the threat of domestic terrorism. Readers are referred to the most recent reports filed with the Securities and Exchange Commission.
3

● We’ve made progress on several strategic issues amid considerable challenges since the 2002 merger
Paid down merger related debt
Divested non-strategic businesses
Effectively managed through Mirant bankruptcy process to date
Invested in our utility infrastructure (rate base) at appropriate levels, with appropriate goals
Integrated the operating utilities
Developed a successful C&I commodity business at Pepco Energy Services that is expandable
Managed Conectiv Energy through cyclical downturn in energy markets
We’ve Delivered
4
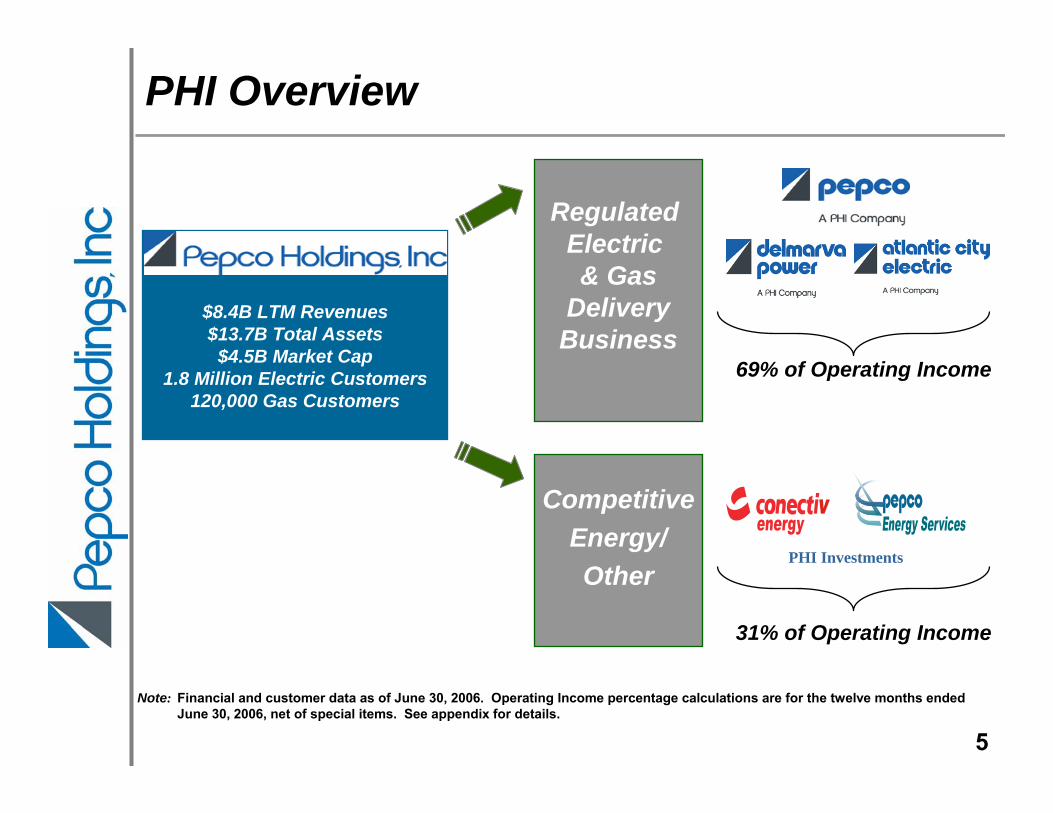
PHI Overview
$8.4B LTM Revenues $13.7B Total Assets$4.5B Market Cap
1.8 Million Electric Customers120,000 Gas Customers
Regulated Electric & Gas
DeliveryBusiness
Regulated Electric & GasDeliveryBusiness
CompetitiveEnergy/Other
69% of Operating Income
31% of Operating Income
Financial and customer data as of June 30, 2006. Operating Income percentage calculations are for the twelve months ended June 30, 2006, net of special items. See appendix for details.
PHI Investments
Note:
5
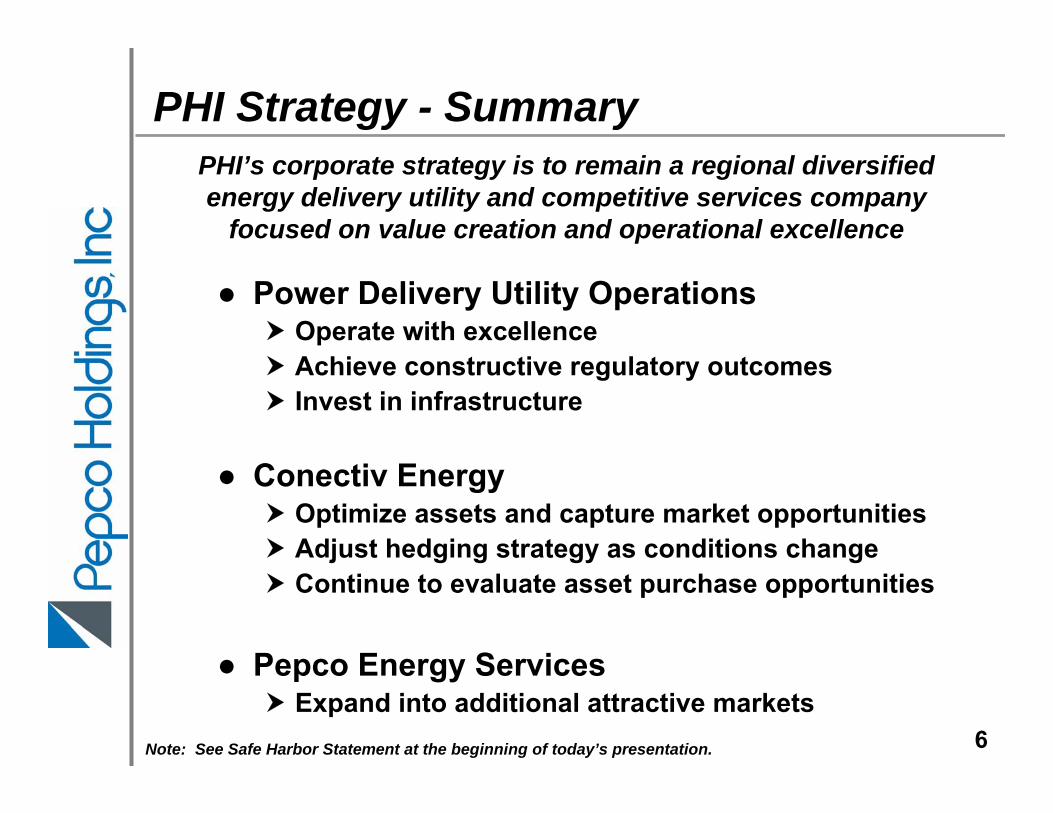
● Power Delivery Utility OperationsOperate with excellenceAchieve constructive regulatory outcomesInvest in infrastructure
● Conectiv EnergyOptimize assets and capture market opportunitiesAdjust hedging strategy as conditions changeContinue to evaluate asset purchase opportunities
● Pepco Energy ServicesExpand into additional attractive markets
PHI’s corporate strategy is to remain a regional diversified energy delivery utility and competitive services company
focused on value creation and operational excellence
PHI Strategy - Summary
Note: See Safe Harbor Statement at the beginning of today’s presentation. 6
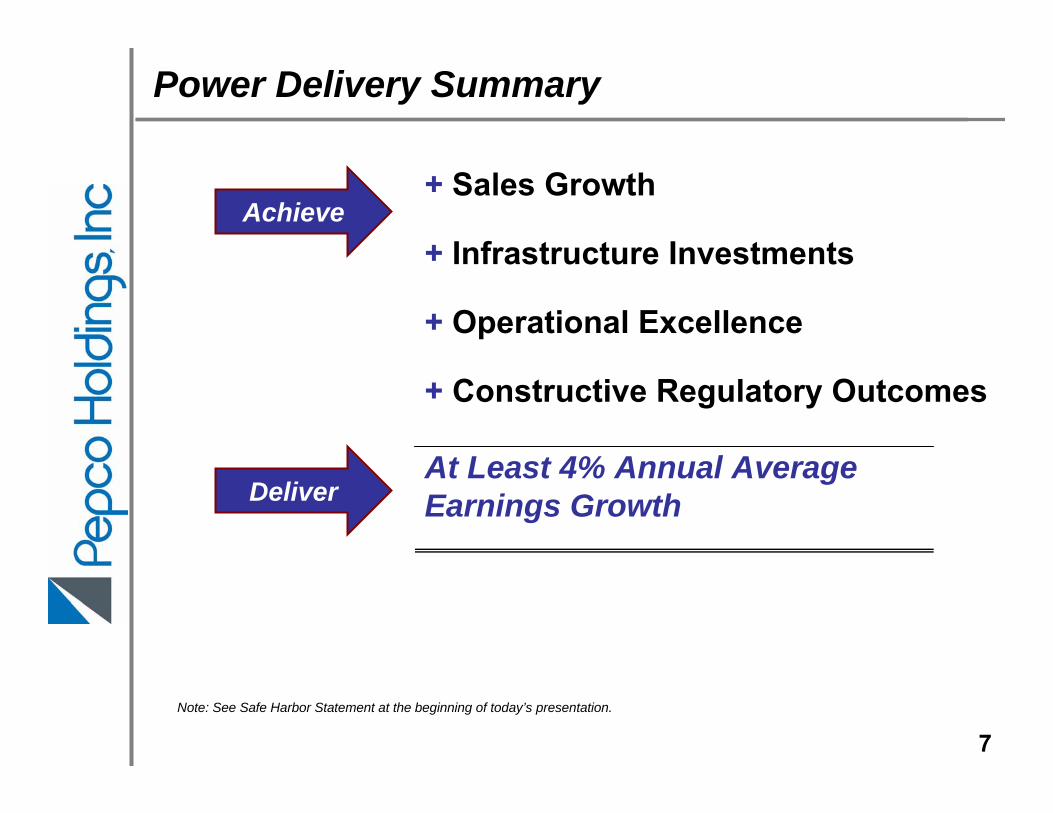
+ Sales Growth
+ Infrastructure Investments
+ Operational Excellence
+ Constructive Regulatory Outcomes
At Least 4% Annual AverageEarnings Growth
Power Delivery Summary
Deliver
Achieve
Note: See Safe Harbor Statement at the beginning of today’s presentation.
7
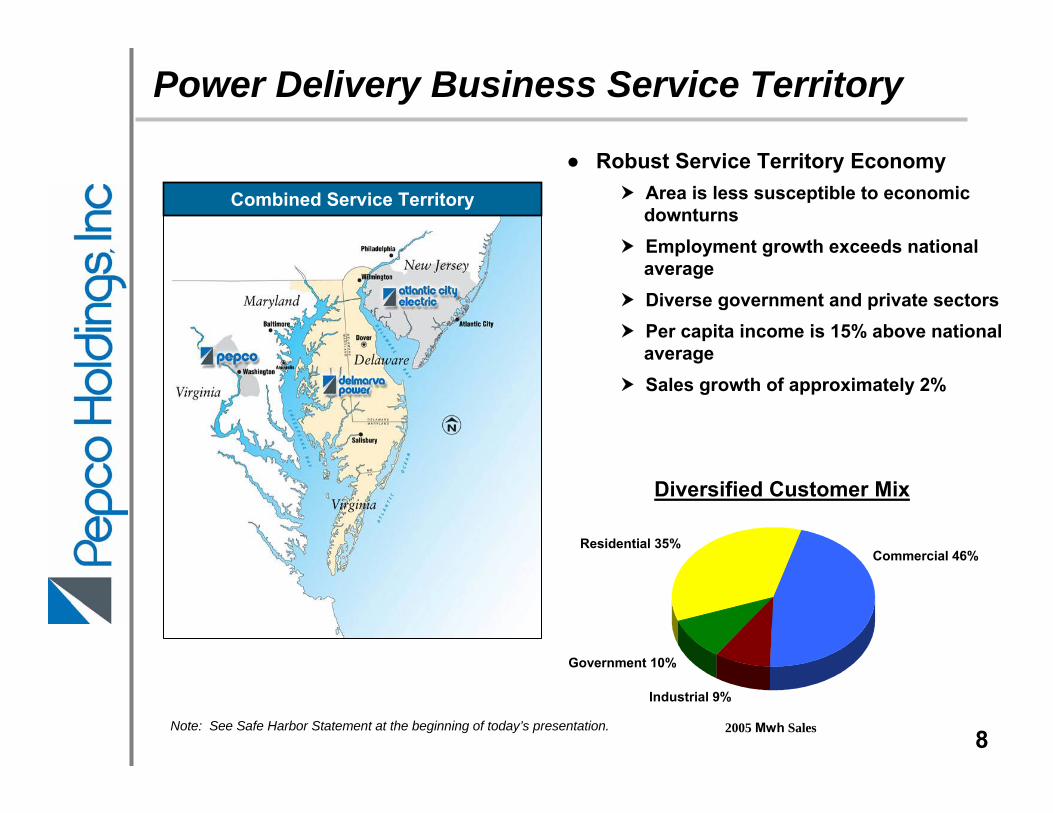
● Robust Service Territory EconomyArea is less susceptible to economic downturnsEmployment growth exceeds national averageDiverse government and private sectors Per capita income is 15% above national averageSales growth of approximately 2%
Power Delivery Business Service Territory
Commercial 46%
Combined Service Territory
Diversified Customer Mix
Residential 35%
Government 10%
Industrial 9%
2005 Mwh Sales Note: See Safe Harbor Statement at the beginning of today’s presentation.8
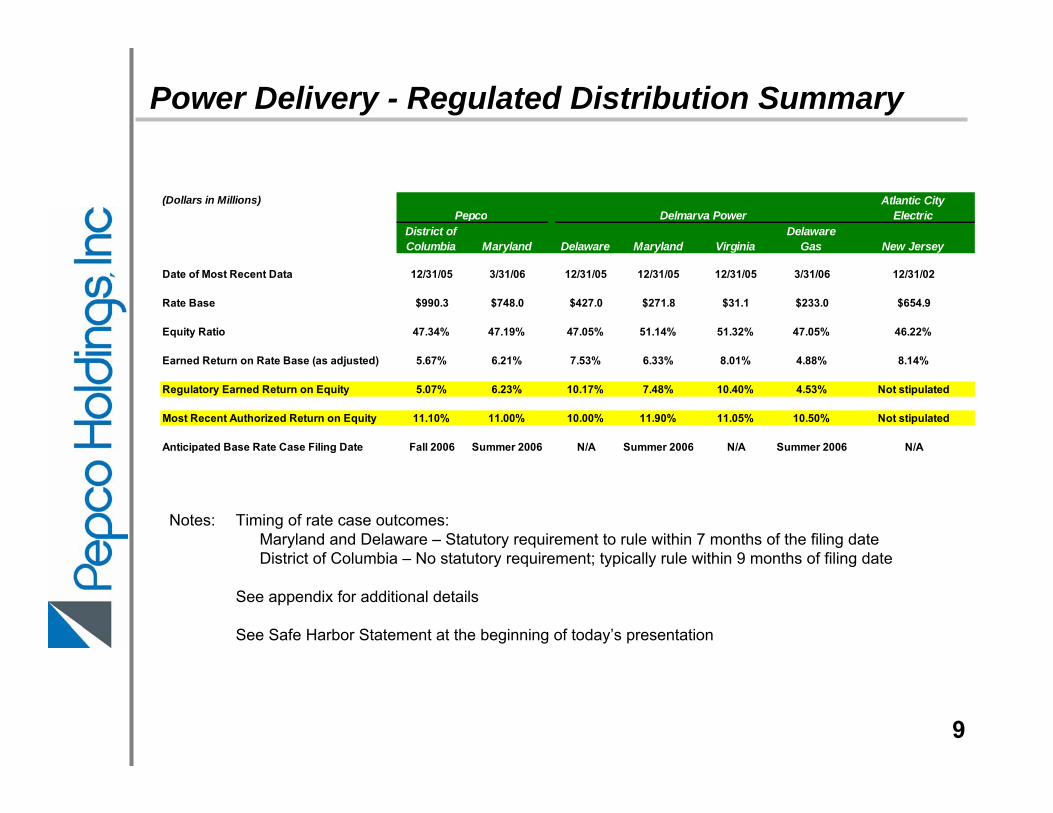
Power Delivery - Regulated Distribution Summary
(Dollars in Millions) Atlantic CityElectric
District of DelawareColumbia Maryland Delaware Maryland Virginia Gas New Jersey
Date of Most Recent Data 12/31/05 3/31/06 12/31/05 12/31/05 12/31/05 3/31/06 12/31/02
Rate Base $990.3 $748.0 $427.0 $271.8 $31.1 $233.0 $654.9 Equity Ratio 47.34% 47.19% 47.05% 51.14% 51.32% 47.05% 46.22%
Earned Return on Rate Base (as adjusted) 5.67% 6.21% 7.53% 6.33% 8.01% 4.88% 8.14%
Regulatory Earned Return on Equity 5.07% 6.23% 10.17% 7.48% 10.40% 4.53% Not stipulated
Most Recent Authorized Return on Equity 11.10% 11.00% 10.00% 11.90% 11.05% 10.50% Not stipulated
Anticipated Base Rate Case Filing Date Fall 2006 Summer 2006 N/A Summer 2006 N/A Summer 2006 N/A
Pepco Delmarva Power
9
Notes: Timing of rate case outcomes:Maryland and Delaware – Statutory requirement to rule within 7 months of the filing dateDistrict of Columbia – No statutory requirement; typically rule within 9 months of filing date
See appendix for additional details
See Safe Harbor Statement at the beginning of today’s presentation

● Requested $5.1 million annual increase in electric rates
$1.6 million* in distribution rates and $3.5 million transferred from distribution to supply rates
11% ROE
● Order effective May 1, 2006
Summary of Annual ImpactPre-tax Pre-tax
Net Earnings Cash FlowDistribution Rate Reduction $ (11.1) $ (11.1)Assignment of Costs to SOS Rates 4.9 4.9Depreciation Rates 3.1 -Misc. Tariff Adjustments 0.4 0.4
Total $ (2.7) $ (5.8)
10% ROE
* Includes $0.4 million for changes in collection and reconnect fees
Delmarva Power – Delaware Rate Case
10
● Settlement approved by the FERC April 2006
● ROE – 10.8% for existing facilities, 11.3% for new facilities put into service on or after January 1, 2006
● Rates effective June 1, 2006 and include a settlement adjustment and true-up for rates in effect since June 1, 2005
● 50% / 50% sharing of pole attachment revenue
● Projects projected to be in-service in the current year are reflected in current rates
● Transmission rate base at December 31, 2005 - $880 million
Transmission Formula Rate Filing
11
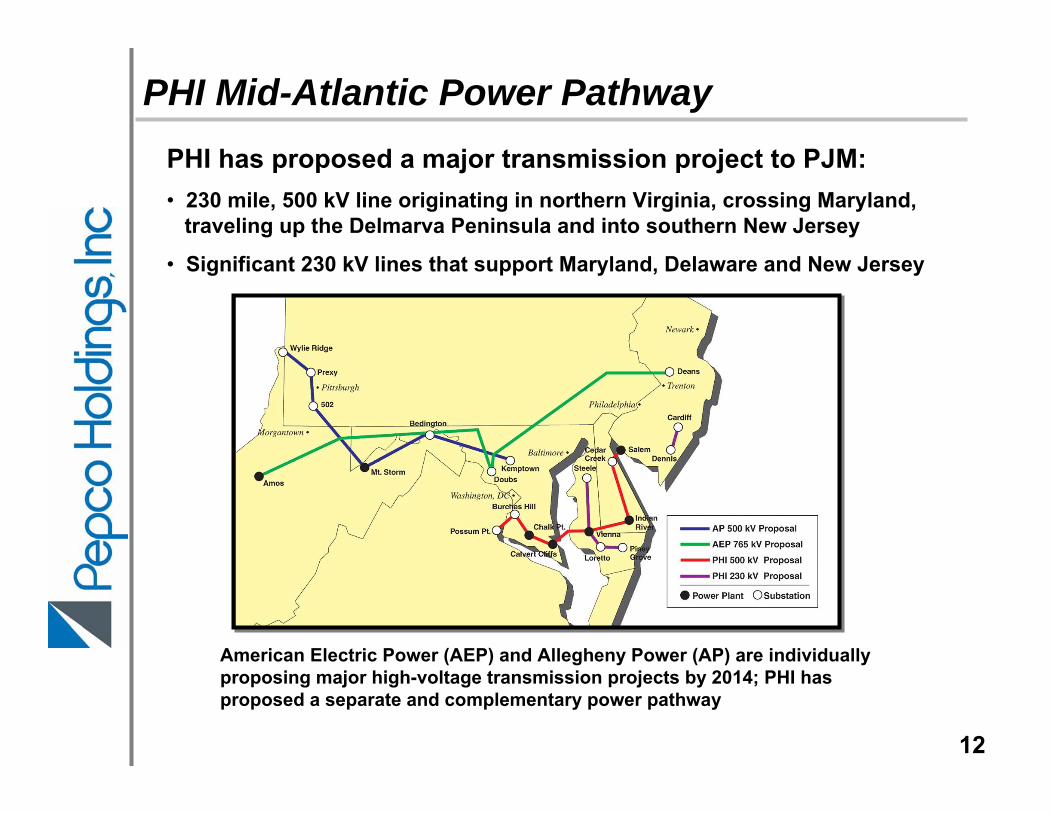
American Electric Power (AEP) and Allegheny Power (AP) are individually proposing major high-voltage transmission projects by 2014; PHI has proposed a separate and complementary power pathway
PHI Mid-Atlantic Power Pathway
12
PHI has proposed a major transmission project to PJM:• 230 mile, 500 kV line originating in northern Virginia, crossing Maryland,
traveling up the Delmarva Peninsula and into southern New Jersey
• Significant 230 kV lines that support Maryland, Delaware and New Jersey
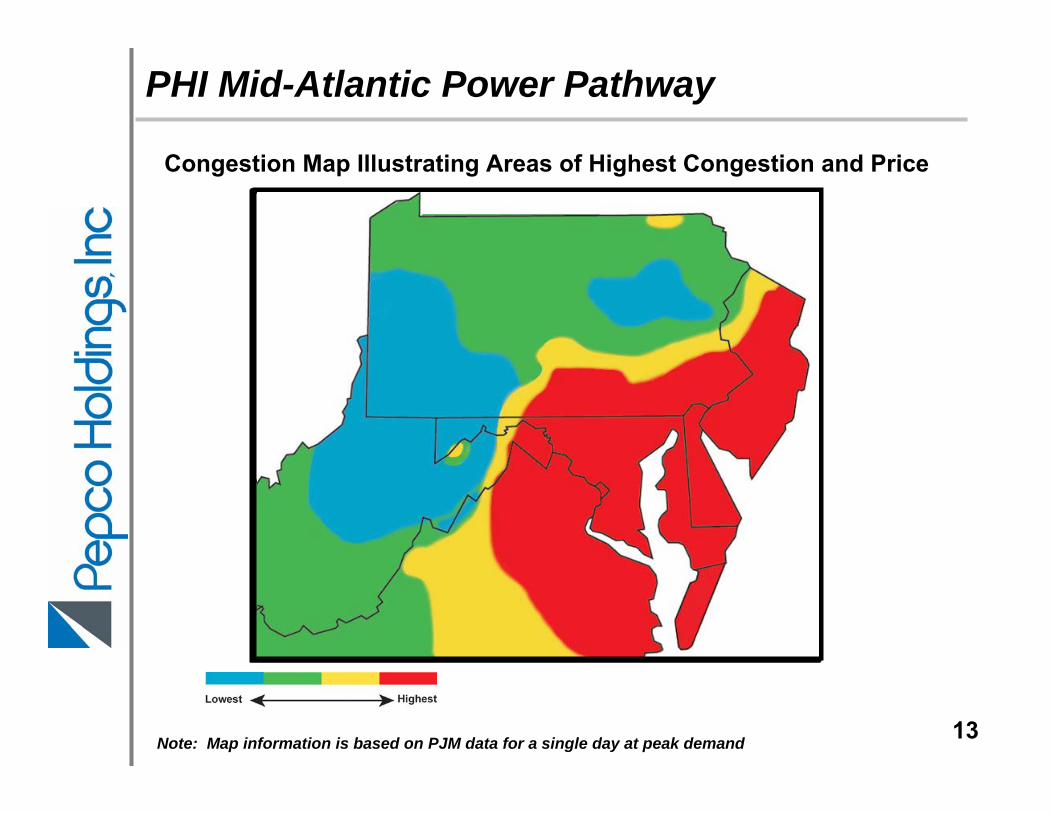
Congestion Map Illustrating Areas of Highest Congestion and Price
PHI Mid-Atlantic Power Pathway
Note: Map information is based on PJM data for a single day at peak demand 13
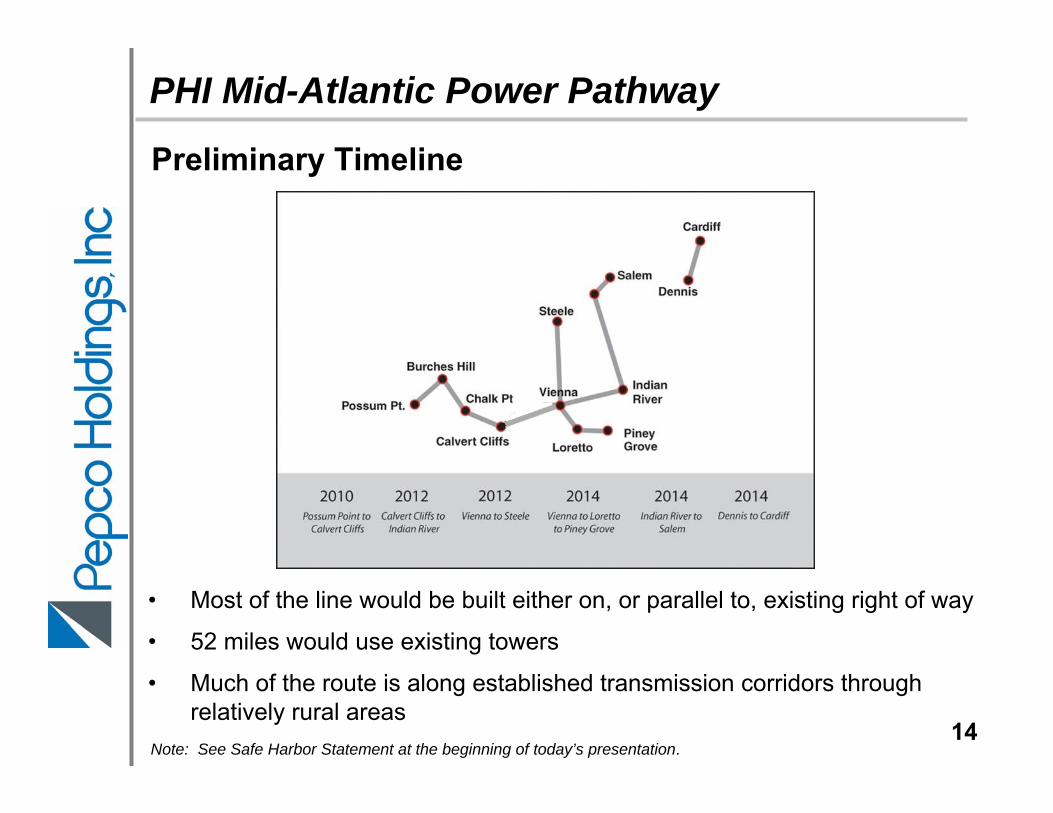
Preliminary Timeline
PHI Mid-Atlantic Power Pathway
• Most of the line would be built either on, or parallel to, existing right of way
• 52 miles would use existing towers
• Much of the route is along established transmission corridors through relatively rural areas
14Note: See Safe Harbor Statement at the beginning of today’s presentation.
PHI Mid-Atlantic Power Pathway
15Note: See Safe Harbor Statement at the beginning of today’s presentation.
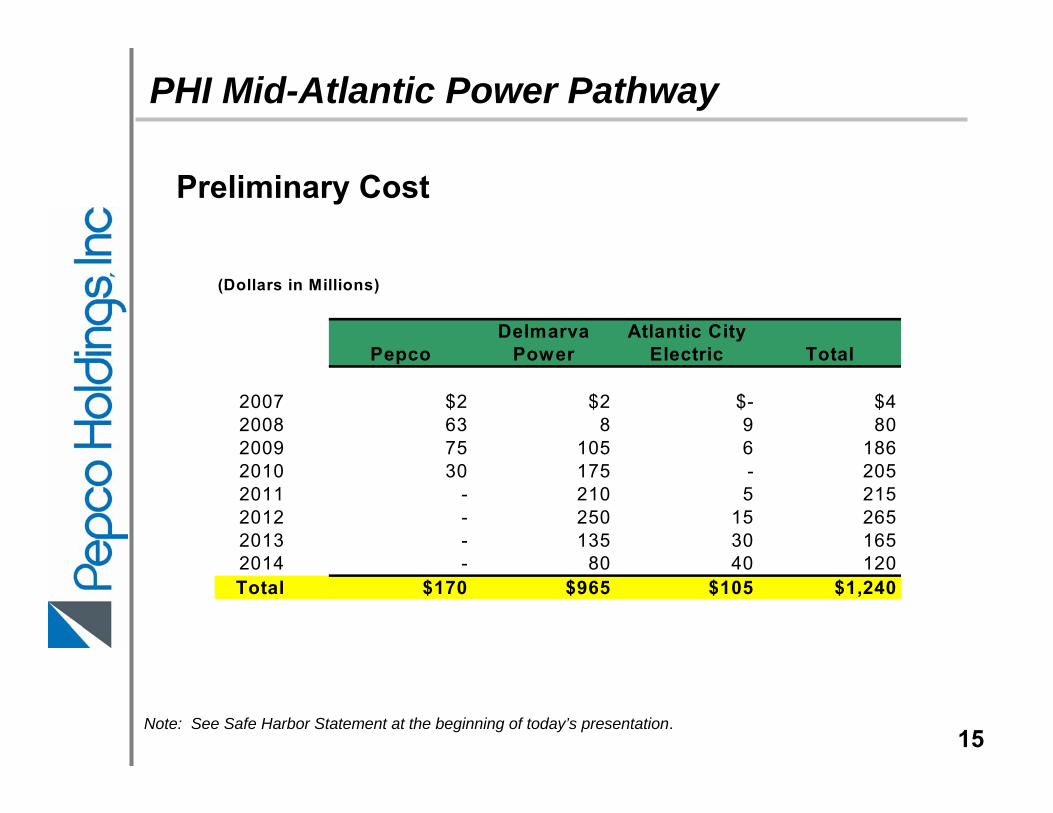
Preliminary Cost
(Dollars in Millions)
Delmarva Atlantic CityPepco Power Electric Total
2007 $2 $2 $- $42008 63 8 9 802009 75 105 6 1862010 30 175 - 2052011 - 210 5 2152012 - 250 15 2652013 - 135 30 1652014 - 80 40 120Total $170 $965 $105 $1,240
Financial Impacts● Utility Operations:
– Project total of $1.2 billion– AFUDC earned during construction– FERC authorized ROE is 11.3% for facilities put into service
on or after January 1, 2006– Potential incremental after-tax earnings estimated at $60 - $70
million (based on 45% - 50% equity ratio)1
● Conectiv Energy:– Modest impact projected; after-tax annual earnings decrease
preliminarily estimated at $10 million upon completion of the project, should decline over time as load grows
– Conectiv Energy will have time to assess the market and adjust its plans as this long-term project develops
1) Assumes PJM approval of the project as proposed. Represents first year earnings post project completion in 2014. Actual incremental earnings will be realized in stages as sections of the line are placed into service. Depreciation of the investment will decrease earnings over time.
Note: See Safe Harbor Statement at the beginning of today’s presentation.
PHI Mid-Atlantic Power Pathway
16
Benefits of the PHI Proposal
● Improves reliability for the Washington, D.C./Baltimore metropolitan area, Delmarva Peninsula and New Jersey region
● Greatly reduces congestion problems in the region
● Enables greater access to affordable generation sources
● Encourages new generation construction by providing a robust transmission infrastructure
● Strengthens the system by complementing ongoing transmission upgrades to the west, improving reliability and creating greater redundancy
PHI Mid-Atlantic Power Pathway
17
Standard Offer Service
18
Delaware
● Supply pricing became market based 5/1/06 for Delmarva Power customers
● 59% total bill increase for residential customers effective 5/1/06
● Deferral program in place– Three step phase in of rates over 13 months –
• 15% on 5/1/06, 25% on 1/1/07, then full increase on 6/1/07
– 53% of eligible customer have “opted-out” as of 8/2/06
– Recovery of deferral balance, excluding interest costs, over 17 months, beginning 1/1/08
– At a 47% participation rate –• Estimated deferral balance will build up to approximately $51.4
million• Estimated after-tax interest expense of approximately $3.0
million incurred over the 37-month rate deferral and recovery period
Standard Offer Service
19
Maryland
● Supply pricing became market based 7/1/04 for Pepco and DelmarvaPower customers
● 35% - 39% total bill increase for residential customers effective 6/1/06
● Deferral program in place– Three step phase in of rates over 12 months –
• 15% on 6/1/06,15.7% on 3/1/07, then full increase on 6/1/07
– 2% of eligible Pepco and 1% of eligible Delmarva customers have “opted-in”
– Recovery of deferral balance, excluding interest costs, over 18 months, beginning 6/1/07
– Estimated deferral balance will build up to approximately $1.6 million
● Bill enacted by the General Assembly on 6/15/06 offsets a portion of the margin received for residential standard offer service; estimated after-tax earnings impact is a reduction of $0.9 million over the 30-month rate deferral and recovery period
Standard Offer Service
20
Virginia
● Delmarva Power completed a competitive bid procedure to fulfill all of its Virginia default supply obligations for the period June 2006 through May 2007
● Delmarva Power filed a request for a rate increase with the Commission to recover its higher cost of energy established by the competitive bid procedure (would have resulted in a 43% total bill increase for residential customers)
● Order issued by the Commission on June 19, 2006:– Authorizes a fuel factor that will result in a 25% total bill increase for
residential customers– Authorized increase is based on a fuel index procedure that was put
into place when Delmarva Power sold its generating plants in 2000
● Estimated after-tax earnings impact is a reduction of $3.6 million in 2006 and $2.0 million in 2007
Conectiv Energy - Business Overview
Hay Road – 1,066 MW’s Bethlehem – 1,092 MW’s
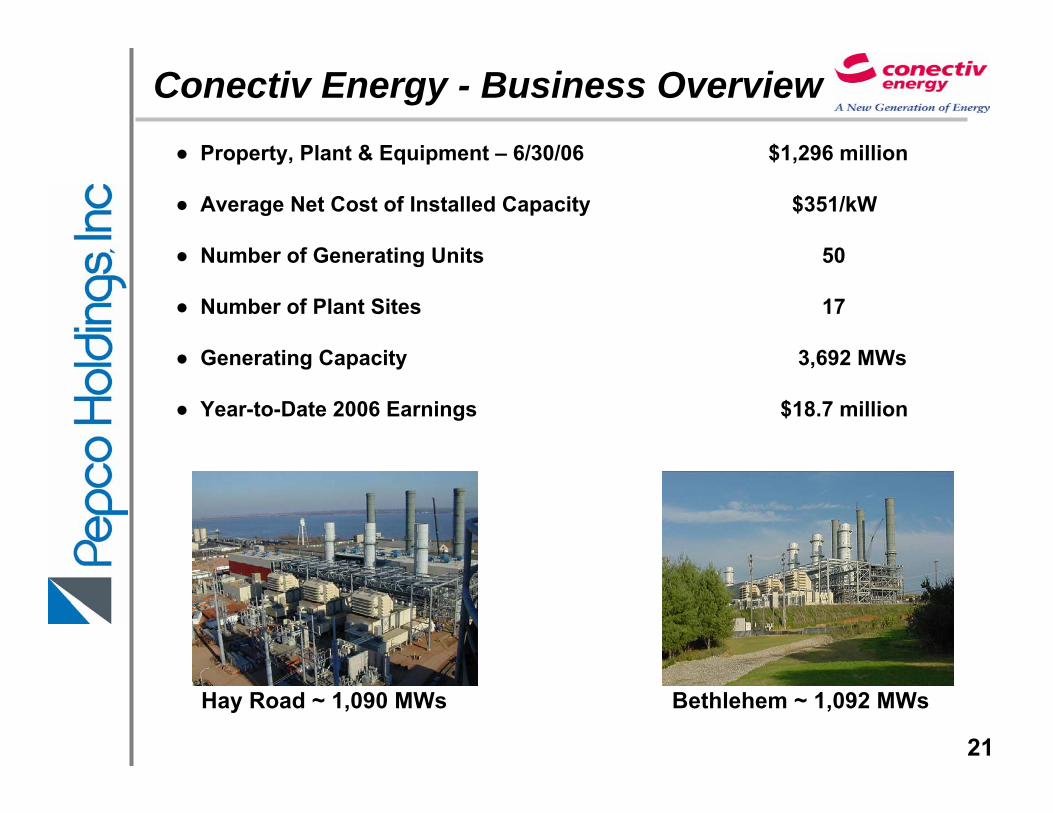
● Property, Plant & Equipment – 6/30/06 $1,296 million
● Average Net Cost of Installed Capacity $351/kW
● Number of Generating Units 50
● Number of Plant Sites 17
● Generating Capacity 3,692 MWs
● Year-to-Date 2006 Earnings $18.7 million
Hay Road ~ 1,090 MWs Bethlehem ~ 1,092 MWs
21
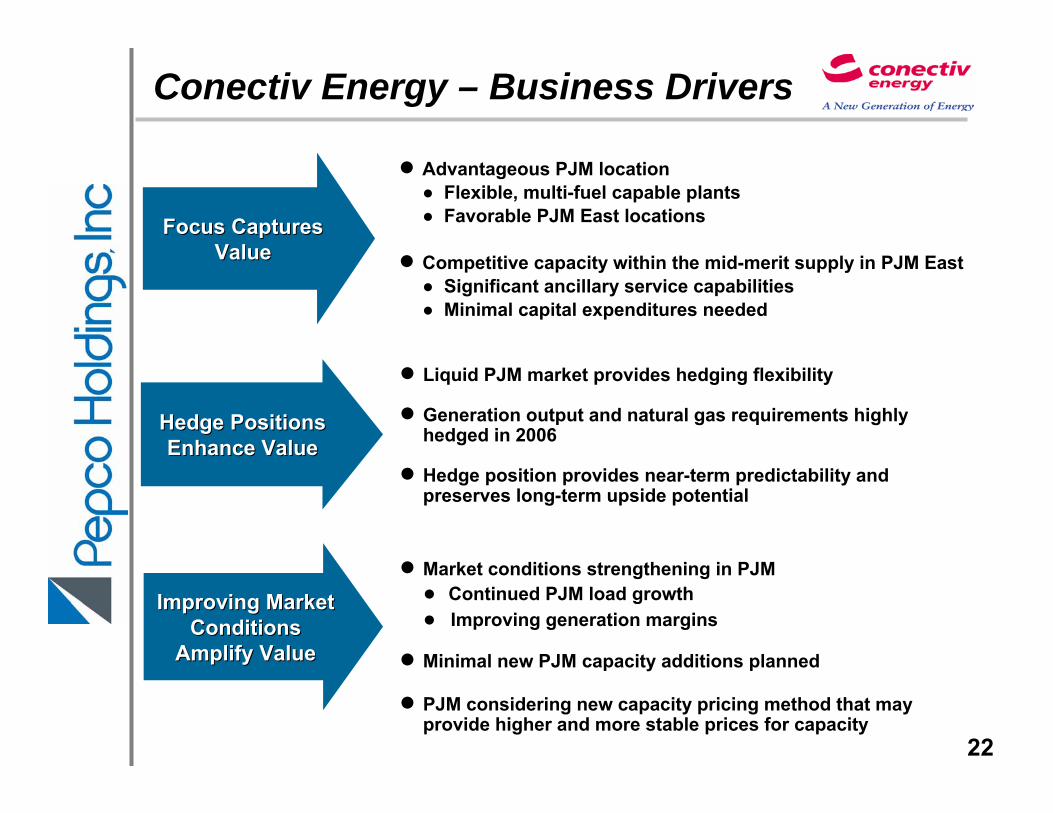
Conectiv Energy – Business Drivers
● Liquid PJM market provides hedging flexibility
● Generation output and natural gas requirements highly hedged in 2006
● Hedge position provides near-term predictability and preserves long-term upside potential
Hedge Positions Hedge Positions Enhance ValueEnhance Value
Improving Market Improving Market Conditions Conditions
Amplify ValueAmplify Value
● Market conditions strengthening in PJM● Continued PJM load growth ● Improving generation margins
● Minimal new PJM capacity additions planned
● PJM considering new capacity pricing method that may provide higher and more stable prices for capacity
Focus Captures Focus Captures ValueValue
● Advantageous PJM location● Flexible, multi-fuel capable plants● Favorable PJM East locations
● Competitive capacity within the mid-merit supply in PJM East● Significant ancillary service capabilities● Minimal capital expenditures needed
22
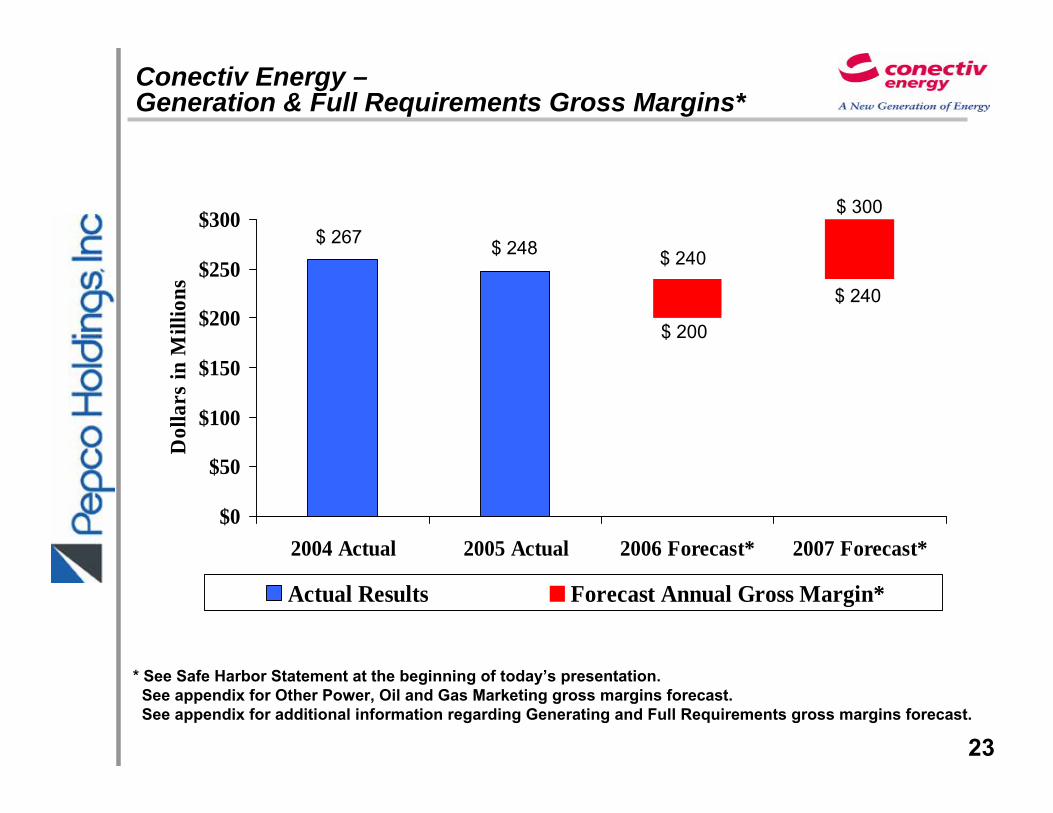
Conectiv Energy –Generation & Full Requirements Gross Margins*
$0
$50
$100
$150
$200
$250
$300
2004 Actual 2005 Actual 2006 Forecast* 2007 Forecast*
Dol
lars
in M
illio
ns
Actual Results Forecast Annual Gross Margin*
$ 267 $ 248 $ 240
$ 200
$ 300
$ 240
* See Safe Harbor Statement at the beginning of today’s presentation. See appendix for Other Power, Oil and Gas Marketing gross margins forecast.See appendix for additional information regarding Generating and Full Requirements gross margins forecast.
23
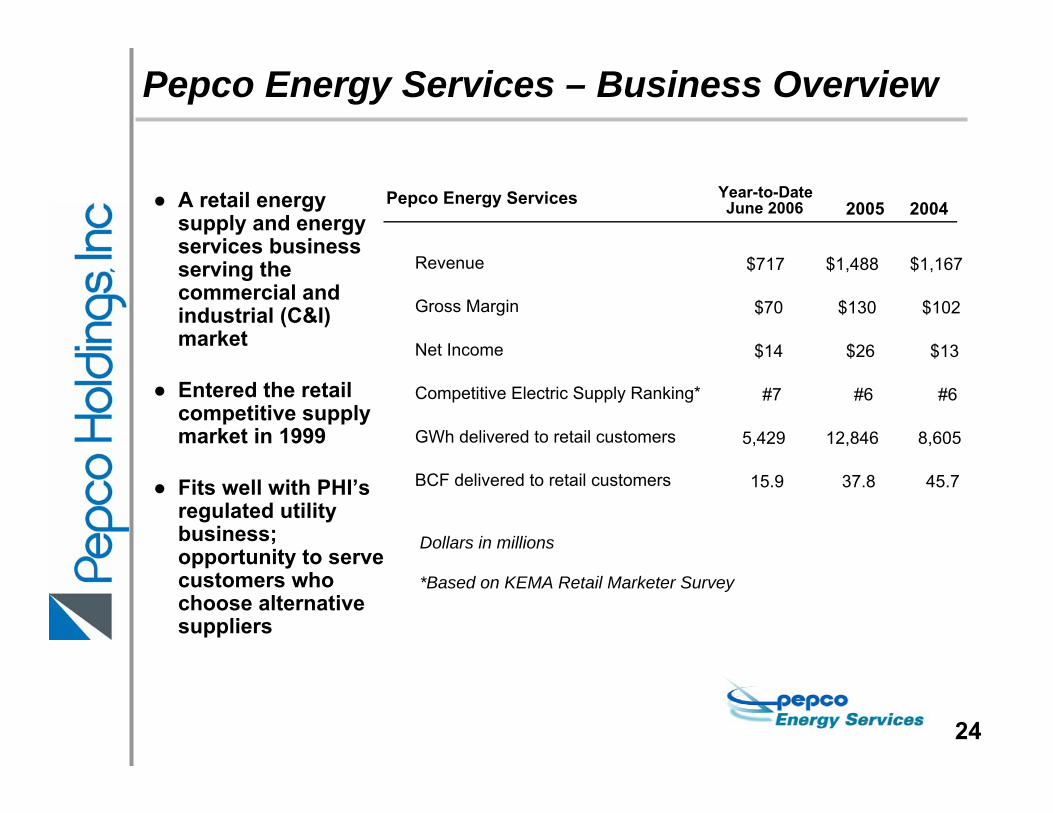
Pepco Energy Services – Business Overview
24
● A retail energy supply and energy services business serving the commercial and industrial (C&I) market
● Entered the retail competitive supply market in 1999
● Fits well with PHI’sregulated utility business; opportunity to serve customers who choose alternative suppliers
Revenue $717 $1,488 $1,167
Gross Margin $70 $130 $102
Net Income $14 $26 $13
Competitive Electric Supply Ranking* #7 #6 #6
GWh delivered to retail customers 5,429 12,846 8,605
BCF delivered to retail customers 15.9 37.8 45.7
Dollars in millions
*Based on KEMA Retail Marketer Survey
Year-to-DateJune 2006 2005 2004Pepco Energy Services
Pepco Energy Services Competitive Edge
● Relationship-based Sales– Not brand dependent– 14 local sales offices
● Conservative Supply Acquisition– Manage toward a flat book; no speculative trading
● Innovative Products– Strong back office allows for tailored billing options– Contract optionality creates value for both PES and customer by taking
advantage of changes in wholesale versus SOS rates– ESCO business unit provides additional services to customers
● Strong Earnings Growth– 2005 earnings doubled versus 2004– 2005 results indicative of near-term future earnings– Going forward, earnings will depend on regulatory and market conditions
Note: See Safe Harbor Statement at the beginning of today’s presentation.
25
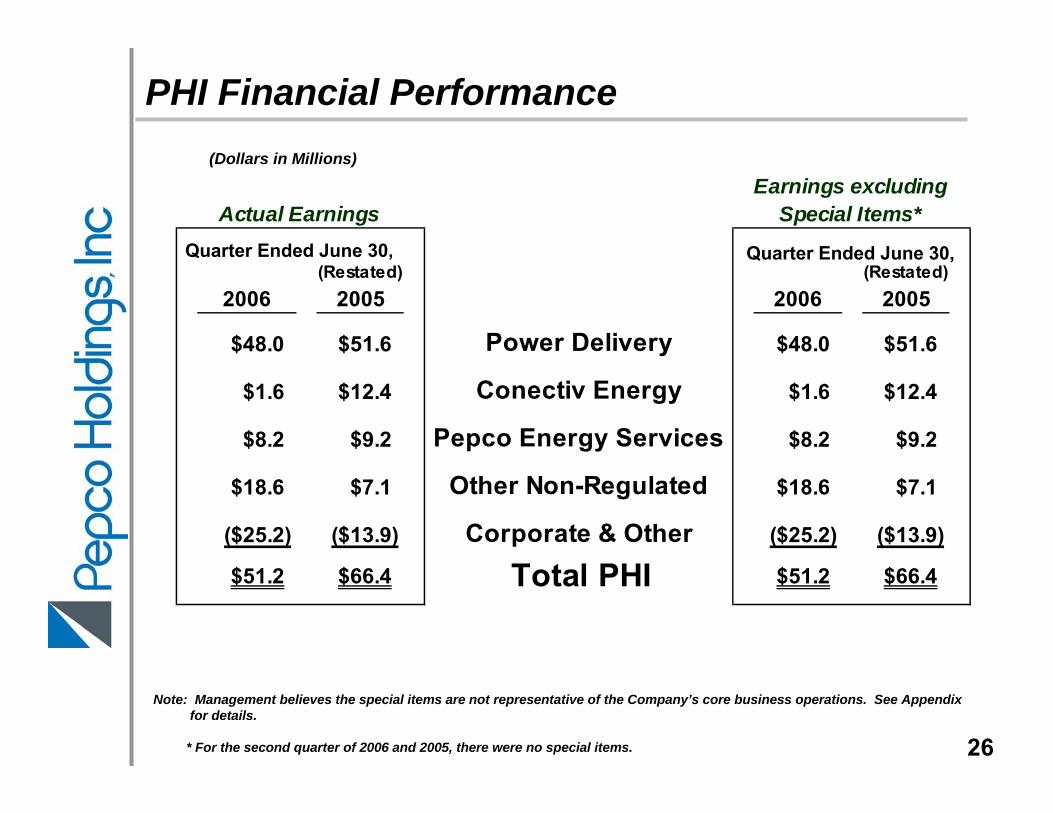
(Restated) (Restated)2006 2005 2006 2005
$48.0 $51.6 Power Delivery $48.0 $51.6
$1.6 $12.4 Conectiv Energy $1.6 $12.4
$8.2 $9.2 Pepco Energy Services $8.2 $9.2
$18.6 $7.1 Other Non-Regulated $18.6 $7.1
($25.2) ($13.9) Corporate & Other ($25.2) ($13.9)
Earnings excludingActual Earnings Special Items*
$51.2 $66.4$51.2 $66.4 Total PHI
Note: Management believes the special items are not representative of the Company’s core business operations. See Appendix for details.
* For the second quarter of 2006 and 2005, there were no special items.
(Dollars in Millions)
PHI Financial Performance
26
Quarter Ended June 30, Quarter Ended June 30,
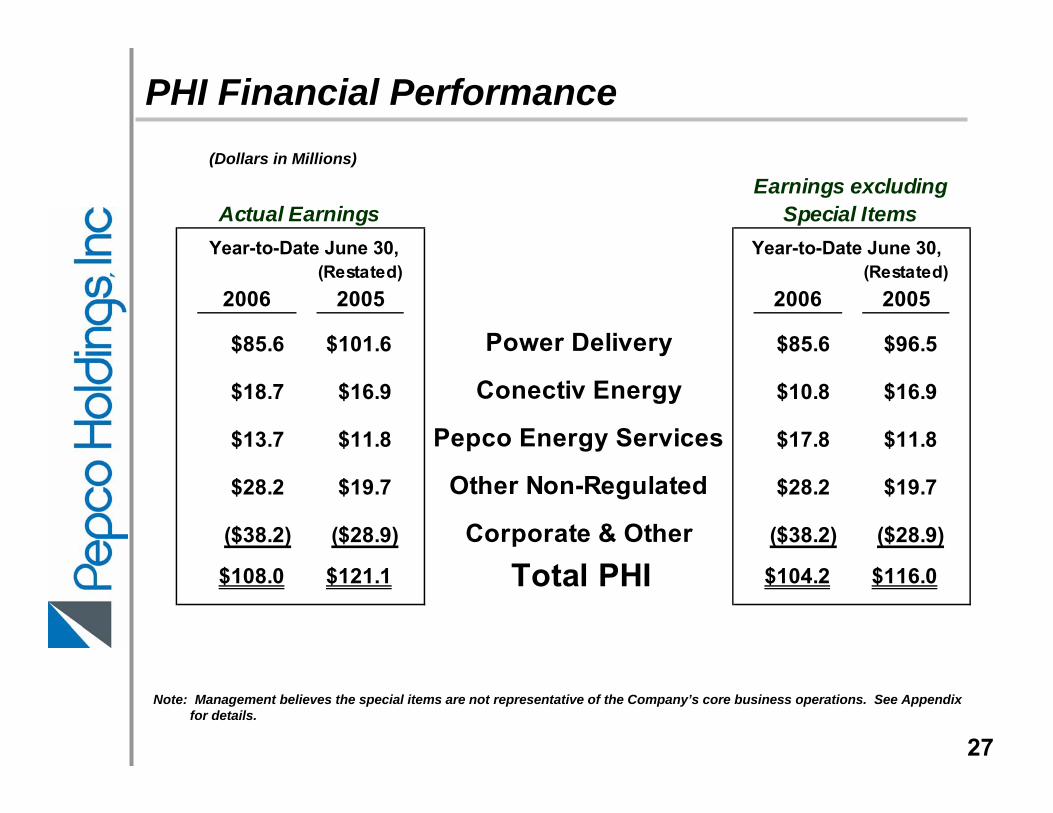
(Restated) (Restated)2006 2005 2006 2005
$85.6 $101.6 Power Delivery $85.6 $96.5
$18.7 $16.9 Conectiv Energy $10.8 $16.9
$13.7 $11.8 Pepco Energy Services $17.8 $11.8
$28.2 $19.7 Other Non-Regulated $28.2 $19.7
($38.2) ($28.9) Corporate & Other ($38.2) ($28.9)
Earnings excludingActual Earnings Special Items
$104.2 $116.0$108.0 $121.1 Total PHI
Note: Management believes the special items are not representative of the Company’s core business operations. See Appendix for details.
(Dollars in Millions)
PHI Financial Performance
27
Year-to-Date June 30, Year-to-Date June 30,
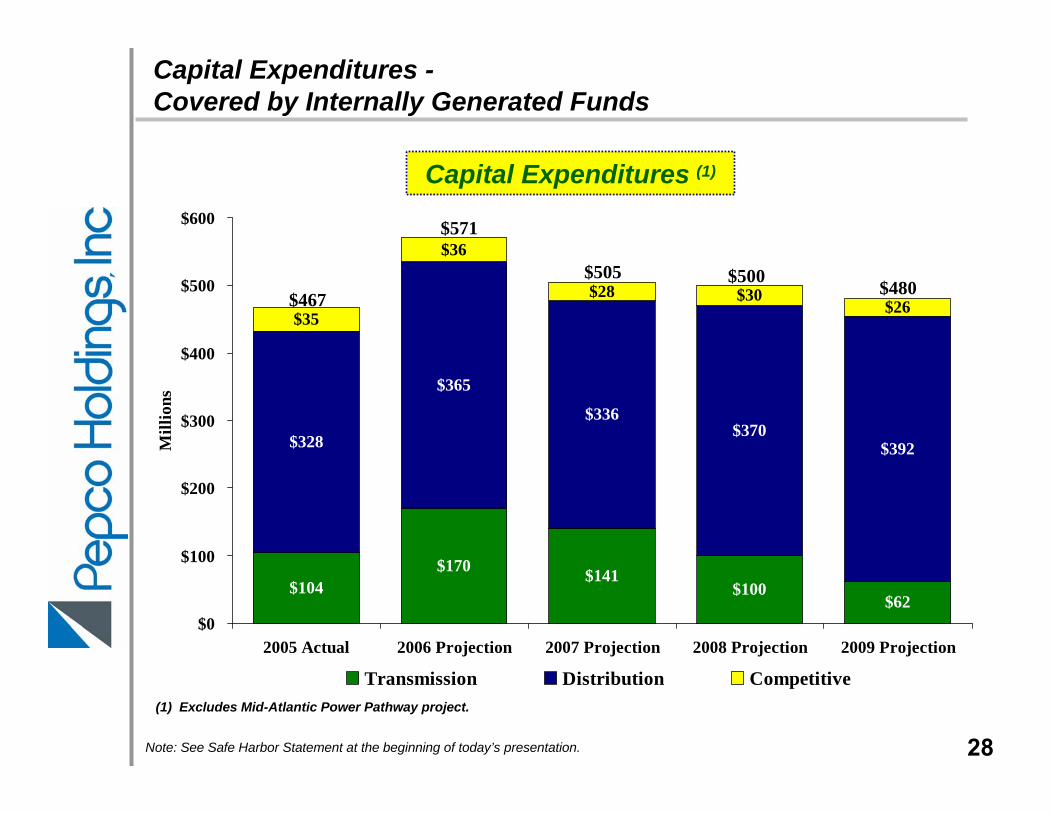
$104$170 $141
$100$62
$328
$365
$336$370
$392
$35
$36
$28 $30$26
$0
$100
$200
$300
$400
$500
$600
2005 Actual 2006 Projection 2007 Projection 2008 Projection 2009 Projection
Mill
ions
Transmission Distribution Competitive
Capital Expenditures (1)
Note: See Safe Harbor Statement at the beginning of today’s presentation.
$467
$571
$505 $500 $480
Capital Expenditures -Covered by Internally Generated Funds
28
(1) Excludes Mid-Atlantic Power Pathway project.
Notes:1) Other debt includes capital lease obligations ($135.4M), Company Obligated Mandatorily Redeemable Preferred Securities of Subsidiary Trust which holds Parent Junior
Subordinated Debentures ($290.0M), Mandatorily Redeemable Serial Preferred Stock ($47.5M), Serial Preferred Stock ($63.2M), Short-term debt ($1,362.4M) and Long-term debt ($4,287.5M).
2) Other debt includes capital lease obligations ($131.2M), Company Obligated Mandatorily Redeemable Preferred Securities of Subsidiary Trust which holds solely Parent Junior Subordinated Debentures ($98.0M), Mandatorily Redeemable Serial Preferred Stock ($45.0M), Serial Preferred Stock ($63.2M), Short-term debt ($872.4M) and Long-term debt ($4,588.9M).
3) Other debt includes capital lease obligations ($127.0M), Serial Preferred Stock ($54.9M), Short-term debt ($802.5M) and Long-term debt ($4,362.1M).4) Other debt includes capital lease obligations ($121.9M), Serial Preferred Stock ($45.9M), Short-term debt ($594.3M) and Long-term debt ($4,202.9M).5) Total capitalization excludes Transition Bond Debt and includes Pepco Energy Services’ Project Debt.
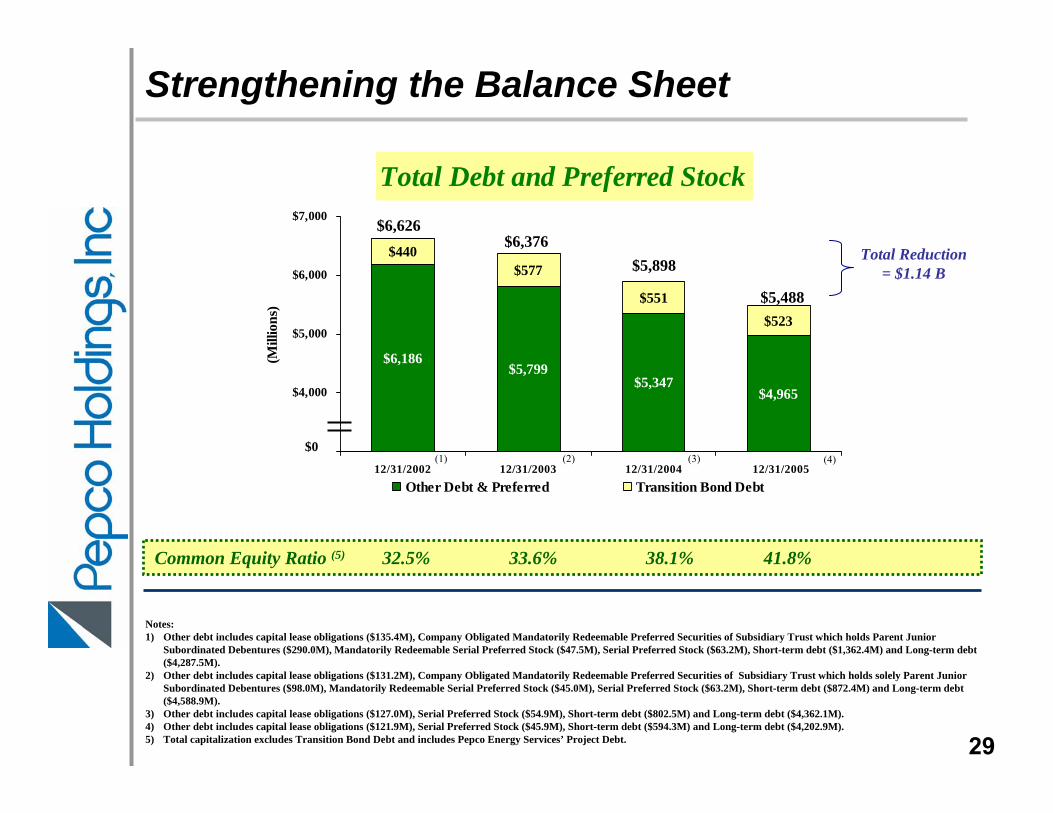
Common Equity Ratio (5) 32.5% 33.6% 38.1% 41.8%
Strengthening the Balance Sheet
Total Debt and Preferred Stock
$6,186$5,799
$5,347$4,965
$440$577
$551$523
$3,000
$4,000
$5,000
$6,000
$7,000
12/31/2002 12/31/2003 12/31/2004 12/31/2005
(Mill
ions
)
Other Debt & Preferred Transition Bond Debt
$6,626$6,376
$5,898
$5,488
Total Reduction= $1.14 B
$0(1) (2) (3) (4)
29
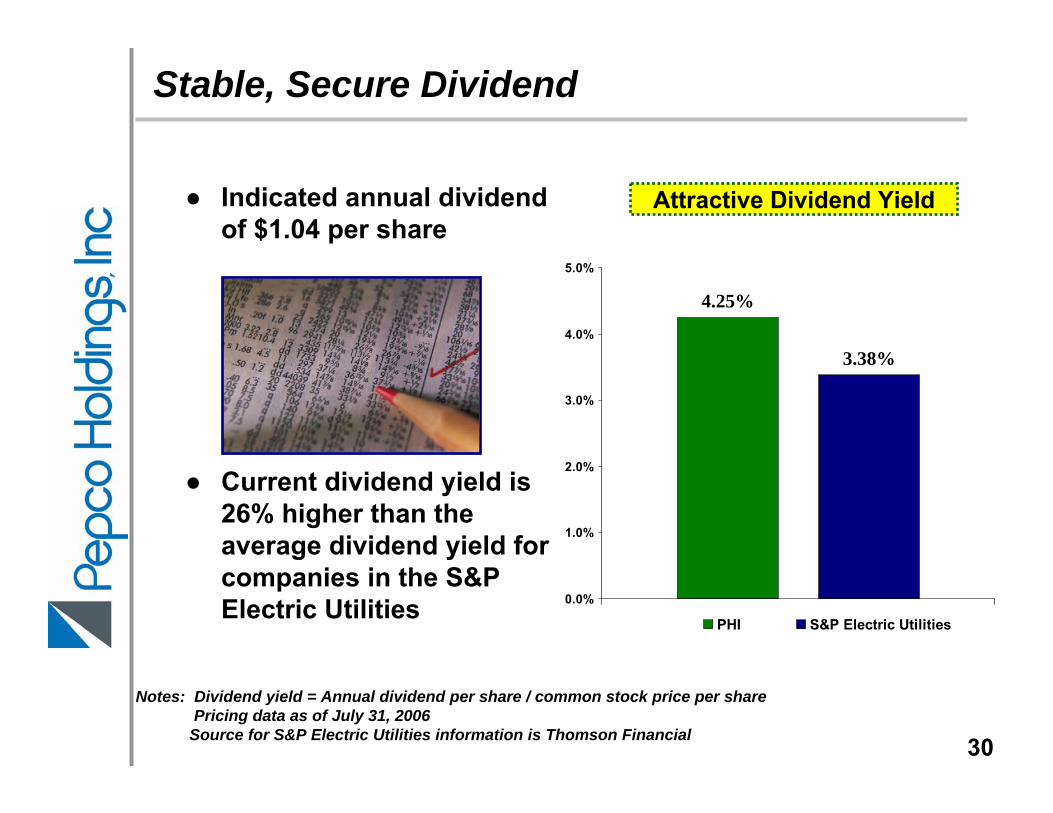
● Indicated annual dividend of $1.04 per share
● Current dividend yield is 26% higher than the average dividend yield for companies in the S&P Electric Utilities
Notes: Dividend yield = Annual dividend per share / common stock price per sharePricing data as of July 31, 2006
Source for S&P Electric Utilities information is Thomson Financial
Attractive Dividend Yield
Stable, Secure Dividend
4.25%
3.38%
0.0%
1.0%
2.0%
3.0%
4.0%
5.0%
PHI S&P Electric Utilities
30
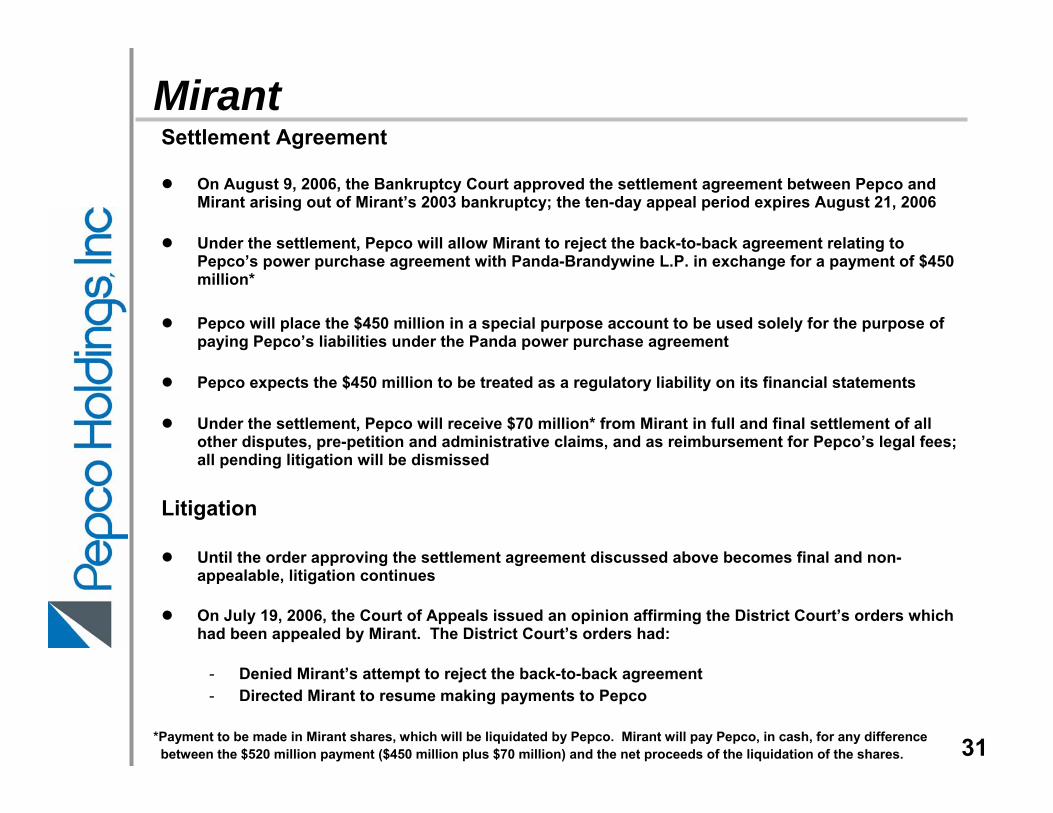
MirantSettlement Agreement
On August 9, 2006, the Bankruptcy Court approved the settlement agreement between Pepco and Mirant arising out of Mirant’s 2003 bankruptcy; the ten-day appeal period expires August 21, 2006
Under the settlement, Pepco will allow Mirant to reject the back-to-back agreement relating to Pepco’s power purchase agreement with Panda-Brandywine L.P. in exchange for a payment of $450 million*
Pepco will place the $450 million in a special purpose account to be used solely for the purpose of paying Pepco’s liabilities under the Panda power purchase agreement
Pepco expects the $450 million to be treated as a regulatory liability on its financial statements
Under the settlement, Pepco will receive $70 million* from Mirant in full and final settlement of all other disputes, pre-petition and administrative claims, and as reimbursement for Pepco’s legal fees; all pending litigation will be dismissed
Litigation
Until the order approving the settlement agreement discussed above becomes final and non-appealable, litigation continues
On July 19, 2006, the Court of Appeals issued an opinion affirming the District Court’s orders which had been appealed by Mirant. The District Court’s orders had:
- Denied Mirant’s attempt to reject the back-to-back agreement- Directed Mirant to resume making payments to Pepco
31*Payment to be made in Mirant shares, which will be liquidated by Pepco. Mirant will pay Pepco, in cash, for any differencebetween the $520 million payment ($450 million plus $70 million) and the net proceeds of the liquidation of the shares.
● Growing regulated utility earnings base with incremental earnings from competitive energy businesses
● Robust cash flow supports attractive dividend rate and provides cash for growth investments
● On-going strengthening of the balance sheet
● We’ve delivered on our commitments
Why Invest in PHI ?
Note: See Safe Harbor Statement at the beginning of today’s presentation.32

Appendix
33
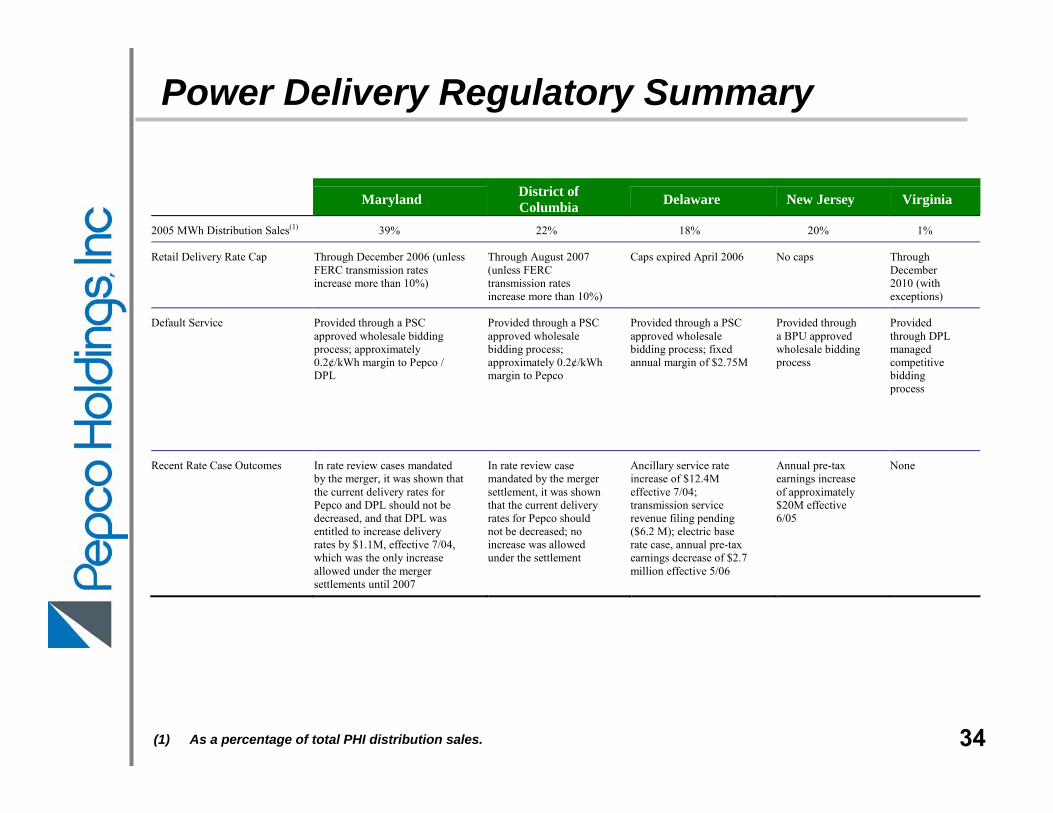
Maryland District of Columbia Delaware New Jersey Virginia
2005 MWh Distribution Sales(1) 39% 22% 18% 20% 1%
Retail Delivery Rate Cap Through December 2006 (unless FERC transmission rates increase more than 10%)
Through August 2007 (unless FERC transmission rates increase more than 10%)
Caps expired April 2006 No caps Through December 2010 (with exceptions)
Default Service
Provided through a PSC approved wholesale bidding process; approximately 0.2¢/kWh margin to Pepco / DPL
Provided through a PSC approved wholesale bidding process; approximately 0.2¢/kWh margin to Pepco
Provided through a PSC approved wholesale bidding process; fixed annual margin of $2.75M
Provided through a BPU approved wholesale bidding process
Provided through DPL managed competitive bidding process
Recent Rate Case Outcomes In rate review cases mandated by the merger, it was shown that the current delivery rates for Pepco and DPL should not be decreased, and that DPL was entitled to increase delivery rates by $1.1M, effective 7/04, which was the only increase allowed under the merger settlements until 2007
In rate review case mandated by the merger settlement, it was shown that the current delivery rates for Pepco should not be decreased; no increase was allowed under the settlement
Ancillary service rate increase of $12.4M effective 7/04; transmission service revenue filing pending ($6.2 M); electric base rate case, annual pre-tax earnings decrease of $2.7 million effective 5/06
Annual pre-tax earnings increase of approximately $20M effective 6/05
None
Power Delivery Regulatory Summary
(1) As a percentage of total PHI distribution sales. 34
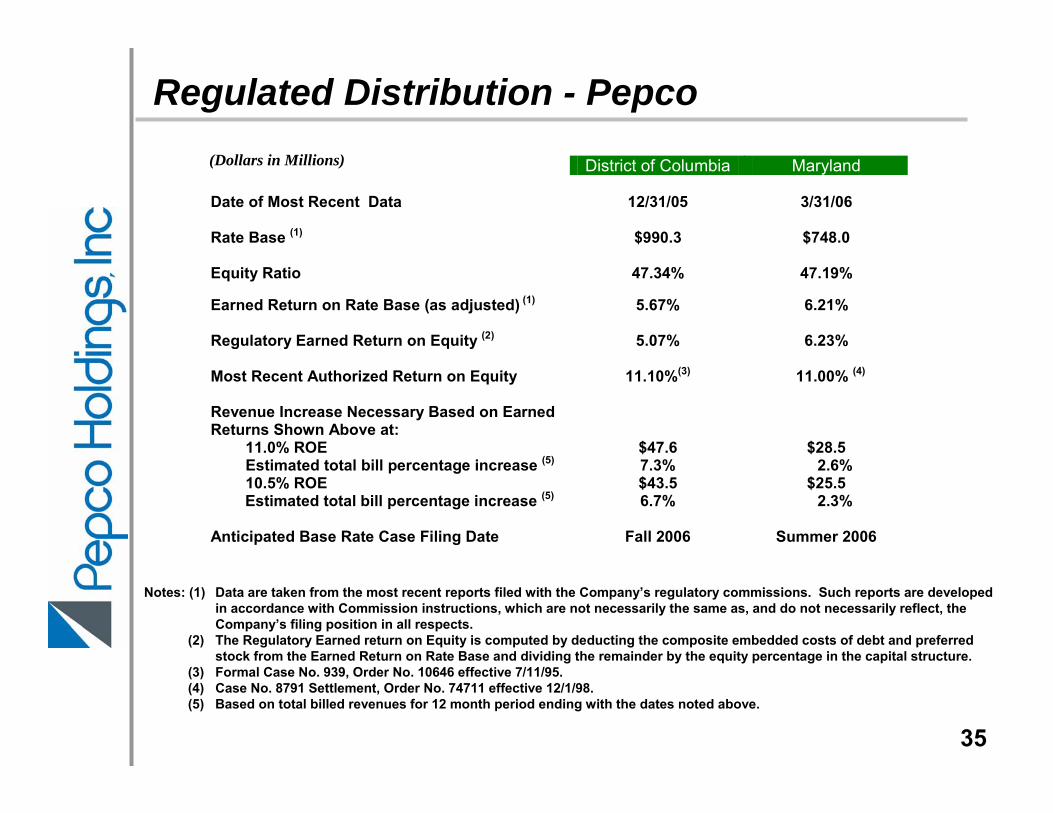
(Dollars in Millions) District of Columbia Maryland Date of Most Recent Data
12/31/05
3/31/06
Rate Base (1) $990.3 $748.0
Equity Ratio 47.34% 47.19%
Earned Return on Rate Base (as adjusted) (1) 5.67% 6.21%
Regulatory Earned Return on Equity (2) Most Recent Authorized Return on Equity
5.07%
11.10%(3)
6.23%
11.00% (4)
Revenue Increase Necessary Based on Earned Returns Shown Above at:
11.0% ROE $47.6 $28.5 Estimated total bill percentage increase (5) 10.5% ROE
7.3% $43.5
2.6% $25.5
Estimated total bill percentage increase (5) Anticipated Base Rate Case Filing Date
6.7%
Fall 2006
2.3%
Summer 2006
Notes: (1) Data are taken from the most recent reports filed with the Company’s regulatory commissions. Such reports are developed in accordance with Commission instructions, which are not necessarily the same as, and do not necessarily reflect, the Company’s filing position in all respects.
(2) The Regulatory Earned return on Equity is computed by deducting the composite embedded costs of debt and preferred stock from the Earned Return on Rate Base and dividing the remainder by the equity percentage in the capital structure.
(3) Formal Case No. 939, Order No. 10646 effective 7/11/95.(4) Case No. 8791 Settlement, Order No. 74711 effective 12/1/98.(5) Based on total billed revenues for 12 month period ending with the dates noted above.
Regulated Distribution - Pepco
35
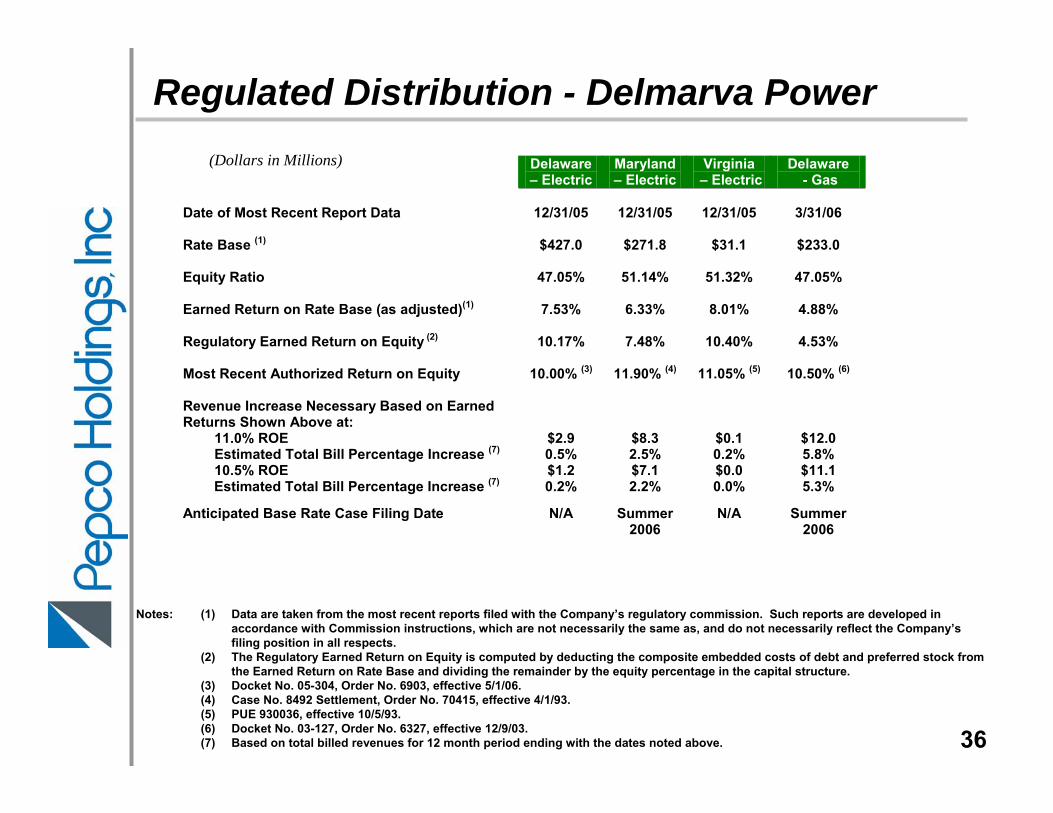
Delaware – Electric
Maryland – Electric
Virginia – Electric
Delaware - Gas
Date of Most Recent Report Data
12/31/05
12/31/05
12/31/05
3/31/06
Rate Base (1) $427.0 $271.8
$31.1 $233.0
Equity Ratio
47.05% 51.14% 51.32% 47.05%
Earned Return on Rate Base (as adjusted)(1) 7.53% 6.33%
8.01% 4.88%
Regulatory Earned Return on Equity (2) 10.17% 7.48%
10.40% 4.53%
Most Recent Authorized Return on Equity Revenue Increase Necessary Based on Earned Returns Shown Above at:
10.00% (3) 11.90% (4) 11.05% (5) 10.50% (6)
11.0% ROE $2.9 $8.3 $0.1 $12.0 Estimated Total Bill Percentage Increase (7) 10.5% ROE
0.5% $1.2
2.5% $7.1
0.2% $0.0
5.8% $11.1
Estimated Total Bill Percentage Increase (7) Anticipated Base Rate Case Filing Date
0.2%
N/A
2.2%
Summer 2006
0.0%
N/A
5.3%
Summer 2006
Notes: (1) Data are taken from the most recent reports filed with the Company’s regulatory commission. Such reports are developed in accordance with Commission instructions, which are not necessarily the same as, and do not necessarily reflect the Company’s filing position in all respects.
(2) The Regulatory Earned Return on Equity is computed by deducting the composite embedded costs of debt and preferred stock from the Earned Return on Rate Base and dividing the remainder by the equity percentage in the capital structure.
(3) Docket No. 05-304, Order No. 6903, effective 5/1/06.(4) Case No. 8492 Settlement, Order No. 70415, effective 4/1/93.(5) PUE 930036, effective 10/5/93.(6) Docket No. 03-127, Order No. 6327, effective 12/9/03.(7) Based on total billed revenues for 12 month period ending with the dates noted above.
Regulated Distribution - Delmarva Power(Dollars in Millions)
36
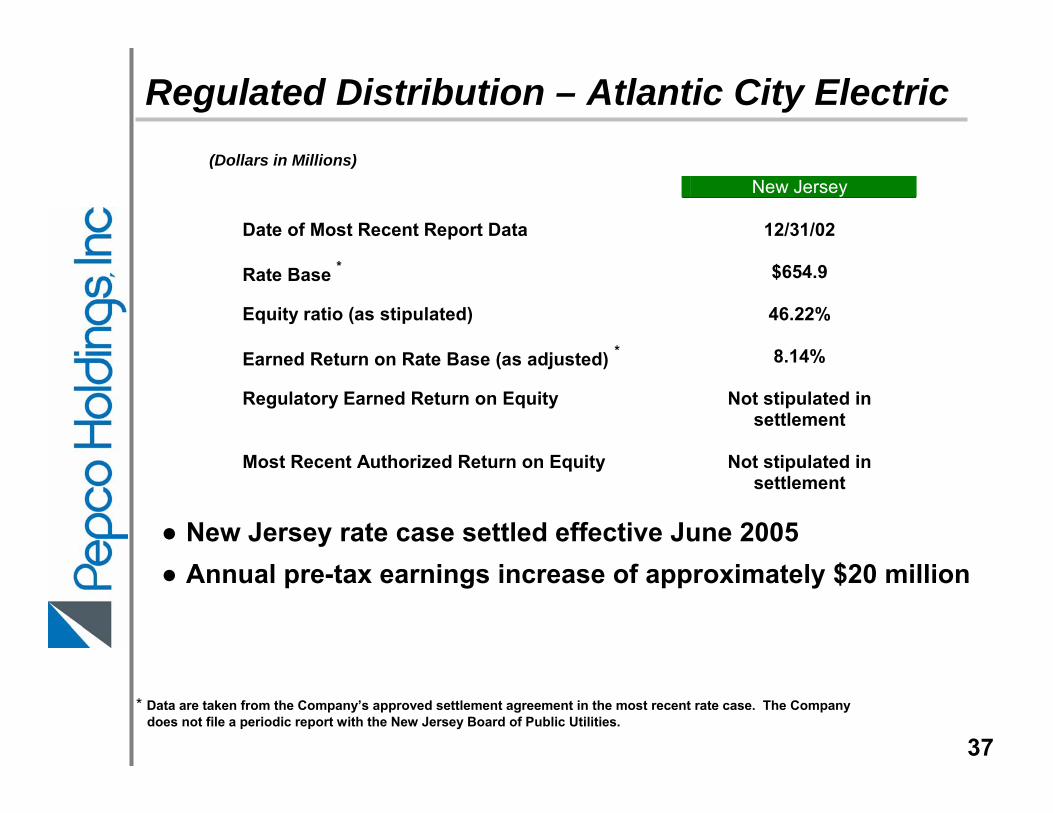
New Jersey Date of Most Recent Report Data
12/31/02
Rate Base * $654.9
Equity ratio (as stipulated)
46.22%
Earned Return on Rate Base (as adjusted) * 8.14%
Regulatory Earned Return on Equity Most Recent Authorized Return on Equity
Not stipulated in settlement
Not stipulated in
settlement
* Data are taken from the Company’s approved settlement agreement in the most recent rate case. The Companydoes not file a periodic report with the New Jersey Board of Public Utilities.
Regulated Distribution – Atlantic City Electric(Dollars in Millions)
● New Jersey rate case settled effective June 2005● Annual pre-tax earnings increase of approximately $20 million
37
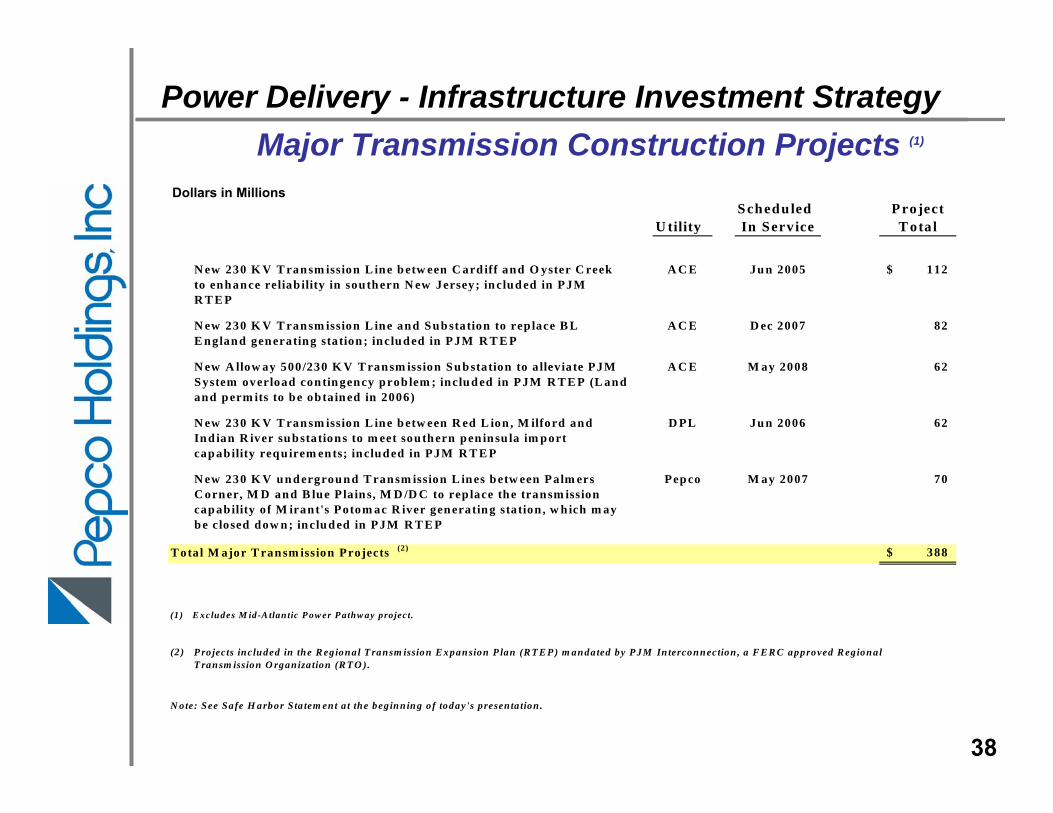
Power Delivery - Infrastructure Investment StrategyMajor Transmission Construction Projects (1)
38
Dollars in MillionsScheduled Project
U tility In Service T otal
N ew 230 K V T ran sm ission L ine b etw een C ard iff and O yster C reek to enh ance reliab ility in south ern N ew Jersey; in clud ed in PJM R T E P
A C E Ju n 2005 112$
N ew 230 K V T ran sm ission L ine and S ub station to rep lace B L E nglan d gen erating station ; includ ed in PJM R T E P
A C E D ec 2007 82
N ew A llow ay 500/230 K V T ran sm ission Su b station to a llev iate PJM S ystem overload con tin gency prob lem ; inclu d ed in PJM R T E P (L an d and p erm its to be obtain ed in 2006)
A C E M ay 2008 62
N ew 230 K V T ran sm ission L ine b etw een R ed L ion , M ilford and In d ian R iver su b station s to m eet sou th ern pen in su la im p ort cap ability req uirem en ts; in clud ed in PJM R T E P
D PL Ju n 2006 62
N ew 230 K V u n d ergrou n d T ran sm ission L in es b etw een Palm ers C orn er, M D an d B lue P la in s, M D /D C to rep lace th e transm ission cap ability of M irant's Potom ac R iver gen eratin g station , w h ich m ay b e closed dow n ; in clu d ed in PJM R T E P
Pep co M ay 2007 70
T otal M ajor T ran sm ission Projects (2) 388$
(1) E xcludes M id-A tlantic P ow er P athw ay project.
(2 )
N ote: See Safe H arbor S ta tem ent a t the beg inning of today's presenta tion .
P ro jects included in the R egional T ransm ission E xpansion P lan (R T E P ) m andated by P JM In terconnection , a F E R C approved R egional T ransm ission O rganiza tion (R T O ).
Conectiv Energy - Power, Oil and Gas Marketing
* See Safe Harbor Statement at the beginning of today’s presentation. 39
● Within this grouping the following major activities are housed:
– Oil marketing through our subsidiary Petron Oil Company– Power and Gas Origination activities– Short-term power marketing via our real time desk– Third-party asset management contracts
● Overall, our expectations from this segment are gross margins in a range of $15-$25 million*
Conectiv Energy –Generation & Full Requirements Forecasts*
* See Safe Harbor Statement at the beginning of today’s presentation. 40
● 2006 margins are likely to be impacted by several factors, compared to 2005:
↓ Lower value from standard product hedges↓ Expiration of tolling contract May 1, 2006↓ Weather↑ Expiration of POLR contracts↑ Option value of plants during summer peak period is regained
● 2007 margins reflect anticipated improvements over 2006 projections:↑ Higher capacity prices↑ Improved margins on standard product hedges↑ Higher output, reflecting improved supply/demand fundamentals↑ Re-pricing of POLR/SOS contracts
Conectiv Energy - Critical Assumptions*
* See Safe Harbor Statement at the beginning of today’s presentation. 41
● Forecasted generation and load serving margins reflect an improving PJM market and the following critical assumptions:
– 2006 generation is highly hedged– Merchant generation energy and capacity margin improvements
beginning in 2007– Generation output of 5.0 to 5.5 GWh’s in 2006– Generation output of 5.7 to 6.2 GWh’s in 2007– No change in PJM operating or dispatching rules– Maintaining improvements in plant availability and on-dispatch results– Hedge effectiveness is maintained– Re-pricing of POLR/SOS contracts at more favorable margins– No replacement of existing tolling agreement– Replacement of standard product hedges at more favorable margins
Note: Management believes the special items are not representative of the Company’s core business operations.
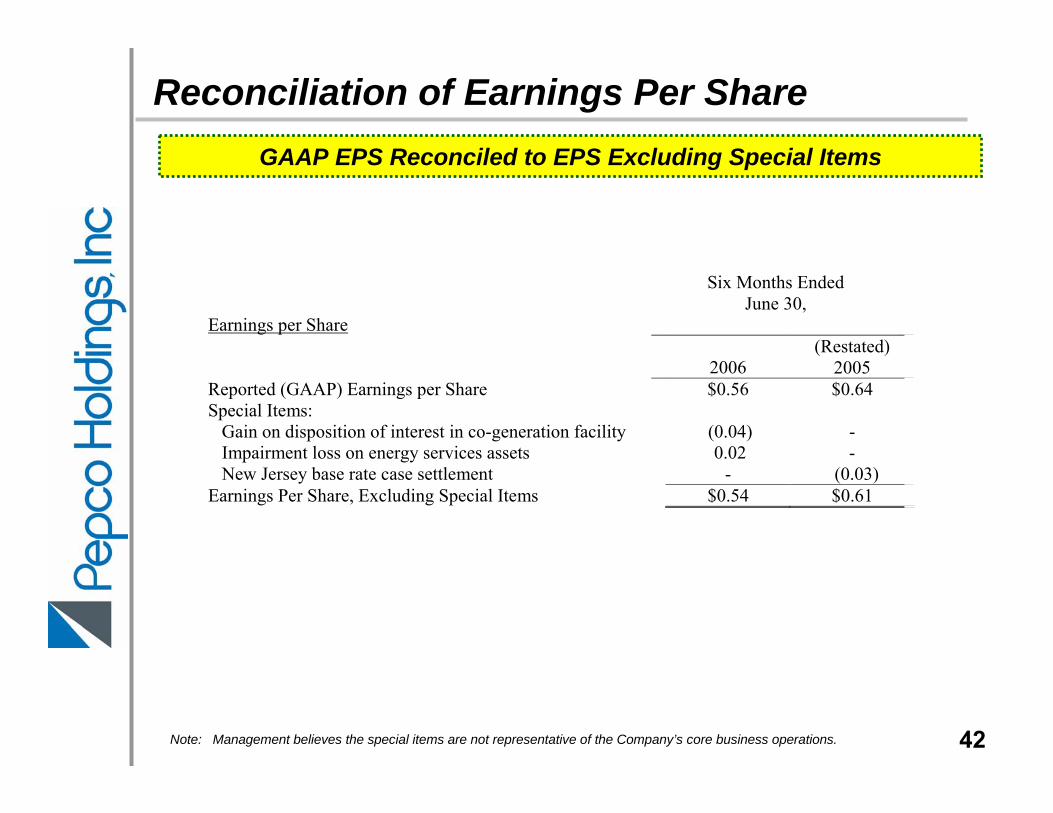
Reconciliation of Earnings Per ShareGAAP EPS Reconciled to EPS Excluding Special Items
42
Earnings per Share
Six Months Ended June 30,
2006 (Restated)
2005 Reported (GAAP) Earnings per Share $0.56 $0.64 Special Items: Gain on disposition of interest in co-generation facility (0.04) - Impairment loss on energy services assets 0.02 - New Jersey base rate case settlement - (0.03) Earnings Per Share, Excluding Special Items $0.54 $0.61
Note: Management believes the special items are not representative of the Company’s core business operations.
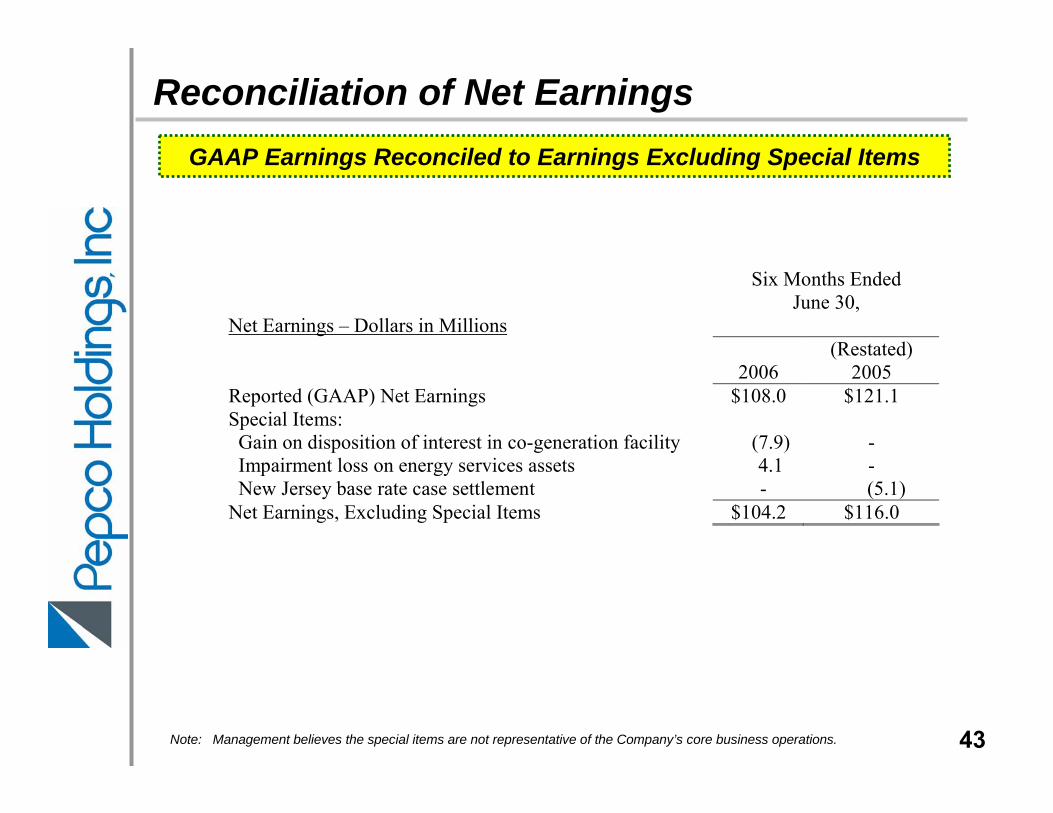
Reconciliation of Net EarningsGAAP Earnings Reconciled to Earnings Excluding Special Items
43
Net Earnings – Dollars in Millions
Six Months Ended June 30,
2006 (Restated)
2005 Reported (GAAP) Net Earnings $108.0 $121.1 Special Items: Gain on disposition of interest in co-generation facility (7.9) - Impairment loss on energy services assets 4.1 - New Jersey base rate case settlement - (5.1) Net Earnings, Excluding Special Items $104.2 $116.0

Reconciliation of Operating Income
44
Reported Operating Income Reconciled to Operating Income Excluding Special Items
For the twelve months ended June 30, 2006
Pepco OtherPower Conectiv Energy Non- Corporate PHI
Delivery Energy Services Regulated & Other ConsolidatedReported Segment Operating Income $654.5 $95.0 $46.6 $93.3 $4.0 $893.4
Percent of operating income 73.3% 10.6% 5.2% 10.4% 0.5% 100.0%
Special Items:Gain on sale of non utility land, Buzzard Point (68.1) (68.1)Gain on sale of Pepco Mirant claims (70.5) (70.5)Final liquidation of Financial Investment (13.3) (13.3)Impairment loss on energy services assets 6.5 6.5
Operating Income excluding Special Items $515.9 $95.0 $53.1 $80.0 $4.0 $748.0
Note: Management believes the special items are not representative of the Company’s core business operations.
Percent of operating income excluding special items 69.0% 12.7% 7.1% 10.7% 0.5% 100.0%