Embed Size (px)
Citation preview

Credit Suisse Group Quarterly Report 2006/Q3
CREDIT SUISSE GROUP
Investment Banking • Private Banking • Asset Management

Credit Suisse Group financial highlights9 months
Change Change Changein % from in % from in % from
in CHF m, except where indicated 3Q 2006 2Q 2006 3Q 2005 2Q 2006 3Q 2005 2006 2005 2005
Consolidated statements of income
Net revenues 8,076 8,788 8,123 (8) (1) 27,789 22,923 21
Income from continuing operations before taxes,minority interests, extraordinary items andcumulative effect of accounting changes 2,460 3,178 2,538 (23) (3) 9,986 6,342 57
Net income 1,892 2,158 1,918 (12) (1) 6,654 4,747 40
Return on equity
Return on equity – Group 18.9% 21.6% 20.1% – – 21.7% 16.9% –
Return on equity – Banking 1) 19.0% 23.4% 22.7% – – 23.4% 18.1% –
Earnings per share
Basic earnings per share, in CHF 1.74 1.94 1.67 – – 6.00 4.16 –
Diluted earnings per share, in CHF 1.67 1.86 1.63 – – 5.75 4.05 –
Cost/income ratio – reported 70.0% 63.7% 69.3% – – 64.4% 72.8% –
Cost/income ratio 2) 75.9% 69.4% 74.0% – – 71.1% 77.9% –
Net new assets, in CHF bn 31.0 30.1 18.7 – – 88.5 47.4 –
Change Changein % from in % from
in CHF m, except where indicated 30.09.06 30.06.06 31.12.05 30.06.06 31.12.05
Assets under management, in CHF bn 1,454.3 1,370.9 1,333.9 6.1 9.0
Consolidated balance sheets
Total assets 1,473,113 1,404,562 1,339,052 5 10
Shareholders’ equity 41,643 38,882 42,118 7 (1)
Consolidated BIS capital data
Risk-weighted assets 252,139 244,931 232,891 3 8
Tier 1 ratio 10.8% 10.6% 11.3% – –
Total capital ratio 13.2% 13.4% 13.7% – –
Number of employees
Switzerland – Banking 20,261 20,069 20,194 1 0
Outside Switzerland – Banking 24,456 24,027 24,370 2 0
Winterthur 3) 18,984 18,944 18,959 0 0
Number of employees (full-time equivalents) 63,701 63,040 63,523 1 0
Stock market data
Share price per registered share, in CHF 72.35 68.40 67.00 6 8
High (closing price) year-to-date, in CHF 74.20 78.90 68.50 (6) 8
Low (closing price) year-to-date, in CHF 62.70 62.85 46.85 0 34
Share price per American Depositary Share, in USD 57.95 55.99 50.95 4 14
Market capitalization, in CHF m 77,946 74,393 75,399 5 3
Market capitalization, in USD m 62,432 60,896 57,337 3 9
Book value per share, in CHF 38.65 35.75 37.43 8 3
Share information
Shares issued 1,214,054,870 1,247,893,498 1,247,752,166 (3) (3)
Treasury shares (136,710,156) (160,272,952) (122,391,983) (15) 12
Shares outstanding 1,077,344,714 1,087,620,546 1,125,360,183 (1) (4)
1) Excludes the shareholder’s equity and net income of Winterthur, including intercompany transactions between Winterthur and the Group. 2) Excludes minority interestrevenues of CHF 640 million, CHF 741 million, CHF 523 million, CHF 2,665 million and CHF 1,520 million and minority interest expenses of CHF 10 million, CHF 13million, CHF 5 million, CHF 32 million and CHF 17 million in 3Q 2006, 2Q 2006, 3Q 2005, nine months 2006 and nine months 2005, respectively, from the consolidationof certain private equity funds and other entities in which the Group does not have a significant economic interest in such revenues and expenses. 3) In June 2006, theGroup announced a definitive agreement for the sale of Winterthur.
Financial calendar
Fourth quarter / full year results 2006 Thursday, February 15, 2007
Annual General Meeting Friday, May 4, 2007
First quarter results 2007 Wednesday, May 2, 2007
Cover: Charlene Yu, Private Banking, Hong Kong Photographer: John Wildgoose

Credit Suisse Group Quarterly Report 2006/Q3 1
Contents
2 Message from the Chief Executive Officer
5 Credit Suisse Group5 Summary of segment results6 Credit Suisse Group structure8 Credit Suisse Group consolidated results
10 Factors affecting results of operations
11 Investment Banking
15 Private Banking
20 Asset Management
24 Assets under management
26 Capital
27 Risk management
32 Condensed consolidated financial statements32 Consolidated statements of income (unaudited)33 Consolidated balance sheets (unaudited)34 Consolidated statements of changes in shareholders’ equity (unaudited)34 Comprehensive income (unaudited)35 Consolidated statements of cash flows (unaudited)37 Notes to the condensed consolidated financial statements (unaudited)55 Report of independent registered public accounting firm
56 Information for investors
EnquiriesCredit Suisse GroupInvestor RelationsIan Roundell, Marc BuchheisterTel. +41 44 333 7149Fax +41 44 333 [email protected]
Credit Suisse GroupMedia RelationsCharles Naylor, Andrés LutherTel. +41 844 33 8844Fax +41 44 333 [email protected]

Message from the Chief Executive Officer
Dear shareholders, clients and colleaguesWe achieved a good overall performance in the first nine months of 2006, with a 40%increase in net income. Our third-quarter result reflects seasonally lower client activity inPrivate Banking in July and August, while our Investment Banking business reportedgood results in fixed income but was impacted by lower equity trading revenues. Netincome for the third quarter totaled CHF 1.9 billion and was almost unchangedcompared to the corresponding period of 2005. Basic earnings per share improved toCHF 1.74 from CHF 1.67 in the third quarter of 2005. Net new assets totaledCHF 31.0 billion in the third quarter of 2006. Our return on equity was 18.9%, with areturn on equity of 19.0% in the banking business.
Credit Suisse Group’s consolidated BIS tier 1 ratio was 10.8% as of September 30,2006, up from 10.6% as of June 30, 2006. In the third quarter of 2006, the Groupcontinued the share buyback program that was approved by shareholders at the AnnualGeneral Meeting in 2005 and repurchased 11.3 million common shares in the amountof CHF 0.8 billion and extinguished 34 million common shares in the amount of CHF1.9 billion. Since the program was initiated, 62.7 million common shares in the amountof CHF 3.9 billion have been repurchased.
Investment BankingInvestment Banking reported a solid third-quarter performance in key areas such asfixed income trading and debt underwriting, which was offset by lower equity tradingrevenues. As a result, net revenues declined 5% compared to the third quarter of2005. Income from continuing operations before taxes decreased 19% versus thesame period of 2005. Third-quarter highlights in Investment Banking included improvedmarket share in announced mergers and acquisitions following our participation in twoof the top three transactions announced in the quarter, reflecting our market leadershipin leveraged buyout transactions. Credit Suisse advised clients in six of the top tenleveraged buyouts announced globally this year for a total transaction value of USD 92billion.
Private BankingThe increased level of assets under management generated strong asset-basedrevenue streams in Private Banking, while revenues from brokerage and productissuance were impacted by lower client activity in July and August. Overall, netrevenues came in slightly lower in the third quarter of 2006 compared to the sameperiod of 2005, while total operating expenses were flat. We are continuing to invest inthe global expansion of our Wealth Management business, growing our onshorepresence and rolling out advisory services in key international markets. In the thirdquarter, we launched operations in Moscow, becoming one of the first internationalbanks to offer onshore wealth management services to meet the needs of clients inRussia who are increasingly seeking local access to global execution capabilities andintegrated solutions. Net new assets totaled CHF 10.9 billion in Wealth Management,with inflows from key markets in all regions. In the third quarter, our Swiss-basedCorporate & Retail Banking business received Global Finance Magazine’s “Best TradeFinance Bank in Switzerland” award for the sixth consecutive year and the “Best Sub-Custodian in Switzerland” award for the third consecutive year.
2 Credit Suisse Group Quarterly Report 2006/Q3
Oswald J. GrübelChief Executive Officer

Asset ManagementIn August 2006, we announced our plans to realign our Asset Management businessas part of our efforts to better leverage our asset management capabilities in theintegrated bank. During the third quarter, we implemented a series of initiatives thatwere launched as part of this realignment, including the repositioning of businesses withlow profitability, the assessment and streamlining of our product portfolio, the launch ofnew sales processes and initiatives, the enhancement of our investment processes andcapabilities, and measures to lower the overall cost base. While systematicallyimplementing these efforts to create a sustainable platform for growth, AssetManagement generated a 7% increase in net revenues compared to the third quarterof 2005 and strong net new asset inflows of CHF 21.2 billion, including alternativeinvestment assets of CHF 6.2 billion. The alternative investment business is a keyelement of our strategy in Asset Management. The success of this business isunderscored by the fact that we had alternative investment assets of CHF 135.3 billionunder management at the end of the third quarter, making us one of the leadingmanagers of alternative investment assets globally.
Priorities and initiatives going forwardFollowing the implementation of our integrated banking model, we now have thenecessary organizational framework in place to efficiently expand our internationalpresence and to exploit synergies throughout Credit Suisse. While we are makingsteady progress with integrating the bank, we will maintain our earnings momentum andgrow the business.
We are also looking at how we can best leverage our capabilities and resources on aglobal scale. This includes measures such as the establishment of Centers ofExcellence that supply high-quality services to our businesses at competitive costs. Atthe beginning of November, we announced a plan to open a further Center ofExcellence in Pune, India, in January 2007. This new facility will complement our twoexisting Centers of Excellence in Singapore and Raleigh, North Carolina.
Moving towards a truly global organizationCredit Suisse has long recognized the importance of maintaining a close proximity toclients and the markets in which they operate in order to compete successfully in theincreasingly globalized financial services industry. We remain committed to the targetedinternational expansion of our business. In the third quarter, Credit Suisse continued toseize growth opportunities in developed markets and to strengthen operations inexpanding markets. In addition to the establishment of our onshore wealth managementservices in Russia, we also continued to build on our long-standing commitment to theMiddle East and announced a new investment partnership with the Abu Dhabi FutureEnergy Company (ADFEC) in August. Under the terms of this alliance, Credit Suisse,ADFEC and other partners will commit capital to projects and funds focused onalternative energy investments. In addition, we strengthened our distribution capabilitiesin Australia by entering into a strategic alliance with the Melbourne-based stockbrokerBaillieu. This will provide us with access to new retail distribution channels and willenable us to grow our capital markets business in the Australian market going forward.In October 2006, Global Infrastructure Partners (GIP), a Credit Suisse joint venture withGeneral Electric Infrastructure, signed a definitive agreement to acquire London CityAirport together with AIG Financial Products Corporation, each owning 50%.
Message from the Chief Executive Officer
Credit Suisse Group Quarterly Report 2006/Q3 3

The global economy is creating attractive new opportunities for financial servicesproviders as the generation of wealth in rapidly growing economies fuels demand forinnovative and holistic financial products and advice. As an integrated global bank, wehave the infrastructure and capabilities to provide clients in both mature and developingmarkets worldwide with direct local access to our entire range of offerings, thussystematically broadening our revenue base and advancing towards our ultimate goal ofsustained and profitable growth.
OutlookWe believe the economic outlook for 2007 is positive in view of the financial strength ofcorporations, the robustness of the financial services industry and the growth prospectsfor the emerging markets. As global energy and commodity prices remain subdued, weexpect to see only very modest increases in global interest rates in the coming months.In addition, we see further upside potential in equity market valuations, althoughperiodic setbacks are possible. As we move towards the end of the year, our pipeline ofbusiness is strong.
Yours sincerely
Oswald J. GrübelNovember 2006
Message from the Chief Executive Officer
4 Credit Suisse Group Quarterly Report 2006/Q3
Credit Suisse Group Quarterly Report 2006/Q3 5
Credit Suisse Group
Credit Suisse Group reported net income of CHF 1,892 million in thethird quarter of 2006, a decrease of CHF 26 million or 1% compared tothe third quarter of 2005. Private Banking’s income from continuingoperations before taxes was almost unchanged compared to the thirdquarter of 2005, as higher asset-based revenues related to assets undermanagement growth were offset by lower transaction-based revenues.Investment Banking reported lower income from continuing operationsbefore taxes, primarily reflecting lower equity trading revenues. AssetManagement reported lower income from continuing operations beforetaxes, primarily reflecting higher operating expenses and a decline inprivate equity and other investment-related gains compared to the strongthird quarter of 2005.
Summary of segment results
Investment BankingInvestment Banking reported income from continuing operations before taxes ofCHF 758 million in the third quarter of 2006, a decrease of CHF 181 million, or 19%,compared to the third quarter of 2005. Net revenues were CHF 4,191 million, adecrease of CHF 210 million, or 5%, compared to the third quarter of 2005, primarilyas a result of lower equity trading revenues.
Total operating expenses decreased CHF 50 million, or 1%, compared to the thirdquarter of 2005. The expense reduction was primarily the result of lower compensationaccruals in line with lower revenues, offset in part by higher commission expensesrelated to increased transaction volumes. The compensation/revenue ratio was 53.5%in the third quarter of 2006, a decline from the full-year 2005 level of 55.5%.
Pre-tax income margin was 18.1% compared to 21.3% in the third quarter of 2005.
Private BankingPrivate Banking reported income from continuing operations before taxes ofCHF 1,022 million in the third quarter of 2006, almost unchanged compared to thethird quarter of 2005. Net revenues were slightly lower at CHF 2,682 million, as strongasset-based revenues related to the growth in assets under management were offsetby lower transaction-based revenues. Net interest income increased CHF 63 million, or7%, largely as a result of an increase in the liability margin. Trading revenues declinedCHF 98 million, or 44%, compared to the third quarter of 2005, reflecting lower clientactivity and a negative impact from changes in the fair value of interest rate derivatives.
Total operating expenses were CHF 1,679 million, flat compared to the third quarter of2005. Slightly lower compensation and benefits reflected higher expenses associatedwith ongoing strategic growth initiatives in Wealth Management that were more thanoffset by lower performance-related compensation accruals. Other expenses were flatreflecting higher marketing activity and growth-related costs offset by lower commissionexpenses and infrastructure-related costs. Pre-tax income margin was 38.1% for thethird quarter of 2006, almost unchanged compared to the third quarter of 2005.
Healthy net new assets of CHF 11.1 billion were reported in the third quarter of 2006,with inflows from all regions.

6 Credit Suisse Group Quarterly Report 2006/Q3
Credit Suisse Group
Credit Suisse Group structure
The Group’s business consists of three segments: Investment Banking, PrivateBanking and Asset Management. The three segments are complemented byShared Services, which provides support in the areas of finance, legal andcompliance, risk management, operations and information technology. Prior periodresults presented in this Quarterly Report have been revised to reflect theoperational and management structure in place during 2006.
The Group’s segments are managed and reported on a pre-tax basis. Minorityinterest-related revenues and expenses resulting from the consolidation of certainprivate equity funds and other entities in which the Group does not have asignificant economic interest in such revenues and expenses are reported in theCorporate Center. Net income is unaffected by the consolidation of these entitiesdue to offsetting minority interests.
Asset ManagementAsset Management reported income from continuing operations before taxes ofCHF 158 million in the third quarter of 2006, a decrease of CHF 42 million, or 21%,compared to the third quarter of 2005. A 7% increase in net revenues was more thanoffset by a 19% increase in total operating expenses, primarily relating to additionalbusiness realignment costs of CHF 40 million and higher commission expenses in linewith higher assets under management.
Net revenues increased CHF 44 million to CHF 692 million compared to the thirdquarter of 2005, as net revenues before private equity and other investment-relatedgains increased CHF 94 million, or 18%, largely driven by higher management fees.Private equity and other investment-related gains were CHF 89 million, CHF 50 million,or 36%, lower than the strong third quarter of 2005.
Total operating expenses were CHF 535 million, CHF 87 million higher than the thirdquarter of 2005. Compensation and benefits increased CHF 33 million, or 13%, toCHF 286 million due to costs associated with the business realignment and theongoing efforts to hire new investment talent. Other expenses increased CHF 54million, or 28%, primarily as a result of higher commission expenses, in line with higherassets under management, higher professional fees and costs associated with therealignment.
Assets under management increased to CHF 659.6 billion as of September 30, 2006from CHF 615.2 billion as of June 30, 2006, reflecting CHF 21.2 billion of net newassets and positive market and foreign exchange-related movements.
Sale of Winterthur
In June 2006, the Group announced a definitive agreement for the sale of Winterthurto AXA for cash consideration of CHF 12.3 billion. The gain on the sale will berecognized at the time of closing, which is expected to occur by the end of 2006,subject to regulatory approvals and closing conditions. As of September 30, 2006,Winterthur’s shareholder’s equity was CHF 9.9 billion.
For further details regarding the sale of Winterthur, see “Discontinued operations” belowand “Notes to the condensed consolidated financial statements – unaudited –Discontinued operations.”
SharedServices
tnemeganaM tessA
I
nves
tmen
t B
anking Private B
anking
Credit Suisse Group
Credit Suisse Group Quarterly Report 2006/Q3 7
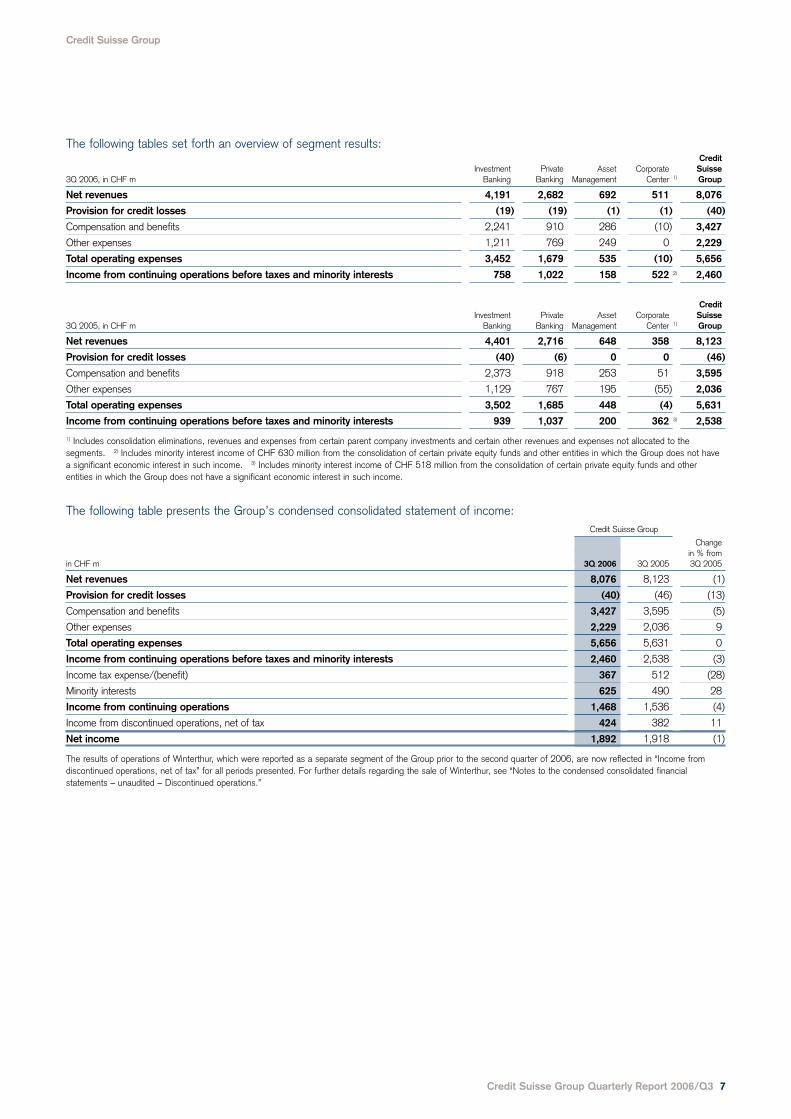
The following tables set forth an overview of segment results:Credit
Investment Private Asset Corporate Suisse3Q 2006, in CHF m Banking Banking Management Center 1) Group
Net revenues 4,191 2,682 692 511 8,076
Provision for credit losses (19) (19) (1) (1) (40)
Compensation and benefits 2,241 910 286 (10) 3,427
Other expenses 1,211 769 249 0 2,229
Total operating expenses 3,452 1,679 535 (10) 5,656
Income from continuing operations before taxes and minority interests 758 1,022 158 522 2) 2,460
CreditInvestment Private Asset Corporate Suisse
3Q 2005, in CHF m Banking Banking Management Center 1) Group
Net revenues 4,401 2,716 648 358 8,123
Provision for credit losses (40) (6) 0 0 (46)
Compensation and benefits 2,373 918 253 51 3,595
Other expenses 1,129 767 195 (55) 2,036
Total operating expenses 3,502 1,685 448 (4) 5,631
Income from continuing operations before taxes and minority interests 939 1,037 200 362 3) 2,538
1) Includes consolidation eliminations, revenues and expenses from certain parent company investments and certain other revenues and expenses not allocated to thesegments. 2) Includes minority interest income of CHF 630 million from the consolidation of certain private equity funds and other entities in which the Group does not havea significant economic interest in such income. 3) Includes minority interest income of CHF 518 million from the consolidation of certain private equity funds and otherentities in which the Group does not have a significant economic interest in such income.
The following table presents the Group’s condensed consolidated statement of income:Credit Suisse Group
Changein % from
in CHF m 3Q 2006 3Q 2005 3Q 2005
Net revenues 8,076 8,123 (1)
Provision for credit losses (40) (46) (13)
Compensation and benefits 3,427 3,595 (5)
Other expenses 2,229 2,036 9
Total operating expenses 5,656 5,631 0
Income from continuing operations before taxes and minority interests 2,460 2,538 (3)
Income tax expense/(benefit) 367 512 (28)
Minority interests 625 490 28
Income from continuing operations 1,468 1,536 (4)
Income from discontinued operations, net of tax 424 382 11
Net income 1,892 1,918 (1)
The results of operations of Winterthur, which were reported as a separate segment of the Group prior to the second quarter of 2006, are now reflected in “Income fromdiscontinued operations, net of tax” for all periods presented. For further details regarding the sale of Winterthur, see “Notes to the condensed consolidated financialstatements – unaudited – Discontinued operations.”

Credit Suisse Group consolidated results
The Group recorded net income of CHF 1,892 million in the third quarter of 2006, adecrease of CHF 26 million, or 1%, compared to the third quarter of 2005. Basicearnings per share increased to CHF 1.74, compared with CHF 1.67 in the thirdquarter of 2005. The return on equity in the third quarter 2006 was 18.9% comparedto 20.1% in the third quarter of 2005.
Net revenues The Group reported net revenues of CHF 8,076 million, a decrease of CHF 47 million,compared to the third quarter of 2005 and a decrease of CHF 712 million, or 8%,compared to the second quarter of 2006.
Net interest income was CHF 1,607 million in the third quarter of 2006, slightly lowercompared to the third quarter of 2005 primarily reflecting higher interest rates onincreased short-term borrowings and long-term debt. Compared to the second quarterof 2006, net interest income declined CHF 259 million, or 14%, due mainly to higherdividend income received during the second quarter.
Commissions and fees increased CHF 226 million, or 6%, to CHF 3,919 millioncompared to the third quarter of 2005, primarily as a result of higher assetmanagement fees in Asset Management. Compared to the second quarter of 2006,commissions and fees decreased CHF 506 million, or 11%, primarily in InvestmentBanking, reflecting lower debt and equity underwriting revenues in a less favorablemarket environment.
Trading revenues were CHF 1,693 million, a decrease of CHF 330 million, or 16%,compared to the third quarter of 2005, reflecting weaker equity trading revenues inInvestment Banking and lower client activity in Private Banking. Trading revenuesincreased CHF 322 million, or 23%, compared to the second quarter of 2006,primarily as a result of higher fixed income trading in Investment Banking.
Other revenues were CHF 857 million in the third quarter of 2006, an increase ofCHF 77 million, or 10%, compared to CHF 780 million in the third quarter of 2005primarily reflecting an increase in minority interest-related revenues. Other revenuesinclude CHF 618 million in minority interest-related revenues from consolidated privateequity funds and other entities in which the Group does not have a significant economicinterest in such revenues. In comparison to the second quarter of 2006, other revenuesdecreased CHF 269 million, or 24%, primarily reflecting reductions in minority interest-related revenues. See “Minority interests” below.
Provision for credit losses The Group reported a net release of provisions for credit losses of CHF 40 million inthe third quarter of 2006 compared to a net release of CHF 46 million in the thirdquarter of 2005. The credit environment continued to be favorable in the third quarterof 2006.
Total operating expensesThe Group reported total operating expenses of CHF 5,656 million in the third quarterof 2006, flat compared to the third quarter of 2005. Compensation and benefitsdecreased CHF 168 million, or 5%, to CHF 3,427 million, primarily due to lowercompensation accruals in Investment Banking.
Other expenses were CHF 2,229 million, an increase of CHF 193 million, or 9%,compared to the third quarter of 2005, largely as a result of higher commissionexpenses related to higher transaction activity levels.
Credit Suisse Group
8 Credit Suisse Group Quarterly Report 2006/Q3
Return on equityin %
22.520.017.515.012.510.07.55.02.50.0
3Q 4Q 1Q 2Q 3Q 4Q 1Q 2Q 3Q2004 2004 2005 2005 2005 2005 2006 2006 2006
Basic earnings per sharein CHF
2.402.101.801.501.200.900.600.300.00
3Q 4Q 1Q 2Q 3Q 4Q 1Q 2Q 3Q2004 2004 2005 2005 2005 2005 2006 2006 2006

Credit Suisse Group
Credit Suisse Group Quarterly Report 2006/Q3 9
Total operating expenses were slightly higher compared to the second quarter of 2006,which included credits from insurance settlements for litigation and related costs ofCHF 474 million in Investment Banking partially offset by business realignment costs ofCHF 152 million in Asset Management. Compensation and benefits decreasedcompared to the second quarter of 2006, primarily reflecting lower compensationaccruals in Investment Banking and Private Banking.
Income tax expenseThe Group recorded income tax expense of CHF 367 million in the third quarter of2006 compared to CHF 512 million in the third quarter of 2005, reflecting the Group’slower pre-tax income and lower estimated annual effective tax rate of 23.0% (in bothcases excluding non-taxable minority interest revenues and expenses). Income taxexpense was positively impacted by the release of tax contingency accruals totalingCHF 44 million following the favorable resolution of certain matters with tax authoritiesduring the third quarter of 2006.
The Group tax expense is not affected by minority interest revenues and expenses fromconsolidated private equity and other entities in which the Group does not have asignificant economic interest in such revenues and expenses. The amount of non-taxable income relating to these investments varies from one period to the next andwas CHF 630 million in the third quarter of 2006, compared to CHF 518 million in thethird quarter of 2005.
The Group’s effective tax rate in the third quarter of 2006 was 15%, compared to20% in the third quarter of 2005. Excluding the effect of non-taxable income fromthese investments, the Group’s effective tax rate in the third quarter of 2006 was 20%,compared to 25% in the third quarter of 2005.
Minority interestsThe Group’s net revenues and operating expenses reflect the consolidation of certainprivate equity funds and other entities in which the Group does not have a significanteconomic interest in such revenues and expenses. The consolidation of these entitiesdoes not affect net income as the amounts recorded in net revenues and expenses areoffset by corresponding amounts reported as minority interests. This minority interestincome, which is reported in the Corporate Center, was CHF 630 million in the thirdquarter of 2006, and is comprised of net revenues, primarily other revenues, ofCHF 640 million and operating expenses of CHF 10 million.
The Group reported minority interests of CHF 625 million in the third quarter of 2006,an increase of CHF 135 million compared to the third quarter of 2005. This increasewas primarily due to revenues from certain private equity funds and other entities thatwere consolidated for the first time during the first quarter of 2006. For further details,see “Notes to the condensed consolidated financial statements – unaudited – Recentlyadopted accounting standards.”
Discontinued operationsAs a result of the agreement for the sale of Winterthur, the results of operations ofWinterthur are reflected in Income from discontinued operations, net of tax in theconsolidated statements of income for all periods presented. The assets and liabilities ofWinterthur have been presented as Assets of discontinued operations held-for-sale andLiabilities of discontinued operations held-for-sale, respectively, in the consolidatedbalance sheet as of September 30, 2006, and June 30, 2006. Net new assets andassets under management for the Group are presented for all periods excludingWinterthur. The results of discontinued operations in the third quarter of 2006 wereCHF 424 million, which included the release of a provision of CHF 154 million relatedto the favorable resolution of a VAT dispute in the UK.
For further details regarding the sale of Winterthur and its results, see “Notes to thecondensed consolidated financial statements – unaudited – Discontinued operations.”
Cost/income ratioin %
90.085.080.075.070.065.060.055.050.00.0
3Q 4Q 1Q 2Q 3Q 4Q 1Q 2Q 3Q2004 2004 2005 2005 2005 2005 2006 2006 2006
Excludes minority interest revenues and expensesfrom the consolidation of certain private equity fundsand other entities in which the Group does not have asignificant economic interest in such revenues andexpenses (see “Minority interests”).

Factors affecting results of operations
The global equity market environment was mixed as the earlier part of the quarter wascharacterized by continued uncertainty about oil prices and the US Federal Reserve’splans for interest rates, while a more positive market tone was observed in the latterpart of the quarter with a reduction in commodity prices and an easing of tensions inthe Middle East.
The US stock markets started out weakly in the third quarter, but recovered strongly,with all major indices up for the quarter. The Dow Jones Industrial Average had its bestthird quarter (up 4.7% during the quarter) in eleven years, and its fifth consecutivequarterly increase. The Frankfurt Stock Exchange Index and the Swiss Market Indexwere also up during the quarter, however, turnover in the Swiss market was down 34%compared to the second quarter of 2006, which negatively affected Swiss private clientactivity. Most European and Asian stock markets also rose in the quarter, aided bydiminished investor concern that central banks would increase interest rates.
The US Federal Reserve did not raise interest rates in early August, which resulted in astock market rally through the end of the quarter. Both the European Central Bank andthe Bank of Japan raised rates in the quarter, but recent inflation data in the thirdquarter were largely benign and were viewed as a signal that future rate increaseswould be gradual. The US yield curve remained inverted in the quarter and flattenedglobally as short-term interest rates continued to rise. Mixed trading conditions wereobserved throughout most of the quarter, as relatively weak activity levels began torecover in September.
Industry-wide volume of announced mergers and acquisitions transactions in the thirdquarter represented the slowest quarter for deal-making in a very active year, but washigher than the levels of the third quarter of 2005. Deals were announced from nearlyall industry sectors with financial sponsors continuing to drive mergers and acquisitionsactivity. European merger activity continued to exceed that of the US.
Industry-wide volumes of global debt underwriting activity were slightly lower than thesecond quarter of 2006 despite the pause in interest rate increases in the US. A robustmerger market and a high level of financing activity across many sectors helped drivedebt issuance volume, with both investment grade and high yield debt volumes up fromthe third quarter of 2005.
The traditional summer slowdown and uncertainty in the equity markets at the beginningof the quarter affected equity underwriting volumes, which declined from both therecord-setting second quarter of 2006 and the third quarter of 2005, which wascharacterized by an unusually strong market environment in which the typical summerslowdown did not occur. Equity underwriting activity increased later in the quarter as thestock market continued its rally in September. The number of global initial publicoffering deals brought to the market declined from both comparable periods, but initialpublic offering dollar volumes were up from the levels in the third quarter of 2005.
Credit Suisse Group
10 Credit Suisse Group Quarterly Report 2006/Q3

Credit Suisse Group Quarterly Report 2006/Q3 11
Investment Banking
Investment Banking provides financial advisory, lending and capital raisingservices and sales and trading to institutional, corporate and governmentclients worldwide.
Investment Banking reported income from continuing operations before taxes ofCHF 758 million in the third quarter of 2006, a decrease of CHF 181 million, or 19%,compared to the third quarter of 2005. These results reflected solid revenues in fixedincome trading and investment banking and lower equity trading revenues. Income fromcontinuing operations before taxes decreased CHF 529 million, or 41%, compared tothe second quarter of 2006. The results in the second quarter of 2006 included creditsfrom insurance settlements for litigation and related costs of CHF 474 million.Excluding the insurance settlements, income from continuing operations before taxesdecreased CHF 55 million, or 7%, from the second quarter of 2006. These resultsreflected weaker market conditions in July and August with a decline in customeractivity from the first half of the year and a seasonal slowdown in deal activity.
For the first nine months of 2006, Investment Banking reported income fromcontinuing operations before taxes of CHF 3,609 million, an increase of CHF 2,296million, or 175%, compared to the first nine months of 2005. Excluding the insurancesettlements in the second quarter of 2006 and the CHF 960 million charge to increaselitigation reserves in the second quarter of 2005, income from continuing operationsbefore taxes increased 38%.
Pre-tax income margin was 18.1%, and pre-tax return on average economic riskcapital was 21.5% in the third quarter of 2006 compared to 21.3% and 28.9%,respectively, in the third quarter of 2005. For the first nine months of 2006, pre-taxincome margin was 25.1%, and pre-tax return on average economic risk capital was32.8%, exceeding Investment Banking’s mid-term performance targets of 20% and25%, respectively.
Net revenues were CHF 4,191 million, down CHF 210 million, or 5%, in the thirdquarter of 2006 compared to the third quarter of 2005, primarily reflecting lowerrevenues in equity trading. Net revenues decreased 6% from the strong performance inthe second quarter of 2006.
Provision for credit losses amounted to a net release of CHF 19 million in the thirdquarter of 2006 compared to a net release of CHF 40 million in the third quarter of2005. Compared to June 30, 2006, total impaired loans decreased CHF 129 million toCHF 253 million, and valuation allowances as a percentage of total impaired loansincreased 3 percentage points to 101% as of September 30, 2006. The overall creditenvironment continued to be favorable in the third quarter of 2006.
Total operating expenses were CHF 3,452 million in the third quarter of 2006, downCHF 50 million compared to the third quarter of 2005. Compensation and benefitsdecreased CHF 132 million, or 6%, due primarily to lower compensation accruals inline with lower revenues. The compensation/revenue ratio of 53.5% in the third quarterof 2006 was at the same level as the first and second quarters of 2006 and a declinefrom 55.5% for the full year 2005. For 2006, total compensation and benefits expenseis targeted at 53.5% of net revenues, with discretionary bonus representing aconsiderable portion of the total amount. Compensation and benefits for a given yearare determined by the strength and breadth of business results, staffing levels and theimpact of share-based compensation programs. Other expenses increased CHF 82million, or 7%, due primarily to higher commission expenses resulting from highertransaction volumes. Compared to the second quarter of 2006, total operatingexpenses increased CHF 319 million, or 10%, primarily reflecting credits received fromthe insurance settlements in the second quarter of 2006. Excluding the insurancesettlements, total operating expenses decreased CHF 155 million, or 4%.Compensation and benefits decreased CHF 133 million, or 6%, due to lower
Pre-tax income marginin %
30.025.020.015.010.05.00.0
(5.0)(10.0)(15.0)(20.0)
3Q 4Q 1Q 2Q 3Q 4Q 1Q 2Q 3Q2004 2004 2005 2005 2005 2005 2006 2006 2006
Pre-tax return on average economicrisk capitalin %
40.035.030.025.020.015.010.05.00.0
(5.0)(10.0)(15.0)(20.0)
3Q 4Q 1Q 2Q 3Q 4Q 1Q 2Q 3Q2004 2004 2005 2005 2005 2005 2006 2006 2006
1) Excluding the charge to increase the reserve forcertain private litigation matters of CHF 960 million.
Compensation/revenue ratioin %
65.060.055.050.045.040.035.00.0
3Q 4Q 1Q 2Q 3Q 4Q 1Q 2Q 3Q2004 2004 2005 2005 2005 2005 2006 2006 2006
1)
1)
Investment Banking
12 Credit Suisse Group Quarterly Report 2006/Q3
compensation accruals in line with lower revenues. Other expenses increased CHF 452million, or 60%, due primarily to the insurance settlements. Excluding the insurancesettlements, other expenses were down slightly from the second quarter of 2006.
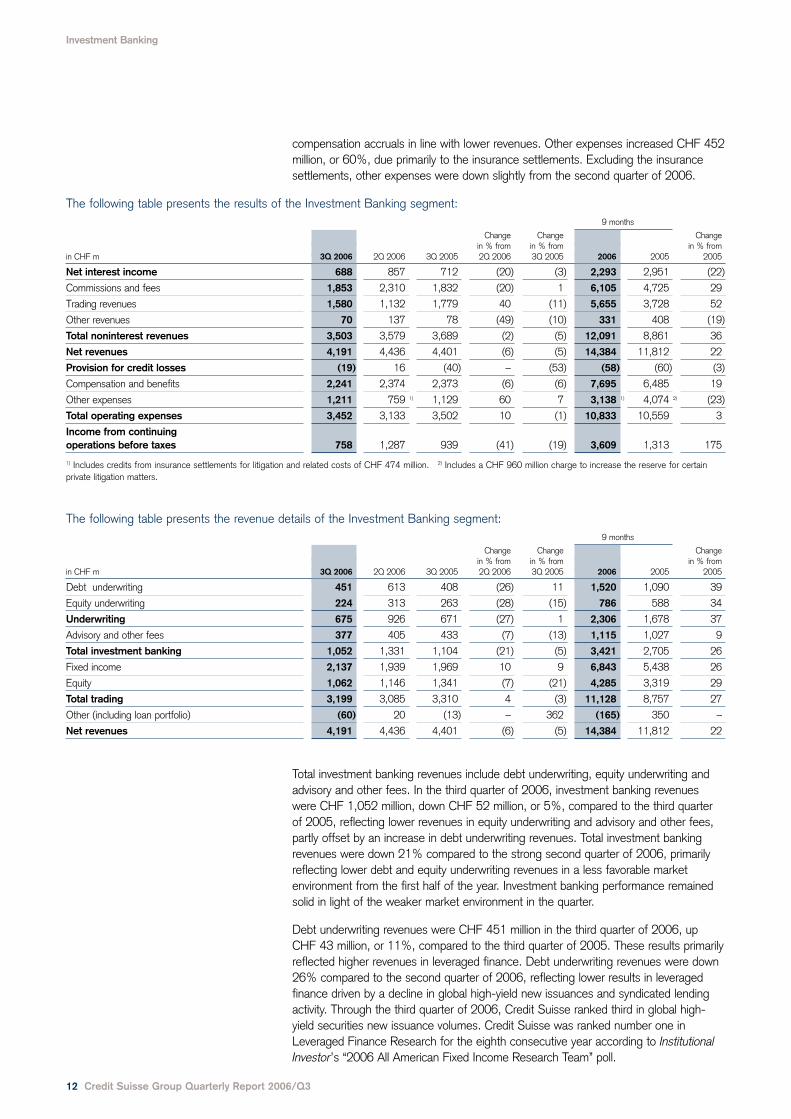
The following table presents the results of the Investment Banking segment:9 months
Change Change Changein % from in % from in % from
in CHF m 3Q 2006 2Q 2006 3Q 2005 2Q 2006 3Q 2005 2006 2005 2005
Net interest income 688 857 712 (20) (3) 2,293 2,951 (22)
Commissions and fees 1,853 2,310 1,832 (20) 1 6,105 4,725 29
Trading revenues 1,580 1,132 1,779 40 (11) 5,655 3,728 52
Other revenues 70 137 78 (49) (10) 331 408 (19)
Total noninterest revenues 3,503 3,579 3,689 (2) (5) 12,091 8,861 36
Net revenues 4,191 4,436 4,401 (6) (5) 14,384 11,812 22
Provision for credit losses (19) 16 (40) – (53) (58) (60) (3)
Compensation and benefits 2,241 2,374 2,373 (6) (6) 7,695 6,485 19
Other expenses 1,211 759 1) 1,129 60 7 3,138 1) 4,074 2) (23)
Total operating expenses 3,452 3,133 3,502 10 (1) 10,833 10,559 3
Income from continuingoperations before taxes 758 1,287 939 (41) (19) 3,609 1,313 175
1) Includes credits from insurance settlements for litigation and related costs of CHF 474 million. 2) Includes a CHF 960 million charge to increase the reserve for certainprivate litigation matters.
The following table presents the revenue details of the Investment Banking segment:9 months
Change Change Changein % from in % from in % from
in CHF m 3Q 2006 2Q 2006 3Q 2005 2Q 2006 3Q 2005 2006 2005 2005
Debt underwriting 451 613 408 (26) 11 1,520 1,090 39
Equity underwriting 224 313 263 (28) (15) 786 588 34
Underwriting 675 926 671 (27) 1 2,306 1,678 37
Advisory and other fees 377 405 433 (7) (13) 1,115 1,027 9
Total investment banking 1,052 1,331 1,104 (21) (5) 3,421 2,705 26
Fixed income 2,137 1,939 1,969 10 9 6,843 5,438 26
Equity 1,062 1,146 1,341 (7) (21) 4,285 3,319 29
Total trading 3,199 3,085 3,310 4 (3) 11,128 8,757 27
Other (including loan portfolio) (60) 20 (13) – 362 (165) 350 –
Net revenues 4,191 4,436 4,401 (6) (5) 14,384 11,812 22
Total investment banking revenues include debt underwriting, equity underwriting andadvisory and other fees. In the third quarter of 2006, investment banking revenueswere CHF 1,052 million, down CHF 52 million, or 5%, compared to the third quarterof 2005, reflecting lower revenues in equity underwriting and advisory and other fees,partly offset by an increase in debt underwriting revenues. Total investment bankingrevenues were down 21% compared to the strong second quarter of 2006, primarilyreflecting lower debt and equity underwriting revenues in a less favorable marketenvironment from the first half of the year. Investment banking performance remainedsolid in light of the weaker market environment in the quarter.
Debt underwriting revenues were CHF 451 million in the third quarter of 2006, upCHF 43 million, or 11%, compared to the third quarter of 2005. These results primarilyreflected higher revenues in leveraged finance. Debt underwriting revenues were down26% compared to the second quarter of 2006, reflecting lower results in leveragedfinance driven by a decline in global high-yield new issuances and syndicated lendingactivity. Through the third quarter of 2006, Credit Suisse ranked third in global high-yield securities new issuance volumes. Credit Suisse was ranked number one inLeveraged Finance Research for the eighth consecutive year according to Institutional
Investor’s “2006 All American Fixed Income Research Team” poll.

Investment Banking
Credit Suisse Group Quarterly Report 2006/Q3 13
Equity underwriting revenues in the third quarter of 2006 were CHF 224 million, downCHF 39 million, or 15%, compared to the third quarter of 2005, primarily reflectinglower industry-wide equity issuance activity and a decline in initial public offering marketshare. Equity underwriting revenues were down CHF 89 million, or 28%, compared tothe second quarter of 2006, due to lower industry-wide equity issuance activity withmore challenging equity markets from the first half of the year. Credit Suisse rankedfifth in global initial public offering market share through the third quarter of 2006 andmaintained a leading position in financial sponsor-backed equity offerings. Credit Suisseparticipated in a number of key equity transactions across a broad range of industriesand geographies in the third quarter, including initial public offerings for KazMunai GazExploration and Production (privatization of the exploration and production business ofKazakhstan’s national oil company) and Qimonda AG (memory products business ofGerman-based Infineon Technologies AG) and a follow-on offering for Bayer AG.
Advisory and other fees were CHF 377 million in the third quarter of 2006, downCHF 56 million, or 13%, compared to the third quarter of 2005, due primarily to anumber of high-fee transactions in the third quarter of 2005. For the first nine monthsof 2006, Credit Suisse ranked eighth in global announced mergers and acquisitionsand tenth in global completed mergers and acquisitions, with improved market sharesfrom the second quarter. Credit Suisse ranked fourth in global announced mergers andacquisitions in the third quarter of 2006. Credit Suisse’s market leadership in leveragedbuyout (LBO) transactions contributed to the higher market shares in the quarter. CreditSuisse advised clients in six of the top ten LBOs announced globally this year for a totalof USD 92 billion in transaction value. Credit Suisse advised in two of the top threemergers and acquisitions transactions based on equity value announced in the thirdquarter of 2006, both of which were LBO transactions: the sale of HCA Inc. to aprivate equity consortium, and a private equity consortium’s acquisition of FreescaleSemiconductor. The advisory and other fees results also reflected higher revenues fromthe private fund group, which raises capital for hedge funds, private equity funds andreal estate funds.
Total trading revenues include results from fixed income and equity sales and trading.Total trading revenues for the third quarter of 2006 were CHF 3,199 million, downCHF 111 million, or 3%, compared to the third quarter of 2005, due to weaker resultsin equity trading. Total trading revenues were up CHF 114 million, or 4%, compared tothe second quarter of 2006.
Investment Banking’s average daily VaR in the third quarter of 2006 was CHF 80million, up from CHF 64 million in the third quarter of 2005 and down from CHF 95million in the second quarter of 2006. Compared to the second quarter of 2006,average daily VaR decreased mainly due to reduced interest rate and credit spread VaRexposures and increased diversification between fixed income and equity risk types.Average economic risk capital increased CHF 1.9 billion compared to the third quarterof 2005, in line with the strategy to extend incremental capital to support high-growthand high-margin activities with notable increases in the structured products business.
Fixed income trading recorded revenues of CHF 2,137 million in the third quarter of2006, up CHF 168 million, or 9%, compared to the third quarter of 2005. Theseresults reflected higher revenues in commercial mortgage-backed securities, globalforeign exchange and collateralized debt obligations, partially offset by weaker results inresidential mortgage-backed securities and asset-backed securities. Results in the thirdquarter of 2005 included a positive CHF 216 million adjustment to the fair value ofretained interests in residential mortgage-backed securities. Excluding this adjustment,fixed income trading revenues increased CHF 384 million, or 22%, from the thirdquarter of 2005. Fixed income markets remained challenging in the third quarter of2006 as the yield curve flattened, but market conditions recovered from a slow start tothe quarter with increased activity in the latter part of the quarter. The commoditiesbusiness continued its growth with higher revenues than the third quarter of 2005.

Compared to the second quarter of 2006, fixed income trading revenues increased10%, due primarily to improved results in emerging markets trading, global foreignexchange and fixed income proprietary trading, partially offset by weaker results inleveraged finance, which was impacted by lower levels of high-yield new issuances,residential mortgage-backed securities and collateralized debt obligations. Credit Suisseannounced during the quarter a second strategic alliance with Glencore International tobuild a derivatives and structured trading business in base and precious metals, inaddition to the previously announced alliance in the oil and petroleum products market.
Equity trading revenues of CHF 1,062 million decreased CHF 279 million, or 21%,compared to the third quarter of 2005, due primarily to significantly lower results inderivatives, partially offset by improved results in prime services. The derivativesbusiness made a positive revenue contribution in the quarter despite unevenperformance in the business. Equity proprietary trading had a solid quarter but wasdown from the third quarter of 2005. Client-driven activity in the cash businessesremained steady and improved from the third quarter of 2005. Advanced executionservices (AES) had a strong quarter with higher revenues benefiting the US cashbusiness. For a second consecutive year, Credit Suisse’s AES trading platform wasrecognized as “Best Algorithmic Trading Service” by Financial News in its annual ITExcellence Awards for 2006. Prime services also had a strong quarter. Despite morechallenging market conditions for hedge funds, Credit Suisse’s hedge fund balancesincreased as clients continued to direct new prime broker business to the Bank. CreditSuisse was ranked the number three Prime Broker (up from fourth last year) inInstitutional Investor’s “Top 100 Hedge Funds” survey. Compared to the second quarterof 2006, equity trading revenues decreased CHF 84 million, or 7%, reflecting weakerresults in the derivatives, convertibles and cash businesses, partially offset by strongerresults in equity proprietary trading. Derivatives had uneven performance in thebusiness, and the convertibles business was negatively impacted by more challengingmarket conditions. The cash businesses had seasonally slower client-driven activitycompared to the second quarter of 2006.
Other (including loan portfolio) recorded a loss of CHF 60 million in the third quarter of2006 compared to a loss of CHF 13 million in the third quarter of 2005, due primarilyto lower gains from private equity-related investments not managed as part of AssetManagement and higher interest costs related to allocated goodwill. Compared to thesecond quarter of 2006, other (including loan portfolio) revenues decreased CHF 80million, primarily reflecting lower gains from private equity-related investments notmanaged as part of Asset Management and losses on credit default swaps used tohedge the loan portfolio compared to gains on such credit default swaps in the secondquarter.
The following tables present key information of the Investment Banking segment:9 months
3Q 2006 2Q 2006 3Q 2005 2006 2005
Cost/income ratio 82.4% 70.6% 79.6% 75.3% 89.4%
Pre-tax income margin 18.1% 29.0% 21.3% 25.1% 11.1%
Compensation/revenue ratio 53.5% 53.5% 53.9% 53.5% 54.9%
Average economic risk capital, in CHF m 16,103 15,817 14,229 15,987 12,725
Pre-tax return on average economic risk capital 1) 21.5% 35.3% 28.9% 32.8% 16.3%
Average one-day, 99% VaR, in CHF m 80 95 64 82 65
1) Calculated using a return excluding interest costs for allocated goodwill.
Change Changein % from in % from
30.09.06 30.06.06 31.12.05 30.06.06 31.12.05
Total loans, in CHF m 42,309 38,190 34,762 11 22
Non-performing loans/total loans 0.5% 0.5% 0.4% – –
Impaired loans/total loans 0.6% 1.0% 1.5% – –
Investment Banking
14 Credit Suisse Group Quarterly Report 2006/Q3

Private Banking
Private Banking provides comprehensive advice and a broad range ofinvestment products and services tailored to the complex needs of high-net-worth individuals all over the world through its Wealth Managementbusiness. In Switzerland, Private Banking provides banking products andservices to business and retail clients through its Corporate & RetailBanking business.
Private Banking reported income from continuing operations before taxes ofCHF 1,022 million in the third quarter of 2006, almost unchanged from the thirdquarter of 2005. Third quarter 2006 revenues of CHF 2,682 million were slightly lowercompared to the third quarter of 2005, reflecting low client activity in July and Augustthat improved in September with more favorable market conditions. Higher asset-basedrevenues related to the increased level of assets under management were offset bylower transaction-based revenues. Operating expenses of CHF 1,679 million in thethird quarter of 2006 were also flat compared to the third quarter of 2005, reflectinghigher expenses related to strategic growth initiatives in Wealth Management offset bylower performance-related compensation accruals and continuing cost management.Net new assets were CHF 11.1 billion in the third quarter of 2006, with positivecontributions from all regions. These inflows contributed to an increase in assets undermanagement of CHF 45.1 billion, or 5%, from June 30, 2006 to CHF 904.2 billion.Compared to the second quarter of 2006, income from continuing operations beforetaxes declined CHF 101 million, or 9%, primarily reflecting lower client activity and lessfavorable market conditions throughout much of the third quarter.
Credit Suisse continues to provide best-in-class services, a leading product platformand innovative solutions for clients. It became one of the first international banks tooffer onshore wealth management services in Russia, launching operations in Moscowin the third quarter of 2006. Continued investment in the global franchise has resultedin strong asset inflows across a broad client base. In addition, Credit Suisse launchedmore than 200 new product offerings, particularly tailor-made solutions in structuredinvestments, in the third quarter.
Private Banking reported a pre-tax income margin of 38.1% for the third quarter of2006, which was almost unchanged from the third quarter of 2005, reflecting slightlylower net revenues, flat operating expenses and a small increase in net releases ofprovisions for credit losses. Net revenues of CHF 2,682 million were mainly driven bylower trading revenues of CHF 124 million, down CHF 98 million, or 44%, due tolower client activity, and a negative impact from changes in the fair value of interest ratederivatives. Net interest income was CHF 1,009 million, an increase of CHF 63 million,or 7%, compared to the third quarter of 2005, mainly related to a higher liability margin.Commissions and fees remained stable compared to the third quarter of 2005, asincreases in asset-based revenues related to the higher level of assets undermanagement were offset by lower transaction-based revenues largely reflecting lowerrevenues from brokerage and product issuance.
Provisions for credit losses for Private Banking in the third quarter of 2006 resulted innet releases of CHF 19 million compared to net releases of CHF 6 million in the thirdquarter of 2005, reflecting the continued favorable credit environment.
Private Banking’s total operating expenses were CHF 1,679 million in the third quarterof 2006, which reflected slightly lower compensation and benefits and flat otherexpenses compared to the third quarter of 2005. Compensation and benefits reflectedhigher personnel expenses from the ongoing international growth initiatives in WealthManagement, which were more than offset by lower performance-related compensationaccruals. Other expenses reflected higher marketing activity and growth-related costsoffset by lower commission expenses and infrastructure-related costs.
Assets under managementin CHF bn
950.0900.0850.0800.0750.0700.0650.0600.0
0.030.09. 31.12. 31.03. 30.06. 30.09. 31.12. 31.03. 30.06. 30.09.2004 2004 2005 2005 2005 2005 2006 2006 2006
Pre-tax income marginin %
45.040.035.030.025.00.0
3Q 4Q 1Q 2Q 3Q 4Q 1Q 2Q 3Q2004 2004 2005 2005 2005 2005 2006 2006 2006
Credit Suisse Group Quarterly Report 2006/Q3 15

Private Banking
16 Credit Suisse Group Quarterly Report 2006/Q3
As of September 30, 2006, assets under management for Private Banking wereCHF 904.2 billion, an increase of CHF 45.1 billion, or 5%, compared to June 30,2006. This increase reflected higher equity market valuations and foreign exchange-related movements and healthy net new assets of CHF 11.1 billion, with inflows fromall regions.
The following table presents the results of the Private Banking segment:9 months
Change Change Changein % from in % from in % from
in CHF m 3Q 2006 2Q 2006 3Q 2005 2Q 2006 3Q 2005 2006 2005 2005
Net interest income 1,009 1,050 946 (4) 7 3,025 2,792 8
Commissions and fees 1,508 1,606 1,510 (6) 0 4,921 4,277 15
Trading revenues 124 173 222 (28) (44) 600 557 8
Other revenues 41 84 38 (51) 8 159 153 4
Total noninterest revenues 1,673 1,863 1,770 (10) (5) 5,680 4,987 14
Net revenues 2,682 2,913 2,716 (8) (1) 8,705 7,779 12
Provision for credit losses (19) (5) (6) 280 217 (32) (50) (36)
Compensation and benefits 910 1,020 918 (11) (1) 3,001 2,700 11
Other expenses 769 775 767 (1) 0 2,283 2,189 4
Total operating expenses 1,679 1,795 1,685 (6) 0 5,284 4,889 8
Income from continuing operations before taxes 1,022 1,123 1,037 (9) (1) 3,453 2,940 17
The following tables present key information of the Private Banking segment:9 months
3Q 2006 2Q 2006 3Q 2005 2006 2005
Cost/income ratio 62.6% 61.6% 62.0% 60.7% 62.8%
Pre-tax income margin 38.1% 38.6% 38.2% 39.7% 37.8%
Net new assets, in CHF bn 11.1 16.6 18.8 42.5 41.5
Average economic risk capital, in CHF m 4,466 4,619 4,741 4,622 4,698
Pre-tax return on average economic risk capital 1) 93.4% 99.0% 88.9% 101.3% 84.7%
1) Calculated using a return excluding interest costs for allocated goodwill.
Change Changein % from in % from
30.09.06 30.06.06 31.12.05 30.06.06 31.12.05
Assets under management, in CHF bn 904.2 859.1 837.6 5.2 8.0
Wealth Management
Wealth Management reported income from continuing operations before taxes ofCHF 684 million for the third quarter of 2006, down CHF 37 million, or 5%, from thethird quarter of 2005. The pre-tax income margin of 37.1% was 1.6 percentage pointslower, with marginally lower net revenues of CHF 1,843 million and a slight increase inoperating expenses. Net interest income increased, benefiting from a higher liabilitymargin. Asset-based commissions and fees also increased, reflecting higher assetsunder management. These increases were offset by decreased transaction-basedrevenues, mainly related to reduced revenues from brokerage and product issuancedue to lower client activity. Total operating expenses in the third quarter of 2006 wereCHF 1,161 million, a slight increase compared to the third quarter of 2005.Compensation and benefits increased due to higher personnel expenses mainly relatedto strategic growth initiatives offset in part by lower performance-related compensationaccruals due to lower results and revised expectations of year-end bonus payments.
Pre-tax income marginin %
45.040.035.030.025.00.0
3Q 4Q 1Q 2Q 3Q 4Q 1Q 2Q 3Q2004 2004 2005 2005 2005 2005 2006 2006 2006

Private Banking
Credit Suisse Group Quarterly Report 2006/Q3 17
Other expenses were flat compared to the third quarter of 2005, reflecting continuedfocus on cost management notwithstanding the ongoing strategic investments.
During the third quarter of 2006, Wealth Management’s net new assets wereCHF 10.9 billion, reflecting inflows from key markets in all regions, resulting in a rollingfour quarter average growth rate of 7.2% in the third quarter of 2006, a decline from8.6% in the second quarter of 2006. Net new assets for the first nine months of 2006were CHF 41.9 billion, an annualized growth rate of 8.1%. Gross margin on assetsunder management was 100.7 basis points in the third quarter of 2006, 13.6 basispoints below the third quarter of 2005. The asset-based margin decreased 3.1 basispoints, primarily as the 12% growth in average assets under management exceededthe 5% growth in the underlying interest income. The transaction-based margindecreased 10.5 basis points compared to the third quarter of 2005, mainly as a resultof the decrease in brokerage and product issuance revenues reflecting lower clientactivity. The gross margin on assets under management for the first nine months of2006 was 112.6 basis points, a slight decrease of 1.1 basis points, mainly driven bythe slower growth of underlying net interest income compared to the growth in averageassets under management. The asset-based margin decreases also reflect the dilutioneffect from the continuing strong growth in net new assets.
The following table presents the results of the Wealth Management business:9 months
Change Change Changein % from in % from in % from
in CHF m 3Q 2006 2Q 2006 3Q 2005 2Q 2006 3Q 2005 2006 2005 2005
Net interest income 453 517 417 (12) 9 1,428 1,229 16
Total noninterest revenues 1,390 1,517 1,447 (8) (4) 4,676 4,028 16
Net revenues 1,843 2,034 1,864 (9) (1) 6,104 5,257 16
Provision for credit losses (2) 0 4 – – (2) 23 –
Compensation and benefits 629 702 607 (10) 4 2,066 1,771 17
Other expenses 532 553 532 (4) 0 1,614 1,505 7
Total operating expenses 1,161 1,255 1,139 (7) 2 3,680 3,276 12
Income from continuing operations before taxes 684 779 721 (12) (5) 2,426 1,958 24
The following tables present key information of the Wealth Management business:9 months
3Q 2006 2Q 2006 3Q 2005 2006 2005
Cost/income ratio 63.0% 61.7% 61.1% 60.3% 62.3%
Pre-tax income margin 37.1% 38.3% 38.7% 39.7% 37.2%
Net new assets, in CHF bn 10.9 16.5 16.8 41.9 36.0
Net new asset growth (rolling four quarter average) 7.2% 8.6% 7.4% – –
Net new asset growth 6.1% 9.0% 10.6% 8.1% 8.5%
Gross margin on assets under management 100.7 bp 112.8 bp 114.3 bp 112.6 bp 113.7 bp
of which asset-based 69.3 bp 71.0 bp 72.4 bp 71.1 bp 73.3 bp
of which transaction-based 31.4 bp 41.8 bp 41.9 bp 41.5 bp 40.4 bp
Net margin (pre-tax) on assets under management 37.4 bp 43.2 bp 44.2 bp 44.8 bp 42.3 bp
Change Changein % from in % from
30.09.06 30.06.06 31.12.05 30.06.06 31.12.05
Assets under management, in CHF bn 753.2 714.1 693.3 5.5 8.6
Net new assetsin CHF bn in %
17.515.0 9.012.5 7.510.0 6.07.5 4.55.0 3.02.5 1.50.0 0.0
3Q 4Q 1Q 2Q 3Q 4Q 1Q 2Q 3Q2004 2004 2005 2005 2005 2005 2006 2006 2006
– Net new asset growth (rolling four quarter average),in %
Net new asset growth (rolling four quarter average in %)

Corporate & Retail Banking
Corporate & Retail Banking reported income from continuing operations before taxes ofCHF 338 million in the third quarter of 2006, up CHF 22 million, or 7%, from the thirdquarter of 2005. The pre-tax income margin was 40.3% in the third quarter of 2006,up 3.2 percentage points compared to the third quarter of 2005, reflecting loweroperating expenses and higher releases of provisions for credit losses, which more thanoffset the impact of slightly lower net revenues. Net revenues for the third quarter of2006 were CHF 839 million, a decrease of CHF 13 million, or 2%, compared to thethird quarter of 2005. The positive developments from asset-based revenues andhigher net interest income were more than offset by lower trading revenues. Comparedto the second quarter of 2006, net revenues decreased by CHF 40 million, or 5%, dueto lower transaction-based revenues, which were negatively impacted by changes in thefair value of interest rate derivatives. Provisions for credit losses in the third quarter of2006 resulted in net releases of CHF 17 million compared to net releases of CHF 10million in the third quarter of 2005, reflecting the continued favorable creditenvironment. Total operating expenses were CHF 518 million, CHF 28 million, or 5%,below the third quarter of 2005. This decrease was driven by lower performance-related compensation accruals. Other expenses remained stable, reflecting effectivecost management.
The pre-tax return on average economic risk capital in the third quarter of 2006 was48.1%, up 8.1 percentage points compared to the third quarter of 2005, indicatingexcellent profitability in a competitive market. The increase was mainly driven by the11% decrease in the average economic risk capital in the third quarter of 2006, as therisk profile of the lending portfolio continued to improve.
The following table presents the results of the Corporate & Retail Banking business:9 months
Change Change Changein % from in % from in % from
in CHF m 3Q 2006 2Q 2006 3Q 2005 2Q 2006 3Q 2005 2006 2005 2005
Net interest income 556 533 529 4 5 1,597 1,564 2
Total noninterest revenues 283 346 323 (18) (12) 1,004 959 5
Net revenues 839 879 852 (5) (2) 2,601 2,523 3
Provision for credit losses (17) (5) (10) 240 70 (30) (73) (59)
Compensation and benefits 281 318 311 (12) (10) 935 930 1
Other expenses 237 222 235 7 1 669 683 (2)
Total operating expenses 518 540 546 (4) (5) 1,604 1,613 (1)
Income from continuing operations before taxes 338 344 316 (2) 7 1,027 983 4
18 Credit Suisse Group Quarterly Report 2006/Q3
Private Banking
Pre-tax income marginin %
45.040.035.030.025.00.0
3Q 4Q 1Q 2Q 3Q 4Q 1Q 2Q 3Q2004 2004 2005 2005 2005 2005 2006 2006 2006
Pre-tax return on average economicrisk capitalin %
50.045.040.035.030.025.00.0
3Q 4Q 1Q 2Q 3Q 4Q 1Q 2Q 3Q2004 2004 2005 2005 2005 2005 2006 2006 2006

Private Banking
Credit Suisse Group Quarterly Report 2006/Q3 19
The following tables present key information of the Corporate & Retail Banking business:9 months
3Q 2006 2Q 2006 3Q 2005 2006 2005
Cost/income ratio 61.7% 61.4% 64.1% 61.7% 63.9%
Pre-tax income margin 40.3% 39.1% 37.1% 39.5% 39.0%
Net new assets, in CHF bn 0.2 0.1 2.0 0.6 5.5
Average economic risk capital, in CHF m 2,816 2,798 3,167 2,837 3,167
Pre-tax return on average economic risk capital 1) 48.1% 49.3% 40.0% 48.4% 41.4%
1) Calculated using a return excluding interest costs for allocated goodwill.
Change Changein % from in % from
30.09.06 30.06.06 31.12.05 30.06.06 31.12.05
Assets under management, in CHF bn 151.0 145.0 144.3 4.1 4.6
Mortgage loans, in CHF bn 66.0 65.1 66.3 1.4 (0.5)
Other loans, in CHF bn 33.9 31.9 28.3 6.3 19.8
Non-performing loans/total loans 1.4% 1.5% 1.9% – –
Impaired loans/total loans 1.9% 2.0% 2.6% – –
Number of branches 215 215 215 0 0

Asset Management
Asset Management combines the discretionary investment managementfunctions of Credit Suisse and offers products across a broad range ofinvestment classes, from equity, fixed income and multi-asset classproducts to alternative investments such as real estate, hedge funds,private equity and volatility management. Asset Management managesportfolios, mutual funds and other investment vehicles for government,institutional and private clients. Products are offered through bothproprietary and third party distribution channels as well as through otherchannels within Credit Suisse.
Asset Management’s income from continuing operations before taxes was CHF 158million in the third quarter of 2006, a decrease of CHF 42 million, or 21%, from thethird quarter of 2005, reflecting higher operating expenses partially offset by higher netrevenues. Compared to the second quarter of 2006, income from continuing operationsbefore taxes increased CHF 131 million, primarily reflecting lower costs associated withthe realignment of Asset Management.
The realignment of Asset Management continued in the third quarter of 2006 as part ofthe previously announced strategy to strengthen the business. Realignment costs in thethird quarter were CHF 40 million, with CHF 22 million in severance-related costs andCHF 18 million in professional fees and other expenses. As part of the realignment ofthe US business, several traditional asset management products and strategies weretransitioned to a more quantitatively-driven approach or were transferred to otherregions. The previously announced headcount reduction is expected to be substantiallycomplete by the end of 2006. In Australia, Asset Management exited from aretirement-related investment platform. In Japan, Asset Management is seeking torefocus its business to import capabilities and products that exist in its global networkfor both individual and institutional investors.
The following table presents the results of the Asset Management segment:9 months
Change Change Changein % from in % from in % from
in CHF m 3Q 2006 2Q 2006 3Q 2005 2Q 2006 3Q 2005 2006 2005 2005
Net interest income (14) (20) (19) (30) (26) (53) (46) 15
Commissions and fees 581 564 515 3 13 1,706 1,537 11
Trading revenues 16 5 8 220 100 10 31 (68)
Other revenues 109 126 144 (13) (24) 460 522 (12)
Total noninterest revenues 706 695 667 2 6 2,176 2,090 4
Net revenues 692 675 648 3 7 2,123 2,044 4
Provision for credit losses (1) (1) 0 0 – 0 0 –
Compensation and benefits 286 255 253 12 13 802 695 15
Other expenses 249 394 195 (37) 28 902 584 54
of which commission expenses 95 81 67 17 42 260 209 24
Total operating expenses 535 649 448 (18) 19 1,704 1,279 33
Income from continuing operations before taxes 158 27 200 485 (21) 419 765 (45)
While continuing with its realignment in the third quarter, Asset Management hascontinued to generate strong net new assets, launch well-received new products andannounce a number of new business initiatives. Assets under management increasedfrom CHF 615.2 billion as of June 30, 2006 to CHF 659.6 billion as of September30, 2006, reflecting positive inflows and market and foreign exchange-relatedmovements of CHF 44.4 billion. Net inflows for the third quarter were CHF 21.2 billion,mainly due to money market assets of CHF 13.8 billion and alternative investmentassets of CHF 6.2 billion. Net new assets in the first nine months of 2006 were
20 Credit Suisse Group Quarterly Report 2006/Q3

CHF 53.7 billion, reflecting inflows of CHF 31.4 billion in money market assets, CHF14.8 billion in alternative investment assets and CHF 6.0 billion in balanced assets.
As part of the strategy to expand Asset Management’s alternative investmentsbusiness, Credit Suisse has launched several growth initiatives through closecollaboration with other firms with investment expertise in a variety of different assetclasses and investment styles. These initiatives will enable Asset Management to growits leading alternative investments business across a variety of new products, sectorsand regions. In the third quarter of 2006, Credit Suisse announced a joint initiative withOspraie Management, in addition to an investment partnership with Abu Dhabi FutureEnergy Company and joint ventures with China Renaissance Capital Group and GeneralElectric Infrastructure (Global Infrastructure Partners (GIP)). On October 11, 2006, GIPsigned a definitive agreement to acquire London City Airport together with AIG FinancialProducts Corporation, each owning 50%. This important and high-profile deal is GIP’sfirst investment.
The following table presents the revenue details of the Asset Management segment:9 months
Change Change Changein % from in % from in % from
in CHF m 3Q 2006 2Q 2006 3Q 2005 2Q 2006 3Q 2005 2006 2005 2005
Asset management revenues 535 503 459 6 17 1,532 1,407 9
Private equity commissions and fees 68 57 50 19 36 181 147 23
Net revenues before private equityand other investment-related gains 603 560 509 8 18 1,713 1,554 10
Private equity and other investment-related gains 89 115 139 (23) (36) 410 490 (16)
Net revenues 692 675 648 3 7 2,123 2,044 4
Third quarter 2006 net revenues were CHF 692 million, an increase of CHF 44 million,or 7%, compared to the third quarter of 2005. Net revenues before private equity andother investment-related gains were CHF 603 million, an increase of CHF 94 million,or 18%, compared to the third quarter of 2005. Asset management revenues, whichconsist primarily of fees from asset management and fund administration servicesprovided to clients, increased CHF 76 million, or 17%, compared to the third quarter of2005, in line with the development in assets under management over the previoustwelve months. Private equity commissions and fees, which include private equity fundmanagement fees, increased CHF 18 million, or 36%, from the third quarter of 2005,mainly reflecting increased investment and portfolio management fees based on higherassets under management and placement fees in connection with new private equityfunds.
In the third quarter of 2006, Asset Management recorded private equity and otherinvestment-related gains of CHF 89 million, a decrease of CHF 50 million, or 36%,compared to the strong third quarter of 2005. Compared to the second quarter of2006, private equity and other investment-related gains decreased CHF 26 million, or23%. Most of the private equity and other investment-related gains in the third quarterof 2006 reflected initial public offerings of firms in which the alternative investmentsbusiness held significant participations. These initial public offerings include CommVault,a technology data storage company, and Warner Chilcott. Also, private equity gainswere recorded in Nycomed. Both Nycomed and Warner Chilcott are pharmaceuticalcompanies.
Asset Management
Credit Suisse Group Quarterly Report 2006/Q3 21

Asset Management
22 Credit Suisse Group Quarterly Report 2006/Q3
The following tables present key information of the Asset Management segment:9 months
3Q 2006 2Q 2006 3Q 2005 2006 2005
Cost/income ratio 77.3% 96.1% 69.1% 80.3% 62.6%
Pre-tax income margin 22.8% 4.0% 30.9% 19.7% 37.4%
Net new assets, in CHF bn 21.2 15.5 5.1 53.7 20.4
of which private equity 1.4 2.6 1.5 6.4 3.3
of which advisory assets 1.2 0.4 1.1 2.6 2.1
Gross margin on assets under management 43.4 bp 44.0 bp 49.4 bp 45.7 bp 54.7 bp
Net margin (pre-tax) on assets under management 9.9 bp 1.7 bp 15.3 bp 9.0 bp 20.5 bp
Average economic risk capital, in CHF m 1,511 1,416 1,191 1,428 1,065
Pre-tax return on average economic risk capital 1) 49.3% 15.4% 75.2% 46.9% 103.6%
1) Calculated using a return excluding interest costs for allocated goodwill.
Change Changein % from in % from
in CHF bn 30.09.06 30.06.06 31.12.05 30.06.06 31.12.05
Assets under management 659.6 615.2 589.4 7.2 11.9
Private equity investments 2.1 1.9 1.4 10.5 50.0
Total operating expenses were CHF 535 million, an increase of CHF 87 million, or19%, compared to the third quarter of 2005. Compensation and benefits increasedCHF 33 million, or 13%, to CHF 286 million, which included severance-related costsof CHF 22 million associated with the realignment, as well as ongoing efforts to hireinvestment talent. Other expenses were CHF 249 million in the third quarter of 2006,an increase of CHF 54 million, or 28%, compared to the third quarter of 2005,primarily reflecting higher commission expenses, in line with higher assets undermanagement, higher professional fees and costs associated with the realignment.Compared to the second quarter of 2006, total operating expenses decreasedCHF 114 million, reflecting the lower realignment costs of CHF 40 million in the thirdquarter of 2006 compared to CHF 152 million in the second quarter.
Pre-tax income margin for the third quarter of 2006 was 22.8%, down 8.1 percentagepoints from the third quarter of 2005, with a 7% increase in net revenues offset by a19% increase in operating expenses. Compared to the second quarter of 2006, pre-tax income margin increased 18.8 percentage points, reflecting higher revenues andsignificantly lower operating expenses due to the realignment costs recorded in thesecond quarter.
Pre-tax income marginin %
55.050.045.040.035.030.025.020.015.010.05.00.0
3Q 4Q 1Q 2Q 3Q 4Q 1Q 2Q 3Q2004 2004 2005 2005 2005 2005 2006 2006 2006

Asset Management
Credit Suisse Group Quarterly Report 2006/Q3 23
The following table presents total assets under management of the Asset Management segment by asset class:Change Change
in % from in % fromin CHF bn 30.09.06 30.06.06 31.12.05 30.06.06 31.12.05
Money market 93.7 78.2 64.1 19.8 46.2
Fixed income 118.8 113.8 110.0 4.4 8.0
Balanced 264.0 251.1 254.6 5.1 3.7
Equities 47.8 46.1 47.7 3.7 0.2
Alternative 1) 135.3 126.0 113.0 7.4 19.7
of which private equity 30.6 29.2 25.5 4.8 20.0
Total assets under management 659.6 615.2 589.4 7.2 11.9
of which discretionary assets 566.4 526.1 500.3 7.7 13.2
of which advisory assets 93.2 89.1 89.1 4.6 4.6
1) Alternative includes private equity, funds of hedge funds, real estate and indexed products.
Gross margin on assets under management was 43.4 basis points in the third quarterof 2006, a 6.0 basis point decrease from the third quarter of 2005, reflecting the 36%decrease in private equity and other investment-related gains and an increase in moneymarket assets. Excluding private equity and other investment-related gains, grossmargin on assets under management was 37.8 basis points in the third quarter of2006 and 38.8 basis points in the third quarter of 2005.
Pre-tax return on average economic risk capital was 49.3% in the third quarter of 2006compared to 75.2% in the third quarter of 2005, primarily reflecting higher position riskfrom growth initiatives in alternative investments.
Assets under managementin CHF bn
700.0650.0600.0550.0500.0450.0400.0
0.030.09. 31.12. 31.03. 30.06. 30.09. 31.12. 31.03. 30.06. 30.09.2004 2004 2005 2005 2005 2005 2006 2006 2006
Net new assetsin CHF bn
21.018.015.012.09.06.03.00.0
(3.0)(6.0)
3Q 4Q 1Q 2Q 3Q 4Q 1Q 2Q 3Q2004 2004 2005 2005 2005 2005 2006 2006 2006

Credit Suisse Group
24 Credit Suisse Group Quarterly Report 2006/Q3
Assets under management
Assets under managementAssets under management comprise assets which are placed with Group entities forinvestment purposes and include discretionary and advisory counterparty assets.
Discretionary assets are assets for which the customer fully transfers the discretionarypower to a Group entity with a management mandate. Advisory assets include assetsplaced with the Group where the client is provided access to investment advice butretains discretion over investment decisions.
As of September 30, 2006, the Group’s assets under management amounted toCHF 1,454.3 billion, an increase of CHF 83.4 billion, or 6.1%, compared to June 30,2006. Private Banking assets under management increased CHF 45.1 billion in thethird quarter of 2006 and assets under management in Asset Management increasedCHF 44.4 billion, both reflecting growth in net new assets and positive marketvaluations and foreign exchange-related movements.
The following table sets forth information on assets under management:Change Change
in % from in % fromin CHF bn 30.09.06 30.06.06 31.12.05 30.06.06 31.12.05
Investment Banking 13.0 13.2 14.5 (1.5) (10.3)
Private Banking 904.2 859.1 837.6 5.2 8.0
Asset Management 659.6 615.2 589.4 7.2 11.9
Less assets managed on behalf of other segments (122.5) (116.6) (107.6) 5.1 13.8
Credit Suisse Group 1) 1,454.3 1,370.9 1,333.9 6.1 9.0
of which discretionary 658.2 614.2 592.1 7.2 11.2
of which advisory 796.1 756.7 741.8 5.2 7.3
1) Excludes CHF 162.5 billion, CHF 157.4 billion and CHF 153.3 billion as of September 30, 2006, June 30, 2006 and December 31, 2005, respectively, of assetsmanaged by Winterthur. In June 2006, the Group announced a definitive agreement for the sale of Winterthur. For further details, see “Notes to the condensed consolidatedfinancial statements – unaudited – Discontinued operations.”
Net new assetsNet new assets include individual cash and securities transactions and new or repaidloans. Interest and dividend income credited to clients, commissions, interest and feescharged for banking services are not considered as they do not reflect success inacquiring assets under management. Changes due to currency and market movementsas well as asset inflows and outflows due to the acquisition or divestiture of businessesare not part of net new assets.
Net new assets were CHF 31.0 billion in the third quarter of 2006, an increase ofCHF 0.9 billion compared to the second quarter of 2006. Strong inflows across allregions contributed to the net new assets of CHF 11.1 billion in Private Banking. AssetManagement reported net new assets of CHF 21.2 billion, mainly in US-based moneymarket products and alternative investment assets.
The following table sets forth information on net new assets:9 months
in CHF bn 3Q 2006 2Q 2006 3Q 2005 2006 2005
Investment Banking (0.1) (0.1) 0.0 0.0 (2.0)
Private Banking 11.1 16.6 18.8 42.5 41.5
Asset Management 21.2 15.5 5.1 53.7 20.4
Less net new assets managed on behalf of other segments (1.2) (1.9) (5.2) (7.7) (12.5)
Credit Suisse Group 1) 31.0 30.1 18.7 88.5 47.4
1) Excludes CHF 0.0 billion, CHF 0.1 billion, CHF 0.3 billion, CHF 3.8 billion and CHF 3.4 billion for 3Q 2006, 2Q 2006, 3Q 2005, nine months 2006 and nine months2005, respectively, of net new assets managed by Winterthur. In June 2006, the Group announced a definitive agreement for the sale of Winterthur. For further details, see“Notes to the condensed consolidated financial statements – unaudited – Discontinued operations.”
Net new assetsin CHF bn
35.030.025.020.015.010.05.00.0
3Q 4Q 1Q 2Q 3Q 4Q 1Q 2Q 3Q2004 2004 2005 2005 2005 2005 2006 2006 2006
Excludes Winterthur.

Client assetsClient assets is a broader measure than assets under management as it includestransactional and custody accounts (assets held solely for transaction-related orsafekeeping/custody purposes) and assets of corporate clients and public institutionsused primarily for cash management or transaction-related purposes.
The following table sets forth information on client assets:Change Change
in % from in % fromin CHF bn 30.09.06 30.06.06 31.12.05 30.06.06 31.12.05
Investment Banking 61.8 70.2 69.6 (12.0) (11.2)
Private Banking 1,029.1 975.6 951.9 5.5 8.1
Asset Management 666.0 621.2 596.0 7.2 11.7
Less client assets managed on behalf of other segments (122.5) (116.6) (107.6) 5.1 13.8
Credit Suisse Group 1) 1,634.4 1,550.4 1,509.9 5.4 8.2
1) Excludes CHF 162.5 billion, CHF 157.4 billion and CHF 153.3 billion as of September 30, 2006, June 30, 2006 and December 31, 2005, respectively, of client assetsheld by Winterthur. In June 2006, the Group announced a definitive agreement for the sale of Winterthur. For further details, see “Notes to the condensed consolidatedfinancial statements – unaudited – Discontinued operations.”
Credit Suisse Group
Credit Suisse Group Quarterly Report 2006/Q3 25

26 Credit Suisse Group Quarterly Report 2006/Q3
Capital
Credit Suisse GroupThe Group’s consolidated BIS tier 1 ratio was 10.8% as of September 30, 2006, anincrease from 10.6% as of June 30, 2006. The Group continued the share buybackprogram approved by the shareholders at the Annual General Meeting in 2005,repurchasing 62.7 million common shares in the amount of CHF 3.9 billion since theinitiation of the program through September 30, 2006. In the third quarter of 2006,11.3 million common shares in the amount of CHF 0.8 billion were repurchased and34 million common shares in the amount of CHF 1.9 billion were extinguished. Risk-weighted assets increased compared to the second quarter of 2006, primarily reflectingan increase in capital requirements for interbank, commercial and private lending, OTCderivatives and financial investments partially offset by changes in regulatory treatmentof certain leveraged and whole loans and a decrease in market risk equivalents. Tier 1capital increased CHF 1,112 million from June 30, 2006, with the positive contributionof net income and the strengthening of the US dollar against the Swiss franc offset byadditional dividend accruals and the deduction for shares repurchased through theGroup’s share buyback program. The Group’s shareholders’ equity increased fromCHF 38.9 billion as of June 30, 2006 to CHF 41.6 billion as of September 30, 2006,primarily due to the third quarter net income and the strengthening of the US dollaragainst the Swiss franc.
Credit SuisseCredit Suisse’s consolidated BIS tier 1 ratio increased to 9.5% as of September 30,2006 compared to 9.4% as of June 30, 2006. Risk-weighted assets increasedcompared to the second quarter of 2006, primarily reflecting an increase in capitalrequirements for interbank, commercial and private lending, OTC derivatives andfinancial investments partially offset by changes in regulatory treatment of certainleveraged and whole loans and a decrease in market risk equivalents. Tier 1 capitalincreased CHF 1,059 million from June 30, 2006, with the positive contribution of netincome and the strengthening of the US dollar against the Swiss franc offset byadditional dividend accruals. The shareholder’s equity of Credit Suisse increased fromCHF 22.5 billion as of June 30, 2006 to CHF 24.4 billion as of September 30, 2006,primarily due to the third quarter net income and the strengthening of the US dollaragainst the Swiss franc.
The following table sets forth details of BIS data (risk-weighted assets, capital and ratios):Credit Suisse Group Credit Suisse
in CHF m, except where indicated 30.09.06 30.06.06 31.12.05 30.09.06 30.06.06 31.12.05
Risk-weighted positions 236,448 228,079 218,899 219,060 209,732 200,904
Market risk equivalents 15,691 16,852 13,992 14,691 16,011 12,499
Risk-weighted assets 252,139 244,931 232,891 233,751 225,743 213,403
Total shareholders’ equity 41,643 38,882 42,118 24,353 22,506 25,788
Reconciliation to tier 1 capital:
Non-cumulative perpetual preferred securities 2,167 2,142 2,170 1,055 1,035 1,044
Investment in insurance entities (4,321) (3,782) (4,179) (13) (12) (12)
Adjustments for goodwill, minority interests, disallowed unrealized gainson fair value measurement, own shares and dividend accruals (12,359) (11,224) (13,761) (3,089) (2,282) (6,257)
Tier 1 capital 27,130 26,018 26,348 22,306 21,247 20,563
Tier 1 ratio 10.8% 10.6% 11.3% 9.5% 9.4% 9.6%
Total capital 33,269 32,752 31,918 33,235 32,174 29,815
Total capital ratio 13.2% 13.4% 13.7% 14.2% 14.3% 14.0%
The Swiss Federal Banking Commission (EBK) has advised that Credit Suisse Group and Credit Suisse may continue to include as tier 1 capital CHF 2.2 billion and CHF 6.3billion, respectively, as of September 30, 2006 (June 30, 2006: CHF 2.1 billion and CHF 6.2 billion, respectively and December 31, 2005: CHF 2.2 billion and CHF 6.5billion, respectively) of equity from special purpose entities that are deconsolidated under FIN 46R.
Credit Suisse Group
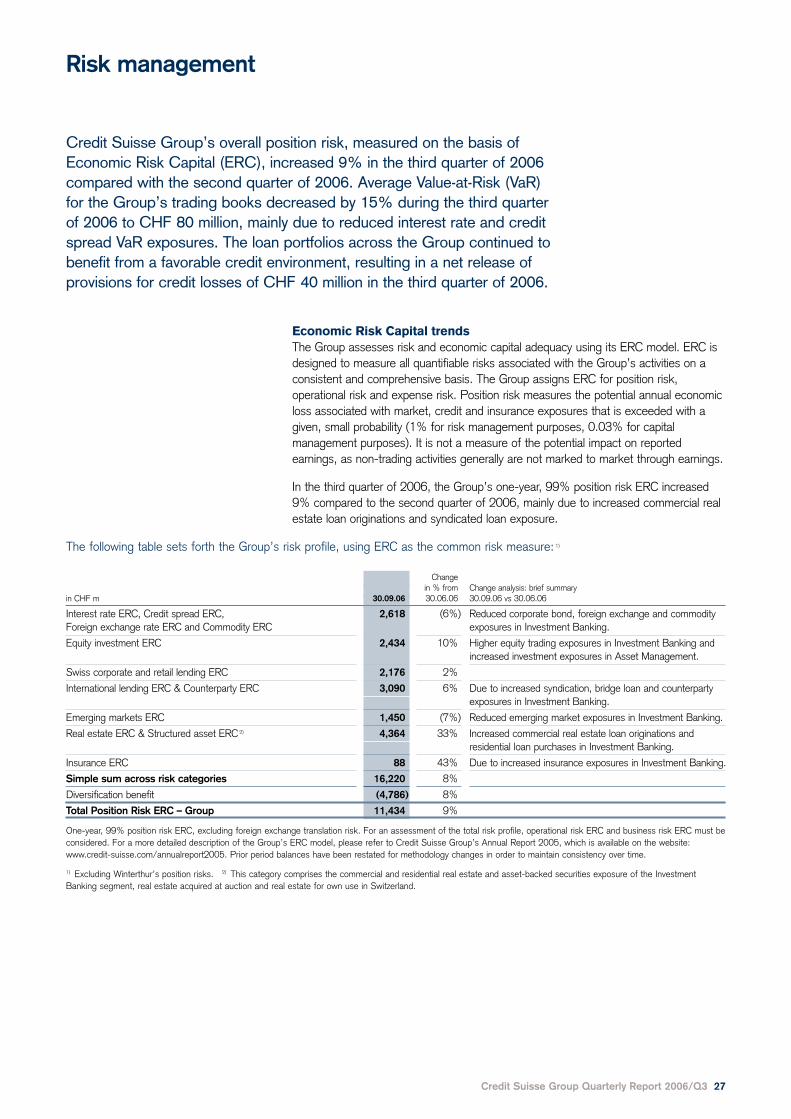
Risk management
Credit Suisse Group’s overall position risk, measured on the basis ofEconomic Risk Capital (ERC), increased 9% in the third quarter of 2006compared with the second quarter of 2006. Average Value-at-Risk (VaR)for the Group’s trading books decreased by 15% during the third quarterof 2006 to CHF 80 million, mainly due to reduced interest rate and creditspread VaR exposures. The loan portfolios across the Group continued tobenefit from a favorable credit environment, resulting in a net release ofprovisions for credit losses of CHF 40 million in the third quarter of 2006.
Economic Risk Capital trendsThe Group assesses risk and economic capital adequacy using its ERC model. ERC isdesigned to measure all quantifiable risks associated with the Group’s activities on aconsistent and comprehensive basis. The Group assigns ERC for position risk,operational risk and expense risk. Position risk measures the potential annual economicloss associated with market, credit and insurance exposures that is exceeded with agiven, small probability (1% for risk management purposes, 0.03% for capitalmanagement purposes). It is not a measure of the potential impact on reportedearnings, as non-trading activities generally are not marked to market through earnings.
In the third quarter of 2006, the Group’s one-year, 99% position risk ERC increased9% compared to the second quarter of 2006, mainly due to increased commercial realestate loan originations and syndicated loan exposure.
The following table sets forth the Group’s risk profile, using ERC as the common risk measure: 1)
Changein % from Change analysis: brief summary
in CHF m 30.09.06 30.06.06 30.09.06 vs 30.06.06
Interest rate ERC, Credit spread ERC, 2,618 (6%) Reduced corporate bond, foreign exchange and commodityForeign exchange rate ERC and Commodity ERC exposures in Investment Banking.
Equity investment ERC 2,434 10% Higher equity trading exposures in Investment Banking andincreased investment exposures in Asset Management.
Swiss corporate and retail lending ERC 2,176 2%
International lending ERC & Counterparty ERC 3,090 6% Due to increased syndication, bridge loan and counterparty exposures in Investment Banking.
Emerging markets ERC 1,450 (7%) Reduced emerging market exposures in Investment Banking.
Real estate ERC & Structured asset ERC 2) 4,364 33% Increased commercial real estate loan originations andresidential loan purchases in Investment Banking.
Insurance ERC 88 43% Due to increased insurance exposures in Investment Banking.
Simple sum across risk categories 16,220 8%
Diversification benefit (4,786) 8%
Total Position Risk ERC – Group 11,434 9%
One-year, 99% position risk ERC, excluding foreign exchange translation risk. For an assessment of the total risk profile, operational risk ERC and business risk ERC must beconsidered. For a more detailed description of the Group’s ERC model, please refer to Credit Suisse Group’s Annual Report 2005, which is available on the website:www.credit-suisse.com/annualreport2005. Prior period balances have been restated for methodology changes in order to maintain consistency over time.
1) Excluding Winterthur’s position risks. 2) This category comprises the commercial and residential real estate and asset-backed securities exposure of the InvestmentBanking segment, real estate acquired at auction and real estate for own use in Switzerland.
Credit Suisse Group Quarterly Report 2006/Q3 27

Risk management
28 Credit Suisse Group Quarterly Report 2006/Q3
Trading risks The Group primarily assumes trading risks through the trading activities of theInvestment Banking segment. The other segments also engage in trading activities, butto a much lesser extent. Trading risks are measured using Value-at-Risk (VaR) as oneof a range of risk measurement tools. VaR is the potential loss in fair value of tradingpositions due to adverse market movements over a defined time horizon and for aspecified confidence level. In order to show the aggregate market risk in the Group’strading books, the table below shows the trading-related market risk on a consolidatedbasis, as measured by a 10-day VaR scaled to a one-day holding period and based ona 99% confidence level. This means that there is a 1-in-100 chance of incurring a dailymark-to-market trading loss that is at least as large as the reported VaR.
Credit Suisse Group’s average one-day, 99% VaR in the third quarter of 2006 wasCHF 80 million, compared to CHF 95 million during the second quarter of 2006. This
The following table sets forth the trading-related market risk exposure for Credit Suisse Group andInvestment Banking, as measured by scaled one-day, 99% VaR:
3Q 2006 2Q 2006
in CHF m Minimum Maximum Average 30.09.06 Minimum Maximum Average 30.06.06
Credit Suisse Group 1)
Interest rate & credit spread 43 63 51 46 49 79 67 58
Foreign exchange rate 11 30 20 17 10 38 19 14
Equity 49 73 61 60 51 90 65 62
Commodity 6 15 9 8 6 13 8 9
Diversification benefit – 2) – 2) (61) (78) – 2) – 2) (64) (52)
Total 53 106 80 53 75 124 95 91
Investment Banking
Interest rate & credit spread 41 63 50 43 49 79 67 58
Foreign exchange rate 11 30 20 17 10 38 19 15
Equity 49 73 61 60 51 90 65 62
Commodity 6 15 9 8 6 13 8 9
Diversification benefit – 2) – 2) (60) (75) – 2) – 2) (64) (53)
Total 53 106 80 53 75 125 95 91
Represents 10-day VaR scaled to a one-day holding period.
1) The VaR estimates for Credit Suisse Group are performed on a monthly basis and the VaR statistics for Credit Suisse Group therefore refer to monthly numbers. 2) As theminimum and maximum occur on different days for different risk types, it is not meaningful to calculate a portfolio diversification benefit.
Credit Suisse Group Daily VaR
One-day VaR (99%)
150
100
50
0
in CHF m
4Q 2005 1Q 2006 2Q 2006 3Q 2006

Risk management
Credit Suisse Group Quarterly Report 2006/Q3 29
was mainly due to reduced interest rate and credit spread VaR exposures and increaseddiversification between fixed income and equity risk types.
Various techniques are used to assess the accuracy of the VaR model, includingbacktesting. Daily backtesting profit and loss is compared with VaR calculated using aone-day holding period. Backtesting profit and loss is a subset of actual trading revenueand includes only the profit and loss effects due to movements in financial marketvariables such as interest rates, equity prices and foreign exchange rates on theprevious night’s positions. An accurate one-day, 99% VaR model should have no morethan four backtesting “exceptions” per year. A backtesting exception occurs when thedaily loss exceeds the daily VaR estimate.
3Q 2005
Minimum Maximum Average 30.09.05
47 73 60 54
6 17 9 11
33 55 43 40
7 16 11 15
– 2) – 2) (59) (58)
49 77 64 62
47 73 60 53
6 12 9 12
33 54 43 40
5 14 10 14
– 2) – 2) (58) (57)
49 77 64 62
Excludes Neue Aargauer Bank and independent private banks.
Credit Suisse Group trading revenue
Daily full revenues Q3 2006 Daily full revenues Q3 2005
16
14
12
10
8
6
4
2
0
<(2
0)
(20)
–(1
0)
(10)
–(0
)
0–
10
10–
20
20–
30
30–
40
40–
50
50–
60
60–7
0
70–8
0
80–9
0
90–1
00
>10
0
Number of days
CHF m
Credit Suisse Group had no backtesting exceptions during the third quarter of 2006and four backtesting exceptions in the last twelve months after a period of two yearswith no exceptions. The four backtesting exceptions occurred during the second quarterof 2006 and were driven by equity and foreign exchange market volatility during May2006. During this period, equity and foreign exchange market volatility was significantlylarger than the volatility reflected in the VaR model, which uses historic data on apreceding two year rolling basis. The VaR model is also subject to continuousassessment and evaluation to ensure it remains accurate given current marketconditions and positions.
The histogram entitled “Credit Suisse Group trading revenue” reflects the distribution ofdaily actual trading revenues (which includes the profit and loss associated with tradingpositions as well as the fees, commissions and provisions relating to trading activities)during the third quarter of 2006 and 2005. The width of this distribution providesanother indication of the day-to-day risk in our trading activities.
Loan exposureThe Group’s total loan exposure increased 4% to CHF 206 billion as of September 30,2006 compared to June 30, 2006, primarily due to increases in commercial andindustrial loans, particularly in Investment Banking, as well as a slight increase inmortgages in Private Banking.
Compared to June 30, 2006, the Group’s total non-performing loans declined 1% andtotal impaired loans declined 9% as of September 30, 2006. Private Banking andInvestment Banking reported further reductions in total impaired loans during the thirdquarter.
In the third quarter of 2006, the Group recorded a net release of provisions for creditlosses of CHF 40 million, compared to net new provisions of CHF 10 million in thesecond quarter of 2006. The additions, releases and recoveries included in determiningthe allowance for loan losses are presented in the following tables.
Coverage of total impaired loans by valuation allowances at the Group decreasedslightly from 68% as of June 30 to 65% as of September 30, 2006 with a smallincrease in Investment Banking and a small decrease in Private Banking. Coverage oftotal non-performing loans declined slightly in Private Banking and more notably inInvestment Banking, which was largely a result of the resolution of a potential problemloan.
Risk management
30 Credit Suisse Group Quarterly Report 2006/Q3

Risk management
Credit Suisse Group Quarterly Report 2006/Q3 31
The following table sets forth the gross loan exposure for the Group and its primary lending segments:Investment Banking Private Banking Credit Suisse Group
in CHF m 30.09.06 30.06.06 31.12.05 30.09.06 30.06.06 31.12.05 30.09.06 30.06.06 31.12.05 1)
Consumer loans:
Mortgages 0 0 0 75,977 74,674 75,122 75,977 74,674 80,779
Loans collateralized by securities 0 0 0 16,846 15,809 17,203 16,846 15,809 17,207
Other 991 749 816 3,843 3,685 2,960 4,834 4,434 3,787
Consumer loans 991 749 816 96,666 94,168 95,285 97,657 94,917 101,773
Corporate loans:
Real estate 497 493 508 25,265 25,290 24,728 25,762 25,783 26,597
Commercial & industrial loans 23,867 20,520 16,204 40,778 39,796 37,747 64,816 60,408 55,295
Loans to financial institutions 16,501 16,113 16,979 747 675 615 17,248 16,788 19,794
Governments and public institutions 771 749 784 1,251 1,348 1,380 2,022 2,097 4,389
Corporate loans 41,636 37,875 34,475 68,041 67,109 64,470 109,848 105,076 106,075
Loans, gross 42,627 38,624 35,291 164,707 161,277 159,755 207,505 199,993 207,848
(Unearned income)/deferred expenses, net (63) (58) (64) 84 95 118 21 37 64
Allowance for loan losses (255) (376) (465) (1,271) (1,359) (1,726) (1,527) (1,736) (2,241)
Total loans, net 42,309 38,190 34,762 163,520 160,013 158,147 205,999 198,294 205,671
This disclosure presents the lending exposure of the Group from a risk management perspective. This presentation differs from other disclosures in this document.
The following table sets forth the impaired loan portfolio for the Group and its primary lending segments:Investment Banking Private Banking Credit Suisse Group
in CHF m 30.09.06 30.06.06 31.12.05 30.09.06 30.06.06 31.12.05 30.09.06 30.06.06 31.12.05 1)
Non-performing loans 207 198 143 1,002 993 1,157 1,209 1,192 1,323
Non-interest earning loans 10 10 11 570 604 830 580 614 845
Total non-performing loans 217 208 154 1,572 1,597 1,987 1,789 1,806 2,168
Restructured loans 0 14 55 21 7 21 21 21 77
Potential problem loans 36 160 303 492 574 726 529 733 1,074
Total other impaired loans 36 174 358 513 581 747 550 754 1,151
Total impaired loans, gross 253 382 512 2,085 2,178 2,734 2,339 2,560 3,319
Valuation allowances as % of
Total non-performing loans 118% 181% 302% 81% 85% 87% 85% 96% 103%
Total impaired loans 101% 98% 91% 61% 62% 63% 65% 68% 68%
The following table sets forth the movements in the allowance for loan losses for the Group and its primary lending segments:Investment Banking Private Banking Credit Suisse Group
in CHF m 3Q 2006 2Q 2006 3Q 2005 3Q 2006 2Q 2006 3Q 2005 3Q 2006 2Q 2006 3Q 2005 1)
Balance beginning of period 376 442 562 1,359 1,561 2,112 1,736 2,054 2,733
Discontinued operations 0 0 0 0 0 0 0 (48) 0
Net additions chargedto income statement (35) 6 (51) (19) (4) (6) (54) 2 (60)
Gross write-offs (111) (78) (117) (82) (199) (135) (192) (278) (255)
Recoveries 2 15 2 7 6 7 10 21 10
Net write-offs (109) (63) (115) (75) (193) (128) (182) (257) (245)
Allowances acquired/(deconsolidated) and provisions for interest 16 18 18 3 2 (2) 18 20 16
Foreign currency translation impactand other adjustments, net 7 (27) 4 3 (7) 0 9 (35) 1
Balance end of period 255 376 418 1,271 1,359 1,976 1,527 1,736 2,445
Provision for credit losses disclosed in the Credit Suisse Group unaudited condensed consolidated statements of income also includes provisions for lending-related exposureof CHF 14 million, CHF 8 million and CHF 14 million for 3Q 2006, 2Q 2006 and 3Q 2005, respectively.
1) Not adjusted for discontinued operations.

Condensed consolidated financial statements
Consolidated statements of income (unaudited)
9 months
Change Change Changein % from in % from in % from
in CHF m 3Q 2006 2Q 2006 3Q 2005 2Q 2006 3Q 2005 2006 2005 2005
Interest and dividend income 12,825 13,110 9,229 (2) 39 37,252 25,725 45
Interest expense (11,218) (11,244) (7,602) 0 48 (32,113) (20,113) 60
Net interest income 1,607 1,866 1,627 (14) (1) 5,139 5,612 (8)
Commissions and fees 3,919 4,425 3,693 (11) 6 12,578 10,279 22
Trading revenues 1,693 1,371 2,023 23 (16) 6,472 4,348 49
Other revenues 857 1,126 780 (24) 10 3,600 2,684 34
Total noninterest revenues 6,469 6,922 6,496 (7) 0 22,650 17,311 31
Net revenues 8,076 8,788 8,123 (8) (1) 27,789 22,923 21
Provision for credit losses (40) 10 (46) – (13) (91) (110) (17)
Compensation and benefits 3,427 3,697 3,595 (7) (5) 11,597 9,990 16
Other expenses 2,229 1,903 2,036 17 9 6,297 6,701 (6)
Total operating expenses 5,656 5,600 5,631 1 0 17,894 16,691 7
Income from continuing operations before taxes,minority interests, extraordinary items andcumulative effect of accounting changes 2,460 3,178 2,538 (23) (3) 9,986 6,342 57
Income tax expense 367 502 512 (27) (28) 1,584 1,035 53
Minority interests 625 804 490 (22) 28 2,720 1,458 87
Income from continuing operations beforeextraordinary items and cumulative effectof accounting changes 1,468 1,872 1,536 (22) (4) 5,682 3,849 48
Income from discontinued operations, net of tax 424 286 382 48 11 996 884 13
Extraordinary items, net of tax 0 0 0 – – (24) 0 –
Cumulative effect of accounting changes, net of tax 0 0 0 – – 0 14 (100)
Net income 1,892 2,158 1,918 (12) (1) 6,654 4,747 40
9 months
in CHF 3Q 2006 2Q 2006 3Q 2005 2006 2005
Basic earnings per share
Income from continuing operations before cumulative effect of accounting changes 1.35 1.68 1.33 5.13 3.36
Income from discontinued operations, net of tax 0.39 0.26 0.34 0.89 0.79
Extraordinary items, net of tax 0.00 0.00 0.00 (0.02) 0.00
Cumulative effect of accounting changes, net of tax 0.00 0.00 0.00 0.00 0.01
Net income available for common shares 1.74 1.94 1.67 6.00 4.16
Diluted earnings per share
Income from continuing operations before cumulative effect of accounting changes 1.29 1.61 1.31 4.91 3.30
Income from discontinued operations, net of tax 0.38 0.25 0.32 0.86 0.74
Extraordinary items, net of tax 0.00 0.00 0.00 (0.02) 0.00
Cumulative effect of accounting changes, net of tax 0.00 0.00 0.00 0.00 0.01
Net income available for common shares 1.67 1.86 1.63 5.75 4.05
32 Credit Suisse Group Quarterly Report 2006/Q3
The accompanying notes to the unaudited condensed consolidated financial statements are an integral part of these statements.

Consolidated balance sheets (unaudited)Change Change
in % from in % fromin CHF m 30.09.06 30.06.06 31.12.05 30.06.06 31.12.05
Assets
Cash and due from banks 29,802 32,879 27,577 (9) 8
Interest-bearing deposits with banks 6,869 6,103 6,143 13 12
Central bank funds sold, securities purchased under resaleagreements and securities borrowing transactions 337,445 328,155 352,281 3 (4)
Securities received as collateral 38,145 29,875 23,950 28 59
Trading assets (of which CHF 172,706 m, CHF 152,589 mand CHF 151,793 m encumbered) 468,654 439,119 435,250 7 8
Investment securities (of which CHF 54 m,CHF 102 m and CHF 2,456 m encumbered) 21,802 21,737 121,565 0 (82)
Other investments 19,835 19,405 20,736 2 (4)
Loans, net of allowance for loan lossesof CHF 1,527 m, CHF 1,736 m and CHF 2,241 m 205,999 198,294 205,671 4 0
Premises and equipment 5,890 5,706 7,427 3 (21)
Goodwill 11,220 10,977 12,932 2 (13)
Other intangible assets 522 521 3,091 0 (83)
Assets of discontinued operations held-for-sale 180,784 174,991 1,378 3 –
Other assets (of which CHF 34,112 m,CHF 28,955 m and CHF 4,860 m encumbered) 146,146 136,800 121,051 7 21
Total assets 1,473,113 1,404,562 1,339,052 5 10
Liabilities and shareholders’ equity
Deposits 390,437 377,344 364,238 3 7
Central bank funds purchased, securities sold under repurchaseagreements and securities lending transactions 314,531 282,701 309,803 11 2
Obligation to return securities received as collateral 38,145 29,875 23,950 28 59
Trading liabilities 212,942 212,465 194,225 0 10
Short-term borrowings (of which CHF 2,882 mreported at fair value as of September 30, 2006) 22,742 21,779 19,472 4 17
Provisions from the insurance business 0 0 145,039 – (100)
Long-term debt (of which CHF 48,946 mreported at fair value as of September 30, 2006) 149,917 142,737 132,975 5 13
Liabilities of discontinued operations held-for-sale 171,838 168,058 1,330 2 –
Other liabilities 115,381 115,995 98,055 (1) 18
Minority interests 15,537 14,726 7,847 6 98
Total liabilities 1,431,470 1,365,680 1,296,934 5 10
Common shares 607 624 624 (3) (3)
Additional paid-in capital 24,364 24,553 24,639 (1) (1)
Retained earnings 27,652 27,080 24,584 2 12
Treasury shares, at cost (7,759) (9,018) (5,823) (14) 33
Accumulated other comprehensive income/(loss) (3,221) (4,357) (1,906) (26) 69
Total shareholders’ equity 41,643 38,882 42,118 7 (1)
Total liabilities and shareholders’ equity 1,473,113 1,404,562 1,339,052 5 10
Condensed consolidated financial statements
Credit Suisse Group Quarterly Report 2006/Q3 33
The accompanying notes to the unaudited condensed consolidated financial statements are an integral part of these statements.

Consolidated statements of changes in shareholders’ equity (unaudited) Common Accumulated
Common Additional shares in other com-shares Common paid-in Retained treasury prehensive
9 months, in CHF m, except common shares outstanding outstanding shares capital earnings at cost income/(loss) Total
Balance January 1, 2005 1,110,819,481 607 23,435 20,501 (4,547) (3,723) 36,273
Net income 4,747 4,747
Other comprehensive income, net of tax 1,742 1,742
Issuance of common shares 171,374 4 4
Issuance of treasury shares 167,096,611 10 8,614 8,624
Repurchase of treasury shares (226,838,313) (11,730) (11,730)
Share-based compensation 33,929,271 (859) 1,600 741
Cash dividends paid (1,767) (1,767)
Balance September 30, 2005 1,085,178,424 607 22,590 23,481 (6,063) (1,981) 38,634
Balance January 1, 2006 1,125,360,183 1) 624 24,639 24,584 (5,823) (1,906) 42,118
Net income 6,654 6,654
Cumulative effect of accounting changes, net of tax 60 60
Other comprehensive income, net of tax (1,315) (1,315)
Issuance of common shares 302,704 14 14
Cancellation of repurchased shares (17) (608) (1,316) 1,941 0
Issuance of treasury shares 180,402,200 (73) 12,752 12,679
Repurchase of treasury shares (245,829,686)2) (17,340) (17,340)
Share-based compensation 17,109,313 392 711 1,103
Cash dividends paid (2,330) (2,330)
Balance September 30, 2006 1,077,344,714 3) 607 24,364 27,652 (7,759) (3,221) 41,643
1) At par value CHF 0.50 each, fully paid, net of 122,391,983 treasury shares. In addition to the treasury shares, a maximum of 217,698,047 unissued shares (conditionaland authorized capital) were available for issuance without further approval of the shareholders. 2) Includes 36,557,800 shares repurchased in connection with Credit SuisseGroup’s share buyback program. 3) At par value CHF 0.50 each, fully paid, net of 136,710,156 treasury shares. 34,000,000 treasury shares which were approved forcancellation at the Annual General Meeting on April 28, 2006, were cancelled in the third quarter of 2006. In addition to the treasury shares, a maximum of 199,389,419unissued shares (conditional and authorized capital) were available for issuance without further approval of the shareholders.
Comprehensive income (unaudited)
9 months
in CHF m 3Q 2006 2Q 2006 3Q 2005 2006 2005
Net income 1,892 2,158 1,918 6,654 4,747
Other comprehensive income/(loss) 1,136 (1,748) 145 (1,315) 1,742
Comprehensive income 3,028 410 2,063 5,339 6,489
Condensed consolidated financial statements
34 Credit Suisse Group Quarterly Report 2006/Q3
The accompanying notes to the unaudited condensed consolidated financial statements are an integral part of these statements.

Consolidated statements of cash flows (unaudited)
9 months
in CHF m 2006 2005
Operating activities of continuing operations
Net income 6,654 4,747
(Income)/loss from discontinued operations, net of tax (996) (884)
Income from continuing operations 5,658 3,863
Adjustments to reconcile net income to net cash provided by/(used in) operating activities of continuing operations
Impairment, depreciation and amortization 771 685
Provision for credit losses (91) (110)
Deferred tax provision 330 (152)
Share of net income from equity method investments 38 (225)
Cumulative effect of accounting changes, net of tax 0 (14)
Trading assets and liabilities (34,163) (8,007)
(Increase)/decrease in accrued interest, fees receivable and other assets (38,690) (28,634)
Increase/(decrease) in accrued expenses and other liabilities 20,136 7,875
Other, net (460) (1,768)
Total adjustments (52,129) (30,350)
Net cash provided by/(used in) operating activities of continuing operations (46,471) (26,487)
Investing activities of continuing operations
(Increase)/decrease in interest-bearing deposits with banks (1,141) (644)
(Increase)/decrease in central bank funds sold, securities purchased under resale agreements and securities borrowing transactions (320) (33,917)
Purchase of investment securities (3,031) (10,084)
Proceeds from sale of investment securities 1,062 286
Maturities of investment securities 4,402 7,251
Investments in subsidiaries and other investments (3,639) (1,667)
Proceeds from sale of other investments 2,705 1,144
(Increase)/decrease in loans (20,090) (13,691)
Proceeds from sales of loans 3,116 1,810
Capital expenditures for premises and equipment and other intangible assets (1,144) (642)
Proceeds from sale of premises and equipment and other intangible assets 19 53
Other, net (42) 214
Net cash provided by/(used in) investing activities of continuing operations (18,103) (49,887)
Condensed consolidated financial statements
Credit Suisse Group Quarterly Report 2006/Q3 35
The accompanying notes to the unaudited condensed consolidated financial statements are an integral part of these statements.

Consolidated statements of cash flows – continued (unaudited)
9 months
in CHF m 2006 2005
Financing activities of continuing operations
Increase/(decrease) in deposits 29,331 41,598
Increase/(decrease) in short-term borrowings 4,165 (346)
Increase/(decrease) in central bank funds purchased, securities sold under repurchase agreements and securities lending transactions 23,556 32,705
Issuances of long-term debt 59,569 33,595
Repayments of long-term debt (40,456) (21,138)
Issuances of common shares 14 4
Issuances of treasury shares 12,679 8,624
Repurchase of treasury shares (17,340) (11,730)
Dividends paid/capital repayments (including minority interests and trust preferred securities) (2,354) (1,794)
Other, net 1,853 174
Net cash provided by/(used in) financing activities of continuing operations 71,017 81,692
Effect of exchange rate changes on cash and due from banks (570) 2,054
Discontinued operations
Net cash provided by/(used in) operating activities of discontinued operations (460) 3,873
Net cash provided by/(used in) investing activities of discontinued operations (3,286) (8,852)
Net cash provided by/(used in) financing activities of discontinued operations 98 (914)
Net increase/(decrease) in cash and due from banks 2,225 1,479
Cash and due from banks at beginning of period 27,577 25,648
Cash and due from banks at end of period 29,802 27,127
Supplemental disclosures of cash flow information (unaudited)9 months
in CHF m 2006 2005
Cash paid during the year for income taxes 1,575 1,678
Cash paid during the year for interest 31,039 19,295
Assets acquired and liabilities assumed in business acquisitions
Fair value of assets acquired 194 68
Fair value of liabilities assumed 194 37
Condensed consolidated financial statements
36 Credit Suisse Group Quarterly Report 2006/Q3
The accompanying notes to the unaudited condensed consolidated financial statements are an integral part of these statements.

Notes to the condensed consolidated financial statements – unaudited
Summary of significant accounting policies
Basis of presentationThe accompanying unaudited condensed consolidated financial statements of CreditSuisse Group (the Group) are prepared in accordance with accounting principlesgenerally accepted in the United States of America (US GAAP) and are stated in Swissfrancs (CHF). These condensed consolidated financial statements should be read inconjunction with the US GAAP consolidated financial statements and notes thereto forthe year ended December 31, 2005, included in Credit Suisse Group’s Annual Report2005. For a description of the Group’s significant accounting policies, see note 1 of theaforementioned consolidated financial statements.
Due to the Group’s announcement in June 2006 regarding the sale of Winterthur, theresults of operations of the Winterthur businesses being sold, which were previouslyreported as a separate segment of the Group, are reflected in Income from
discontinued operations, net of tax in the consolidated statements of income for allperiods presented. The assets and liabilities of Winterthur have been presented asAssets of discontinued operations held-for-sale and Liabilities of discontinued operations
held-for-sale, respectively, in the consolidated balance sheet as of September 30 andJune 30, 2006.
Certain financial information, which is normally included in annual financial statementsprepared in accordance with US GAAP but not required for interim reporting purposeshas been condensed or omitted. Certain reclassifications have been made to the priorperiod’s financial statements to conform to the current period’s presentation. Thesecondensed consolidated financial statements reflect, in the opinion of management, alladjustments that are necessary for a fair presentation of the condensed consolidatedfinancial statements for the interim periods presented.
The results of operations for interim periods are not indicative of results for the entireyear.
In preparing these condensed consolidated financial statements, management isrequired to make estimates and assumptions, which affect the reported amounts ofassets and liabilities and disclosure of contingent assets and liabilities at the date of thecondensed consolidated balance sheets and the reported amounts of revenues andexpenses during the reporting period. Actual results could differ from those estimates.
Recently adopted accounting standardsEITF 04-5, FSP SOP 78-9-1 and EITF 96-16In June 2005, the Financial Accounting Standards Board (FASB) ratified EmergingIssues Task Force (EITF) Issue No. 04-5, “Determining Whether a General Partner, orthe General Partners as a Group, Controls a Limited Partnership or Similar Entity Whenthe Limited Partners Have Certain Rights” (EITF 04-5). EITF 04-5 provides aframework for evaluating whether a general partner or a group of general partnerscontrols a limited partnership and therefore should consolidate it. EITF 04-5 states thatthe presumption of general partner control is overcome only when the limited partnershave substantive “kick-out rights” or “participating rights.” These rights would allow asimple majority of the limited partners to dissolve or liquidate the partnership orotherwise remove the general partner “without cause” or effectively participate insignificant decisions made in the ordinary course of the partnership business. EITF 04-5 was effective upon ratification for all newly formed limited partnerships and forexisting limited partnership agreements that have been modified. This guidance waseffective for the Group with respect to existing unmodified partnerships as ofJanuary 1, 2006.
Credit Suisse Group Quarterly Report 2006/Q3 37
As a result of the ratification of EITF 04-5, EITF Issue No. 96-16, “Investor’sAccounting for an Investee When the Investor Has a Majority of the Voting Interest butthe Minority Shareholder or Shareholders Have Certain Approval or Veto Rights” (EITF96-16) was updated and FASB Staff Position (FSP) No. SOP 78-9-1, “Interaction ofAmerican Institute of Certified Public Accountants (AICPA) Statement of Position (SOP)78-9 and EITF Issue No. 04-5” (FSP SOP 78-9-1) was issued. The amendments toEITF 96-16 were effective on a prospective basis upon issuance, whereas, similar toEITF 04-5, FSP SOP 78-9-1 was effective upon issuance for all new partnershipsformed and for existing partnership agreements modified after June 29, 2005, and waseffective for the Group with respect to existing unmodified partnerships as ofJanuary 1, 2006.
The changes to EITF 96-16 and the provisions of EITF 04-5 and FSP SOP 78-9-1 ineffect during 2005 did not have a material impact on the Group’s financial condition,results of operations or cash flows. As of January 1, 2006, the Group increased itsassets and liabilities by CHF 8.2 billion, primarily due to the consolidation of certainunmodified private equity partnerships which existed prior to June 29, 2005.
SFAS 123RIn December 2004, the FASB issued Statement of Financial Accounting Standards(SFAS) No. 123 (Revised 2004), “Share-Based Payment” (SFAS 123R). SFAS 123Rwas effective for annual reporting periods beginning after June 15, 2005. The Groupearly adopted SFAS 123R as of January 1, 2005, applying the modified prospectivemethod. The Group’s policy is to expense share-based awards over the requisiteservice period.
The most significant accounting implications of the adoption of SFAS 123R for theGroup were as follows: (i) inclusion of forfeitures in the estimate of compensationexpense determined at the grant date rather than as they occur. The Group recorded acumulative adjustment of approximately CHF 14 million during the first quarter of 2005to reverse the expense previously recognized on all outstanding unvested awardsexpected to be forfeited. For new grants after January 1, 2005, forfeitures have beenincluded in the initial estimation of the compensation expense at the grant date; (ii)recognition of compensation cost for all outstanding unvested awards as of January 1,2005, that were previously accounted for under APB 25 and for which no expense waspreviously recognized, based on the original grant-date fair value of each award over theremaining requisite service period of the respective award (the recognition of thisexpense was not material); and (iii) adoption of changes to the presentation of thestatement of cash flows in accordance with the revised standard.
In a December 2005 speech, the US Securities and Exchange Commission (SEC) staffprovided further guidance on SFAS 123R, relating to accounting for share-basedcompensation awards subject to a non-competition provision that have scheduledvesting beyond an employee’s eligibility for early retirement. The SEC staff noted thatsuch share-based awards should generally be expensed over the period from the grantdate to the date an employee becomes eligible for early retirement, rather than over theentire vesting, or stated service, period, unless the non-competition provision and otherfactors establish an in-substance requisite service period that extends beyond the earlyretirement date. As a result of the December 2005 guidance, and based onsubsequent discussions with the SEC staff, the Group recorded in the fourth quarter of2005 an incremental expense to reflect the full-year cost of its 2005 share-basedawards. This incremental expense reflected the attribution of the total cost of theseawards over the period from the grant date to the date the employee becomes eligiblefor early retirement rather than over the vesting period that ranged from three to fiveyears.
Notes to the condensed consolidated financial statements – unaudited
38 Credit Suisse Group Quarterly Report 2006/Q3

The impact of the Group’s change in accounting was to increase fourth-quarter andfull-year 2005 banking compensation and benefits by CHF 630 million, and todecrease fourth-quarter and full-year 2005 net income by CHF 421 million. This non-cash charge, recorded in the Corporate Center, represented the recognition ofcompensation expense for share-based awards granted in 2005 that otherwise wouldhave been recorded in the segments, principally Investment Banking, generally overvesting periods of three to five years.
The share-based awards granted in March 2006 provide for early retirement eligibilityno earlier than two years after the award grant date. These awards will be recorded ascompensation expense in the Group’s segments over the period from the grant date ofMarch 2006 to the date an employee becomes eligible for early retirement if earlierthan the three to five year vesting period.
SFAS 154In May 2005, the FASB issued SFAS No. 154, “Accounting Changes and ErrorCorrections, a replacement of APB Opinion No. 20, ‘Accounting Changes’ (APB 20)and FASB Statement No. 3, ‘Reporting Accounting Changes in Interim FinancialStatements (an Amendment of APB Opinion No. 28, ‘Interim Financial Reporting’)’”(SFAS 154). SFAS 154 requires retrospective application, unless impracticable, to priorperiods’ financial statements for voluntary changes in accounting principles andchanges required by an accounting pronouncement in the unusual circumstances inwhich the pronouncement does not include specific transition provisions. This statementalso requires that a change in depreciation, amortization or depletion method for long-lived, non-financial assets should be accounted for as a change in accounting estimateeffected by a change in accounting principle (i.e., as a retrospective application). Theguidance for reporting the correction of an error in previously issued financialstatements and the change of an accounting estimate does not change from APB 20.SFAS 154 was effective for the Group as of January 1, 2006. The adoption of SFAS154 did not have a material impact on the Group’s financial condition, results ofoperations or cash flows.
SFAS 155In February 2006, the FASB issued SFAS No. 155, “Accounting for Certain HybridFinancial Instruments” (SFAS 155), which amends SFAS No. 133, “Accounting forDerivative Instruments and Hedging Activities” (SFAS 133) and SFAS No. 140,“Accounting for Transfers and Servicing of Financial Assets and Extinguishments ofLiabilities” (SFAS 140). Under SFAS 155, hybrid financial instruments which containembedded derivatives that would otherwise require bifurcation may be accounted for atfair value, with changes in fair value recognized in the statement of income. The fairvalue designation may be applied on an instrument-by-instrument basis; however, theelection to apply fair value accounting is irrevocable. SFAS 155 is effective for thoseinstruments acquired or issued on or after an entity’s fiscal year beginning afterSeptember 15, 2006, but early adoption is permitted as of the beginning of a fiscalyear for which an entity has not previously issued interim financial statements. SFAS155 allows limited retrospective application for existing bifurcated hybrid financialinstruments. The Group elected to early adopt SFAS 155 as of January 1, 2006, andthe impact of adoption was an increase to the Group’s consolidated retained earningsof CHF 33 million, which included gross gains after tax of CHF 119 million and grosslosses after tax of CHF 86 million and a corresponding decrease to the Group’sconsolidated liabilities of CHF 33 million as of January 1, 2006. Pre-tax income for thenine months ended September 30, 2006 increased CHF 21 million as a result of thischange in accounting policy.
Notes to the condensed consolidated financial statements – unaudited
Credit Suisse Group Quarterly Report 2006/Q3 39
SFAS 156In March 2006, the FASB issued SFAS No. 156, “Accounting for Servicing of FinancialAssets” (SFAS 156), which amended SFAS 140. SFAS 156 requires that all separatelyrecognized servicing rights after the effective date be initially measured at fair value andpermits separately recognized servicing rights to be accounted for at fair value insubsequent periods, with changes in fair value recognized in the statement of income.SFAS 156 permits an irrevocable election to apply fair value accounting for classes ofservicing rights based on the different valuation and risk characteristics of the underlyingassets and the way the economic risks are managed. SFAS 156 is effective on aprospective basis for fiscal years beginning after September 15, 2006, however earlyadoption is permitted as of the beginning of a fiscal year for which an entity has notpreviously issued interim financial statements. SFAS 156 allows limited retrospectiveapplication for existing separately recognized servicing rights. The Group elected to earlyadopt SFAS 156 as of January 1, 2006. The adoption of SFAS 156 did not have amaterial impact on the Group’s financial condition, results of operations or cash flows.
FSP FTB 85-4-1In March 2006, the FASB issued FSP No. FTB 85-4-1, “Accounting for LifeSettlement Contracts by Third-Party Investors” (FSP FTB 85-4-1). FSP FTB 85-4-1provides a contract-by-contract election to account for life settlement contracts oneither a fair value basis, with changes in fair value recognized in the statement ofincome, or through use of the investment method. Under the investment method, theinitial investment and continuing costs are capitalized; no income is recognized untildeath of the insured party. The guidance of FSP FTB 85-4-1 is effective for fiscalyears beginning after June 15, 2006, and will permit early adoption; however, uponadoption, limited retrospective application of the measurement guidance is required. TheGroup elected to early adopt FSP FTB 85-4-1 as of January 1, 2006, and the impactof adoption was an increase to the Group’s consolidated assets and retained earningsof CHF 27 million net of tax.
FSP FIN 46(R)-6In April 2006, the FASB issued FSP No. FIN 46(R)-6, “Determining the Variability toBe Considered in Applying FASB Interpretation No. 46(R)” (FSP FIN 46(R)-6). FSPFIN 46(R)-6 provides guidance regarding how contracts or arrangements that create orreduce variability should be assessed when determining if they are variable interestentities (VIEs) and when assessing the need for consolidation of VIEs. FSP FIN 46(R)-6 requires that evaluations of the variability created or absorbed in an entity from itscontracts or arrangements be based on an analysis of the entity’s design. In evaluatingthe design of an entity, an analysis must be performed as to the potential risks to whichthe entity is exposed as well as the risks that the entity was designed to create andpass along to its interest holders based on the purpose for which the entity was formed.The guidance of FSP FIN 46(R)-6 was adopted by the Group and applied effective July1, 2006 to all new entities as well as entities previously analyzed under FIN 46(R) whena reconsideration event occurs. FSP FIN 46(R)-6 did not have a material impact on theGroup’s financial condition, results of operations or cash flows.
Standards to be adopted in future periodsFIN 48In July 2006, the FASB issued FASB Interpretation No. 48, “Accounting forUncertainty in Income Taxes – An Interpretation of FASB Statement No. 109” (FIN 48).FIN 48 addresses the accounting for uncertainty in income taxes by prescribing aconsistent recognition threshold and measurement attribute for tax positions taken orexpected to be taken in a tax return. FIN 48 also provides guidance on thederecognition, classification, interest and penalties, accounting in interim periods,disclosure and transition.
FIN 48 requires a two-step process in evaluating tax positions. In the first step, anenterprise determines whether it is more likely than not that a tax position will besustained upon examination, including resolution of any related appeals or litigation
Notes to the condensed consolidated financial statements – unaudited
40 Credit Suisse Group Quarterly Report 2006/Q3

processes, based on the technical merits of the position. Tax positions meeting themore-likely-than-not recognition threshold are then measured to determine the amountof benefit eligible for recognition in the financial statements. Each tax position ismeasured at the largest amount of benefit that is more likely than not to be realizedupon ultimate settlement.
The provisions of FIN 48 are effective for fiscal years beginning after December 15,2006. The Group is currently evaluating the impact of adopting FIN 48.
SFAS 157In September 2006, the FASB issued SFAS No. 157, “Fair Value Measurements”(SFAS 157). SFAS 157 establishes a single authoritative definition of fair value, setsout a framework for measuring fair value, and requires additional disclosures forinstruments carried at fair value. The statement applies only to fair value measurementswhich are already required or permitted by other accounting standards. It will affectcurrent practice by eliminating the EITF 02-3 guidance which prohibits the recognitionof gains or losses at the inception of derivative transactions whose fair value is primarilyestimated based upon unobservable market data. SFAS 157 will also eliminate the useof blockage factors by brokers, dealers and investment companies that have beenapplying the applicable AICPA Audit and Accounting Guides. SFAS 157 is effective forfinancial statements issued for fiscal years beginning after November 15, 2007, withearly adoption permitted. The Group is currently evaluating the impact of adoptingSFAS 157.
SFAS 158In September 2006, the FASB issued SFAS No. 158, “Employers’ Accounting forDefined Benefit Pension and Other Postretirement Plans – an amendment of FASBStatements No. 87, 88, 106 and 132(R)” (SFAS 158). SFAS 158 requires anemployer to: 1) recognize in the statement of financial condition the funded status of abenefit plan on a prospective basis; 2) recognize as a component of othercomprehensive income, net of tax, the actuarial gains or losses and prior service costsor credits that arise during the period but are not recognized as components of netperiodic benefit cost pursuant to SFAS No. 87, “Employers’ Accounting for Pensions”(SFAS 87) or No. 106, “Employers’ Accounting for Postretirement Benefits Other thanPensions” (SFAS 106). Amounts recognized in accumulated other comprehensiveincome, including gains or losses, prior service costs or credits and transition assets orobligations remaining from the initial application of SFAS 87 and 106, are to beadjusted as they are subsequently recognized as a component of net periodic benefitcost; 3) measure the defined benefit plan assets and obligations at the date of theemployer’s fiscal year-end statement of financial condition; and 4) disclose in the notesto the financial statements additional information about certain effects on net periodicbenefit cost for the next fiscal year that arise from delayed recognition of the gains orlosses, prior service costs or credits and transition asset or obligation. SFAS 158recognition provisions associated with the funded status of a benefit plan are effectiveas of the end of the fiscal year ending after December 15, 2006. The provision tomeasure plan assets and benefit obligations as of the date of the employer’s fiscalyear-end statement of financial condition is effective for fiscal years ending afterDecember 15, 2008 with early adoption permitted. The Group is currently evaluatingthe impact of adopting SFAS 158.
SAB 108In September 2006, the SEC issued Staff Accounting Bulletin No. 108 on QuantifyingMisstatements (SAB 108). SAB 108 requires registrants to use both a balance sheetapproach and an income statement approach when quantifying and evaluating themateriality of a misstatement. In addition, SAB 108 provides guidance on correctingerrors under this approach as well as providing transition guidance on correcting errorsthat existed prior to application of SAB 108. The guidance in SAB 108 is effective forthe first fiscal year ending after November 15, 2006 with early adoption permitted. TheGroup will adopt SAB 108 as of December 31, 2006.
Notes to the condensed consolidated financial statements – unaudited
Credit Suisse Group Quarterly Report 2006/Q3 41

Discontinued operations
In June 2006, the Group announced a definitive agreement for the sale of Winterthurto AXA for cash consideration of CHF 12.3 billion. As a part of the sale agreement,AXA agreed to repay approximately CHF 1.1 billion of debt currently outstandingbetween the Group and Winterthur. The gain on the sale will be recognized at the timeof closing, which is expected to occur by the end of 2006, subject to regulatoryapprovals and closing conditions. As of September 30, 2006, Winterthur’sshareholder’s equity was CHF 9.9 billion. The Group did not provide any indemnificationin respect of Winterthur’s insurance reserves in the sale agreement.
According to the sale agreement, certain banking and service agreements will continueto exist for a period not to exceed three years. These agreements may be terminated orrenewed at any time. The costs and revenues associated with these agreements areconsidered insignificant.
The businesses being acquired by AXA generated net revenues of CHF 6,612 million,CHF 7,332 million, CHF 22,219 million and CHF 23,647 million and net income ofCHF 424 million, CHF 382 million, CHF 996 million and CHF 884 million, respectively,for the three-month and nine-month periods ended September 30, 2006 and 2005.These businesses had total assets of CHF 180.8 billion and total liabilities ofCHF 171.8 billion as of September 30, 2006. The results of operations of thebusinesses being sold, which were reported as a separate segment of the Group priorto the second quarter of 2006, are now reflected in Income from discontinued
operations, net of tax in the consolidated statements of income for all periodspresented. The assets and liabilities of the businesses being sold have been presentedas Assets of discontinued operations held-for-sale and Liabilities of discontinued
operations held-for-sale, respectively, in the consolidated balance sheets as ofSeptember 30, 2006, and June 30, 2006.
Income amounts presented in discontinued operations relating to Winterthur differ fromthose previously reported in the segment results due to the elimination of intercompanytransactions between Winterthur and Credit Suisse Group. Intercompany transactionsare not eliminated for the purposes of presenting segment results, but are excludedfrom earnings when presented in the line item Income from discontinued operations,
net of tax.
Notes to the condensed consolidated financial statements – unaudited
42 Credit Suisse Group Quarterly Report 2006/Q3

The following table summarizes the Income from discontinued operations:9 months
in CHF m 3Q 2006 2Q 2006 3Q 2005 2006 2005
Total revenues 6,612 4,574 7,332 22,219 23,647
Total expenses (6,136) (4,232) (7,028) (20,924) (22,527)
Income before taxes from discontinued operations 476 342 304 1,295 1,120
Income tax expense 52 56 (78) 299 236
Income from discontinued operations, net of tax 424 286 382 996 884
The following table summarizes the assets, liabilities and accumulated other comprehensive income/(loss) of discontinuedoperations held-for-sale:in CHF m 30.09.06
Assets
Cash and due from banks 3,550
Trading assets 23,511
Investment securities 97,931
Real estate held for investment 8,185
Loans, net of allowance for loan losses 15,755
Assets held for separate accounts 6,769
Other assets 25,083
Assets of discontinued operations held-for-sale 180,784
Liabilities
Technical provisions from the insurance business 153,793
Liabilities held for separate accounts 6,769
Other liabilities 11,276
Liabilities of discontinued operations held-for-sale 171,838
Accumulated other comprehensive income/(loss), net of tax
Gains/(losses) on cash flow hedge (19)
Cumulative translation adjustment (602)
Unrealized gains/(losses) on securities 432
Minimum pension liability adjustment (90)
Accumulated other comprehensive income/(loss) related to discontinued operations held-for-sale (279)
The income from discontinued operations in the third quarter of 2006 included therelease of a provision of CHF 154 million related to the favorable resolution of a VATdispute in the UK.
Notes to the condensed consolidated financial statements – unaudited
Credit Suisse Group Quarterly Report 2006/Q3 43

Segment reporting
The results of operations of Winterthur, which were reported as a separate segment ofthe Group prior to the second quarter of 2006, are now reflected in Income from
discontinued operations, net of tax for all periods presented. For further detailsregarding the sale of Winterthur, see “Discontinued operations.”
Net revenues9 months
in CHF m 3Q 2006 2Q 2006 3Q 2005 2006 2005
Investment Banking 4,191 4,436 4,401 14,384 11,812
Private Banking 2,682 2,913 2,716 8,705 7,779
Asset Management 692 675 648 2,123 2,044
Corporate Center 1) 511 764 358 2,577 1,288
Credit Suisse Group 8,076 8,788 8,123 27,789 22,923
1) Includes minority interest revenues of CHF 640 million, CHF 741 million, CHF 523 million, CHF 2,665 million and CHF 1,520 million in 3Q 2006, 2Q 2006, 3Q 2005,nine months 2006 and nine months 2005, respectively, from the consolidation of certain private equity funds and other entities in which the Group does not have a significanteconomic interest in such revenues.
Income from continuing operations before taxes, minority interests, extraordinary items and cumulativeeffect of accounting changes
9 months
in CHF m 3Q 2006 2Q 2006 3Q 2005 2006 2005
Investment Banking 758 1,287 939 3,609 1,313
Private Banking 1,022 1,123 1,037 3,453 2,940
Asset Management 158 27 200 419 765
Corporate Center 1) 522 741 362 2,505 1,324
Credit Suisse Group 2,460 3,178 2,538 9,986 6,342
1) Includes minority interest income of CHF 630 million, CHF 728 million, CHF 518 million, CHF 2,633 million and CHF 1,503 million in 3Q 2006, 2Q 2006, 3Q 2005, ninemonths 2006 and nine months 2005, respectively, from the consolidation of certain private equity funds and other entities in which the Group does not have a significanteconomic interest in such income.
Total assetsin CHF m 30.09.06 31.12.05
Investment Banking 1,084,666 957,513
Private Banking 320,906 298,117
Asset Management 19,601 21,572
Corporate Center and other 1) 47,940 61,850
Credit Suisse Group 1,473,113 1,339,052
1) Includes CHF 180.8 billion and CHF 178.7 billion of assets as of September 30, 2006 and December 31, 2005, respectively, related to Winterthur, which was reported asa separate segment of the Group prior to the second quarter of 2006.
Notes to the condensed consolidated financial statements – unaudited
44 Credit Suisse Group Quarterly Report 2006/Q3

Interest and dividend income and interest expense
The following table sets forth the details of interest and dividend income and interest expense:9 months
in CHF m 3Q 2006 2Q 2006 3Q 2005 2006 2005
Interest income on loans 1,907 1,848 1,527 5,480 4,421
Interest income on investment securities 181 163 124 506 357
Interest and dividend income on trading assets 4,528 4,788 3,358 13,359 10,158
Central bank funds sold, securities purchased under resale agreementsand securities borrowing transactions 4,836 5,034 3,366 14,214 8,730
Other 1,373 1,277 854 3,693 2,059
Total interest and dividend income 12,825 13,110 9,229 37,252 25,725
Interest expense on deposits (3,256) (2,938) (2,003) (8,837) (5,106)
Interest expense on short-term borrowings (156) (162) (77) (437) (251)
Interest expense on trading liabilities (1,615) (2,077) (1,169) (5,108) (3,579)
Central bank funds purchased, securities sold under repurchaseagreements and securities lending transactions (4,550) (4,619) (3,072) (13,234) (7,864)
Interest expense on long-term debt (1,131) (1,074) (1,044) (3,303) (2,764)
Other (510) (374) (237) (1,194) (549)
Total interest expense (11,218) (11,244) (7,602) (32,113) (20,113)
Net interest income 1,607 1,866 1,627 5,139 5,612
Trading activities
The following table sets forth the details of trading-related revenues:9 months
in CHF m 3Q 2006 2Q 2006 3Q 2005 2006 2005
Interest rate products 485 1,072 458 2,640 1,220
Equity/index-related products 641 5 1,190 2,071 1,967
Foreign exchange products 566 205 367 1,473 1,251
Other 1 89 8 288 (90)
Trading revenues 1,693 1,371 2,023 6,472 4,348
Interest and dividend income on trading assets 4,528 4,788 3,358 13,359 10,158
Interest expense on trading liabilities (1,615) (2,077) (1,169) (5,108) (3,579)
Trading interest income, net 2,913 2,711 2,189 8,251 6,579
Total trading-related revenues 4,606 4,082 4,212 14,723 10,927
The following table sets forth the details of trading assets and liabilities:in CHF m 30.09.06 31.12.05
Trading assets
Debt securities 230,980 198,815
Equity securities 1) 152,710 156,559
Derivative instruments 58,418 55,192
Other 26,546 24,684
Total trading assets 468,654 435,250
Trading liabilities
Short positions 148,042 137,618
Derivative instruments 64,900 56,607
Total trading liabilities 212,942 194,225
1) Includes convertible bonds.
Notes to the condensed consolidated financial statements – unaudited
Credit Suisse Group Quarterly Report 2006/Q3 45

Commissions and fees
The following table sets forth the details of commissions and fees:9 months
in CHF m 3Q 2006 2Q 2006 3Q 2005 2006 2005
Commissions from lending business 352 452 326 1,133 878
Investment and portfolio management fees 1,279 1,314 1,164 3,854 3,367
Commissions for other securities business 57 37 42 154 155
Commissions and fees from fiduciary activities 1,336 1,351 1,206 4,008 3,522
Underwriting fees 538 721 674 1,860 1,741
Brokerage fees 1,118 1,276 919 3,826 2,630
Commissions, brokerage securities underwriting and other securities activities 1,656 1,997 1,593 5,686 4,371
Fees for other customer services 575 625 568 1,751 1,508
Commissions and fees 3,919 4,425 3,693 12,578 10,279
Loans
The following table sets forth details of the domestic (Switzerland) and foreign loan portfolio:in CHF m 30.09.06 31.12.05
Banks 0 1,801
Commercial 44,207 43,972
Consumer 81,587 81,388
Public authorities 1,273 3,481
Lease financings 3,136 2,979
Switzerland 130,203 133,621
Banks 7,888 8,555
Commercial 55,176 46,110
Consumer 12,972 18,398
Public authorities 968 1,026
Lease financings 298 138
Foreign 77,302 74,227
Loans, gross 207,505 207,848
Deferred expenses, net 21 64
Allowance for loan losses (1,527) (2,241)
Total loans, net 205,999 205,671
As of September 30, 2006, the Group held CHF 19.4 billion in restricted loans, whichrepresented collateral on secured borrowings. These loans are reported in Other assets
and the related obligations are recorded in Other liabilities.
Notes to the condensed consolidated financial statements – unaudited
46 Credit Suisse Group Quarterly Report 2006/Q3
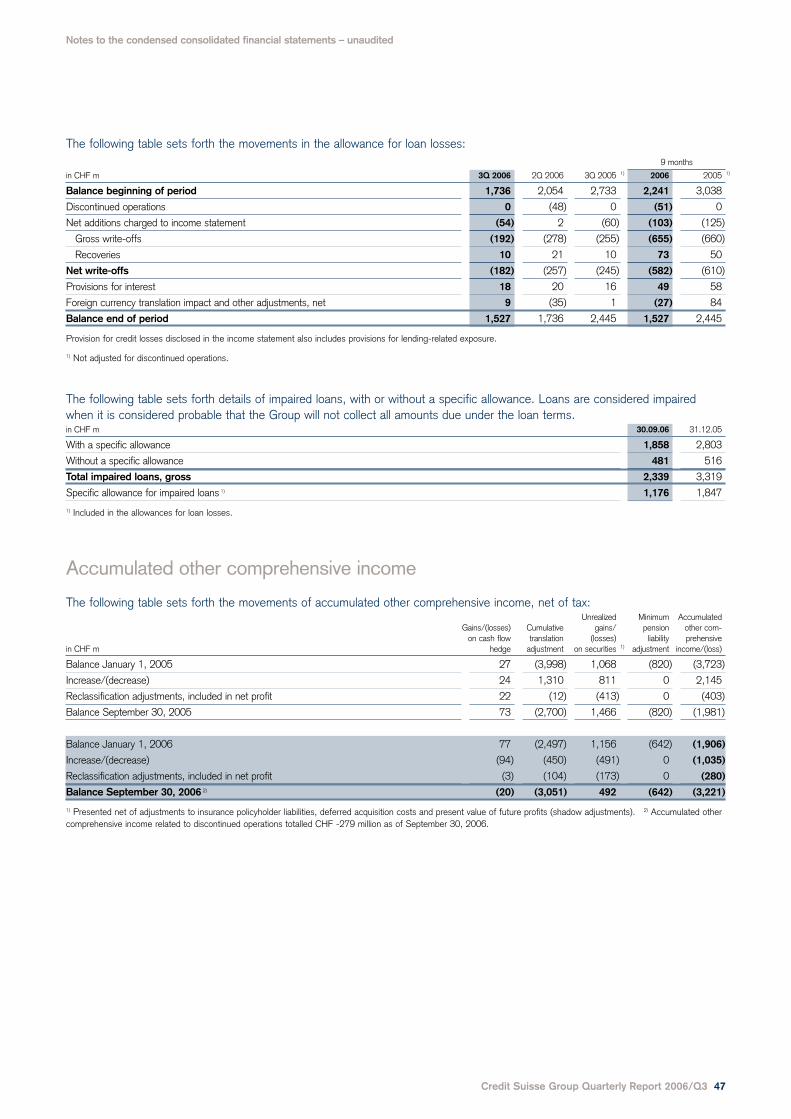
The following table sets forth the movements in the allowance for loan losses:9 months
in CHF m 3Q 2006 2Q 2006 3Q 2005 1) 2006 2005 1)
Balance beginning of period 1,736 2,054 2,733 2,241 3,038
Discontinued operations 0 (48) 0 (51) 0
Net additions charged to income statement (54) 2 (60) (103) (125)
Gross write-offs (192) (278) (255) (655) (660)
Recoveries 10 21 10 73 50
Net write-offs (182) (257) (245) (582) (610)
Provisions for interest 18 20 16 49 58
Foreign currency translation impact and other adjustments, net 9 (35) 1 (27) 84
Balance end of period 1,527 1,736 2,445 1,527 2,445
Provision for credit losses disclosed in the income statement also includes provisions for lending-related exposure.
1) Not adjusted for discontinued operations.
The following table sets forth details of impaired loans, with or without a specific allowance. Loans are considered impairedwhen it is considered probable that the Group will not collect all amounts due under the loan terms.in CHF m 30.09.06 31.12.05
With a specific allowance 1,858 2,803
Without a specific allowance 481 516
Total impaired loans, gross 2,339 3,319
Specific allowance for impaired loans 1) 1,176 1,847
1) Included in the allowances for loan losses.
Accumulated other comprehensive income
The following table sets forth the movements of accumulated other comprehensive income, net of tax:Unrealized Minimum Accumulated
Gains/(losses) Cumulative gains/ pension other com-on cash flow translation (losses) liability prehensive
in CHF m hedge adjustment on securities 1) adjustment income/(loss)
Balance January 1, 2005 27 (3,998) 1,068 (820) (3,723)
Increase/(decrease) 24 1,310 811 0 2,145
Reclassification adjustments, included in net profit 22 (12) (413) 0 (403)
Balance September 30, 2005 73 (2,700) 1,466 (820) (1,981)
Balance January 1, 2006 77 (2,497) 1,156 (642) (1,906)
Increase/(decrease) (94) (450) (491) 0 (1,035)
Reclassification adjustments, included in net profit (3) (104) (173) 0 (280)
Balance September 30, 2006 2) (20) (3,051) 492 (642) (3,221)
1) Presented net of adjustments to insurance policyholder liabilities, deferred acquisition costs and present value of future profits (shadow adjustments). 2) Accumulated othercomprehensive income related to discontinued operations totalled CHF -279 million as of September 30, 2006.
Notes to the condensed consolidated financial statements – unaudited
Credit Suisse Group Quarterly Report 2006/Q3 47

Earnings per share
The following table sets forth details of the calculation of earnings per share:9 months
in CHF m 3Q 2006 2Q 2006 3Q 2005 2006 2005
Income from continuing operations before cumulative effect of accounting changes 1,468 1,872 1,536 5,682 3,849
Income from discontinued operations, net of tax 424 286 382 996 884
Extraordinary items, net of tax 0 0 0 (24) 0
Cumulative effect of accounting changes, net of tax 0 0 0 0 14
Net income – as reported 1,892 2,158 1,918 6,654 4,747
Net income available for common shares for basic EPS 1) 1,892 2,158 1,850 6,654 4,670
Net income available for common shares for diluted EPS 2) 1,892 2,158 1,936 6,654 4,830
Weighted-average common shares outstanding for basic EPS, in m 1,084.4 1,113.0 1,107.0 1,108.4 1,121.6
Effect of dilutive securities
Convertible securities 0.0 0.0 40.4 0.0 40.4
Share options and warrants 12.1 14.1 10.5 14.6 9.2
Share awards 38.7 32.9 27.0 35.0 21.0
Adjusted weighted-average common shares for diluted EPS 3) 1,135.2 1,160.0 1,184.9 1,158.0 1,192.2
Basic earnings per share, in CHF
Income from continuing operations before cumulative effect of accounting changes 1.35 1.68 1.33 5.13 3.36
Income from discontinued operations, net of tax 0.39 0.26 0.34 0.89 0.79
Extraordinary items, net of tax 0.00 0.00 0.00 (0.02) 0.00
Cumulative effect of accounting changes, net of tax 0.00 0.00 0.00 0.00 0.01
Net income available for common shares 1.74 1.94 1.67 6.00 4.16
Diluted earnings per share, in CHF
Income from continuing operations before cumulative effect of accounting changes 1.29 1.61 1.31 4.91 3.30
Income from discontinued operations, net of tax 0.38 0.25 0.32 0.86 0.74
Extraordinary items, net of tax 0.00 0.00 0.00 (0.02) 0.00
Cumulative effect of accounting changes, net of tax 0.00 0.00 0.00 0.00 0.01
Net income available for common shares 1.67 1.86 1.63 5.75 4.05
1) The allocation of undistributed income related to the mandatory convertible securities is a reduction to the net income available to common shareholders for the purposes ofthe basic earnings per share calculation. 2) Under the if-converted method for calculating diluted earnings per share, the interest on the mandatory convertible securities isincluded when the effect is dilutive. 3) Weighted-average potential common shares relating to instruments that were not dilutive for the respective periods (and therefore notincluded in the EPS-calculation above), but could potentially dilute earnings per share in the future were 46.1 million, 38.1 million, 61.4 million, 38.9 million and 57.6 millionfor 3Q 2006, 2Q 2006, 3Q 2005, nine months 2006 and nine months 2005, respectively.
Notes to the condensed consolidated financial statements – unaudited
48 Credit Suisse Group Quarterly Report 2006/Q3

Pension
The following table sets forth details of the net periodic pension cost for the Swiss and international defined benefit pension andother post-retirement defined benefit plans:
9 months
in CHF m 3Q 2006 2Q 2006 3Q 2005 2006 2005
Service costs on benefit obligation 80 94 60 249 199
Interest costs on benefit obligation 124 123 133 370 391
Expected return on plan assets (172) (172) (170) (517) (509)
Amortization of
Unrecognized transition obligation/(asset) 0 0 (1) (1) (2)
Prior service cost 8 8 8 24 23
Unrecognized (gains)/losses 30 37 19 97 43
Net periodic pension costs 70 90 49 222 145
Settlement (gains)/losses 0 (5) 0 (5) 0
Curtailment (gains)/losses 0 (1) 0 (9) (1)
Total pension costs 70 84 49 208 144
Credit Suisse Group previously disclosed in its financial statements for the year endedDecember 31, 2005, that it expected to contribute CHF 348 million to the pensionplans in 2006. The calculation of the expected contributions for 2006 wassubsequently revised to reflect the current funding status, resulting in an increase ofanticipated contributions. As of September 30, 2006, CHF 310 million of contributionshave been made. The Group presently anticipates contributing an additional CHF 84million to fund its pension plans in 2006 for a total of CHF 394 million.
Notes to the condensed consolidated financial statements – unaudited
Credit Suisse Group Quarterly Report 2006/Q3 49

Guarantees and commitments
GuaranteesThe following tables set forth details of contingent liabilities associated with guarantees:
Total gross Total net Carrying CollateralAs of September 30, 2006, in CHF m amount amount 1) value received
Credit guarantees and similar instruments 10,960 8,509 9 5,708
Performance guarantees and similar instruments 10,921 9,773 185 3,234
Securities lending indemnifications 40,460 40,460 – 40,460
Derivatives 638,469 638,469 5,190 – 2)
Other guarantees 3) 3,720 3,720 24 1,558
Total guarantees 704,530 700,931 5,408 50,960
Total gross Total net Carrying CollateralAs of December 31, 2005, in CHF m amount amount 1) value received
Credit guarantees and similar instruments 9,976 7,616 11 3,484
Performance guarantees and similar instruments 8,275 7,425 233 3,737
Securities lending indemnifications 35,456 35,456 – 35,456
Derivatives 437,399 437,399 4,238 – 2)
Other guarantees 3) 3,552 3,552 25 1,691
Total guarantees 494,658 491,448 4,507 44,368
1) Total net amount equals gross amount less any participations. 2) Collateral for derivatives accounted for as guarantees is not considered significant. 3) Contingentconsiderations in business combinations, residual value guarantees and other indemnifications.
Guarantees provided by the Group are broadly classified as follows: Credit guarantees
and similar instruments, Performance guarantees and similar instruments, Securities
lending indemnifications, Derivatives and Other guarantees. Readers are referred tonote 34 “Guarantees and commitments” in the Credit Suisse Group Annual Report2005 for a detailed description of guarantees.
Deposit-taking banks in Switzerland and certain other European countries are requiredto ensure the payout of privileged deposits in case of specified restrictions orcompulsory liquidation of a deposit-taking bank. Upon occurrence of a payout event,the Group’s contribution will be calculated based on its share of privileged deposits inproportion to the total privileged deposits. These guarantees are reflected in Other
guarantees in the table above. The Group believes that the likelihood of having to payunder these agreements is remote.
Disposal-related contingencies and other indemnificationsThe Group has certain guarantees for which its maximum contingent liability cannot bequantified. These guarantees are not reflected in the table above and are discussedbelow.
Disposal-related contingenciesIn connection with the sale of assets or businesses, the Group sometimes provides theacquirer with certain indemnification provisions. These indemnification provisions vary bycounterparty in scope and duration and depend upon the type of assets or businessessold. These indemnification provisions generally shift the potential risk of certainunquantifiable and unknowable loss contingencies (e.g. relating to litigation, tax,intellectual property matters and adequacy of claims reserves) from the acquirer to theseller. The Group closely monitors all such contractual agreements to ensure thatindemnification provisions are adequately provided for in the Group’s consolidatedfinancial statements.
Notes to the condensed consolidated financial statements – unaudited
50 Credit Suisse Group Quarterly Report 2006/Q3

Other indemnificationsThe Group provides indemnifications to certain counterparties in connection with itsnormal operating activities, for which it is not possible to estimate the maximum amountit could be obligated to pay. As a normal part of issuing its own securities, the Grouptypically agrees to reimburse holders for additional tax withholding charges orassessments resulting from changes in applicable tax laws or the interpretation of thoselaws. Securities that include these agreements to pay additional amounts generally alsoinclude a related redemption or call provision if the obligation to pay the additionalamounts results from a change in law or its interpretation and the obligation cannot beavoided by the issuer taking reasonable steps to avoid the payment of additionalamounts. Since such potential obligations are dependent on future changes in tax laws,the related liabilities the Group may incur as a result of such changes cannot bereasonably estimated. In light of the related call provisions typically included, the Groupdoes not expect any potential liabilities in respect of tax gross-ups to be material.
The Group is a member of numerous securities exchanges and clearing houses andmay, as a result of its membership arrangements, be required to perform if anothermember defaults. The Group has determined that it is not possible to estimate themaximum amount of these obligations and believes that any potential requirement tomake payments under these arrangements is remote.
Other commitmentsThe following table sets forth details of other commitments:
Total gross Total net CollateralAs of September 30, 2006, in CHF m amount amount 1) received
Irrevocable commitments under documentary credits 5,162 4,831 2,394
Loan commitments 223,118 222,056 140,953
Forward reverse repurchase agreements 12,535 12,535 12,535
Other commitments 6,074 6,074 572
Total other commitments 246,889 245,496 156,454
Total gross Total net CollateralAs of December 31, 2005, in CHF m amount amount 1) received
Irrevocable commitments under documentary credits 5,345 5,042 2,761
Loan commitments 199,825 199,555 126,385
Forward reverse repurchase agreements 15,472 15,472 15,472
Other commitments 4,360 4,360 582
Total other commitments 225,002 224,429 145,200
1) Total net amount equals gross amount less any participations.
Other commitments of the Group are broadly classified as follows: Irrevocable
commitments under documentary credits, Loan commitments, Forward reverse
repurchase agreements and Other commitments. See note 34 “Guarantees andcommitments” of the Credit Suisse Group Annual Report 2005 for a detaileddescription of other off-balance sheet commitments.
Notes to the condensed consolidated financial statements – unaudited
Credit Suisse Group Quarterly Report 2006/Q3 51

Variable interest entities
FIN 46R “Consolidation of Variable Interest Entities – An Interpretation of ARB No. 51”,requires the Group to consolidate all variable interest entities (VIEs) for which it is theprimary beneficiary, defined as the entity that will absorb a majority of expected losses,receive a majority of the expected residual returns, or both. The Group consolidates allVIEs for which it is the primary beneficiary.
As a normal part of its business, the Group engages in transactions with entities thatare considered VIEs. These transactions include selling or purchasing assets, acting asa counterparty in derivatives transactions and providing liquidity, credit or other support.Transactions with VIEs are generally executed to facilitate securitization activities or tomeet specific client needs, such as providing liquidity or investment opportunities, andas part of these activities, the Group may retain interests in VIEs. In general, investorsin consolidated VIEs do not have recourse to the Group in the event of a default,except where a guarantee was provided to the investors or where the Group is thecounterparty to a derivative transaction involving VIEs.
The Group’s involvement with VIEs may be broadly grouped into three primarycategories: Collateralized debt obligations (CDOs), Commercial paper conduits andFinancial intermediation. Further details are available in notes 1, 2 and 36 of CreditSuisse Group’s Annual Report 2005 regarding the Group’s policy on consolidation ofVIEs and the nature of the Group’s involvement with these entities.
The following table sets forth the total assets by category related to non-consolidated VIEs:Carrying value ofVIEs’ total assets
in CHF m 30.09.06 31.12.05
Collateralized debt obligations 13,320 20,515
Commercial paper conduits 5,762 8,528
Financial intermediation 104,415 78,909
Total 123,497 107,952
The following table sets forth the total assets by category related to VIEs consolidated as a result of the Group being theprimary beneficiary:
VIEs’ total assets
in CHF m 30.09.06 31.12.05
Collateralized debt obligations 9,448 3,365
Commercial paper conduits 1 1
Financial intermediation 13,922 14,032
Total assets consolidated pursuant to FIN 46R 23,371 17,398
Collateralized debt obligationsAs part of its structured finance business, the Group purchases loans and other debtobligations from and on behalf of clients for the purpose of securitization.
The Group has consolidated all CDO VIEs for which it is the primary beneficiaryresulting in the inclusion by the Group of approximately CHF 9.4 billion and CHF 3.4billion of assets and liabilities of these VIEs as of September 30, 2006 and December31, 2005, respectively. The increase in the total assets consolidated primarily reflectedthe application of FSP FIN 46(R)-6. The beneficial interests issued by these VIEs arepayable solely from the cash flows of the related collateral, and the creditors of theseVIEs do not have recourse to the Group in the event of default.
The Group also retains certain debt and equity interests in open CDO VIEs that are notconsolidated because the Group is not the primary beneficiary. The Group’s exposure inthese CDO transactions typically consists of the interests retained in connection with itsunderwriting or market-making activities. The Group’s maximum loss exposure is equal
Notes to the condensed consolidated financial statements – unaudited
52 Credit Suisse Group Quarterly Report 2006/Q3

to the carrying value of these retained interests, which are reported as trading assetsand carried at fair value and totaled CHF 1.4 billion and CHF 1.0 billion as ofSeptember 30, 2006 and December 31, 2005, respectively.
Commercial paper conduitsThe Group continues to act as the administrator and provider of liquidity and creditenhancement facilities for several commercial paper conduit vehicles (CP conduits). TheGroup does not sell assets to the CP conduits and does not have any ownershipinterest in the CP conduits.
The Group’s commitments to CP conduits consist of obligations under liquidity andcredit enhancement agreements.
As of September 30, 2006 the Group’s maximum loss exposure to non-consolidatedCP conduits was CHF 14.4 billion, which consisted of CHF 5.8 billion of funded assetsand the CP conduits’ commitments to purchase CHF 8.6 billion of additional assets. Asof December 31, 2005, the Group’s maximum loss exposure was CHF 14.2 billion.
The Group believes that the likelihood of incurring a loss equal to this maximumexposure is remote because the assets held by the CP conduits, after giving effect torelated asset-specific credit enhancements primarily provided by the clients, must beclassified as investment grade when acquired by the CP conduits.
Financial intermediationThe Group has significant involvement with VIEs in its role as a financial intermediary onbehalf of clients. The investors typically retain the risk of loss on such transactions butthe Group may provide principal protection on the securities to limit the investors’exposure to downside risk.
As a financial intermediary, the Group may administer or sponsor the VIE, transferassets to the VIE, provide collateralized financing, act as a derivatives counterparty,advise on the transaction, act as investment advisor or investment manager, act asunderwriter or placement agent or provide credit enhancement, liquidity or other supportto the VIE. The Group also owns securities issued by the VIEs structured to provideclients with investment opportunities, for market-making purposes and as investments.The Group’s maximum loss exposure to VIEs related to financial intermediation activitieswas CHF 29.6 billion and CHF 12.8 billion as of September 30, 2006 and December31, 2005, respectively, which represents the notional amount of any guarantees andthe fair value of all other interests held. Further, the Group considers the likelihood ofincurring a loss equal to the maximum exposure to be remote because of the Group’srisk mitigation efforts, including hedging strategies and the risk of loss that is retainedby investors.
Notes to the condensed consolidated financial statements – unaudited
Credit Suisse Group Quarterly Report 2006/Q3 53

Litigation
The Group has provided reserves for litigation, claims and proceedings in accordancewith SFAS No. 5, “Accounting for Contingencies.” The Group recorded in the secondquarter of 2005 a CHF 960 million (USD 750 million) charge before tax, CHF 624million after tax, in Investment Banking, to increase the reserve for private litigationinvolving Enron, certain IPO allocation practices, research analyst independence andother related litigation. The charge was in addition to the reserve for these privatelitigation matters of CHF 702 million (USD 450 million) before tax originally establishedin 2002 and brings the total reserve for these private litigation matters as of September30, 2006, to CHF 1.3 billion (USD 1.0 billion) after deductions for settlements thathave since taken place.
The Group is involved in a number of other judicial, regulatory and arbitrationproceedings concerning the matters arising in connection with the conduct of itsbusinesses. These actions have been brought on behalf of various classes of claimantsand, unless specified, seek damages of material and/or indeterminate amounts. TheGroup believes, based on currently available information and advice of counsel, that theresults of such proceedings, in the aggregate, are not likely to have a material adverseeffect on its financial condition but might be material to operating results for anyparticular period, depending, in part, upon the operating results for such period.
It is inherently difficult to predict the outcome of many of these matters. In presentingthe condensed consolidated financial statements, management makes estimatesregarding the outcome of these matters and records a reserve and takes a charge toincome when losses with respect to such matters are probable and can be reasonablyestimated. Estimates, by their nature, are based on judgment and currently availableinformation and involve a variety of factors, including, but not limited to, the type andnature of the litigation, claim or proceeding, the progress of the matter, the advice oflegal counsel, the Group’s defenses and its experience in similar cases or proceedingsas well as its assessment of matters, including settlements, involving other defendantsin similar or related cases or proceedings.
Further charges or releases of litigation reserves may be necessary in the future asdevelopments in such litigation, claims or proceedings warrant.
Notes to the condensed consolidated financial statements – unaudited
54 Credit Suisse Group Quarterly Report 2006/Q3

Credit Suisse Group Quarterly Report 2006/Q3 55
Report of Independent Registered Public Accounting Firm to the Board of Directors of Credit Suisse Group, Zurich
We have reviewed the accompanying condensed consolidated balance sheet of CreditSuisse Group and subsidiaries (the “Group”) as of September 30, 2006, the relatedcondensed consolidated statements of income and comprehensive income for the threeand nine month periods ended September 30, 2006 and 2005, and the relatedcondensed consolidated statements of changes in shareholders’ equity and statementsof cash flows for the nine-month periods ended September 30, 2006 and 2005.These condensed consolidated financial statements are the responsibility of the Group’smanagement.
We conducted our review in accordance with the standards of the Public CompanyAccounting Oversight Board (United States). A review of interim financial informationconsists principally of applying analytical procedures and making inquiries of personsresponsible for financial and accounting matters. It is substantially less in scope than anaudit conducted in accordance with the standards of the Public Company AccountingOversight Board (United States), the objective of which is the expression of an opinionregarding the financial statements taken as a whole. Accordingly, we do not expresssuch an opinion.
Based on our review, we are not aware of any material modifications that should bemade to the condensed consolidated financial statements referred to above for them tobe in conformity with U.S. generally accepted accounting principles.
We have previously audited, in accordance with standards of the Public CompanyAccounting Oversight Board (United States), the consolidated balance sheet of theGroup as of December 31, 2005, and the related consolidated statements of income,shareholders’ equity and comprehensive income, and cash flows for the year thenended (not presented herein) prior to the restatement for the discontinued operations ofWinterthur Swiss Insurance Company as described in the “Notes to the condensedconsolidated financial statements – unaudited,” and in our report dated March 23,2006, we expressed an unqualified opinion on those consolidated financial statements.In our opinion, the information set forth in the accompanying condensed consolidatedbalance sheet as of December 31, 2005, is fairly stated, in all material respects, inrelation to the consolidated balance sheet from which it has been derived.
KPMG Klynveld Peat Marwick Goerdeler SA
David L. Jahnke Philipp Rickert Certified Public Accountant Swiss Certified AccountantAuditor in charge
Zurich, SwitzerlandOctober 31, 2006

56 Credit Suisse Group Quarterly Report 2006/Q3
Information for investors
Ticker symbols / Stock exchange listingsBloomberg Reuters Telekurs
SWX Swiss Exchange/virt-x CSGN VX CSGN.VX CSGN,380
New York Stock Exchange (ADS) 1) CS US CS.N CS,065
CSG share ADS
Swiss security number 1213853 570660
ISIN number CH0012138530 US2254011081
CUSIP number 225 401 108
1) One ADS represents one registered share.
Credit Suisse Group’s ordinary shares are registered shares with a par value ofCHF 0.50 per share and are listed on the Swiss Exchange/virt-x. In addition, CreditSuisse Group has a sponsored level II American Depositary Shares (ADS) programlisted on the New York Stock Exchange for which Deutsche Bank Trust CompanyAmericas acts as depositary. Each ADS represents one registered share of the Group.
Further information about historic share prices and other share-related statistics can befound within the Credit Suisse Group financial highlights section of this document andat www.credit-suisse.com/investors.
RatingsStandard
Moody’s & Poor’s Fitch Ratings
Credit Suisse Group Short term – A-1 F1+
Long term Aa3 A+ AA-
Outlook Stable Stable Stable
Credit Suisse Short term P-1 A-1+ F1+
Long term Aa3 AA- AA-
Outlook Stable Stable Stable
Foreign currency translation ratesThe following table sets forth principal Swiss franc foreign exchange rates:
Average rate Closing rate
in CHF 3Q 2006 2Q 2006 3Q 2005 30.09.06 30.06.06 31.12.05
1 USD 1.24 1.25 1.28 1.2540 1.2250 1.3137
1 EUR 1.58 1.57 1.55 1.5884 1.5664 1.5572
1 GBP 2.31 2.27 2.28 2.3423 2.2657 2.2692
100 JPY 1.07 1.09 1.14 1.0620 1.0716 1.1190
98 99 00 01 02 03 04 05 Q3/06
10
20
30
40
50
60
70
80
90
100
Market capitalization
As of end of reporting period (in CHF bn)
Share performance
Swiss Market Index (rebased) Credit Suisse Group
2003 2004 2005 2006
75
65
55
45
35
25
15
Cautionary statement regarding forward-looking informationThis Quarterly Report contains statements that constitute forward-looking statements. In addition, in the future we, andothers on our behalf, may make statements that constitute forward-looking statements. Such forward-lookingstatements may include, without limitation, statements relating to our plans, objectives or goals; our future economicperformance or prospects; the potential effect on our future performance of certain contingencies; and assumptionsunderlying any such statements.
Words such as “believes,” “anticipates,” “expects,” “intends” and “plans” and similar expressions are intended to identifyforward-looking statements but are not the exclusive means of identifying such statements. We do not intend to updatethese forward-looking statements except as may be required by applicable laws.
By their very nature, forward-looking statements involve inherent risks and uncertainties, both general and specific, andrisks exist that predictions, forecasts, projections and other outcomes described or implied in forward-lookingstatements will not be achieved. We caution you that a number of important factors could cause results to differmaterially from the plans, objectives, expectations, estimates and intentions expressed in such forward-lookingstatements. These factors include (i) market and interest rate fluctuations; (ii) the strength of the global economy ingeneral and the strength of the economies of the countries in which we conduct our operations in particular; (iii) theability of counterparties to meet their obligations to us; (iv) the effects of, and changes in, fiscal, monetary, trade andtax policies, and currency fluctuations; (v) political and social developments, including war, civil unrest or terrorist activity;(vi) the possibility of foreign exchange controls, expropriation, nationalization or confiscation of assets in countries inwhich we conduct our operations; (vii) the ability to maintain sufficient liquidity and access capital markets; (viii)operational factors such as systems failure, human error, or the failure to implement procedures properly; (ix) actionstaken by regulators with respect to our business and practices in one or more of the countries in which we conduct ouroperations; (x) the effects of changes in laws, regulations or accounting policies or practices; (xi) competition ingeographic and business areas in which we conduct our operations; (xii) the ability to retain and recruit qualifiedpersonnel; (xiii) the ability to maintain our reputation and promote our brand; (xiv) the ability to increase market shareand control expenses; (xv) technological changes; (xvi) the timely development and acceptance of our new productsand services and the perceived overall value of these products and services by users; (xvii) acquisitions, including theability to integrate acquired businesses successfully, and divestitures, including the ability to sell non-core assets; (xviii)the adverse resolution of litigation and other contingencies; and (xix) our success at managing the risks involved in theforegoing.
We caution you that the foregoing list of important factors is not exclusive; when evaluating forward-lookingstatements, you should carefully consider the foregoing factors and other uncertainties and events, as well as the risksidentified in our most recently filed Form 20-F and reports on Form 6-K furnished to the US Securities and ExchangeCommission.

CREDIT SUISSE GROUPParadeplatz 88070 ZurichSwitzerlandTel. +41 44 212 16 16Fax +41 44 333 25 87
www.credit-suisse.com 5520
144
Eng
lish