Embed Size (px)
Citation preview
Alpha From Alternative Data
29th September 2017
Presenter: Emmett Kilduff (Founder & CEO)
Mobile: +353 (0)86 7772198
Email: [email protected]

Table Of Contents
1
1: Adoption2: The Global Landscape
3: The Asian Landscape
4: Case Studies 5: Eagle Alpha
1

1: Adoption

A1, 6%
A2, 70%
A3, 23%
Alternative Data Will Fundamentally Change The Investment Landscape
2
Q: At JPMorgan’s annual quant conference last May, 237 asset managers were asked: what is your opinion of Big Data / Machine Learning?
A1: 6% said “fad – investor interest will decline”.
A2: 70% said “evolution – it’s importance will gradually grow for all investors”.
A3: 23% said “revolution – will lead to rapid changes to investment landscape”.
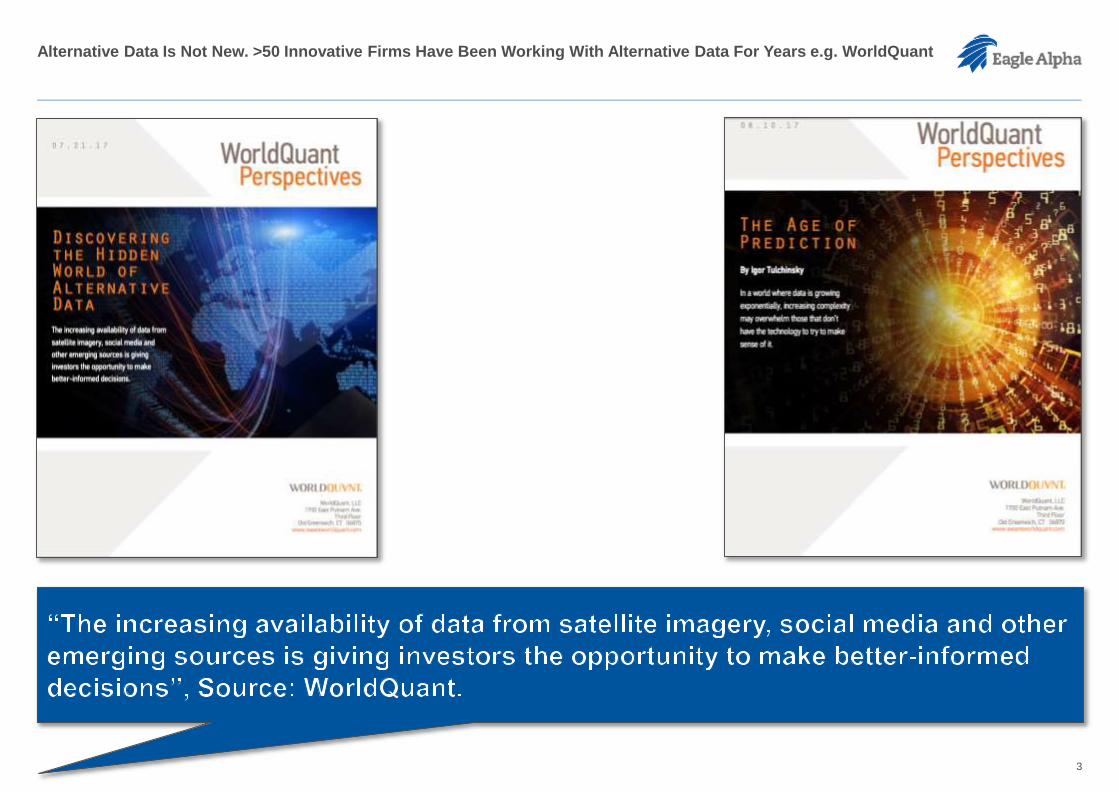
Alternative Data Is Not New. >50 Innovative Firms Have Been Working With Alternative Data For Years e.g. WorldQuant
3

GSAM Is An Innovator
4

Blackrock Is An Innovator
5
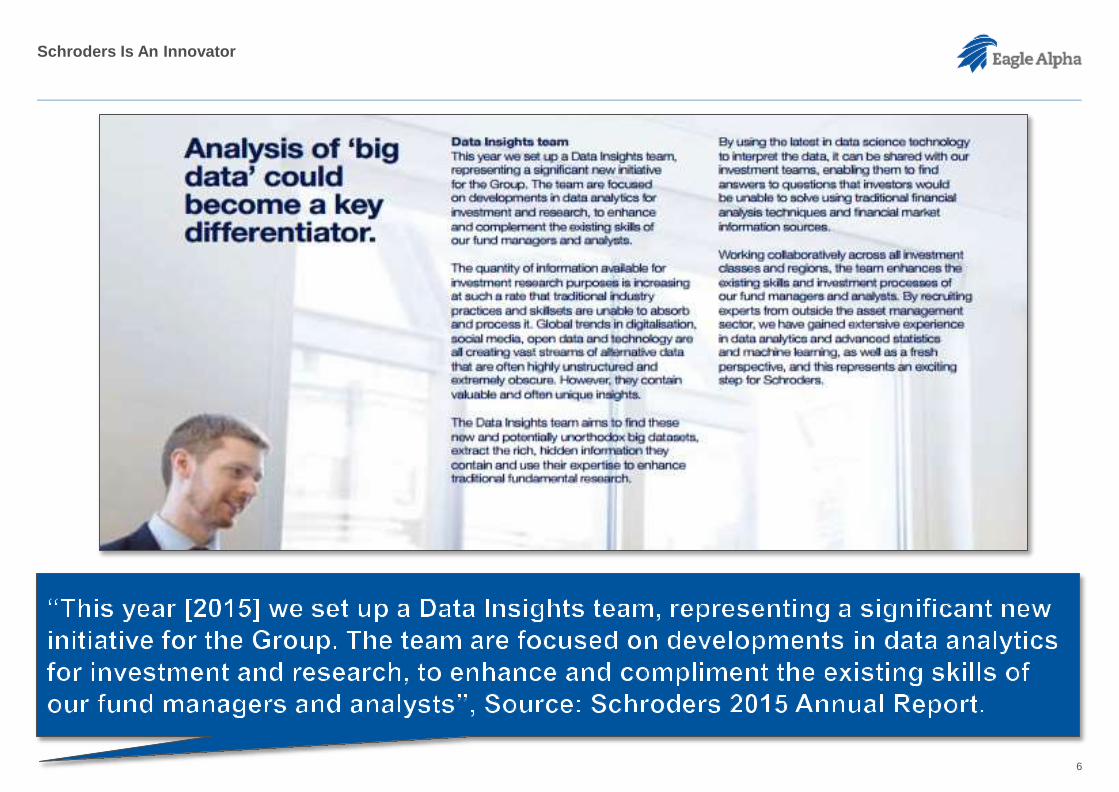
Schroders Is An Innovator
6

Balyasny & Citadel Are Innovators
7
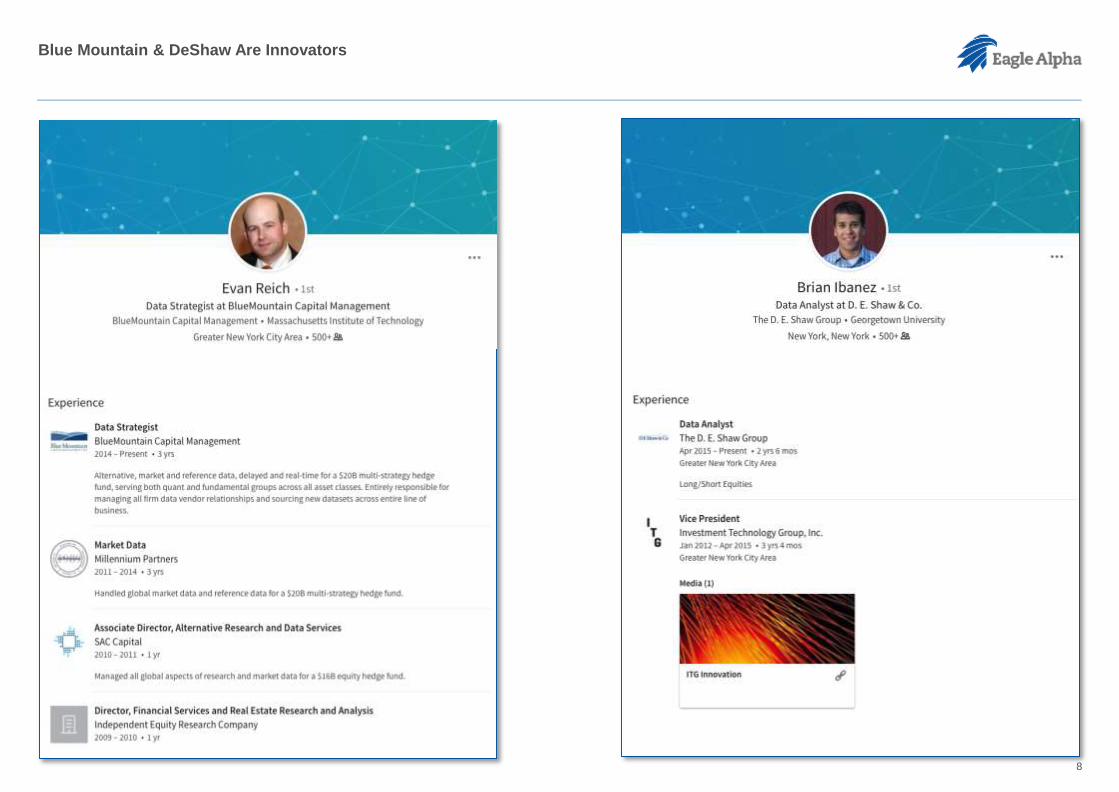
Blue Mountain & DeShaw Are Innovators
8

Alternative Data Adoption Will ‘Cross The Chasm’ By The End Of 2018
Quantitative fundsCutting-
edge
firms
Large
number of
quant
funds
Bulk of firms Small minority
Hedge funds Select few
Quant-a-
mental
firms
Bulk of firms Minority
Mutual funds <5 firms
Quant-a-
mental
firms
The more dynamic
mutual funds
Bulk of firms
(conservatives)
The rest
(skeptics)
Source: Geoffrey Moore’s book ‘Crossing the Chasm’, Eagle Alpha
50+ firms have been working
with alternative data for years.
Among discretionary managers
today, 24% are using ‘big data’
today. Source: Barclays.
Today 20% of HFs >$1bn AUM
have headcount or 50% of a
persons time. Source: Jefferies
Eagle Alpha currently has a
dialogue with 226 firms. This is
increasing rapidly.
70% of firms say importance of
big data will gradually grow for
all firms. Source: JPMorgan.
80% of firms want greater
access to alternative data.
Source: Greenwich survey.
9

A Key Driver Of Adoption Is Firms Adopting A ‘Quantamental’ Approach
Consumer
Insights
Source: Morgan Stanley 10

A Key Driver Of Adoption Is To Increase Profit Margins
Consumer
Insights
Source: Quinlan Associates 11

Benefits Of Using Alternative Data
Consumer
Insights
Source: Quinlan Associates 12

90% Of Alt Data Users Have Seen The Return They Hoped For, 95% Said It Helps Explain Their Strategy To Clients
13
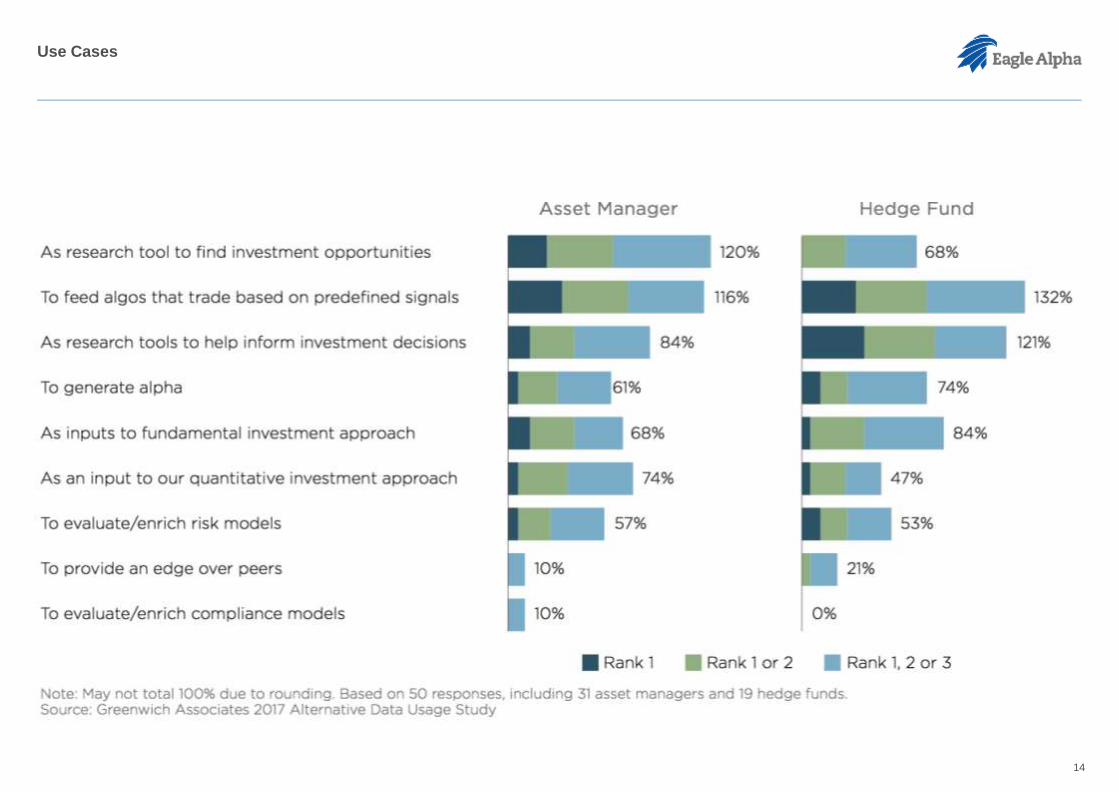
Use Cases
14

2: The Global Landscape
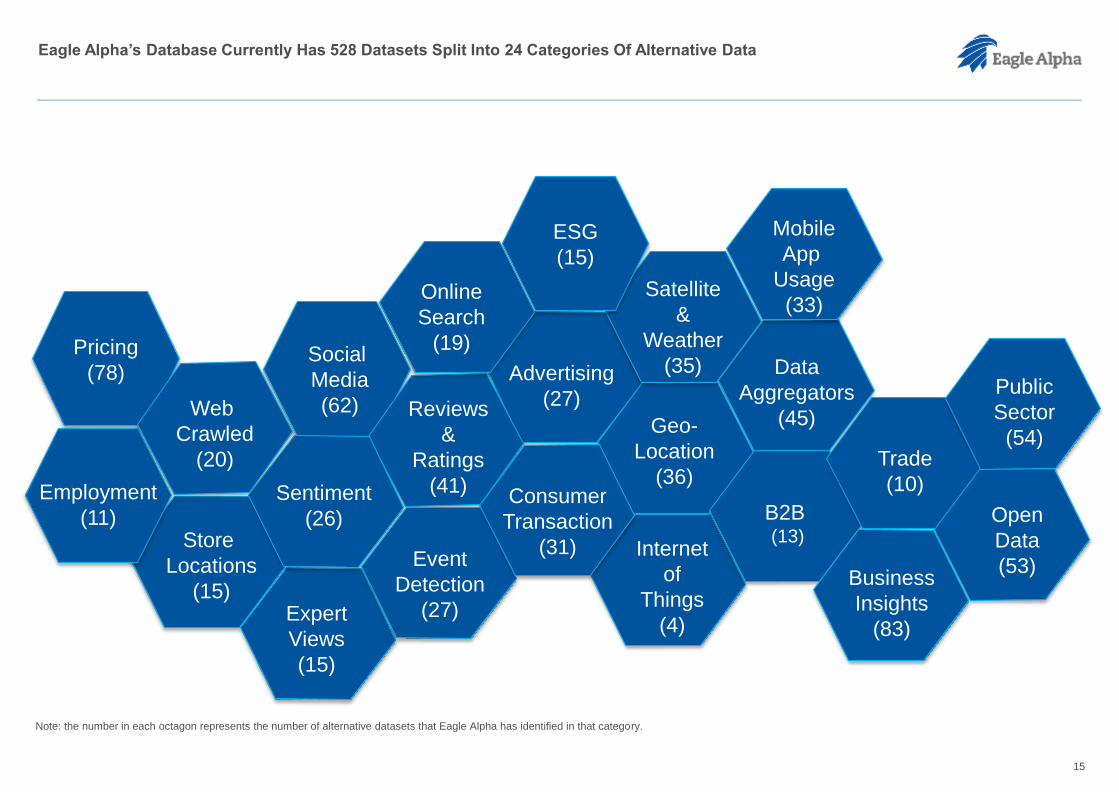
Eagle Alpha’s Database Currently Has 528 Datasets Split Into 24 Categories Of Alternative Data
Pricing
(78)
Employment
(11)
Web
Crawled
(20)
Mobile
App
Usage
(33)
Reviews
&
Ratings
(41)
Social
Media
(62)
Sentiment
(26)
Online
Search
(19)
Expert
Views
(15)
Store
Locations
(15)
Advertising
(27)
Event
Detection
(27)
Trade
(10)
Data
Aggregators
(45)
Consumer
Credit
(15)
Open
Data
(53)
Public
Sector
(54)
B2B(13)
Geo-
Location
(36)
Satellite
&
Weather
(35)
Internet
of
Things
(4)
Consumer
Transaction
(31)
Business
Insights
(83)
Consumer
Insights
ESG
(15)
Note: the number in each octagon represents the number of alternative datasets that Eagle Alpha has identified in that category.
15

Where Does Consumer Transaction Data Come From?
Online Transactions
Point of SaleTransactions
16
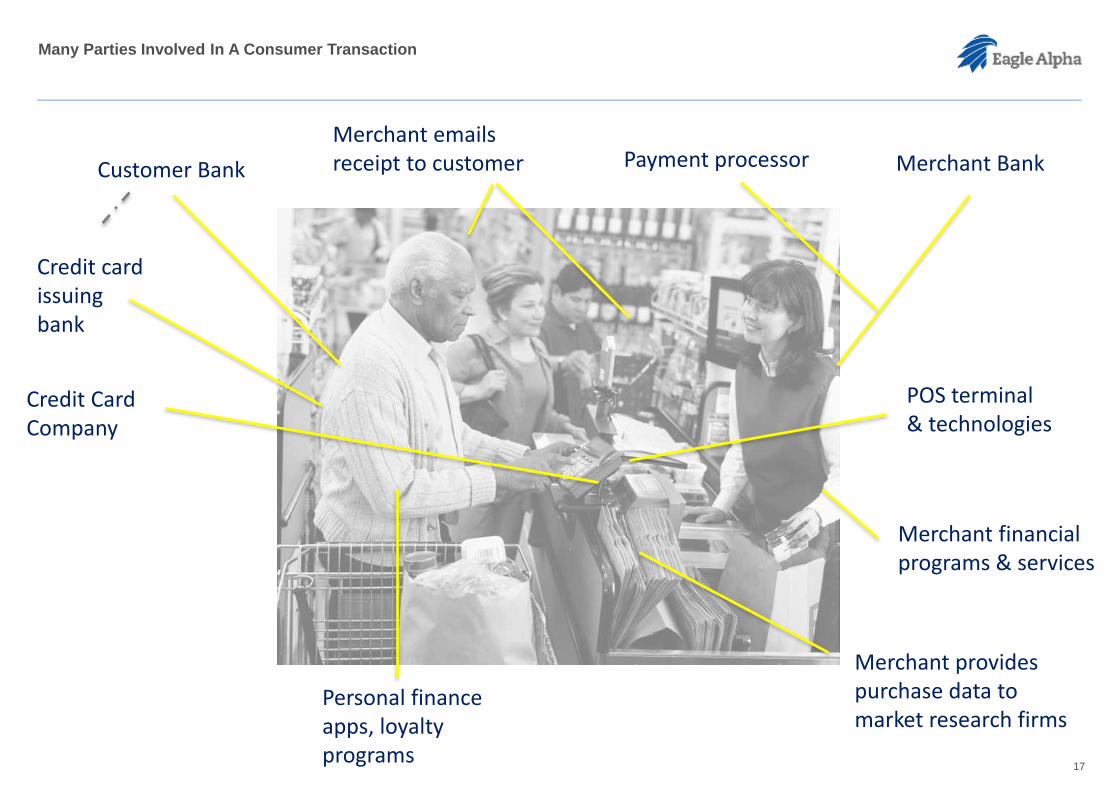
Credit Card Company
Personal financeapps, loyalty programs
Customer Bank Merchant Bank
POS terminal& technologies
Merchant provides purchase data to market research firms
Merchant financial programs & services
Payment processorMerchant emails receipt to customer
Credit card issuing bank
Many Parties Involved In A Consumer Transaction
17

Consumer Transaction Data Sources (U.S.)
Apps
Eagle Alpha Data Partner(China)
Eagle Alpha Data Partner
Eagle Alpha Data Partner
18
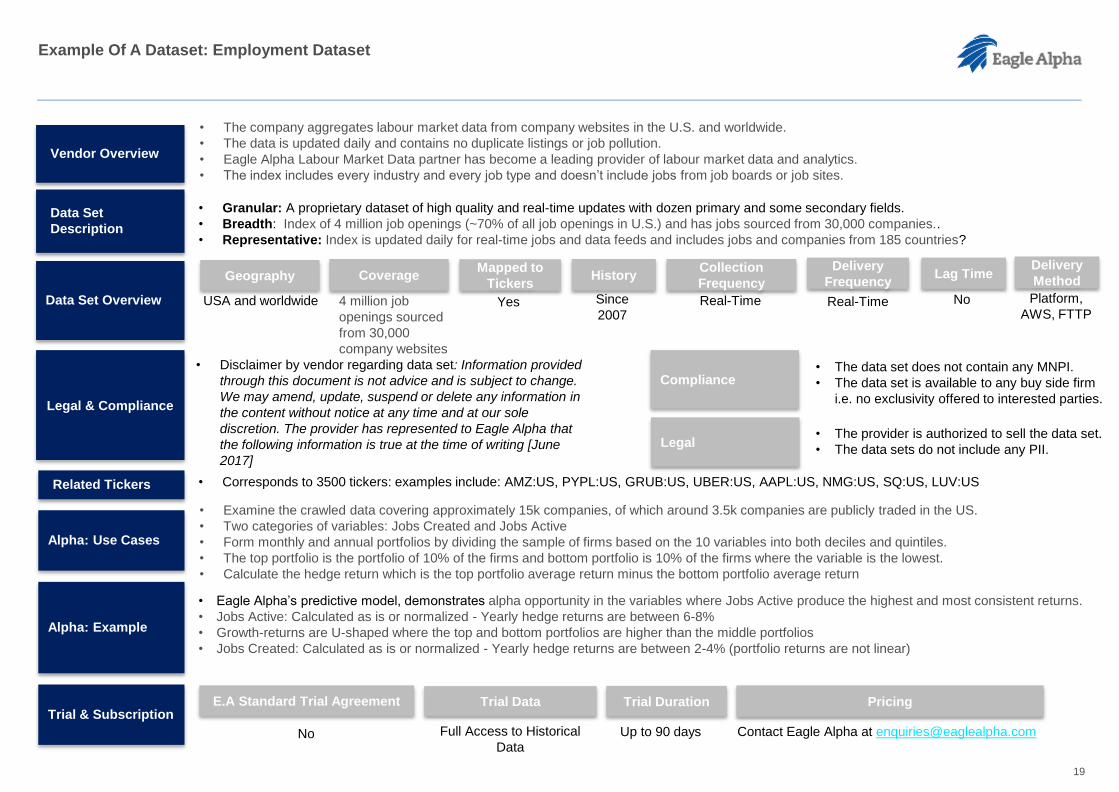
Example Of A Dataset: Employment Dataset
19
Vendor Overview
• The company aggregates labour market data from company websites in the U.S. and worldwide.
• The data is updated daily and contains no duplicate listings or job pollution.
• Eagle Alpha Labour Market Data partner has become a leading provider of labour market data and analytics.
• The index includes every industry and every job type and doesn’t include jobs from job boards or job sites.
Data Set
Description
• Disclaimer by vendor regarding data set: Information provided
through this document is not advice and is subject to change.
We may amend, update, suspend or delete any information in
the content without notice at any time and at our sole
discretion. The provider has represented to Eagle Alpha that
the following information is true at the time of writing [June
2017]
Data Set Overview
Geography
USA and worldwide
Coverage
4 million job
openings sourced
from 30,000
company websites
Mapped to
Tickers
Yes
History
Since
2007
Collection
Frequency
Real-Time
Delivery
Frequency
Real-Time
Lag TimeDelivery
Method
Platform,
AWS, FTTP
Legal & Compliance
• Granular: A proprietary dataset of high quality and real-time updates with dozen primary and some secondary fields.
• Breadth: Index of 4 million job openings (~70% of all job openings in U.S.) and has jobs sourced from 30,000 companies..
• Representative: Index is updated daily for real-time jobs and data feeds and includes jobs and companies from 185 countries?
Legal• The provider is authorized to sell the data set.
• The data sets do not include any PII.
Compliance• The data set does not contain any MNPI.
• The data set is available to any buy side firm
i.e. no exclusivity offered to interested parties.
Related Tickers
Alpha: Use Cases
Trial & SubscriptionE.A Standard Trial Agreement
No
Trial Data
Full Access to Historical
Data
Trial Duration
Up to 90 days
• Examine the crawled data covering approximately 15k companies, of which around 3.5k companies are publicly traded in the US.
• Two categories of variables: Jobs Created and Jobs Active
• Form monthly and annual portfolios by dividing the sample of firms based on the 10 variables into both deciles and quintiles.
• The top portfolio is the portfolio of 10% of the firms and bottom portfolio is 10% of the firms where the variable is the lowest.
• Calculate the hedge return which is the top portfolio average return minus the bottom portfolio average return
No
• Corresponds to 3500 tickers: examples include: AMZ:US, PYPL:US, GRUB:US, UBER:US, AAPL:US, NMG:US, SQ:US, LUV:US
Pricing
Contact Eagle Alpha at [email protected]
Alpha: Example
• Eagle Alpha’s predictive model, demonstrates alpha opportunity in the variables where Jobs Active produce the highest and most consistent returns.
• Jobs Active: Calculated as is or normalized - Yearly hedge returns are between 6-8%
• Growth-returns are U-shaped where the top and bottom portfolios are higher than the middle portfolios
• Jobs Created: Calculated as is or normalized - Yearly hedge returns are between 2-4% (portfolio returns are not linear)
Eagle Alpha Recently Published An 82 Page Report That Outlines The Applications Of Alternative Data
20
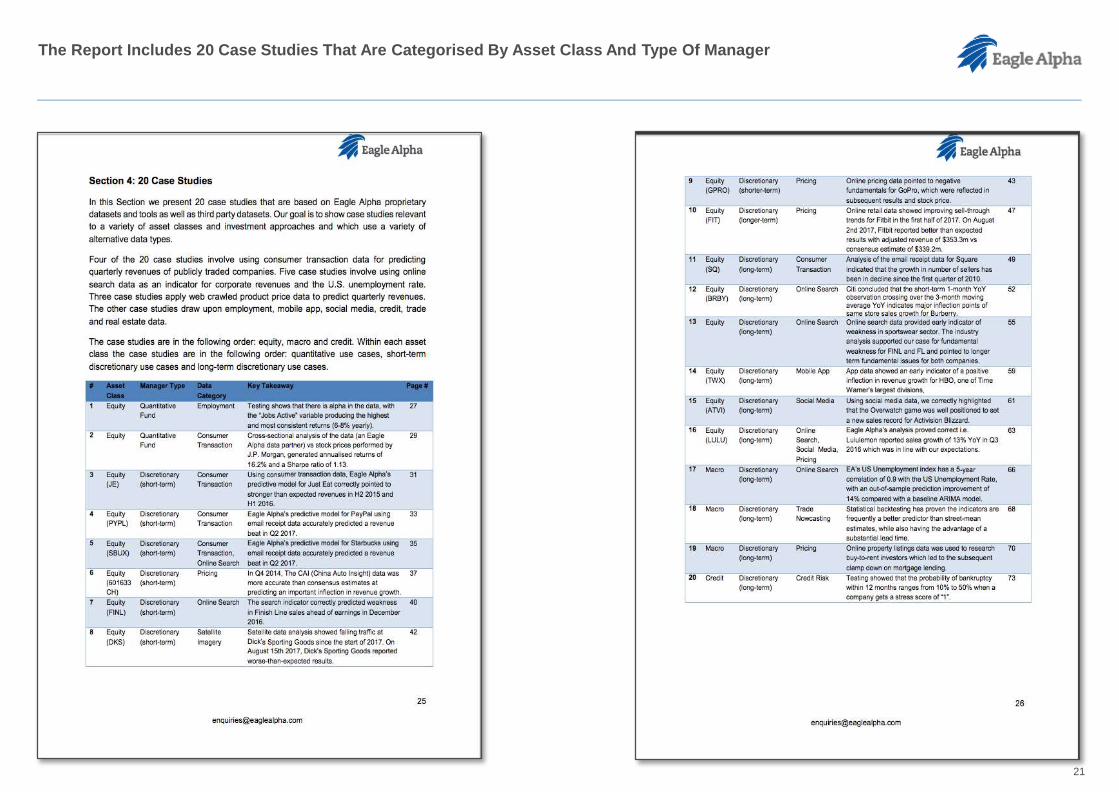
The Report Includes 20 Case Studies That Are Categorised By Asset Class And Type Of Manager
21

3: The Asian Landscape

The Alt Data Landscape In China Based On Our Current Database – We Have Just Hired A Person To Focus On China
22
Advertising 6
App Usage & Web Traffic 9
Business Insights 2
Consumer Credit 6
Consumer Transactions 6
Data Aggregators 15
Employment 1
ESG 1
Event Detection 1
Geo-Location 6
Open Data 6
Pricing 3
Public Sector 5
Reviews & Rating 1
Satellite & Weather 1
Sentiment 6
Store Location 1
Web Crawled Data 2

Several Datasets Provide Granularity That Traditional Datasets Do Not Offer e.g. China Autos Dataset
23
Vendor Overview
• The provider is the leading provider of “data-supported business decisions” for the automotive industry in China.
• With the largest market share in the autos segment in China, their key data products take 60% market share, which reaches 80% market share
in JV automakers.
• They have assembled a unique panel consisting of over 1,300 contributing co-operating Chinese dealerships.
• Eagle Alpha have an exclusive partnership with this provider to distribute these powerful data sets to the finance vertical.
Data Set
Description
• Disclaimer by vendor regarding data set: Information provided
through this document is not advice and is subject to change.
We may amend, update, suspend or delete any information in
the content without notice at any time and at our sole
discretion. The provider has represented to Eagle Alpha that
the following information is true at the time of writing [17 Jan
2017]
Data Set Overview
Geography
China
Coverage
National, with
regional breakdowns
Mapped to
Tickers
No
History
Since
2012
Collection
Frequency
Mixed – Month/ Bi-
Monthly
Delivery
Frequency
Mixed –
Month/ Bi-
Monthly
Lag Time
Between 5
& 20 days
Delivery
Method
API, CSV
Legal & Compliance
• Transaction Price: Average transaction price of automobiles at a model, sub-model & version level (dealership sourced). National/ city level
breakdown.
• Rebate: Manufacturer promotion data, includes a breakdown of all promotional activity by OEM’s (dealership sourced).
• Showroom Indicators: (1) Inventory Indicator, (2) Order Indicator, (3) Customer Intention Indicator.
• Volume: CPCA volume data, adjusted using dealership data to provide sales volume mix at a version level. (Imported Models NOT Included).
Legal • They are authorized to sell the data set.
• The data set do not include any PII.
Compliance• The data set does not contain any MNPI.
• The data set is available to any buy side firm
i.e. no exclusivity offered to interested parties.
Related Tickers • Examples include: F:US, GM:US, TM:US, NSANY:US, DAI:GR, VOW:GR, BMW:GR, 2333:HK.
Alpha: Use Cases
• Predict revenue for domestic Chinese manufacturers and revenues generated by foreign manufacturers in mainland China.
• Track discounting and promotional activity of OEM’s on a monthly basis.
• Track inventory levels and average transaction price by brand (sourced from dealership panel).
Alpha: Example
• Eagle Alpha’s first-order autoregressive model for predicting Great Wall Motors revenue, incorporating provider transaction price and volume
data, demonstrates a reduction of mean absolute percentage error of 5.37ppts from (10.28% to just 4.91%), over a baseline model. Directional
accuracy is also markedly improved, increasing from 57.14% to 85.71%.
Trial & SubscriptionE.A Standard Trial Agreement
Yes
Trial Data
Restricted API Access
Trial Duration
Up to 6 weeks
Pricing: Full API Access
$120,000 p.a. per team

This Is An Example Of A Consumer Transaction Dataset
24
Vendor Overview
• This provider is the professional services division one of the world’s largest payment networks by number of cards issued.
• Operating in the Chinese market, they provides end-to-end services of big data analytics and strategy consulting services.
• Their products and services leverage the intelligence derived from the analysis of over 20 billion transactions per year.
Data Set
Description
• Disclaimer by vendor regarding data set: Information provided
through this document is not advice and is subject to change.
We may amend, update, suspend or delete any information in
the content without notice at any time and at our sole
discretion. The provider has represented to Eagle Alpha that
the following information is true at the time of writing [1 Jan
2017]
Data Set Overview
Geography
China
Coverage
800 million card
holders
Mapped to
Tickers
Not yet
History
Since 2011
Collection
Frequency
Monthly, Weekly
Delivery
Frequency
Monthly, Weekly
Lag Time
Monthly: 8 Days
Weekly: 4 Days
Delivery
Method
CSV
Legal & Compliance
• National Monthly/ Weekly Indices: Real Estate, Restaurant & Catering, Luxury Hotel, Economic Hotel, Luxury Automobile, Economic Automobile,
Department Store, Jewellery, Apparel, Luxury, Gas Station, Entertainment, Movie Theatre, Home Appliance, Overseas Spending, E-Commerce.
• Overseas Spending: Monthly/ Weekly Indices in Retail, Restaurant & Catering, Hotel, Duty Free Shops, ATM and more, down to Sector-level.
• Ticker Level Indices (Not yet available): Eagle Alpha have begun testing and development of a suite of ticker level indices with this provider.
Legal
• Eagle Alpha are authorized to sell the data
set.
• The data sets do not include any PII.
Compliance• The data set is available to any buy side firm
i.e. no exclusivity offered to interested parties.
Related Tickers • Examples include: EPA:RMS, EPA:MC, LON:BRBY, EPA:KER, BIT:BMW, ETR:VOW3, ETR:NSU, ETR:DAI
Alpha: Use Cases
• Monthly/Weekly Indices: Closely tracks official data published by the Chinese NBS for floor space of residential buildings sold.
• Overseas Spending: Track spending by China bank card holders abroad at a sector and sub-sector level e.g. luxury retail in Japan or spend in
Macau Casinos.
• Business Intelligence: Predict revenue of companies based on consumer spending in the Chinese market.
Trial & Subscription
E.A Standard Trial
Agreement
No
Trial Data
Historical
Indices
Trial Duration
Up to 6 weeks
National Monthly
Indices: Per Index
$10,000 p.a. per
team
Overseas Spending:
Per Index
$25,000 p.a. per
team
Alpha: Example
• Correlation between the provider’s data for a U.S. tech hardware company’s transactions in China and its sales was +96% from 2014 through
2016, with R-squared of 92%. Eagle Alpha’s autoregressive model built using the vendor’s data demonstrated an MAPE of 13%, and the model
captured major inflection points in revenues over time.
Ticker Level
Indices
Not yet
National Weekly
Indices: Per Index
$15,000 p.a. per
team
Delhi
Mumbai
Bangalore
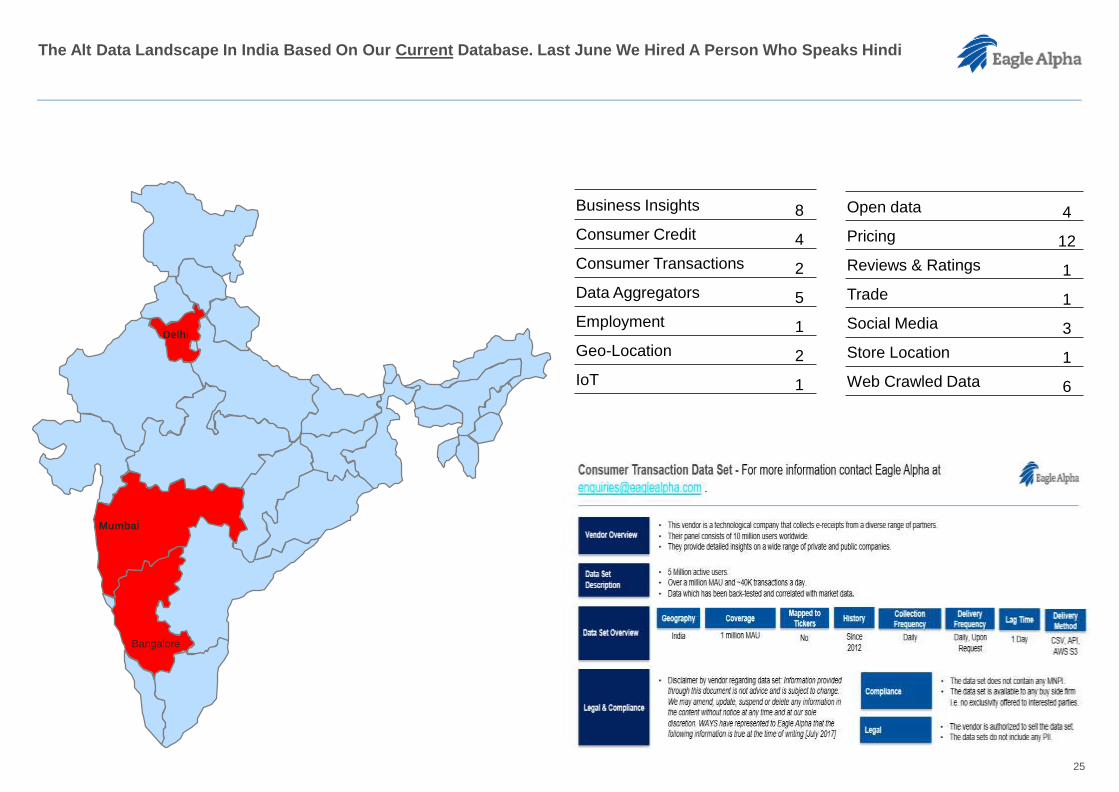
Business Insights 8
Consumer Credit 4
Consumer Transactions 2
Data Aggregators 5
Employment 1
Geo-Location 2
IoT 1
Open data 4
Pricing 12
Reviews & Ratings 1
Trade 1
Social Media 3
Store Location 1
Web Crawled Data 6
The Alt Data Landscape In India Based On Our Current Database. Last June We Hired A Person Who Speaks Hindi
25

4: Case Studies
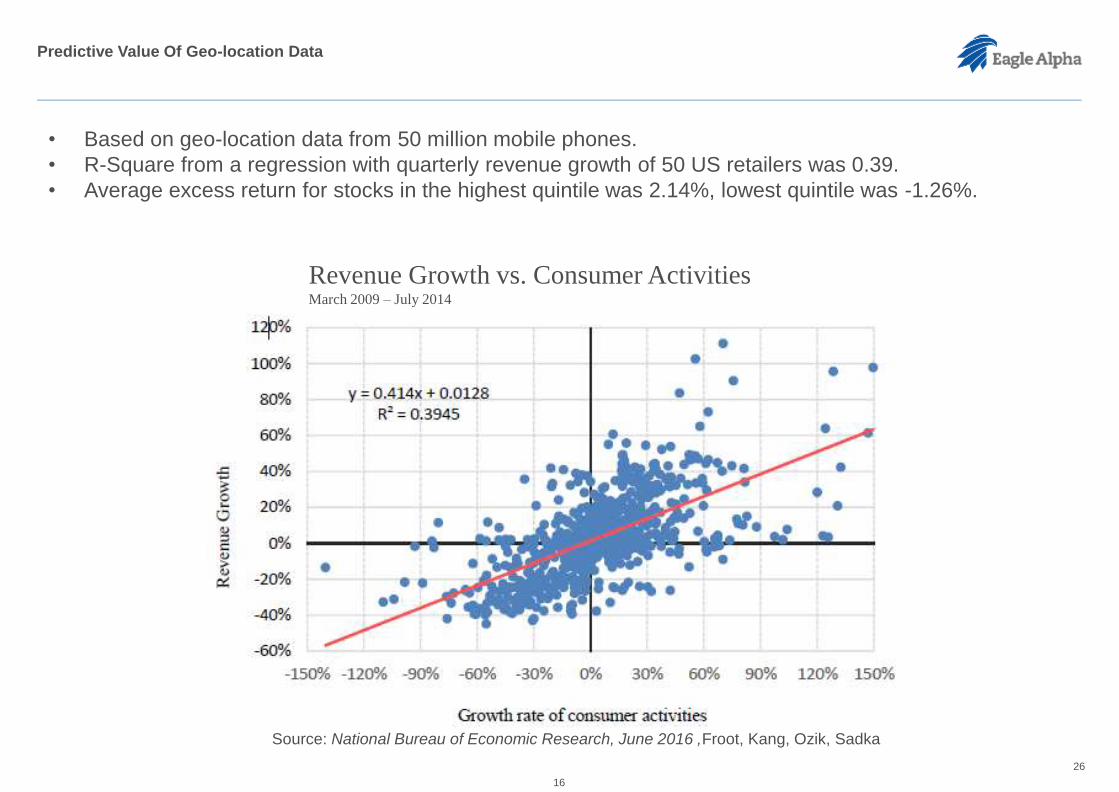
• Based on geo-location data from 50 million mobile phones.
• R-Square from a regression with quarterly revenue growth of 50 US retailers was 0.39.
• Average excess return for stocks in the highest quintile was 2.14%, lowest quintile was -1.26%.
Revenue Growth vs. Consumer ActivitiesMarch 2009 – July 2014
Source: National Bureau of Economic Research, June 2016 ,Froot, Kang, Ozik, Sadka
Predictive Value Of Geo-location Data
16
26

• Based on search data from Google Trends.
• Generate search terms, extract search volumes, process the data, test predictive power of each
term.
• Construct the index.
• Measure improvement over a baseline autoregressive index.
Search Data: Key Backtesting Results (Dec 16)
Source: Google Trends, Eagle Alpha
Indicator Comparison Dataset Correlation Improvement over baseline model
Consumer Confidence (UK) Gfk Consumer Confidence 0.96 8%
Mortgage Applications (UK) Mortgage Approvals 0.86 8%
Unemployment (UK) Unemployment Rate (UK) 0.89 13%
Jobs (UK) Claimant Count Change 0.67 5%
Housing (UK) RICS House Price Index 0.6 5%
Unemployment (US) Unemployment Rate (US) 0.9 14%
Jobs (US) Nonfarm Payrolls 0.68 4%
Retail Sales (US) Retail Sales Ex. Autos (US) 0.31 8%
Predictive Value Of Search Data
17
27
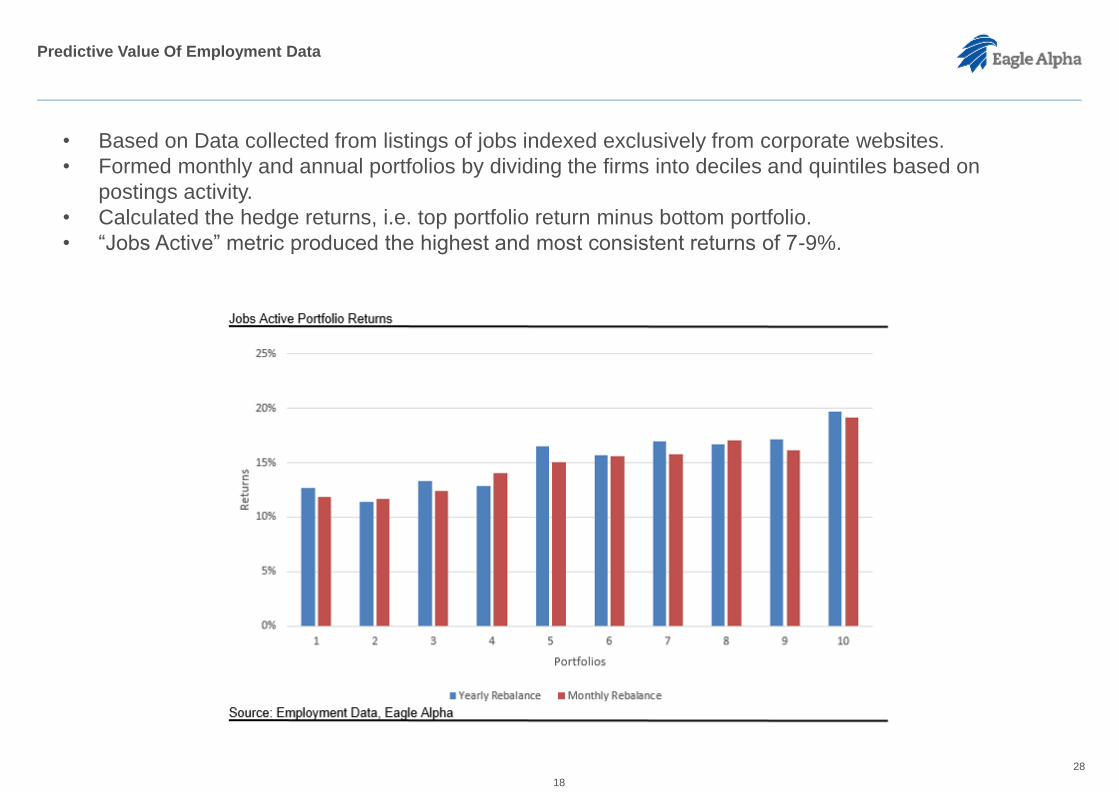
• Based on Data collected from listings of jobs indexed exclusively from corporate websites.
• Formed monthly and annual portfolios by dividing the firms into deciles and quintiles based on
postings activity.
• Calculated the hedge returns, i.e. top portfolio return minus bottom portfolio.
• “Jobs Active” metric produced the highest and most consistent returns of 7-9%.
Predictive Value Of Employment Data
18
28
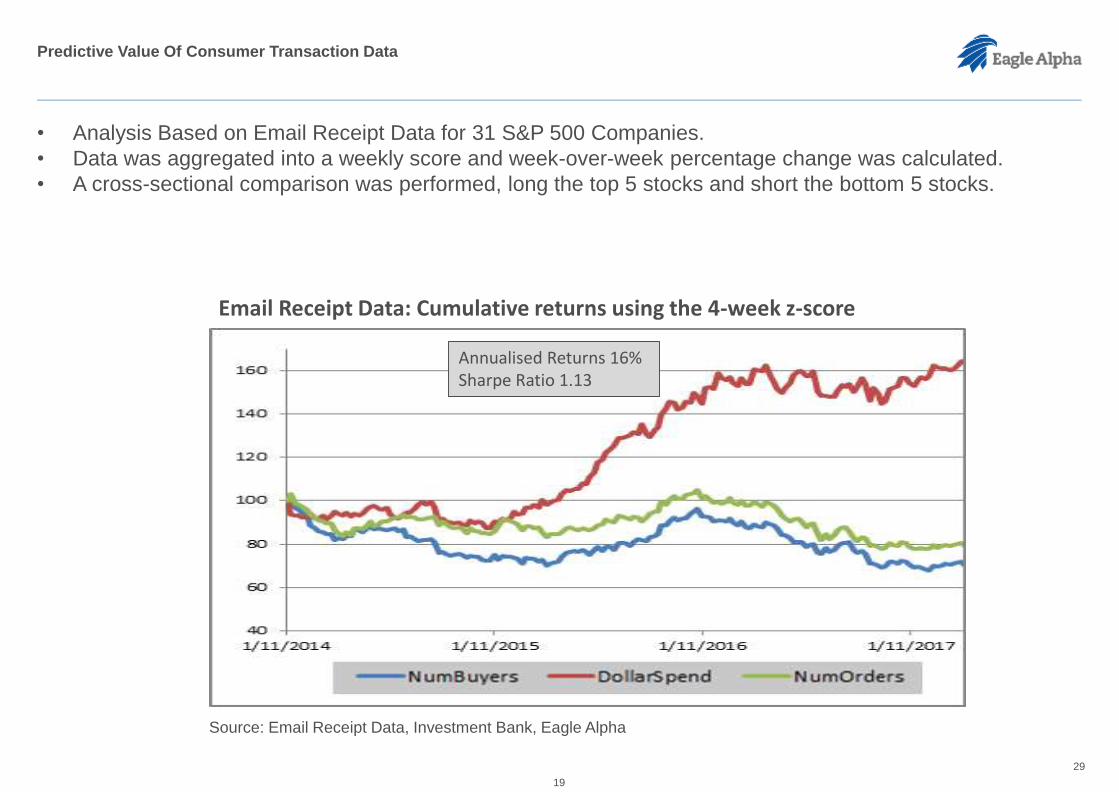
Source: Email Receipt Data, Investment Bank, Eagle Alpha
• Analysis Based on Email Receipt Data for 31 S&P 500 Companies.
• Data was aggregated into a weekly score and week-over-week percentage change was calculated.
• A cross-sectional comparison was performed, long the top 5 stocks and short the bottom 5 stocks.
Annualised Returns 16%Sharpe Ratio 1.13
Email Receipt Data: Cumulative returns using the 4-week z-score
Predictive Value Of Consumer Transaction Data
19
29

• This dataset shows a 99% correlation with
reported revenue for Great Wall Motors and a
95% correlation with YoY revenue growth over
a 5-year period.
• Eagle Alpha’s model for predicting Great Wall
Motors revenue, incorporating this dataset,
demonstrates a mean absolute percentage
error (MAPE) of just 4.9% (Figure 1). The error
rate for market consensus estimates was
8.1% over the same period.
• The information edge over the street estimates
is potentially large. For example, as shown in
Figure 2, in Q4 2014 the CAI data was
forecasting a QoQ growth rate of 48%
compared to the consensus estimate of 17%
versus the reported QoQ growth rate of 42%.
Figure 1: Great Wall Motors Revenue Prediction
Figure 2: Great Wall Motors Revenue Growth vs CAI Dealership Data
Using A Chinese Autos Dataset To Predict Revenue For Great Wall Motors
30

5: About Eagle Alpha

Eagle Alpha’s Vision To Be The ‘Go-To’ Firm For The Alternative Data Needs Of Asset Managers
31

Eagle Alpha’s Solution Is Focused On Education And Alpha
Tailored Teach-in
Firms that want to catch up with the early adopters engage us for an up to 8 hour customized teach-in.
We are the only provider of comprehensive teach-ins regarding alternative data.
Thought Leadership
Firms that want to stay ahead of competitors license this package. It includes events, lessons learnt, proprietary papers and industry developments.
We are the only provider of a dedicated Thought Leadership offering regarding alternative data.
Bespoke Projects
Clients that: a) want to start small; or b) don’t have the skillset; or c) don’t have the capacity, engage Eagle Alpha to do bespoke projects.
Given the other 5 parts of the Eagle Alpha solution we are uniquely positioned to deliver bespoke projects for buyside firms.
Data Insights
Data Insight reports and indicators give clients actionable ideas and demonstrate, how different types of datasets can be leveraged.
We are one of 2 independent firms worldwide that publish “quantamental” research reports that are based on alternative data.
Analytical Tools
We have two tools (Web Queries, Digital Expert Network) that enable clients to conduct proprietary research.
Clients value leveraging our 5 years of experience in order to help tailor the tools to give insight into their research questions.
Data Sourcing
This part of the solution includes: a) a database, b) an advisory service; c) vendor access; and d) proprietary datasets.
We have an unrivalled solution, based on 5 years of experience, to navigate clients through the sea of data.
Education / Best Practice Alpha
Ove
rvie
wU
SP
32

We Are Hosting The BIGGEST Data Showcase Event On 5th December In NYC
33

We Have Already Become A Recognised Leader In The Alternative Data Space e.g. Citi’s Primer Had A 10 Page Profile
34

JPMorgan’s Primer Positioned Eagle Alpha As An Emerging Data Aggregator
35
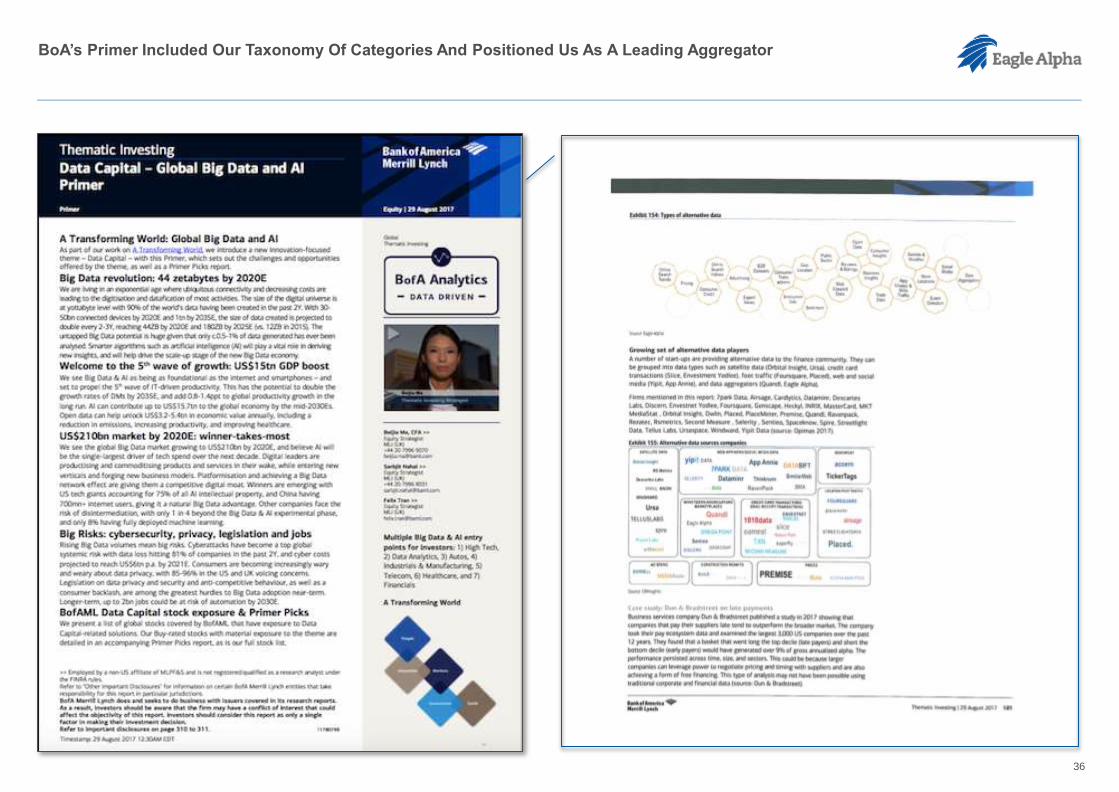
BoA’s Primer Included Our Taxonomy Of Categories And Positioned Us As A Leading Aggregator
36


![[Peter Kilduff] the Illustrated Red Baron the Li(BookZZ.org)](https://img.dokumen.tips/doc/110x75/55cf946f550346f57ba1fb4a/peter-kilduff-the-illustrated-red-baron-the-libookzzorg.jpg)