Embed Size (px)
Citation preview

AGF MANAGEMENT LIMITED
Scotia Capital Financials Summit
Tuesday September 14, 2004
Blake C. Goldring, CFAPresident and Chief Executive Officer
Randy AmbrosieExecutive Vice-President, Sales and Marketing
AGF: A GLOBAL INVESTMENT MANAGEMENT COMPANY
Established in 1957
Market capitalization: $1.6 billion
Total assets under management: $31.1 billion
Dividend yield: 2.51%
August 31, 2004
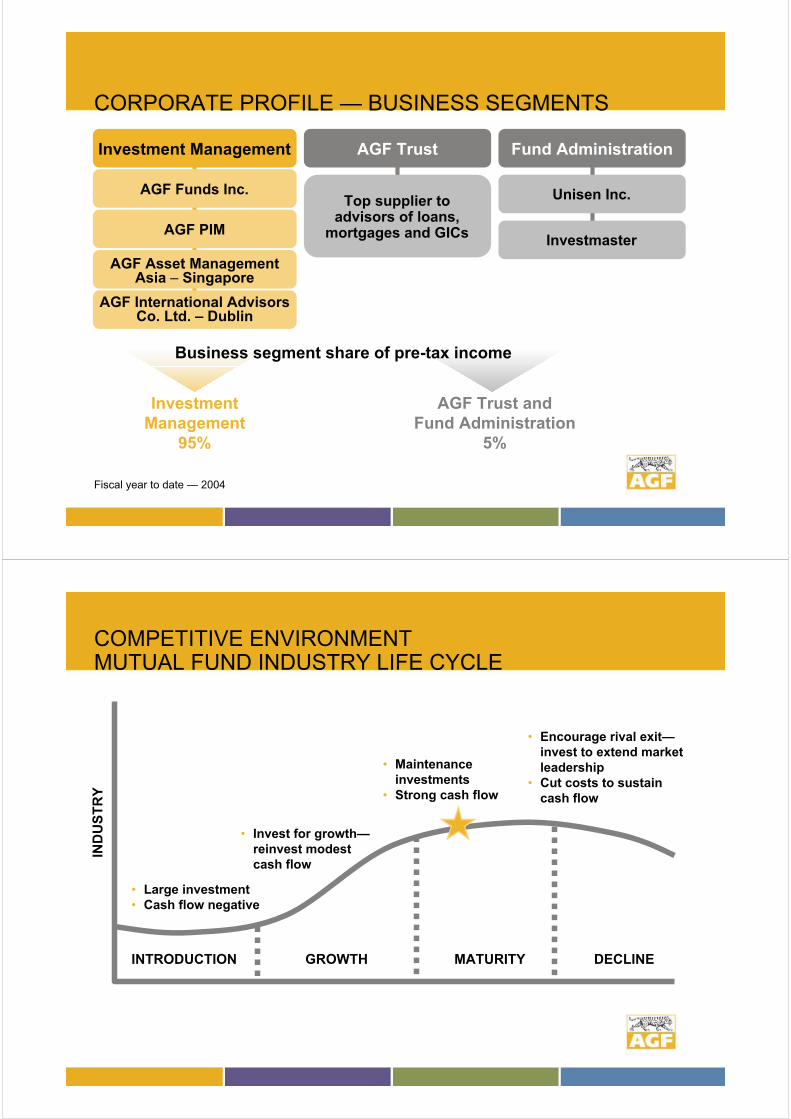
CORPORATE PROFILE — BUSINESS SEGMENTS
Investment Management
AGF Funds Inc.
AGF PIM
AGF International Advisors Co. Ltd. – Dublin
AGF Asset Management Asia – Singapore
AGF Trust
Top supplier to advisors of loans,
mortgages and GICs
Fund Administration
Unisen Inc.
Investmaster
Investment
95%
AGF Trust andFund Administration
5%
Business segment share of pre-tax income
Management
Fiscal year to date — 2004
COMPETITIVE ENVIRONMENTMUTUAL FUND INDUSTRY LIFE CYCLE
IND
US
TR
Y
INTRODUCTION GROWTH MATURITY DECLINE
• Large investment• Cash flow negative
• Invest for growth—reinvest modest cash flow
• Maintenance investments
• Strong cash flow
• Encourage rival exit—invest to extend market leadership
• Cut costs to sustain cash flow

COMPETITIVE ENVIRONMENTCHALLENGING CYCLICAL FACTORS
Equity funds have been 6% of total industry sales 2004 YTD.
Dividend & Income 31%
Balanced 25%
Canadian Common Shares 0%
US and Foreign Shares 6%
Bond & Income 36%
Mortgage & Real Estate 2%
2004 YTD Industry Net Sales*
* Calendar year to July, 2004
Fund Type — July, 2004*
59%41%
74%
17%
14%
14%23%
43%
11%1%2%1%
0%
20%
40%
60%
80%
100%
Industry Banks AGF
Equities Balanced Fixed Income Real Estate
COMPETITIVE ENVIRONMENTEMERGING CYCLICAL TRENDS
* IFIC

STRATEGIC PRIORITIES
• Reinforce investment management excellence
• Build a client centric organization focused on multi-channel distribution
• Pursue strategic acquisitions to supplement organic growth
• Undertake disciplined review of support entities
STRATEGIC PRIORITIES
• Reinforce investment management excellence
• Build a client centric organization focused on multi-channel distribution
• Pursue strategic acquisitions to supplement organic growth
• Undertake disciplined review of support entities

LONG-TERM PERFORMANCE TELLS A STORY:STRENGTH IN NUMBERS
Fund Performance Comparison — July 31, 2004% of Total Assets Above Median
AGF 61% 75%
C.I. 49% 28%
CIBC 47% 37%
Fidelity 70% 73%
IG 41% 21%
MacKenzie 61% 87%
Royal Bank 51% 29%
TD Bank 55% 82%
AIM/Trimark 92% 54%
COMPANY FIVE YEAR TEN YEAR
Source: BellCharts as at July 31, 2004Top companies by assets
OUR CATEGORY KILLER POTENTIAL
• AGF Canadian Real Value Fund
– We have one of the best value managers in the business in Keith Graham
• AGF European Equity Fund
– #2 European Equity Fund Manager Worldwide — Mercer Investment Consulting*
• AGF International Value Fund
– Harris Associates named one of Kiplinger’s top 10 U.S. fund companies
• Harmony
– “AGF Harmony was the only wrap program that advanced in asset ranking last year . . . and posted the highest year-over-year [AUM] growth rate for 2003”**
* Source: Financial Times, in a survey conducted by Mercer Investment Consulting for the three years ended December 31, 2003
** Source: Investor Economics, Fee-based Report: Winter 2004, HEFW Category

INVESTMENT MANAGEMENT — TACTICS
1. Clarify and articulate each fund’s philosophy and style
2. Investigate sub brand strategy
3. Review our investment disciplines
– Extract better performance from our processes
STRATEGIC PRIORITIES
• Reinforce investment management excellence
• Build a client centric organization focused on multi-channel distribution
• Pursue strategic acquisitions to supplement organic growth
• Undertake disciplined review of support entities
AGF MANAGEMENT LIMITED
Randy AmbrosieExecutive Vice-President, Sales and Marketing
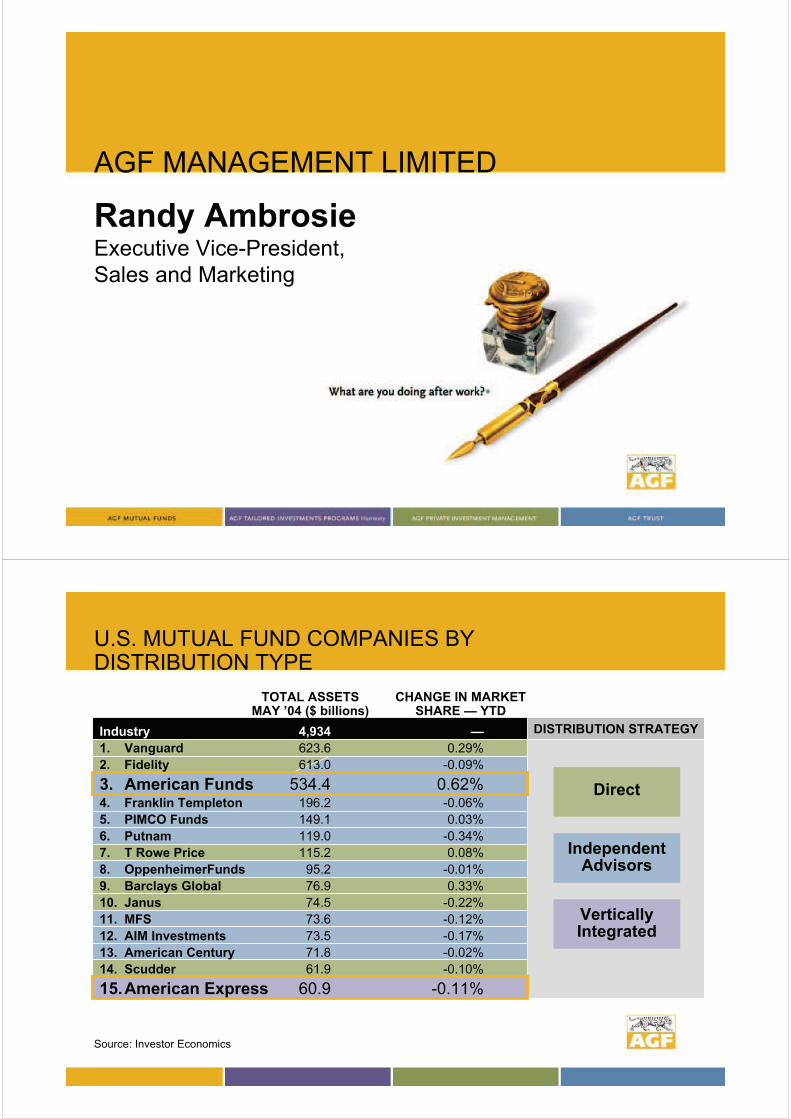
U.S. MUTUAL FUND COMPANIES BY DISTRIBUTION TYPE
DISTRIBUTION STRATEGY
Direct
Independent Advisors
VerticallyIntegrated
Industry 4,934 —
1. Vanguard 623.6 0.29%
2. Fidelity 613.0 -0.09%
3. American Funds 534.4 0.62%4. Franklin Templeton 196.2 -0.06%
5. PIMCO Funds 149.1 0.03%
6. Putnam 119.0 -0.34%
7. T Rowe Price 115.2 0.08%
8. OppenheimerFunds 95.2 -0.01%
9. Barclays Global 76.9 0.33%
10. Janus 74.5 -0.22%
11. MFS 73.6 -0.12%
12. AIM Investments 73.5 -0.17%
13. American Century 71.8 -0.02%
14. Scudder 61.9 -0.10%
15.American Express 60.9 -0.11%
Source: Investor Economics
TOTAL ASSETSMAY ’04 ($ billions)
CHANGE IN MARKET SHARE — YTD

PERCENT OF A TYPICAL CANADIAN ADVISOR’S SALES BY FUND FAMILY
0 10 20 30 40 50 60
Rank 1
Rank 2
Rank 3
Rank 4
Rank 5
Rank 6
Rank 7
Rank 8
2003
2003e
2002
2001
2000
Top 4 fund families =
90% of sales in 200384% of sales in 200283% of sales in 200184% of sales in 2000
Co
re s
up
po
rter
of
the
se
fu
nd
fam
ilie
sS
ec
on
d-t
ier
su
pp
ort
er
of
the
se
fu
nd
fa
mil
ies
On average, advisors continue to represent 6.4 fund families.
BUT!BUT!
BOTTOM UP APPROACHADVISOR CHANNEL
• Increase coverage capabilities– 29 core coverage teams
• Rationalize sales team compensation
– New assets
– Asset retention
• Additional coverage
– Strategic relationships

CLIENT CENTRIC — SALES TACTICS
Sales & Marketing
Advisor
Sales
Institutional
Sales
Customer
Relationship
Management
Product
Development
Marketing
Services
National
Accounts
STRATEGIC PRIORITIES
• Reinforce investment management excellence
• Build a client centric organization focused on multi-channel distribution
• Pursue strategic acquisitions to supplement organic growth
• Undertake disciplined review of support entities

STRATEGIC ACQUISITIONS —AGF PRIVATE INVESTMENT MANAGEMENT
Montreal•$1.2B in assets•Core Value•Large Cap
Calgary• Organic growth• Leverage PM’s
in Vancouver
Toronto• Organic
growth
Vancouver• $2B in assets• Oil & Gas• Small Cap
Ottawa• $1B in assets• Core Value• Fixed Income
Targets:
•50% cash flow margins
•15-20% ROI
STRATEGIC PRIORITIES
• Reinforce investment management excellence
• Build a client centric organization focused on multi-channel distribution
• Pursue strategic acquisitions to supplement organic growth
• Undertake disciplined review of support entities

SUPPORT BUSINESSES — AGF TRUST
AGF TRUST
• Leverages financial advisor offerings through loans, mortgages and GICs
• Consumer loans (investment and RSP) rose 16% in Q2 2004 versus Q1 2004
• Net income for Q2 2004 up 160%* over Q2 2003
*Increase does not include one-time gain of $0.6 million in Q2 2004
SUPPORT BUSINESSES — AGF TRUST
-
1,000
2,000
3,000
4,000
5,000
6,000
7,000
8,000
9,000
2000 2001 2002 2003 2004
CAGR 41%
annualized
AGF Trust — Income Before Taxes($ 000’s)
100,
200,
300,
400,
500,
600,
700,
800,
000
000
000
000
000
000
000
000
2000 2001 2002 2003 2004
AGF Trust — Total Assets($ 000’s)
CAGR 43%
forecast

SUPPORT BUSINESSES
• Administration and/or technology solutions for 28 million investment fund accounts with $210 billion in assets
• Over 170 client relationships
• EBITDA for the fund administration segment for YTD 2004 up 156% over prior year
May 31, 2004
YTD 2004 RESULTS — DRIVING MOMENTUM
Revenue up 13.4%
Cash flow from operations up 26.7%
EBITDA up 13.8%
Net income up 55.5%
Includes $7.1 million tax benefit realized in Q2 2004.
Does not include $12.8 million capital gain in Q1 2003.

STRENGTH IN KEY MEASURES — BUSINESS GROWTH
EBITDA and Cash Flow Growth
$0
$50,000
$100,000
$150,000
$200,000
$250,000
$300,000
$350,000
1995 1996 1997 1998 1999 2000 2001 2002 2003 2004
Year
EBITDA Cash Flow From Operations
CAGR: 28%
CAGR: 33%
annualized
UTILIZATION OF FREE CASH FLOW($ millions)
*2004 Data
• Debt reduction is a forecast
• Dividends and share repurchases are YTD annualized
• Acquisitions are YTD
0
20
40
60
80
100
120
140
160
2002 2003 2004*
Debt Reduction
Dividends
Acquisitions
Share Repurchases

DIVIDEND GROWTH —A PRIORITY USE OF FREE CASH FLOW
annualized
Annual Dividends Paid Per Share*
$0.00
$0.10
$0.20
$0.30
$0.40
$0.50
'97 '98 '99 '00 '01 '02 '03 '04
CAGR 24%
Dividends increased 37.5% in Q2 2004 to an annual rate of $0.44 per share
*Fiscal years ending November 30
RECOGNIZED LONG-TERM OUTPERFORMANCE
20-year performance among the 79 companies in the S&P/TSX composite that have been listed on the TSX for 20 years ending Nov 25 2003. Reported by National Post BUSINESS February 2004.

FORWARD LOOKING INFORMATION
This presentation contains certain forward-looking
statements that are made based on management’s
judgment and expectations but are inherently subject to
risks and uncertainties beyond the Corporation’s control.
These risks and uncertainties include economic conditions,
market fluctuations, interest rate and foreign exchange
movements, political events, regulatory change and
competitive developments. Actual results may differ
materially from those anticipated in the
forward-looking statements.