Embed Size (px)
Citation preview

1
3 February 2015
2 Important information Banco Santander, S.A. ("Santander") cautions that this presentation contains forward-looking statements. These forward-looking statements are found in various places throughout this presentation and include, without limitation, statements concerning our future business development and economic performance. While these forward-looking statements represent our judgment and future expectations concerning the development of our business, a number of risks, uncertainties and other important factors could cause actual developments and results to differ materially from our expectations. These factors include, but are not limited to: (1) general market, macro-economic, governmental and regulatory trends; (2) movements in local and international securities markets, currency exchange rates and interest rates; (3) competitive pressures; (4) technological developments; and (5) changes in the financial position or credit worthiness of our customers, obligors and counterparties. The risk factors that we have indicated in our past and future filings and reports, including those with the Securities and Exchange Commission of the United States of America (the “SEC”) could adversely affect our business and financial performance. Other unknown or unpredictable factors could cause actual results to differ materially from those in the forward-looking statements.
Forward-looking statements speak only as of the date on which they are made and are based on the knowledge, information available and views taken on the date on which they are made; such knowledge, information and views may change at any time. Santander does not undertake any obligation to update or revise any forward-looking statement, whether as a result of new information, future events or otherwise.
The information contained in this presentation is subject to, and must be read in conjunction with, all other publicly available information, including, where relevant any fuller disclosure document published by Santander. Any person at any time acquiring securities must do so only on the basis of such person's own judgment as to the merits or the suitability of the securities for its purpose and only on such information as is contained in such public information having taken all such professional or other advice as it considers necessary or appropriate in the circumstances and not in reliance on the information contained in the presentation. In making this presentation available, Santander gives no advice and makes no recommendation to buy, sell or otherwise deal in shares in Santander or in any other securities or investments whatsoever.
Neither this presentation nor any of the information contained therein constitutes an offer to sell or the solicitation of an offer to buy any securities. No offering of securities shall be made in the United States except pursuant to registration under the U.S. Securities Act of 1933, as amended, or an exemption therefrom. Nothing contained in this presentation is intended to constitute an invitation or inducement to engage in investment activity for the purposes of the prohibition on financial promotion in the U.K. Financial Services and Markets Act 2000.
Note: Statements as to historical performance or financial accretion are not intended to mean that future performance, share price or future earnings (including earnings per share) for any period will necessarily match or exceed those of any prior year. Nothing in this presentation should be construed as a profit forecast.
The businesses included in each of our geographic segments and the accounting principles under which their results are presented here may differ from the included businesses and local applicable accounting principles of our public subsidiaries in such geographies. Accordingly, the results of operations and trends shown for our geographic segments my differ materially from those of such subsidiaries.

3
Agenda
■ Group performance 2014
■ Business areas performance 2014
■ Outlook
■ Appendix

4
Strong profit growth amid normalisation process
2014 Highlights
2012 2013 2014
2,283
4,175
5,816
Attributable profit
+39%*
(*) Excluding exchange rate impact: +49%
1 1
(1) Profit adjusted to the entry into force with retroactive effect, of the interpretation of the international accounting standard IFRIC 21, which means anticipating the recording of contributions to the deposit guarantee funds. Net impact on 2012: -EUR 12 mill.; 2013: -EUR 195 mill.
(2) 2014 pro-forma data taking into account the capital increase carried out in January 2015
Commercial REVENUES rose compared to the decline in 2013
Good performance of operating EXPENSES, backed by efficiency plans
Efficiency ratio: 47.0% (-1.1 p.p.)
Lower loan-loss PROVISIONS, with leeway towards normalisation
Profit before tax increased in all countries
Increased PROFITABILITY ratios EPS: +24% RoTE2: 11.0% (+1.4 p.p.)
EUR million

5 2014 Highlights
Loans Deposits + mutual funds
NPL and coverage ratios CET1(1) 2014
65% 67%
Fully loaded
9.7%
Faster growth in volumes and strengthened balance sheet
NOTE: Loans and deposits excluding repos and in constant currency
(1) Pro-forma data taking into account the capital increase carried out in January 2015
Change of trend in LOANS. Growth to individuals and companies
Growth in customer FUNDS consistent with lower cost of liabilities
Comfortable LIQUIDITY, meeting LCR and NSFR requirements ahead of schedule
Improved CREDIT QUALITY and lower cost of credit
Solid SOLVENCY ratios, strengthened by capital increase
Coverage ratio
NPL ratio
5.61% 5.19%
Dec'13 Dec'14
2013 / 2012 2014 / 2013
-2%
+5%
2013 / 2012 2014 / 2013
+3%
+6%

6
Profit & Loss

7
Quarterly P&L
Quarterly attributable profit
1Q'13 2Q 3Q 4Q 1Q'14 2Q 3Q 4Q
1,205 1,050 1,055
864
1,303
1,453 1,605
1,455
In 4Q, further growth of commercial revenues and lower provisions. Profit declined due to lower trading gains, taxes and handling fees
NII + fee income 10,238 3.3 3.8
Trading gains 620 -34.8 -35.3
Gross income 11,040 0.7 1.1
Operating exp. -5,216 2.9 3.3
Net op. income 5,824 -1.1 -0.7
LLPs -2,452 -11.7 -11.5
PBT 2,580 0.9 1.2
Attributable profit 1,455 -9.3 -9.3
Nota: 2013 profit adjusted to the entry into force with retroactive effect, of the interpretation of the international accounting standard IFRIC 21, which means anticipating the recording of contributions to the deposit guarantee funds.
Grupo Santander results
EUR million
(*) Variation excluding exchange rate impact
4Q’14 Var. / 3Q’14
% %*
8
(*) Variation excluding exchange rate impact
Grupo Santander results
EUR million
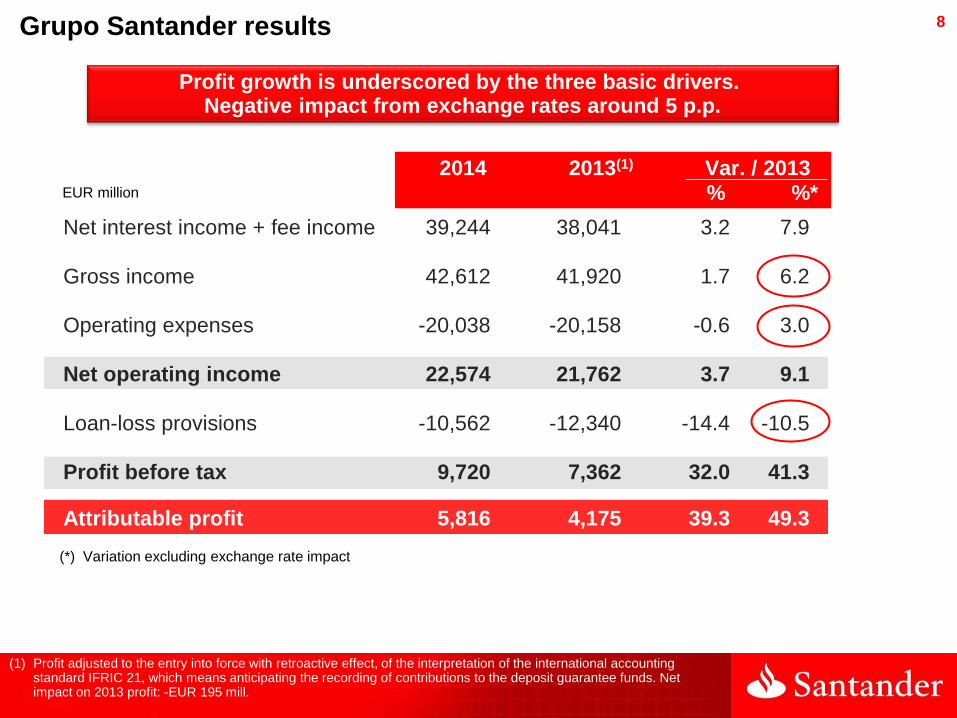
2014 2013(1) Var. / 2013 % %*
Profit growth is underscored by the three basic drivers. Negative impact from exchange rates around 5 p.p.
Net interest income + fee income 39,244 38,041 3.2 7.9
Gross income 42,612 41,920 1.7 6.2
Operating expenses -20,038 -20,158 -0.6 3.0
Net operating income 22,574 21,762 3.7 9.1
Loan-loss provisions -10,562 -12,340 -14.4 -10.5
Profit before tax 9,720 7,362 32.0 41.3
Attributable profit 5,816 4,175 39.3 49.3
(1) Profit adjusted to the entry into force with retroactive effect, of the interpretation of the international accounting standard IFRIC 21, which means anticipating the recording of contributions to the deposit guarantee funds. Net impact on 2013 profit: -EUR 195 mill.

9
The capital gains obtained in the Insurance transaction were registered in the fourth quarter. Provisions in the same amount were made for restructuring costs and other
Insurance Restructuring costs and other
Impairment of intangible assets
Other provisions
SCUSA
UK pensions
EUR million
Grupo Santander results
385
730
224
250
1,589
744
512
83
250
1,589
Altamira
2014 corporate transactions
capital gains
(net of tax)
2014 non-recurring
provisions
(net of tax)
Restructuring costs
4Q’14 250 mill.
1H’14 1,339 mill.
4Q’14 250 mill.
1H’14 1,339 mill.
10
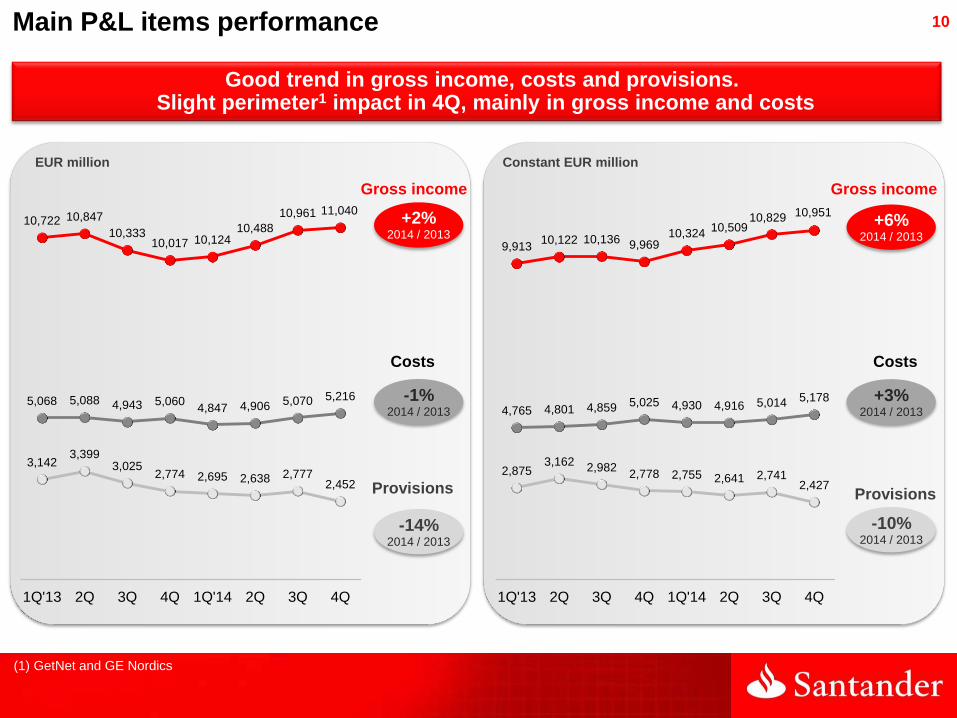
Good trend in gross income, costs and provisions. Slight perimeter1 impact in 4Q, mainly in gross income and costs
Main P&L items performance
+3% 2014 / 2013
-10% 2014 / 2013
(1) GetNet and GE Nordics
-1% 2014 / 2013
-14% 2014 / 2013
EUR million Constant EUR million
Gross income
Costs
Provisions
Gross income
Costs
Provisions
9,913 10,122 10,136 9,969
10,324 10,509
10,829 10,951
4,765 4,801 4,859 5,025 4,930 4,916 5,014 5,178
2,875 3,162
2,982 2,778 2,755 2,641 2,741
2,427
1Q'13 2Q 3Q 4Q 1Q'14 2Q 3Q 4Q
10,722 10,847
10,333 10,017 10,124
10,488
10,961 11,040
5,068 5,088 4,943 5,060 4,847 4,906 5,070 5,216
3,142 3,399
3,025 2,774 2,695 2,638 2,777
2,452
1Q'13 2Q 3Q 4Q 1Q'14 2Q 3Q 4Q
+6% 2014 / 2013
+2% 2014 / 2013
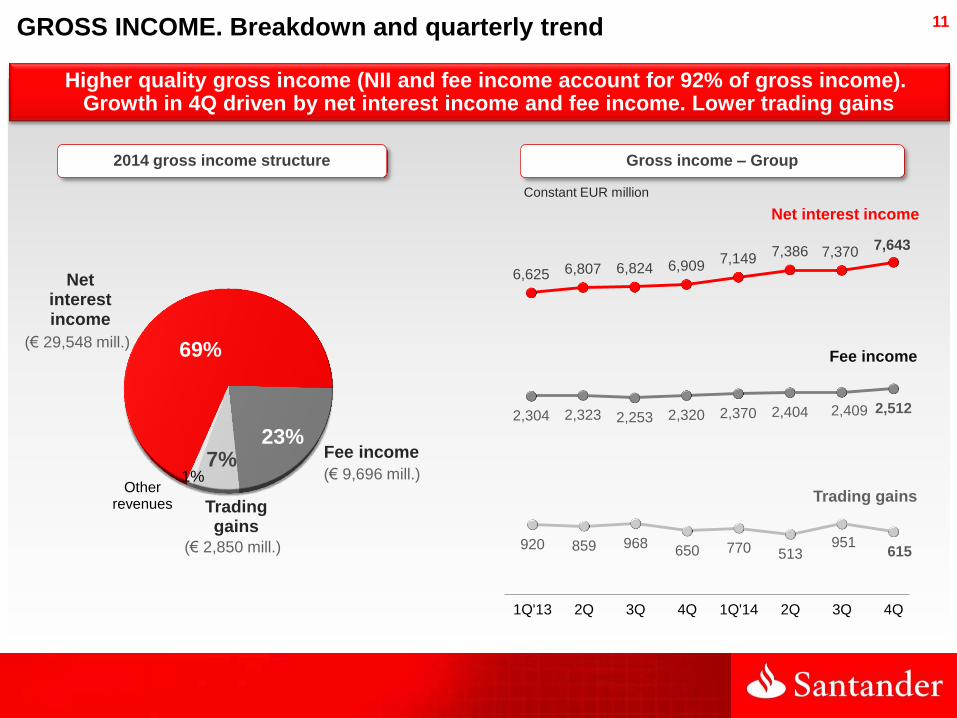
11
Higher quality gross income (NII and fee income account for 92% of gross income). Growth in 4Q driven by net interest income and fee income. Lower trading gains
Constant EUR million
GROSS INCOME. Breakdown and quarterly trend
69%
23% 7%
1%
(€ 29,548 mill.)
(€ 2,850 mill.)
(€ 9,696 mill.)
2014 gross income structure Gross income – Group
Net interest income
Fee income
Trading gains
Other revenues
2,304 2,323 2,253 2,320 2,370 2,404 2,409 2,512
920 859 968 650 770 513
951 615
1Q'13 2Q 3Q 4Q 1Q'14 2Q 3Q 4Q
6,625 6,807 6,824 6,909 7,149
7,386 7,370 7,643
Fee income
Net interest income
Trading gains

12
Over 2013, gross income growth driven mainly by net interest income. Growth in all countries except Brazil
(*) "Other" includes income from equity method, dividends and other operating results
GROSS INCOME. 2014/2013 performance and breakdown by country
Total gross income
Business: +6%
2014 Gross
income
41,920 42,612
-1,780
+2,384 +496
-408
+9%
+5% -11%
Fee income
Trading gains and Other*
2013 Gross
income
FX
2014 / 2013 (%)
Brazil
Spain
USA
UK
SCF
Mexico
Chile
Poland
Argentina
Portugal
12,008
6,997
5,643
5,541
3,309
3,072
2,197
1,376
1,158
956
-3
+1
+16
+8
+6
+6
+13
+4
+34
+4
Net interest income
EUR million and % change in constant euros
13
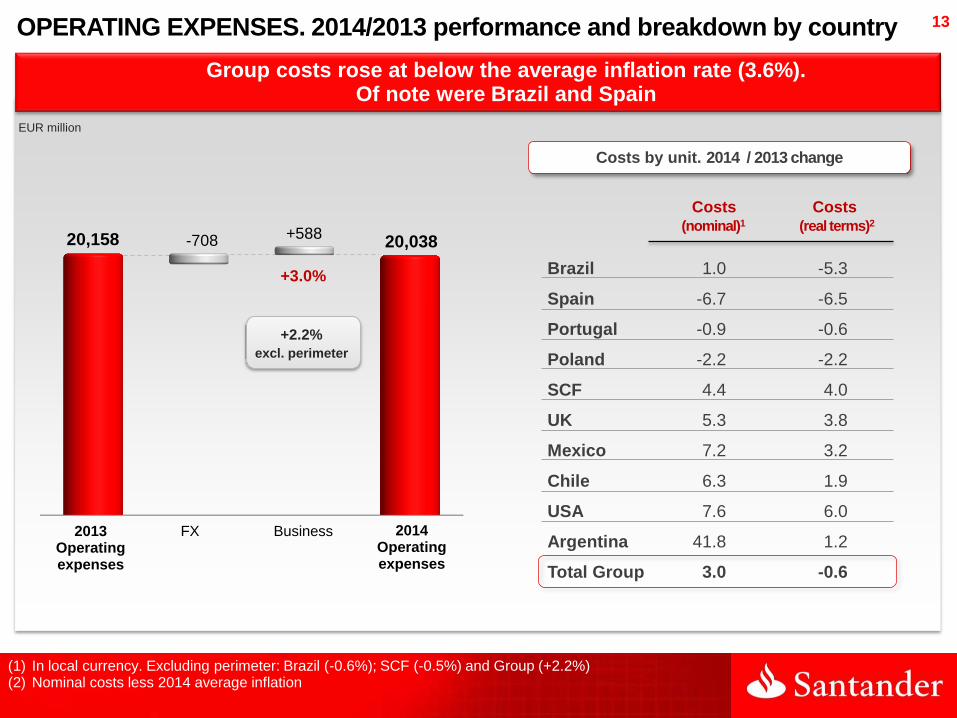
Group costs rose at below the average inflation rate (3.6%). Of note were Brazil and Spain
OPERATING EXPENSES. 2014/2013 performance and breakdown by country
(1) In local currency. Excluding perimeter: Brazil (-0.6%); SCF (-0.5%) and Group (+2.2%) (2) Nominal costs less 2014 average inflation
20,158 20,038 -708 +588
Business 2013 Operating expenses
FX 2014 Operating expenses
+2.2%
excl. perimeter
+3.0%
Costs by unit. 2014 / 2013 change
EUR million
Costs Costs (nominal)1 (real terms)2
Brazil 1.0 -5.3
Spain -6.7 -6.5
Portugal -0.9 -0.6
Poland -2.2 -2.2
SCF 4.4 4.0
UK 5.3 3.8
Mexico 7.2 3.2
Chile 6.3 1.9
USA 7.6 6.0
Argentina 41.8 1.2
Total Group 3.0 -0.6

14
2014-16 efficiency and productivity Plan: the cost savings envisaged in the efficiency plan were surpassed in the first year
EUR million
Efficiency plan target 2014 cost savings
Brazil 430 494
(in real terms)
Spain 300 318
(integration and efficiency plan)
Central Services / Holding 50 82
(Zero based project in Central
Divisions and factories)
Other business units 220 294
Note: Savings calculated over 2013 costs plus vegetative evolution (inflation, upward/downward movements, ongoing investments). Excluding perimeter and new projects
1,000
Announced Achieved
1,188
OPERATING EXPENSES. Efficiency Plan
2014 2015 2016
1,000
1,600
2,000
1,188
Cost savings target after 3Q’14 review
Cost savings achieved

15
Lower cost of credit due to widespread decline in provisions in the large units
PROVISIONS. 2014/2013 performance and breakdown by country
Cost of credit
12,340
10,562
-542 -1,236
1.69%
1.43%
1.53%
1.15%
Business 2013 Provisions
FX 2014 Provisions
2014 / 2013 (%)
Brazil
Spain
USA
UK
SCF
Mexico
Chile
Poland
Argentina
Portugal
3,682
1,745
2,233
332
544
756
521
186
121
124
-18
-28
+47
-46
-4
-2
0
+11
+52
-36
EUR million and % change in constant euros
-10%

16
Balance Sheet

17
Change of trend in loans1: they rose in 2014 from a 2% fall in 2013.
All units increased (except Portugal), with faster growth in 4Q in some countries
Constant EUR billion
Loans
UK
Spain
Brazil
USA
SCF
Chile
Mexico
Portugal
Poland
Argentina
250
162
78
71
64
32
27
24
18
6
+0.1
+1
+6
+2
+4
+3
+5
-1
+0.4
+12
Dec’14
TOTAL Group +2 +5
+3
+2
+10
+4(2)
+9
+8
+18
-5
+7
+23
Gross loans by country (excluding repos)
(1) Gross loans excluding repos (2) Excluding sale of portfolios and securitisations: +7%
% q-o-q change
% y-o-y change
Loans
2013 / 2012 2014 / 2013
-2%
+5%

18
Customer funds1, also grew faster (+6%) than in 2013 (+3%),
and increased in all countries
Deposits + Mutual funds
UK
Spain
Brazil
USA
Chile
Mexico
Portugal
Poland
Argentina
206
217
92
48
29
36
25
24
8
TOTAL Group +1 +6
+1
-1
+4
+2
+7
+5
0
+1
+12
+2
+5
+12
+6
+17
+13
+5
+10
+37
Dec’14 % q-o-q change
% y-o-y change
Constant EUR billion
Deposits (excluding repos) + mutual funds by country
(1) Deposits excluding repos + managed and marketed mutual funds
Deposits + mutual funds
+3%
+6%
2013 / 2012 2014 / 2013

19
Comfortable liquidity position in the Group and the principal units. Compliance with regulatory ratios ahead of schedule
Dec'13 Dec'14
112% 113%
Loan to deposit ratio
Dec'13 Dec'14
118% 116%
Deposits + M/L term funds captured / net loans
Above 100% at year-end in the Group
and the main subsidiaries …
… vs. the 60% required by 1-Oct-15
Above 100% at year-end in the Group
and most of the large units
Under observation. Required by 2018
Liquidity
LCR NSFR

20
NPL ratio
Coverage ratio
UK
Brazil
Spain
USA
Credit quality
NPL ratio
Group
The Group's credit quality continued to improve throughout 2014, accelerating in the second half of the year in the principal units
%
5.61 5.52 5.45 5.28 5.19
D'13 M'14 J'14 S'14 D'14*
65 66 67 68 67
3.09 2.88 2.93 2.68 2.54
D'13 M'14 J'14 S'14 D'14
1.98 1.88 1.91 1.80 1.79
D'13 M'14 J'14 S'14 D'14
5.64 5.74 5.78 5.64
5.05
D'13 M'14 J'14 S'14 D'14
7.49 7.61 7.59 7.57 7.38
D'13 M'14 J'14 S'14 D'14
(*) NPL ratio of 5.12% excluding GE Nordics incorporation

21 Capital ratios
Capital strengthened ahead of 2019 requirements
3.6 3.9
8.3 9.7
0.8
0.8 1.3
1.3 10.4
11.8 Capital
ratio
Tier2
CET1
Tier1
Fully-loaded leverage ratio Fully-loaded capital ratios
%
Dec’14 Dec’14 (with capital increase) Dec’14 Dec’14 (with capital increase)
11.0 12.2 Phased-in
CET1 4.4 5.0 Phased-in
Leverage ratio
22
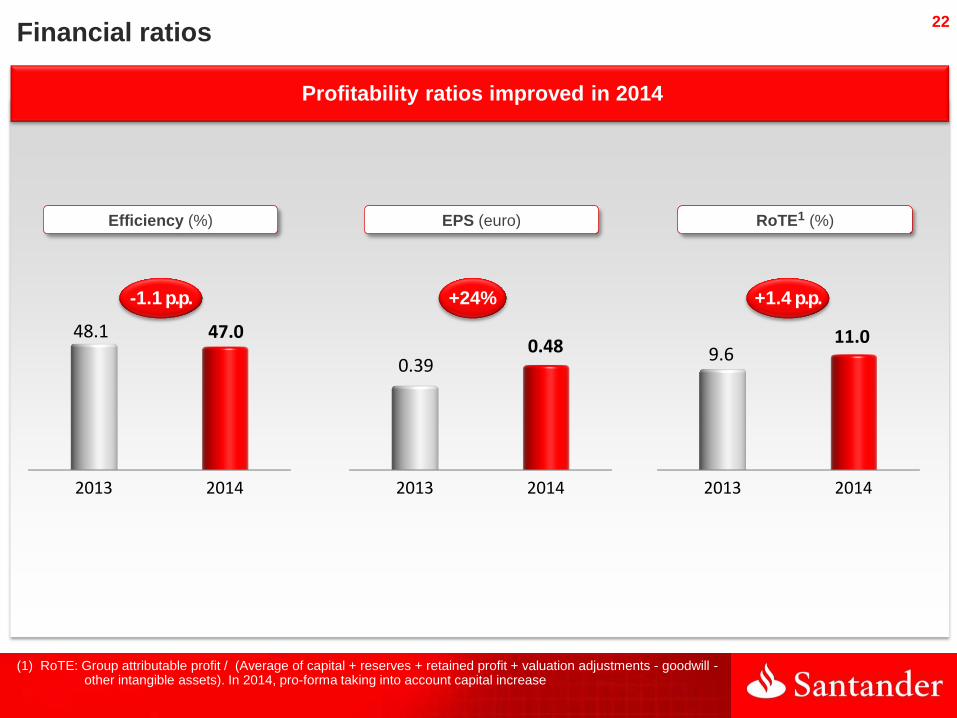
2013 2014
9.6 11.0
Profitability ratios improved in 2014
Financial ratios
RoTE1 (%)
2013 2014
0.39 0.48
EPS (euro)
+24% +1.4 p.p.
(1) RoTE: Group attributable profit / (Average of capital + reserves + retained profit + valuation adjustments - goodwill - other intangible assets). In 2014, pro-forma taking into account capital increase
2013 2014
48.1 47.0
Efficiency (%)
-1.1 p.p.

23
Agenda
■ Group performance 2014
■ Business areas performance 2014
■ Outlook
■ Appendix
24
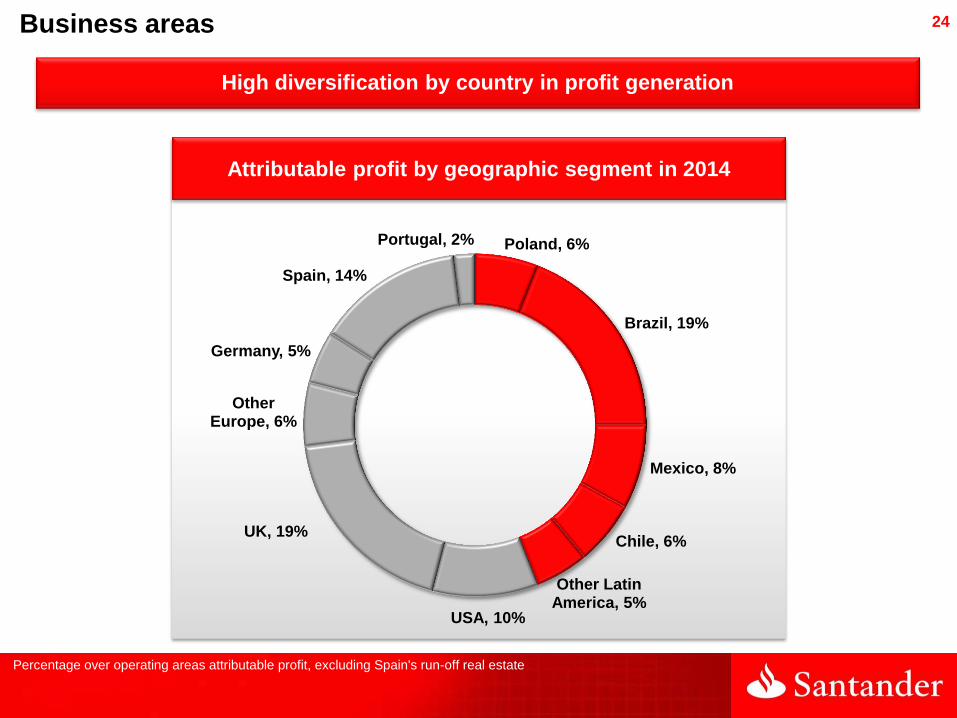
Percentage over operating areas attributable profit, excluding Spain's run-off real estate
Business areas
High diversification by country in profit generation
Attributable profit by geographic segment in 2014
Poland, 6%
Brazil, 19%
Mexico, 8%
Chile, 6%
Other Latin America, 5%
USA, 10%
UK, 19%
Other Europe, 6%
Germany, 5%
Spain, 14%
Portugal, 2%

25
Attributable profit rose in all units, except Mexico (higher tax rate) and the US (higher minority interests in SCUSA)
ATTRIBUTABLE PROFIT. 2014/2013 performance
2014 attributable profit % change / 2013
(1) Declined due to the higher tax rate. Profit before tax up 9%
EUR million and
% change in constant euros
UK
Brazil
Spain
SCF
USA
Mexico
Chile
Poland
Argentina
Portugal
1,576
1,558
1,121
891
800
660
509
358
298
189
+30%
+8%
+141%
+12%
0%
-3%
+35%
+7%
+33%
+65%
(1)

26
Activity
Spain
Growth in loans (companies) and deposits (consistent with lower cost of funding)
Profit growth drivers: lower provisions, lower cost of funding and efficiency plan
In gross income, net interest income up 9%, but trading gains and dividends declined
In 4Q, impact of lower trading gains (GBM) and tax charge on deposits
Volumes1 Cost of new time deposits
EUR million
P&L
(1) Loans excluding repos. Funds: deposits excluding repos + marketed mutual funds
4Q’14 %3Q’14 2014 %2013
NII + fee income 1,665 1.8 6,564 6.0
Gross income 1,690 -2.5 6,997 0.6
Operating expenses -860 0.5 -3,482 -6.7
Net op. income 830 -5.5 3,515 9.2
LLPs -320 -25.4 -1,745 -27.6
Attributable profit 299 -3.3 1,121 140.5 Loans Funds
+2%
+5%
Var. D’14 / D’13
+1% / 3Q'14
-1% / 3Q'14
1.36%
0.91%
0.75% 0.55%
0.44%
4Q'13 1Q'14 2Q 3Q 4Q
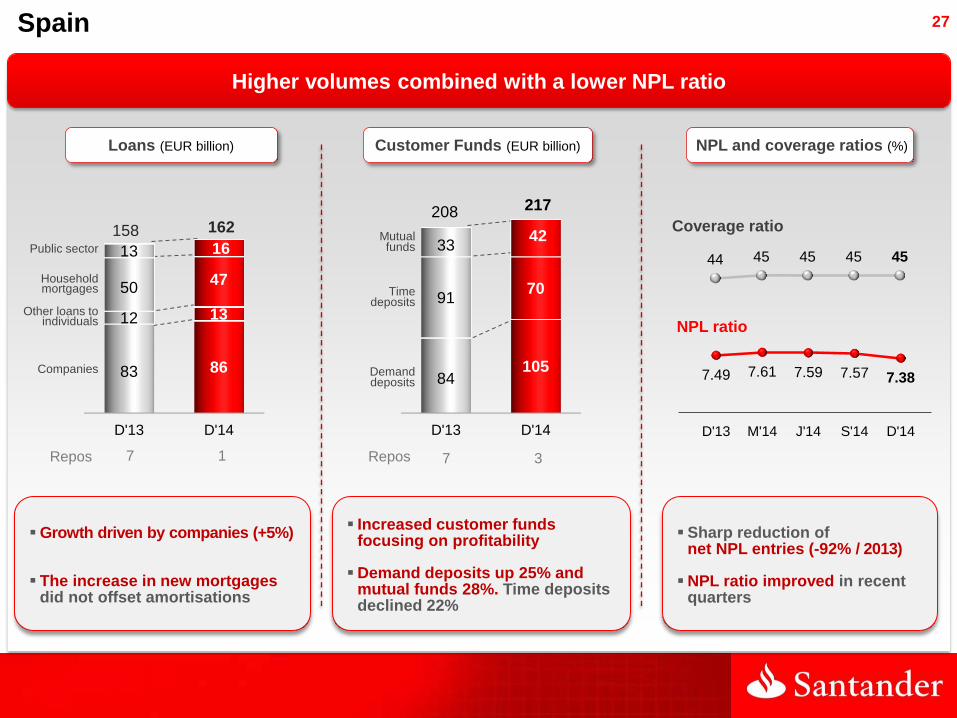
27
7.49 7.61 7.59 7.57 7.38
D'13 M'14 J'14 S'14 D'14
44 45 45 45 45
Spain
Coverage ratio
NPL ratio
Public sector
Companies
Other loans to individuals
Household mortgages
Repos
Demand deposits
Time deposits
Repos 7 1
Sharp reduction of net NPL entries (-92% / 2013)
NPL ratio improved in recent quarters
Mutual funds
7 3
Higher volumes combined with a lower NPL ratio
Increased customer funds focusing on profitability
Demand deposits up 25% and mutual funds 28%. Time deposits declined 22%
Growth driven by companies (+5%)
The increase in new mortgages did not offset amortisations
D'13 D'14
84 105
91 70
33 42
208 217
D'13 D'14
83 86
12 13
50 47
13 16 158 162
NPL and coverage ratios (%) Loans (EUR billion) Customer Funds (EUR billion)

28
United Kingdom
Var. D’14 / D’13
Volumes1 Banking NIM2
1.71% 1.79% 1.81% 1.82% 1.85%
4Q'13 1Q'14 2Q 3Q 4Q
Activity
(1) Volumes in local currency. Loans excluding repos. Funds: deposits excluding repos + marketed mutual funds
(2) In local criteria
£ million
P&L
4Q’14 %3Q’14 2014 %2013
NII + fee income 1,101 2.9 4,240 12.4
Gross income 1,136 1.1 4,464 7.7
Operating expenses -604 4.4 -2,329 5.3
Net op. income 532 -2.4 2,136 10.6
LLPs -27 -60.8 -268 -45.7
Attributable profit 308 -5.6 1,270 30.2
+0.1% / 3Q'14
+1% / 3Q'14
Loans Funds
+3%
+2%
Growth in corporate loans and customer deposits; resumed growth in residential mortgages
Higher commercial revenues; with margin and volume improvements
Continued investments in the retail branch network and digital and reinforced corporates and GBM
Provisions reflect prudent risk management and benign UK economic environment
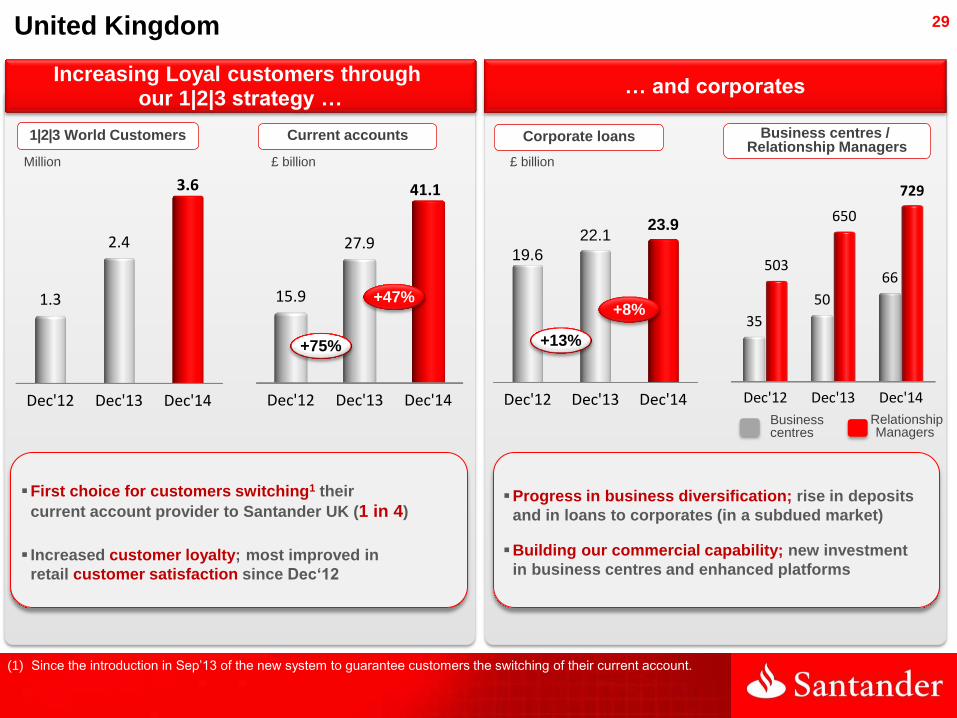
29 United Kingdom
Increasing Loyal customers through our 1|2|3 strategy …
Dec'12 Dec'13 Dec'14
15.9
27.9
41.1
+47%
Dec'12 Dec'13 Dec'14
1.3
2.4
3.6
… and corporates
Dec'12 Dec'13 Dec'14
19.6
22.1 23.9
+8%
+13% +75%
(1) Since the introduction in Sep’13 of the new system to guarantee customers the switching of their current account.
£ billion Million £ billion
Current accounts 1|2|3 World Customers Corporate loans Business centres / Relationship Managers
Business centres
Relationship Managers
First choice for customers switching1 their
current account provider to Santander UK (1 in 4)
Increased customer loyalty; most improved in
retail customer satisfaction since Dec‘12
Dec'12 Dec'13 Dec'14
35
50
66 503
650
729
Progress in business diversification; rise in deposits
and in loans to corporates (in a subdued market)
Building our commercial capability; new investment
in business centres and enhanced platforms
30
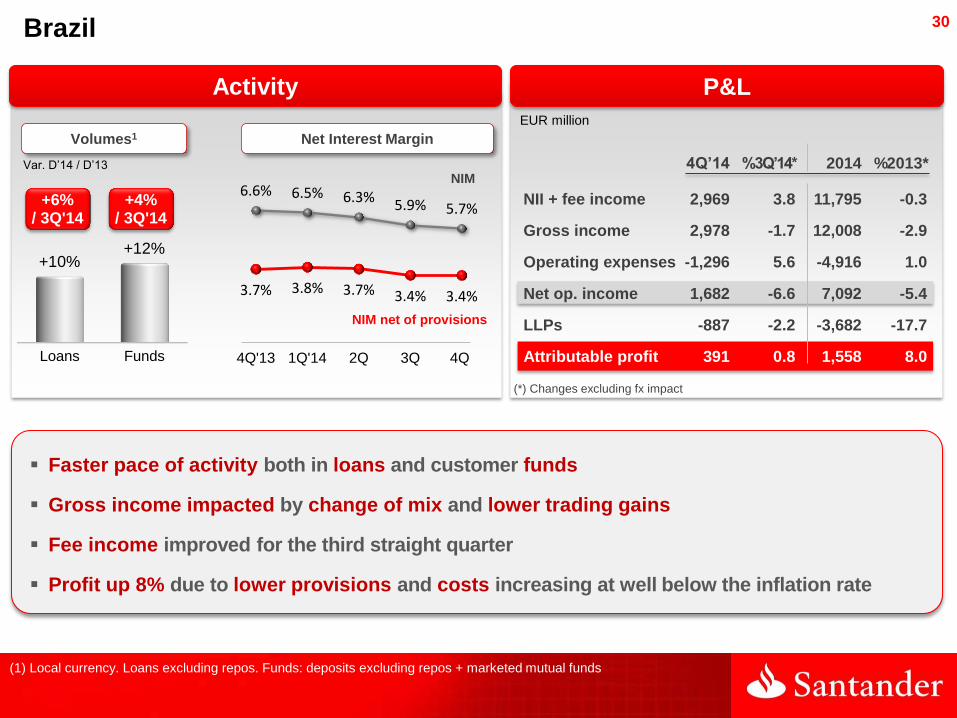
Brazil
Var. D’14 / D’13
Volumes1
Activity
Faster pace of activity both in loans and customer funds
Gross income impacted by change of mix and lower trading gains
Fee income improved for the third straight quarter
Profit up 8% due to lower provisions and costs increasing at well below the inflation rate
+6% / 3Q'14
+4% / 3Q'14
(1) Local currency. Loans excluding repos. Funds: deposits excluding repos + marketed mutual funds
EUR million
P&L
4Q’14 %3Q’14* 2014 %2013*
NII + fee income 2,969 3.8 11,795 -0.3
Gross income 2,978 -1.7 12,008 -2.9
Operating expenses -1,296 5.6 -4,916 1.0
Net op. income 1,682 -6.6 7,092 -5.4
LLPs -887 -2.2 -3,682 -17.7
Attributable profit 391 0.8 1,558 8.0
(*) Changes excluding fx impact
6.6% 6.5% 6.3% 5.9% 5.7%
3.7% 3.8% 3.7% 3.4% 3.4%
4Q'13 1Q'14 2Q 3Q 4Q
NIM net of provisions
NIM
Loans Funds
+10% +12%
Net Interest Margin

31
Brazil
(1) Other = Consumer credit, payroll lending, automobile, cards, cheques and personal loans (2) BNDES = Brazilian Development Bank
Growth in loans with change of mix and a lower risk profile …
Balances in EUR million and Dec’14 / Dec’13 change
… which reflected in credit quality
Growth in segments where we are below our natural
market share (mortgages, agribusiness, BNDES2)
Greater focus on large companies and SMEs
recovery in recent months 1Q'13 2Q 3Q 4Q 1Q'14 2Q 3Q 4Q
1,244 1,186
1,053 993
940 914 924 904 7.5%
7.1% 6.7% 6.3%
5.8% 5.4% 5.1% 4.9%
6.90 6.49
6.12
5.64 5.74 5.78 5.64
5.05
M'13 J'13 S'13 D'13 M'14 J'14 S'14 D'14
Constant EUR million
Provisions and cost of credit
Net loan-loss provisions Cost of credit
NPL ratio (%)
Mortgages Otherindividuals
SMEs Corporates Largecorporates
6,744
26,706
11,646 13,115
20,263
1
+34% -3% 0% +32% +13%

32
Agenda
■ Group performance 2014
■ Business areas performance 2014
■ Outlook
■ Appendix

33 Outlook
Good dynamics in results and volumes
at year-end 2014
All core units grew
profit before tax (10/10) and loans (9/10)
Comfortable liquidity and capital position,
with no restrictions to grow
Focal points: organic growth and a more
efficient use of capital
Risk management continues
to be reinforced
Developing the Wide Risk Management
Programme
Ongoing actions to increase customer
linkage and satisfaction
All units aim to grow linked and
transactional customers
Measures underway to drive
operating excellence
Enhance team performance, streamline processes and improve customer service
Ambitious targets in the medium-term in key management variables
Financial
Non-financial

34 Our financial targets in the medium-term
Loans
2014 2017
targets
+5% Above peers*
Efficiency ratio 47% < 45%
NPL ratio 5.19% < 5%
CET1 fully-loaded 9.7% 10-11%
RoTE 11% 12-14%
EPS growth +24% Above peers*
Growth
Operating excellence
Risk management
Capital
Profitability
(*) Wells Fargo, JPMorgan Chase, Citi, Bank of America, HSBC, BNP Paribas, UniCredit, Deutsche Bank, Banca Intesa, BBVA, ING, Société Genérale, Lloyds Bank, Barclays, Standard Chartered, UBS, Itaú

35
Agenda
■ Group performance 2014
■ Business areas performance 2014
■ Outlook
■ Appendix

36
Group balance sheet
Appendix
Liquidity and funding
Global segments results
NPL and coverage ratios, and cost of credit
Spreads
Quarterly income statements
Other geographic units results

37
Other geographic units results

38
Activity
Santander Consumer Finance – Continental Europe
Volumes
Nota: Not including Santander Consumer UK profit, as it is recorded in Santander UK results. If included, attributable profit in 4Q’14: EUR 292 mill. (+49%); 2014: EUR 1,004 mill. (+12% y-o-y)
Gross loans New loans
+9%
+14%
EUR million
P&L
Var. D’14 / D’13
+4% / 3Q'14
-2% / 3Q'14
Double-digit growth in new lending enabled market share gain
In the area as a whole: management of spreads, costs control and lower cost of credit
The main units improved their profit in 2014
GE Nordics integration in 4Q and joint-venture with PSA in 2015 to promote business
3.3% 3.3% 3.5% 3.5%
3.7%
2.7% 2.6% 2.8% 2.7%
2.9%
4Q'13 1Q'14 2Q 3Q 4Q
4Q’14 %3Q’14 2014 %2013
NII + fee income 850 3.4 3,294 5.6
Gross income 862 5.0 3,309 6.4
Operating expenses -376 6.3 -1,452 4.4
Net op. income 486 4.0 1,857 8.0
LLPs -143 -4.3 -544 -3.7
Attributable profit 265 56.1 891 12.3
NIM
Net Interest Margin
NIM net of provisions

39
P&L
1.70% 1.72% 1.69% 1.36%
0.96%
4Q'13 1Q'14 2Q 3Q 4Q
Activity
Portugal
Sharp deposit capturing with lower cost of funding and market share gain
Profit continues to normalise (+65% y-o-y) backed by provisions
Good performance of net interest income (+6% y-o-y) and costs control
Var. D’14 / D’13
(1) Loans excluding repos. Funds: deposits excluding repos + marketed mutual funds
Loans Funds
-5%
+5%
-1% / 3Q'14
-0.3% / 3Q'14
EUR million
4Q’14 %3Q’14 2014 %2013
NII + fee income 215 4.3 826 -0.6
Gross income 261 13.4 956 4.3
Operating expenses -126 3.5 -491 -0.9
Net op. income 135 24.6 465 10.5
LLPs -17 -45.7 -124 -35.7
Attributable profit 73 74.5 189 65.1
Volumes1 Cost of new term deposits

40
Activity
Poland
Var. D’14 / D’13
1.69% 1.69% 1.56%
1.64% 1.67%
4Q'13 1Q'14 2Q 3Q 4Q
(1) Local currency. Loans excluding repos. Funds: deposits excluding repos + marketed mutual funds
The rise in loans and deposits underscored the success of the business strategy
Of note was the commercial revenues growth (+7.2% y-o-y) and costs control (-2.2%)
PBT: +12% in 2014. Attributable profit impacted by higher taxes and minority interests
Loans Funds
+7%
+10%
+0.4% / 3Q'14
+1% / 3Q'14
P&L
EUR million
(*) Changes excluding fx impact
4Q’14 %3Q’14* 2014 %2013*
NII + fee income 302 -5.5 1,269 7.2
Gross income 353 6.2 1,376 4.1
Operating expenses -143 0.9 -581 -2.2
Net op. income 210 10.1 795 9.3
LLPs -57 29.4 -186 10.5
Attributable profit 94 3.4 358 6.9
Volumes1 Stock deposit cost
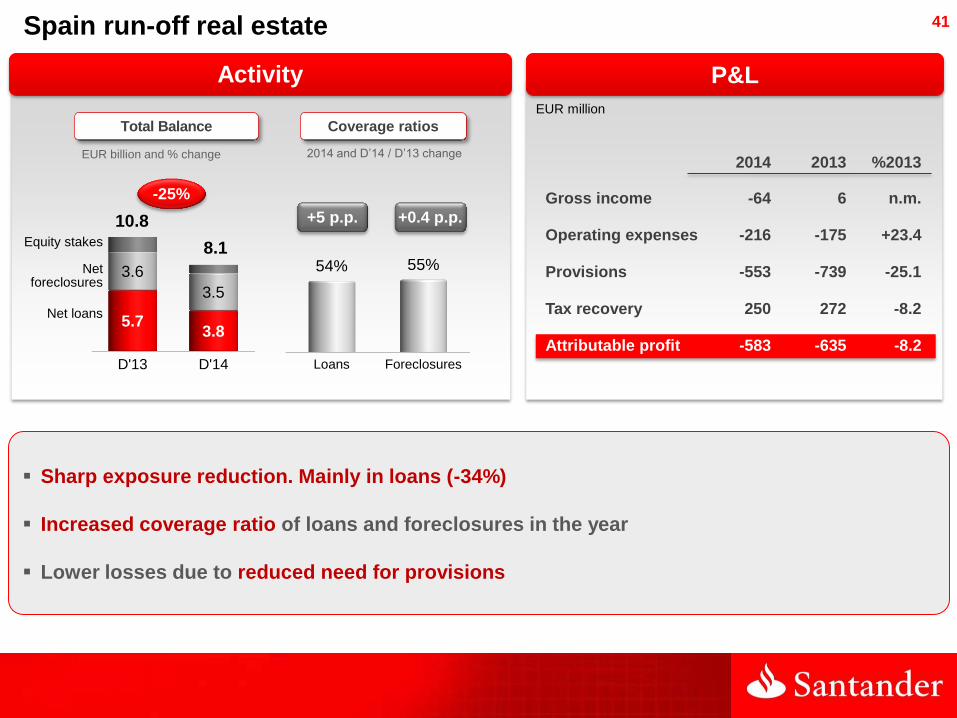
41
Activity
EUR billion and % change
Total Balance Coverage ratios
2014 and D’14 / D’13 change
+0.4 p.p.
EUR million
P&L
2014 2013 %2013
Gross income -64 6 n.m.
Operating expenses -216 -175 +23.4
Provisions -553 -739 -25.1
Tax recovery 250 272 -8.2
Attributable profit -583 -635 -8.2 Loans Foreclosures
54% 55%
+5 p.p.
Sharp exposure reduction. Mainly in loans (-34%)
Increased coverage ratio of loans and foreclosures in the year
Lower losses due to reduced need for provisions
Spain run-off real estate
D'13 D'14
5.7 3.8
3.6
3.5
10.8
8.1
-25%
Net foreclosures
Net loans
Equity stakes

42
Activity
USA
Loans Funds
+1%
+7%
Var. D’14 / D’13
Santander Bank1 SCUSA
Var. D’14 / D’13
(1) Local currency. Loans excluding repos. Funds: deposits excluding repos + marketed mutual funds.
(2) Excluding sale of portfolios and securitisations: +6%
+1% / 3Q'14
+2% / 3Q'14
-17% / 3Q'14
US$ million
P&L
4Q’14 %3Q’14 2014 %2013
NII + fee income 1,742 -2.9 7,063 11.5
Gross income 1,898 -1.7 7,483 16.0
Operating expenses -709 3.7 -2,694 7.6
Net op. income 1,189 -4.7 4,789 21.3
LLPs -718 -11.5 -2,961 46.8
Attributable profit 314 21.3 1,061 -0.2 2
Gross loans New loans
+13%
+25%
+4% / 3Q'14
In activity, SCUSA increased new lending and servicing. Business growth in Santander Bank
Attributable profit virtually unchanged from previous year. Profit before minority interests up 4%
Increased gross income offset the higher costs (regulatory costs and franchise) and provisions
Measures to optimise Santander Bank's balance sheet in order to improve profitability ratios

43
Mexico
Expansion plan resulted in y-o-y market share gain in loans and demand deposits
Higher commercial revenues absorbed interest rates at their lowest levels and change of mix
Profit affected in the year-on-year comparison due to the higher tax rate (from 8% to 20%)
Loans Funds
+18%
+13%
Var. D’14 / D’13
Volumes1
Activity
+5% / 3Q'14
+5% / 3Q'14
(1) Local currency. Loans excluding repos. Funds: deposits excluding repos + marketed mutual funds.
P&L
4Q’14 %3Q’14* 2014 %2013*
NII + fee income 781 3.5 2,953 6.0
Gross income 793 0.0 3,072 6.0
Operating expenses -322 0.6 -1,260 7.2
Net op. income 471 -0.5 1,812 5.2
LLPs -177 -16.3 -756 -1.6
PBT 293 9.4 1,057 8.9
Attributable profit 186 10.8 660 -3.5
EUR million
(*) Changes excluding fx impact
4.4% 4.1% 4.0% 4.0% 4.0%
2.6% 2.7% 2.5% 2.5% 2.8%
4Q'13 1Q'14 2Q 3Q 4Q
NIM
Net Interest Margin
NIM net of provisions

44
P&L
Chile
Growth in target segments: loans to companies (+8%), high-income (+16%) and demand deposits (+16%)
Solid profit underscored by commercial revenues (higher volumes and lower cost of funding)
Moreover, higher inflation rate and lower taxes (tax reform) put profit at its highest level
Loans Funds
+8%
+17%
Var. D’14 / D’13
Volumes1
Activity
+3% / 3Q'14
+7% / 3Q'14
(1) Local currency. Loans excluding repos. Funds: deposits excluding repos + marketed mutual funds.
4Q’14 %3Q’14* 2014 %2013*
NII + fee income 577 20.1 2,063 15.0
Gross income 608 17.8 2,197 12.6
Operating expenses -226 2.0 -854 6.3
Net op. income 382 29.6 1,343 17.0
LLPs -156 16.6 -521 0.5
Attributable profit 162 71.7 509 34.8
EUR million
(*) Changes excluding fx impact
4.4% 4.3% 4.7%
4.0% 4.7%
2.9% 3.0% 3.5%
2.6% 3.2%
4Q'13 1Q'14 2Q 3Q 4Q
NIM
Net Interest Margin
NIM net of provisions

45
Other Latin American countries
Focus on linkage, transactional business and target segments
Volumes grew at double-digit rates
P&L driven by higher gross income
Argentina
Constant EUR million
Attributable profit
Uruguay Peru
2013 2014
223
298
2013 2014
47 54
2013 2014
18 24
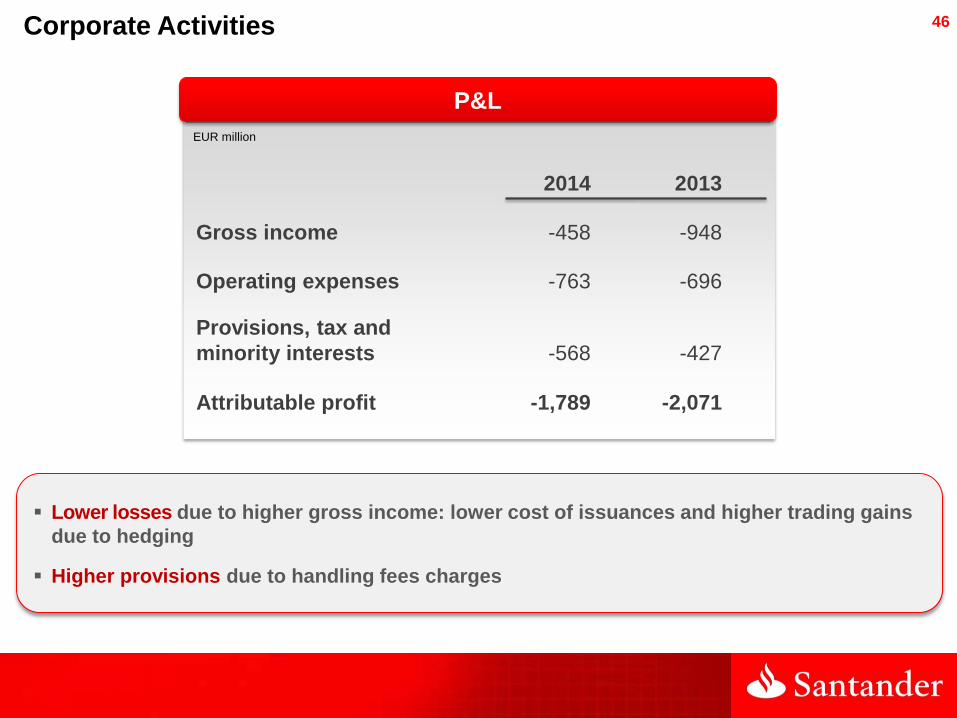
46 Corporate Activities
Lower losses due to higher gross income: lower cost of issuances and higher trading gains
due to hedging
Higher provisions due to handling fees charges
P&L
2014 2013
Gross income -458 -948
Operating expenses -763 -696
Provisions, tax and
minority interests -568 -427
Attributable profit -1,789 -2,071
EUR million
47
Global segments P&L

48
Retail Banking
Activity
EUR million
P&L
Excluding exchange rate impact:
- Recovery of net interest income + fee
income (+6% / 2013)
- Costs rose at below the inflation rate
- Provisions: lower year-on-year
EUR billion
2013 2014
584
630 +8%*
2013 2014
508 522
+3%*
EUR million
1Q'13 2Q 3Q 4Q 1Q'14 2Q 3Q 4Q
9,279 9,414 8,847 8,803 8,707 9,041 9,299 9,583
Gross income
Net loans Deposits
(*) -1% excluding FX impact (*) +4% excluding FX impact
4Q’14 %3Q’14* 2014 %2013*
NII + fee income 9,383 3.1 36,194 6.2
Gross income 9,583 3.5 36,631 5.2
Operating expenses -4,363 4.2 -16,659 2.2
Net op. income 5,220 2.9 19,972 7.9
LLPs -2,295 -10.9 -9,736 -5.9
Attributable profit 1,784 28.1 5,870 26.4
(*) Changes excluding fx impact

49 Consumer Business
Includes Continental Europe, United Kingdom and USA (SCUSA)
Basic data
Gross loans (Dec’14): EUR 91 bill.
2014 Attributable profit: EUR 1,367 mill.
ContinentalEurope
UK
USA (SCUSA)
64
5
23
ContinentalEurope
UK
USA (SCUSA)
891
113
363
91,481
19.2
157,000
14
67
(1) Market share of new auto-lending and/or durable goods loans
Top 31 in 12 countries
30,847
1,367
EUR billion
EUR million
Countries
EUR million in 2014 attributable profit
Agreements with manufacturers
for "captive" financing
EUR million in loans
Dealers-participants
EUR million in deposits
Million customers
50
1,777 1,737
1,044 1,165
1,750 1,535
516 559
5,088 4,997
2013 2014
1Q'13 2Q 3Q 4Q 1Q'14 2Q 3Q 4Q
1,253 1,057 1,169 1,092 1,168 1,174 1,049 1,047
1,371
1,196 1,306
1,214 1,298 1,335
1,284 1,079
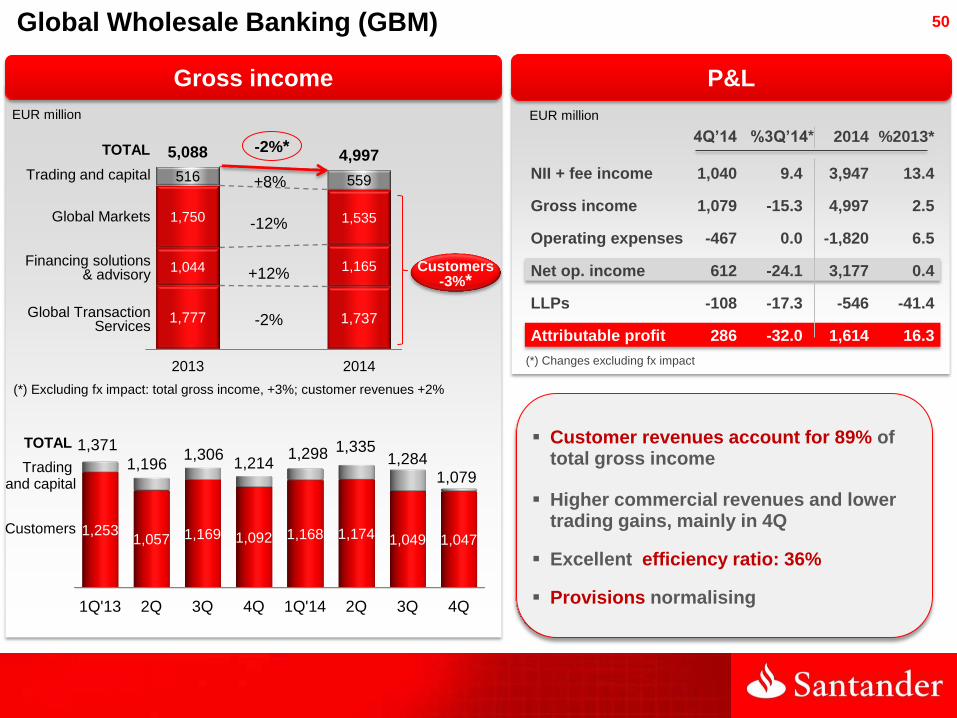
Global Wholesale Banking (GBM)
EUR million
-2%*
-2%
-12%
+8%
TOTAL
+12%
TOTAL
Gross income
Customers -3%*
(*) Excluding fx impact: total gross income, +3%; customer revenues +2%
P&L
4Q’14 %3Q’14* 2014 %2013*
NII + fee income 1,040 9.4 3,947 13.4
Gross income 1,079 -15.3 4,997 2.5
Operating expenses -467 0.0 -1,820 6.5
Net op. income 612 -24.1 3,177 0.4
LLPs -108 -17.3 -546 -41.4
Attributable profit 286 -32.0 1,614 16.3
EUR million
(*) Changes excluding fx impact
Financing solutions & advisory
Global Transaction Services
Global Markets
Trading and capital
Trading and capital
Customers
Customer revenues account for 89% of total gross income
Higher commercial revenues and lower trading gains, mainly in 4Q
Excellent efficiency ratio: 36%
Provisions normalising
51
EUR million
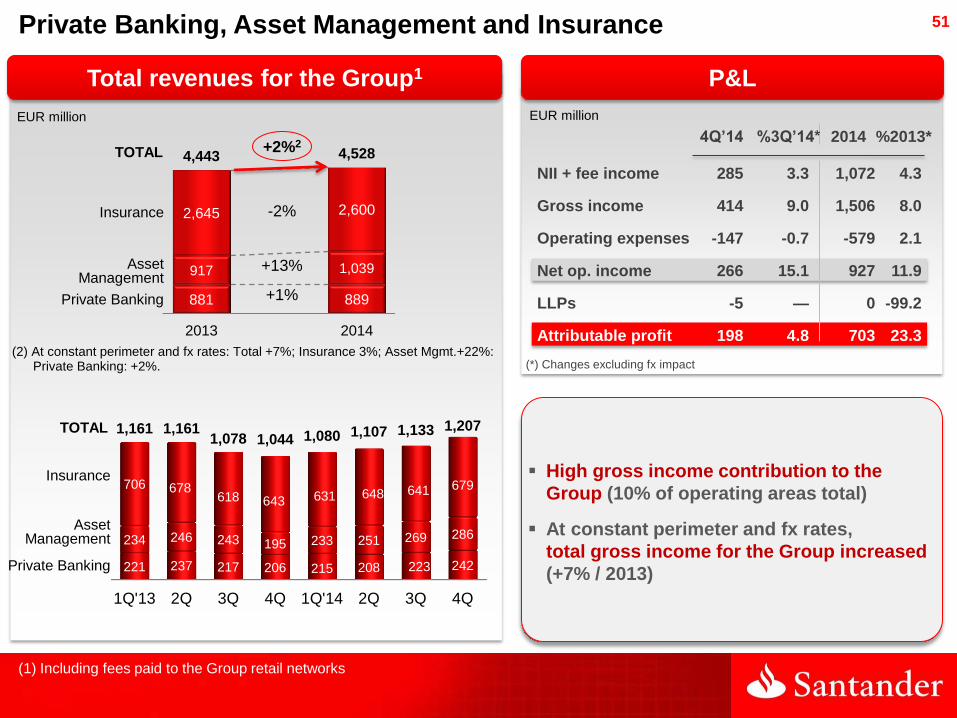
Private Banking, Asset Management and Insurance
EUR million
TOTAL
TOTAL
Total revenues for the Group1 P&L
(1) Including fees paid to the Group retail networks
4Q’14 %3Q’14* 2014 %2013*
NII + fee income 285 3.3 1,072 4.3
Gross income 414 9.0 1,506 8.0
Operating expenses -147 -0.7 -579 2.1
Net op. income 266 15.1 927 11.9
LLPs -5 — 0 -99.2
Attributable profit 198 4.8 703 23.3
(*) Changes excluding fx impact
Private Banking
Insurance
Asset Management
Private Banking
Asset Management
Insurance
High gross income contribution to the
Group (10% of operating areas total)
At constant perimeter and fx rates,
total gross income for the Group increased
(+7% / 2013)
881 889
917 1,039
2,645 2,600
4,443 4,528
2013 2014
+2%2
+1%
-2%
+13%
(2) At constant perimeter and fx rates: Total +7%; Insurance 3%; Asset Mgmt.+22%: Private Banking: +2%.
1Q'13 2Q 3Q 4Q 1Q'14 2Q 3Q 4Q
221 237 217 206 215 208 223 242
234 246 243 195 233 251 269 286
706 678 618 643 631 648 641 679
1,161 1,161 1,078 1,044 1,080 1,107 1,133 1,207

52
Group balance sheet

53
Highlights of the Group balance sheet
Lending: 58% of balance sheet
Derivatives (with counterparty on the liabilities side): 7% of balance sheet
Cash, central banks and credit institutions: 13%
Other (goodwill, fixed assets, accruals): 9%
Available for sale portfolio (AFS): 8%
Trading portfolio: 5%
1
3
2
4
5
6
(*) Other assets: Goodwill EUR 28 bill., tangible and intangible assets EUR 26 bill., other capital instruments at fair value EUR 1 bill., accruals and other accounts EUR 58 bill.
Retail balance sheet, appropriate for a low risk business model, liquid and well capitalised
Balance sheet at December 2014
EUR billion
Trading portfolio
Assets Liabilities
735
106
113
214
67
648
98 39
84 104
169 155
1,266 1,266
Other*
Net loans to
customers
Derivatives
Cash and credit institutions
AFS portfolio
1
6
5
4
3
2
Customer deposits
Issues and subordinated
liabilities
Credit institutions
Other
Derivatives
Shareholders’ equity & fixed liabilities

54
Liquidity and funding

55
Liquidity and funding
Structural liquidity1 surplus:
EUR 153 bill. (15% net liabilities)
Commercial Gap: EUR 87 bill.
Well-funded balance sheet with high structural liquidity surplus
December 2014. EUR billion
Santander Group liquidity balance sheet
Note: Liquidity balance sheet for management purposes (net of trading derivatives and interbank balances). Provisional
(1) Financial assets – short term wholesale funding markets
Assets Liabilities
174
21
83
120
735
140
63
648 Net loans to
customers
Deposits
M/L term funding
Financial assets Equity (90) and
other (30)
Securitisations
Fixed assets & other
ST Funding

56
Adequate liquidity structure of stand-alone units
Liquidity and funding
December 2014
Main units and liquidity ratios
LTD ratio Deposits + M/L term funding /
(net loans / deposits) net loans
Spain 88% 155%
Portugal 97% 115%
Santander Consumer Finance 196% 73%
Poland 84% 122%
UK 124% 107%
Brazil 109% 121%
Mexico 90% 117%
Chile 131% 99%
Argentina 81% 125%
USA 144% 106%
Total Group 113% 116%
57
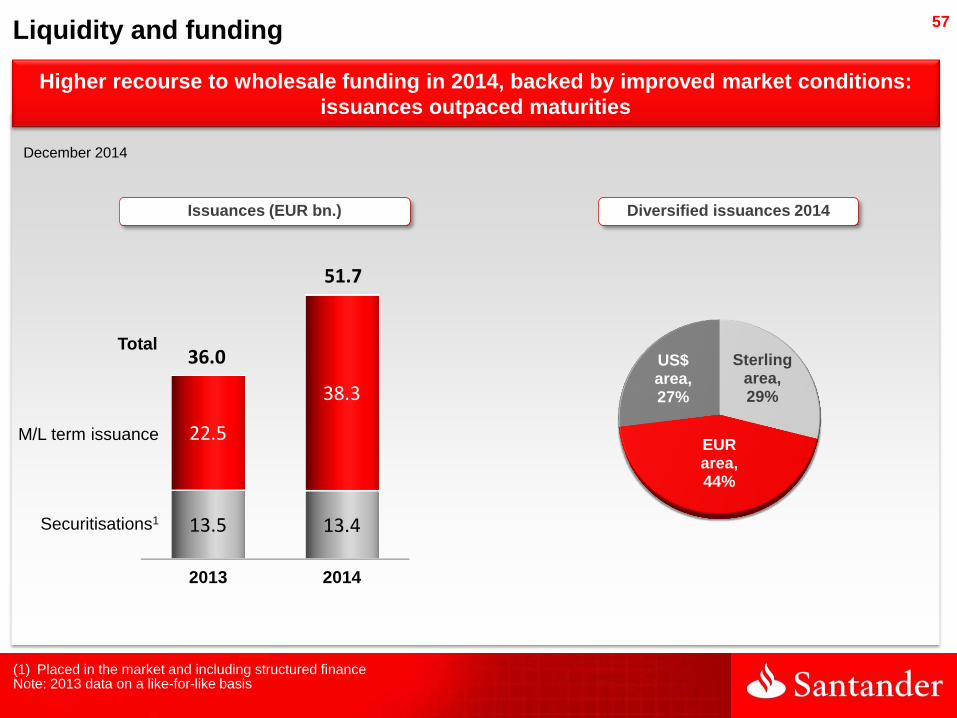
Liquidity and funding
December 2014
Sterling area, 29%
EUR area, 44%
US$ area, 27%
Total
(1) Placed in the market and including structured finance Note: 2013 data on a like-for-like basis
2013 2014
13.5 13.4
22.5
38.3
36.0
51.7
Higher recourse to wholesale funding in 2014, backed by improved market conditions:
issuances outpaced maturities
Diversified issuances 2014 Issuances (EUR bn.)
M/L term issuance
Securitisations1

58
NPL, coverage ratios and cost of credit

59 59
NPL ratio%
31.03.13 30.06.13 30.09.13 31.12.13 31.03.14 30.06.14 30.09.14 31.12.14
Continental Europe 6.62 7.83 8.48 9.13 9.12 9.04 8.96 8.93
Spain 4.12 5.75 6.40 7.49 7.61 7.59 7.57 7.38
Portugal 6.88 7.41 7.86 8.12 8.26 8.16 8.49 8.89
Poland 7.39 8.08 7.75 7.84 7.35 7.42 7.43 7.42
Santander Consumer Finance 3.98 4.04 3.96 4.01 4.14 4.07 3.97 4.82
United Kingdom 2.03 2.01 1.98 1.98 1.88 1.91 1.80 1.79
Latin America 5.40 5.23 5.29 5.00 5.06 5.03 4.98 4.65
Brazil 6.90 6.49 6.12 5.64 5.74 5.78 5.64 5.05
Mexico 1.92 2.20 3.58 3.66 3.62 3.52 3.74 3.84
Chile 5.51 5.81 6.00 5.91 5.99 5.94 5.98 5.97
USA 3.01 2.96 3.04 3.09 2.88 2.93 2.68 2.54
Operating Areas 4.70 5.13 5.39 5.61 5.54 5.46 5.29 5.19
Total Group 4.75 5.15 5.40 5.61 5.52 5.45 5.28 5.19
60 60
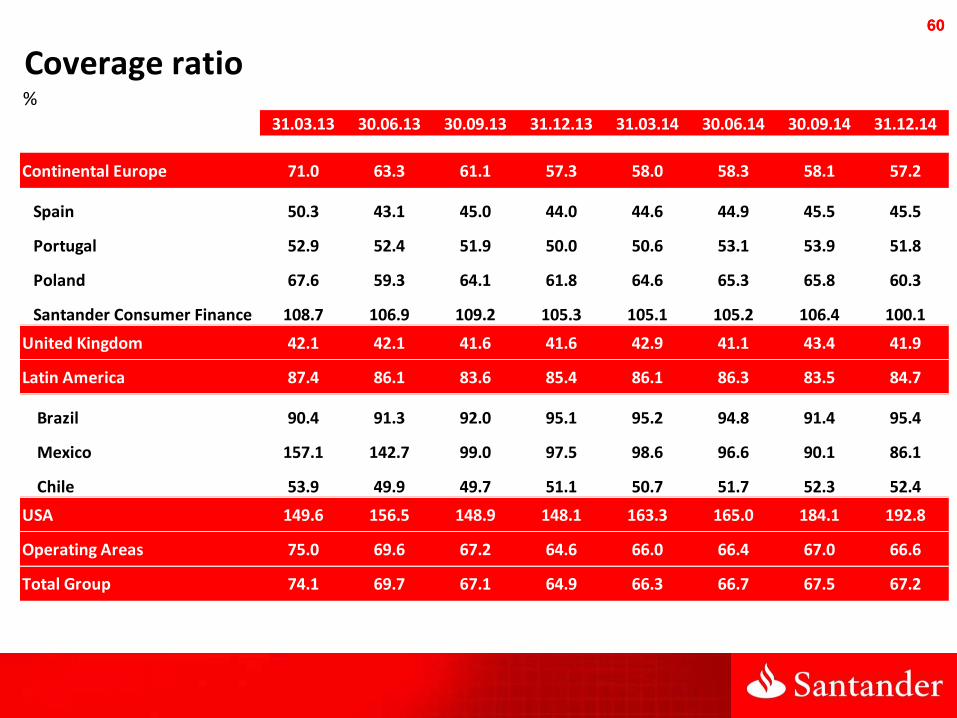
Coverage ratio%
31.03.13 30.06.13 30.09.13 31.12.13 31.03.14 30.06.14 30.09.14 31.12.14
Continental Europe 71.0 63.3 61.1 57.3 58.0 58.3 58.1 57.2
Spain 50.3 43.1 45.0 44.0 44.6 44.9 45.5 45.5
Portugal 52.9 52.4 51.9 50.0 50.6 53.1 53.9 51.8
Poland 67.6 59.3 64.1 61.8 64.6 65.3 65.8 60.3
Santander Consumer Finance 108.7 106.9 109.2 105.3 105.1 105.2 106.4 100.1
United Kingdom 42.1 42.1 41.6 41.6 42.9 41.1 43.4 41.9
Latin America 87.4 86.1 83.6 85.4 86.1 86.3 83.5 84.7
Brazil 90.4 91.3 92.0 95.1 95.2 94.8 91.4 95.4
Mexico 157.1 142.7 99.0 97.5 98.6 96.6 90.1 86.1
Chile 53.9 49.9 49.7 51.1 50.7 51.7 52.3 52.4
USA 149.6 156.5 148.9 148.1 163.3 165.0 184.1 192.8
Operating Areas 75.0 69.6 67.2 64.6 66.0 66.4 67.0 66.6
Total Group 74.1 69.7 67.1 64.9 66.3 66.7 67.5 67.2

61 61
Cost of credit %
31.03.13 30.06.13 30.09.13 31.12.13 31.03.14 30.06.14 30.09.14 31.12.14
Continental Europe 3.13 2.33 1.71 1.23 1.21 1.14 1.08 1.02
Spain 1.23 1.26 1.36 1.36 1.37 1.31 1.21 1.06
Portugal 1.18 1.10 0.93 0.73 0.63 0.55 0.47 0.50
Poland 1.22 1.18 1.09 1.01 0.98 0.92 0.95 1.04
Santander Consumer Finance 1.26 1.15 1.13 0.96 0.89 0.87 0.85 0.90
United Kingdom 0.29 0.26 0.26 0.24 0.23 0.22 0.19 0.14
Latin America 5.07 4.87 4.73 4.53 4.24 3.95 3.77 3.59
Brazil 7.46 7.07 6.72 6.34 5.82 5.38 5.14 4.91
Mexico 2.46 2.73 3.27 3.47 3.59 3.58 3.26 2.98
Chile 1.95 2.00 1.96 1.92 1.82 1.76 1.71 1.75
USA 1.89 1.95 2.17 2.48 2.94 3.15 3.40 3.45
Operating Areas 2.49 2.15 1.85 1.65 1.61 1.55 1.50 1.44
Total Group 2.45 2.14 1.89 1.69 1.65 1.56 1.52 1.43
Cost of credit = 12 month loan-loss provisions / average lending

62
Dec'14
55%
Gross risk Coverage Net Fund Risk
Non-performing 6,965 4,064 2,901
Substandard1 1,209 425 784
Foreclosed real estate 7,904 4,371 3,533
Total problematic assets 16,078 8,860 7,218
Performing loans2 101 0 101
Real estate exposure 16,179 8,860 7,319
Spain run-off real estate. Exposure and coverage ratios
Non-performing 58%
Substandard1 35%
Foreclosed real estate 55%
Total problematic assets 55%
Performing loans2 0%
Total coverage
(problematic assets + performing loans)
Coverage by borrowers' situation
(December 2014)
provisions / exposure (%) EUR Million
(1) 100% up-to-date with payments (2) Performing loans: loans up-to-date with payments
Total real estate
exposure

63
Spain run-off real estate. Loans and foreclosures
Finished buildings 3,577 4,673 -1,096
Buildings under constr. 130 614 -484
Developed land 2,641 3,124 -483
Building and other land 752 1,116 -364
Non mortgage guarantee 1,176 1,828 -652
Total 8,276 11,355 -3,079
Finished buildings 2,269 43% 1,297
Buildings under constr. 716 46% 384
Developed land 2,450 61% 967
Building land 2,414 64% 865
Other land 55 64% 20
Total 7,904 55% 3,533
LOANS with real estate purpose Foreclosed REAL ESTATE (Dec. 2014)
EUR Million EUR Million
Dec’14 Dec’13 Var. Gross
amount Coverage Net
amount

64
Spreads
65 65
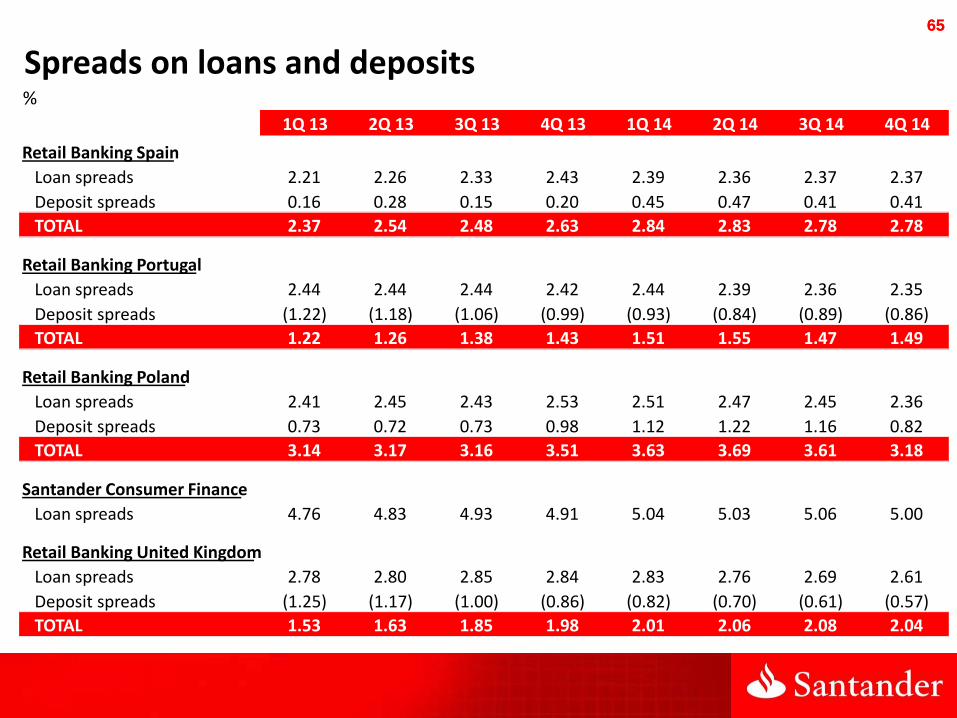
Spreads on loans and deposits %
1Q 13 2Q 13 3Q 13 4Q 13 1Q 14 2Q 14 3Q 14 4Q 14
Retail Banking Spain
Loan spreads 2.21 2.26 2.33 2.43 2.39 2.36 2.37 2.37
Deposit spreads 0.16 0.28 0.15 0.20 0.45 0.47 0.41
TOTAL 2.37 2.54 2.48 2.63 2.84 2.83 2.78
Retail Banking Portugal
Loan spreads 2.44 2.44 2.44 2.42 2.44 2.39 2.36 2.35
Deposit spreads (1.22) (1.18) (1.06) (0.99) (0.93) (0.84) (0.89) (0.86)
TOTAL 1.22 1.26 1.38 1.43 1.51 1.55 1.47 1.49
Retail Banking Poland
Loan spreads 2.41 2.45 2.43 2.53 2.51 2.47 2.45 2.36
Deposit spreads 0.73 0.72 0.73 0.98 1.12 1.22 1.16 0.82
TOTAL 3.14 3.17 3.16 3.51 3.63 3.69 3.61 3.18
Santander Consumer Finance
Loan spreads 4.76 4.83 4.93 4.91 5.04 5.03 5.06 5.00
Retail Banking United Kingdom
Loan spreads 2.78 2.80 2.85 2.84 2.83 2.76 2.69 2.61
Deposit spreads (1.25) (1.17) (1.00) (0.86) (0.82) (0.70) (0.61) (0.57)
TOTAL 1.53 1.63 1.85 1.98 2.01 2.06 2.08 2.04
0.41
2.78
66 66
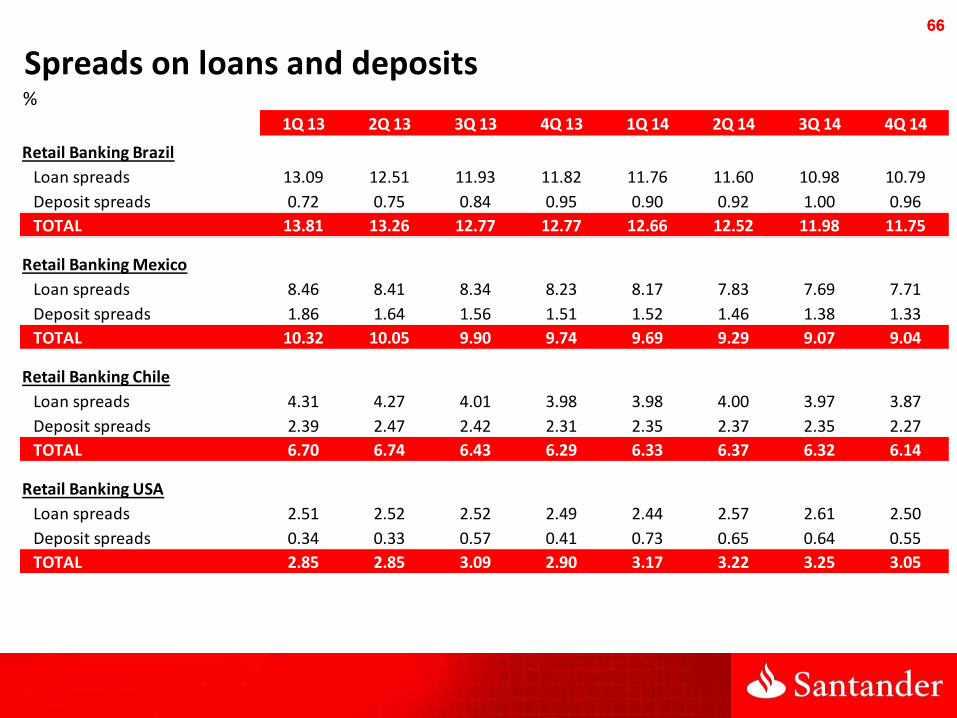
Spreads on loans and deposits%
1Q 13 2Q 13 3Q 13 4Q 13 1Q 14 2Q 14 3Q 14 4Q 14
Retail Banking Brazil
Loan spreads 13.09 12.51 11.93 11.82 11.76 11.60 10.98 10.79
Deposit spreads 0.72 0.75 0.84 0.95 0.90 0.92 1.00 0.96
TOTAL 13.81 13.26 12.77 12.77 12.66 12.52 11.98 11.75
Retail Banking Mexico
Loan spreads 8.46 8.41 8.34 8.23 8.17 7.83 7.69 7.71
Deposit spreads 1.86 1.64 1.56 1.51 1.52 1.46 1.38 1.33
TOTAL 10.32 10.05 9.90 9.74 9.69 9.29 9.07 9.04
Retail Banking Chile
Loan spreads 4.31 4.27 4.01 3.98 3.98 4.00 3.97 3.87
Deposit spreads 2.39 2.47 2.42 2.31 2.35 2.37 2.35 2.27
TOTAL 6.70 6.74 6.43 6.29 6.33 6.37 6.32 6.14
Retail Banking USA
Loan spreads 2.51 2.52 2.52 2.49 2.44 2.57 2.61 2.50
Deposit spreads 0.34 0.33 0.57 0.41 0.73 0.65 0.64 0.55
TOTAL 2.85 2.85 3.09 2.90 3.17 3.22 3.25 3.05

67
Quarterly P&L
68 68
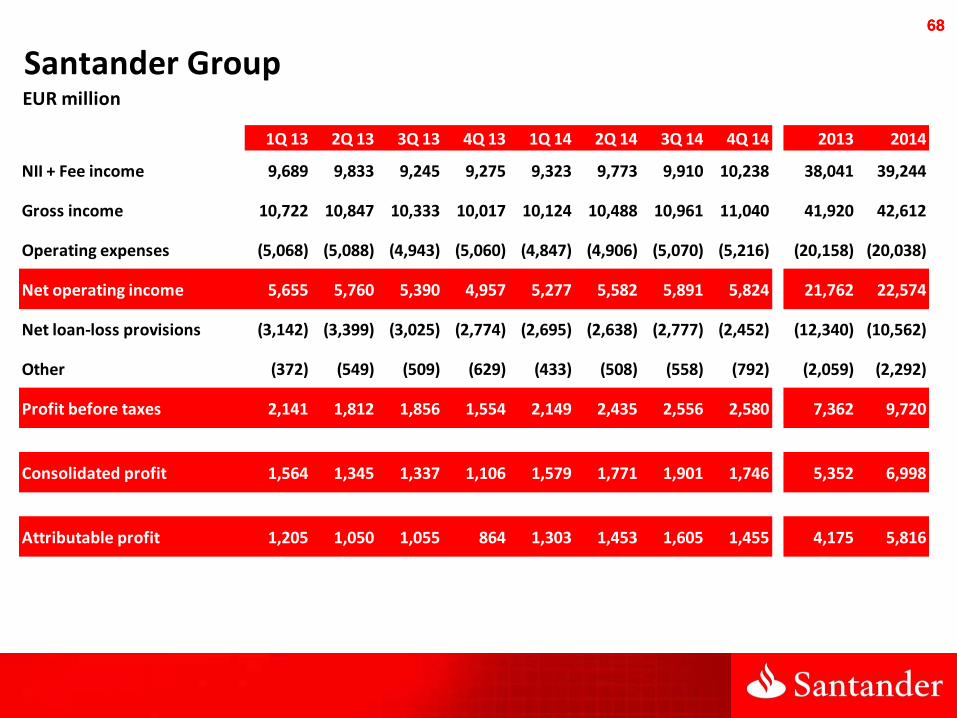
Santander GroupEUR million
1Q 13 2Q 13 3Q 13 4Q 13 1Q 14 2Q 14 3Q 14 4Q 14 2013 2014
NII + Fee income 9,689 9,833 9,245 9,275 9,323 9,773 9,910 10,238 38,041 39,244
Gross income 10,722 10,847 10,333 10,017 10,124 10,488 10,961 11,040 41,920 42,612
Operating expenses (5,068) (5,088) (4,943) (5,060) (4,847) (4,906) (5,070) (5,216) (20,158) (20,038)
Net operating income 5,655 5,760 5,390 4,957 5,277 5,582 5,891 5,824 21,762 22,574
Net loan-loss provisions (3,142) (3,399) (3,025) (2,774) (2,695) (2,638) (2,777) (2,452) (12,340) (10,562)
Other (372) (549) (509) (629) (433) (508) (558) (792) (2,059) (2,292)
Profit before taxes 2,141 1,812 1,856 1,554 2,149 2,435 2,556 2,580 7,362 9,720
Consolidated profit 1,564 1,345 1,337 1,106 1,579 1,771 1,901 1,746 5,352 6,998
Attributable profit 1,205 1,050 1,055 864 1,303 1,453 1,605 1,455 4,175 5,816

69 69
Santander GroupConstant EUR million
1Q 13 2Q 13 3Q 13 4Q 13 1Q 14 2Q 14 3Q 14 4Q 14 2013 2014
NII + Fee income 8,928 9,130 9,076 9,229 9,519 9,790 9,779 10,156 36,364 39,244
Gross income 9,913 10,122 10,136 9,969 10,324 10,509 10,829 10,951 40,140 42,612
Operating expenses (4,765) (4,801) (4,859) (5,025) (4,930) (4,916) (5,014) (5,178) (19,450) (20,038)
Net operating income 5,148 5,321 5,277 4,944 5,394 5,593 5,814 5,773 20,690 22,574
Net loan-loss provisions (2,875) (3,162) (2,982) (2,778) (2,755) (2,641) (2,741) (2,427) (11,798) (10,562)
Other (360) (532) (500) (621) (440) (507) (552) (794) (2,013) (2,292)
Profit before taxes 1,913 1,627 1,795 1,545 2,200 2,446 2,522 2,552 6,880 9,720
Consolidated profit 1,391 1,205 1,298 1,104 1,617 1,779 1,876 1,725 4,998 6,998
Attributable profit 1,068 938 1,024 863 1,334 1,461 1,585 1,437 3,894 5,816

70 70
Continental EuropeEUR million
1Q 13 2Q 13 3Q 13 4Q 13 1Q 14 2Q 14 3Q 14 4Q 14 2013 2014
NII + Fee income 2,878 2,950 2,859 2,841 2,973 3,077 3,013 3,123 11,527 12,185
Gross income 3,171 3,163 3,152 2,979 3,196 3,256 3,139 3,231 12,465 12,822
Operating expenses (1,651) (1,619) (1,607) (1,618) (1,607) (1,582) (1,557) (1,591) (6,495) (6,337)
Net operating income 1,520 1,543 1,545 1,361 1,589 1,673 1,582 1,640 5,969 6,485
Net loan-loss provisions (901) (993) (946) (763) (791) (770) (737) (582) (3,603) (2,880)
Other (192) (194) (188) (185) (152) (196) (151) (77) (759) (576)
Profit before taxes 427 356 411 413 647 707 694 981 1,607 3,030
Consolidated profit 331 290 327 301 499 536 518 693 1,250 2,247
Attributable profit 303 248 283 282 463 499 472 644 1,115 2,078
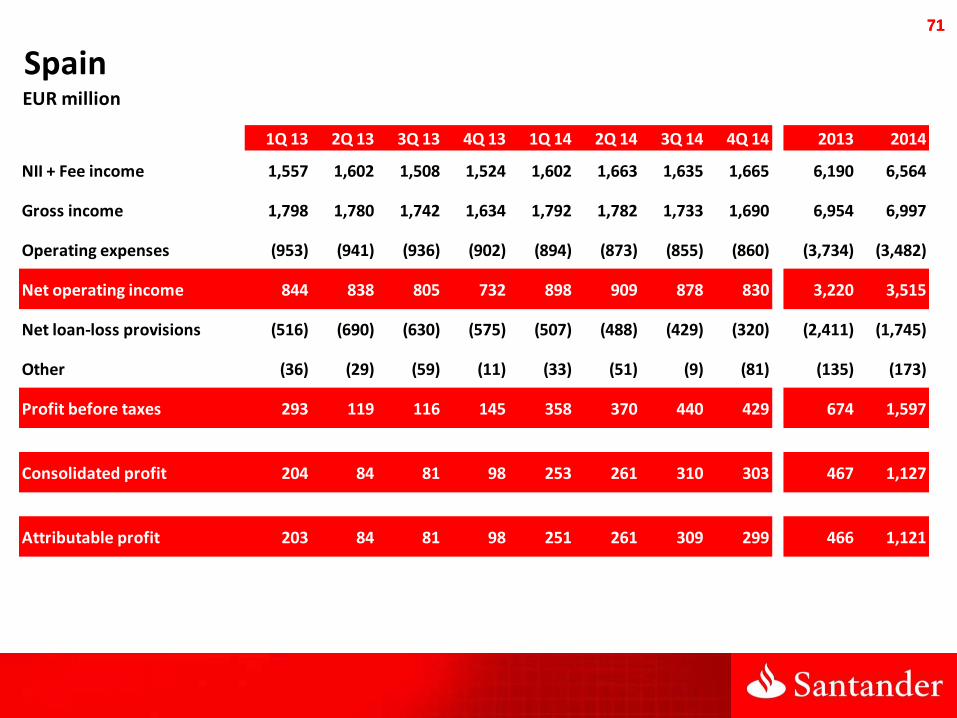
71 71
SpainEUR million
1Q 13 2Q 13 3Q 13 4Q 13 1Q 14 2Q 14 3Q 14 4Q 14 2013 2014
NII + Fee income 1,557 1,602 1,508 1,524 1,602 1,663 1,635 1,665 6,190 6,564
Gross income 1,798 1,780 1,742 1,634 1,792 1,782 1,733 1,690 6,954 6,997
Operating expenses (953) (941) (936) (902) (894) (873) (855) (860) (3,734) (3,482)
Net operating income 844 838 805 732 898 909 878 830 3,220 3,515
Net loan-loss provisions (516) (690) (630) (575) (507) (488) (429) (320) (2,411) (1,745)
Other (36) (29) (59) (11) (33) (51) (9) (81) (135) (173)
Profit before taxes 293 119 116 145 358 370 440 429 674 1,597
Consolidated profit 204 84 81 98 253 261 310 303 467 1,127
Attributable profit 203 84 81 98 251 261 309 299 466 1,121

72 72
PortugalEUR million
1Q 13 2Q 13 3Q 13 4Q 13 1Q 14 2Q 14 3Q 14 4Q 14 2013 2014
NII + Fee income 202 221 211 198 202 204 206 215 832 826
Gross income 231 233 228 224 228 237 230 261 916 956
Operating expenses (124) (122) (123) (126) (122) (121) (122) (126) (495) (491)
Net operating income 107 112 105 97 106 116 108 135 421 465
Net loan-loss provisions (64) (62) (56) (11) (34) (40) (32) (17) (192) (124)
Other (13) (17) (6) (42) (30) (29) (20) (20) (78) (99)
Profit before taxes 31 32 44 44 42 47 57 97 150 243
Consolidated profit 21 25 32 29 33 37 42 73 106 185
Attributable profit 21 25 32 37 36 39 42 73 114 189

73 73
PolandEUR million
1Q 13 2Q 13 3Q 13 4Q 13 1Q 14 2Q 14 3Q 14 4Q 14 2013 2014
NII + Fee income 278 290 302 310 317 328 322 302 1,180 1,269
Gross income 315 337 342 323 334 353 335 353 1,317 1,376
Operating expenses (156) (142) (136) (159) (147) (148) (143) (143) (592) (581)
Net operating income 159 195 206 165 188 205 192 210 725 795
Net loan-loss provisions (42) (51) (35) (39) (43) (42) (44) (57) (167) (186)
Other (5) 6 (2) (4) (3) (16) 8 22 (6) 11
Profit before taxes 112 149 169 121 142 147 156 175 552 620
Consolidated profit 90 123 135 96 115 120 122 127 445 485
Attributable profit 70 91 100 72 85 88 91 94 334 358

74 74
PolandConstant EUR million
1Q 13 2Q 13 3Q 13 4Q 13 1Q 14 2Q 14 3Q 14 4Q 14 2013 2014
NII + Fee income 276 291 306 310 317 327 321 304 1,183 1,269
Gross income 313 337 348 323 334 351 335 355 1,321 1,376
Operating expenses (155) (142) (139) (159) (147) (147) (143) (144) (594) (581)
Net operating income 158 195 209 165 188 204 192 211 727 795
Net loan-loss provisions (42) (52) (36) (39) (43) (42) (44) (57) (168) (186)
Other (5) 6 (2) (4) (3) (16) 8 22 (6) 11
Profit before taxes 111 150 171 121 142 147 155 176 553 620
Consolidated profit 90 123 137 96 115 119 122 128 446 485
Attributable profit 70 91 101 72 85 87 91 94 335 358

75 75
Santander Consumer FinanceEUR million
1Q 13 2Q 13 3Q 13 4Q 13 1Q 14 2Q 14 3Q 14 4Q 14 2013 2014
NII + Fee income 779 779 799 762 800 822 822 850 3,120 3,294
Gross income 776 775 801 759 800 827 821 862 3,111 3,309
Operating expenses (351) (341) (345) (353) (366) (357) (354) (376) (1,391) (1,452)
Net operating income 425 434 456 405 434 470 467 486 1,720 1,857
Net loan-loss provisions (171) (131) (158) (105) (130) (123) (149) (143) (565) (544)
Other (21) (29) (15) (5) (14) (17) (71) 65 (70) (37)
Profit before taxes 233 274 283 295 291 330 247 408 1,085 1,277
Consolidated profit 184 210 217 213 225 245 184 277 824 930
Attributable profit 176 201 208 209 219 237 170 265 794 891

76 76
United KingdomGBP million
1Q 13 2Q 13 3Q 13 4Q 13 1Q 14 2Q 14 3Q 14 4Q 14 2013 2014
NII + Fee income 896 906 956 1,014 1,023 1,045 1,070 1,101 3,772 4,240
Gross income 973 1,048 1,022 1,100 1,100 1,105 1,124 1,136 4,144 4,464
Operating expenses (560) (567) (538) (547) (574) (571) (579) (604) (2,212) (2,329)
Net operating income 413 481 484 553 526 533 545 532 1,932 2,136
Net loan-loss provisions (137) (103) (132) (121) (99) (71) (70) (27) (493) (268)
Other (35) (87) (22) (55) (38) (51) (58) (108) (200) (256)
Profit before taxes 241 291 330 377 388 411 417 396 1,239 1,612
Consolidated profit 191 224 261 301 311 325 326 308 976 1,270
Attributable profit 191 224 261 301 311 325 326 308 976 1,270

77 77
United StatesUSD million
1Q 13 2Q 13 3Q 13 4Q 13 1Q 14 2Q 14 3Q 14 4Q 14 2013 2014
NII + Fee income 1,488 1,558 1,631 1,658 1,728 1,798 1,794 1,742 6,334 7,063
Gross income 1,538 1,573 1,622 1,721 1,789 1,864 1,931 1,898 6,454 7,483
Operating expenses (586) (605) (637) (676) (652) (649) (684) (709) (2,504) (2,694)
Net operating income 952 968 985 1,045 1,137 1,215 1,248 1,189 3,949 4,789
Net loan-loss provisions (337) (462) (561) (657) (749) (684) (811) (718) (2,018) (2,961)
Other (14) (24) (38) (37) (3) (4) (19) 40 (113) 14
Profit before taxes 601 481 386 351 385 527 418 512 1,819 1,842
Consolidated profit 413 349 288 244 276 362 324 390 1,294 1,352
Attributable profit 333 292 233 206 216 272 259 314 1,063 1,061

78 78
BrazilEUR million
1Q 13 2Q 13 3Q 13 4Q 13 1Q 14 2Q 14 3Q 14 4Q 14 2013 2014
NII + Fee income 3,563 3,484 2,899 2,992 2,828 2,979 3,018 2,969 12,937 11,795
Gross income 3,781 3,552 3,115 3,070 2,851 2,986 3,192 2,978 13,518 12,008
Operating expenses (1,359) (1,356) (1,263) (1,346) (1,133) (1,196) (1,291) (1,296) (5,324) (4,916)
Net operating income 2,422 2,196 1,852 1,724 1,719 1,791 1,900 1,682 8,194 7,092
Net loan-loss provisions (1,471) (1,372) (1,065) (985) (905) (933) (958) (887) (4,894) (3,682)
Other (78) (133) (126) (162) (143) (166) (253) (244) (499) (805)
Profit before taxes 873 691 661 577 671 693 689 551 2,802 2,604
Consolidated profit 652 525 469 392 469 504 520 433 2,039 1,926
Attributable profit 499 420 358 301 364 395 409 391 1,577 1,558

79 79
BrazilConstant EUR million
1Q 13 2Q 13 3Q 13 4Q 13 1Q 14 2Q 14 3Q 14 4Q 14 2013 2014
NII + Fee income 3,011 3,009 2,843 2,969 2,938 2,922 2,912 3,023 11,832 11,795
Gross income 3,196 3,069 3,045 3,053 2,962 2,929 3,084 3,033 12,363 12,008
Operating expenses (1,149) (1,171) (1,225) (1,324) (1,177) (1,173) (1,248) (1,318) (4,869) (4,916)
Net operating income 2,047 1,898 1,820 1,729 1,785 1,756 1,836 1,715 7,494 7,092
Net loan-loss provisions (1,244) (1,186) (1,053) (993) (940) (914) (924) (904) (4,476) (3,682)
Other (66) (114) (120) (156) (148) (163) (247) (248) (456) (805)
Profit before taxes 738 598 647 579 698 679 665 563 2,562 2,604
Consolidated profit 551 455 461 397 487 495 502 442 1,864 1,926
Attributable profit 421 363 353 305 378 387 395 398 1,443 1,558

80 80
MexicoEUR million
1Q 13 2Q 13 3Q 13 4Q 13 1Q 14 2Q 14 3Q 14 4Q 14 2013 2014
NII + Fee income 725 730 730 718 699 720 752 781 2,903 2,953
Gross income 770 795 751 705 713 775 791 793 3,021 3,072
Operating expenses (299) (304) (307) (315) (307) (312) (319) (322) (1,225) (1,260)
Net operating income 472 490 444 390 407 463 471 471 1,796 1,812
Net loan-loss provisions (142) (184) (257) (218) (179) (191) (210) (177) (801) (756)
Other 26 (2) (3) (4) (2) (2) 6 (1) 17 2
Profit before taxes 355 305 184 168 226 271 267 293 1,012 1,057
Consolidated profit 315 263 162 193 178 214 217 242 933 851
Attributable profit 241 199 123 149 138 169 167 186 713 660

81 81
MexicoConstant EUR million
1Q 13 2Q 13 3Q 13 4Q 13 1Q 14 2Q 14 3Q 14 4Q 14 2013 2014
NII + Fee income 686 672 707 721 718 727 741 767 2,785 2,953
Gross income 729 732 728 709 733 783 778 778 2,898 3,072
Operating expenses (283) (280) (297) (315) (315) (315) (314) (316) (1,175) (1,260)
Net operating income 446 452 431 394 418 468 464 462 1,723 1,812
Net loan-loss provisions (134) (170) (247) (218) (183) (193) (207) (173) (768) (756)
Other 24 (2) (3) (3) (2) (2) 6 (1) 17 2
Profit before taxes 336 280 181 174 233 274 263 288 971 1,057
Consolidated profit 298 241 160 196 183 217 214 238 895 851
Attributable profit 228 183 122 151 142 171 165 183 684 660
228 183 122 151 142 171 165 183 684 660

82 82
ChileEUR million
1Q 13 2Q 13 3Q 13 4Q 13 1Q 14 2Q 14 3Q 14 4Q 14 2013 2014
NII + Fee income 512 502 533 521 489 526 470 577 2,067 2,063
Gross income 550 560 573 566 533 551 505 608 2,249 2,197
Operating expenses (232) (245) (231) (218) (201) (210) (217) (226) (926) (854)
Net operating income 319 314 342 348 332 341 288 382 1,322 1,343
Net loan-loss provisions (155) (147) (153) (142) (116) (118) (131) (156) (597) (521)
Other (1) 3 6 (4) (7) (3) 3 (18) 4 (24)
Profit before taxes 163 170 194 203 209 220 160 209 730 798
Consolidated profit 148 140 166 169 176 192 136 236 623 739
Attributable profit 103 97 116 119 123 132 92 162 435 509

83 83
ChileConstant EUR million
1Q 13 2Q 13 3Q 13 4Q 13 1Q 14 2Q 14 3Q 14 4Q 14 2013 2014
NII + Fee income 422 419 471 481 488 528 475 571 1,794 2,063
Gross income 454 468 507 523 532 553 510 601 1,951 2,197
Operating expenses (191) (205) (205) (203) (201) (211) (219) (223) (804) (854)
Net operating income 263 263 302 320 331 342 292 378 1,147 1,343
Net loan-loss provisions (127) (123) (136) (131) (116) (118) (132) (154) (518) (521)
Other (1) 3 5 (3) (7) (3) 3 (18) 4 (24)
Profit before taxes 134 142 171 186 209 221 162 206 633 798
Consolidated profit 122 117 146 155 176 192 137 234 540 739
Attributable profit 85 81 102 109 123 133 93 161 378 509

84 84
Corporate ActivitiesEUR million
1Q 13 2Q 13 3Q 13 4Q 13 1Q 14 2Q 14 3Q 14 4Q 14 2013 2014
NII + Fee income (588) (526) (541) (618) (542) (495) (466) (471) (2,273) (1,974)
Gross income (322) (138) (163) (326) (224) (237) 10 (7) (948) (458)
Operating expenses (177) (176) (176) (167) (191) (197) (194) (181) (696) (763)
Net operating income (499) (314) (339) (493) (416) (434) (183) (188) (1,644) (1,221)
Net loan-loss provisions (29) (189) 14 2 1 (1) 0 2 (201) 2
Other (66) (89) (124) (158) (72) (67) (90) (342) (436) (571)
Ordinary profit before taxes (594) (591) (448) (648) (487) (502) (273) (529) (2,282) (1,790)
Ordinary consolidated profit (543) (521) (432) (569) (408) (444) (262) (671) (2,064) (1,785)
Ordinary attributable profit (543) (519) (430) (579) (405) (444) (259) (681) (2,071) (1,789)
Attributable profit (543) (519) (430) (579) (405) (444) (259) (681) (2,071) (1,789)

85


