Embed Size (px)
Citation preview

A MULTI-DIMENSIONAL FRAMEWORK FOR INCLUSIVE GROWTH
OECD-ECLAC Regional Consultation
Paul Schreyer OECD14th November 2013

• Defining Inclusive Growth
• Results
• Issues
Contents

Defining Inclusive Growth

• Intuition: growth is important but not sufficient for welfare improvements if the growth dividend is not shared in a fair way
• Key features of OECD approach– Multi-dimensionality– Emphasis on distributions– Policy-orientation

Which dimensions? Start with OECD How’s Life? framework
Quality of Life Material Well-being
Health Income and Wealth
Work-Life Balance Jobs
Education and skills Housing
Social Connections
Civil Engagement and Governance
Environmental Quality
Personal Security
Subjective Well-being

1. Dimensions speak to current policy debates2. Possibility to establish testable links with
economic policies3. Measurability in the OECD area and beyond4. Empirical support for selection
Our choice:IncomeJobsHealth
Which dimensions for Inclusive Growth? Criteria.

• Households and individuals• Outcomes• Distributions
• This mirrors OECD work on:– Well-being (How’s Life?)– Analyses of inequalities (Divided we
Stand)
Indicators for each dimension should be reflective of…

• Income: Household real disposable income– HH real adjusted disposable income preferable
but not widely available
• Jobs: (Risk of) unemployment– strong determinant of subjective WB– Alternative: employment rate: captures
differences in labour market participation– Problem: informal employment not captured– No distinction between durations of
unemployment
Indicators

• Health: Life expectancy– Morbidity preferable?– But issues of data availability and
aggregation– Also, even in OECD countries, significant
variance of evolution of life expectancy between countries and sizable differences between socio-economic groups
– Likely to be more accentuated in developing countries and emerging economies
Indicators (2)

Aggregation across dimensions
)]y,...y,y(I1[]y[)y,...y,y(W *N
*2
*1
*N
*2
*1
Averages Distribution
measureinequalityAtkinsonKolm
i household of income equivalent
incomemarketnonandmarketaverage
:)y,...y,y(I
:yy
:,y
*N
*2
*1
ii*i
Social welfare function (Kolm 1966, Atkinson 1970, Sen 1973, Jorgenson 1990, Fleurbaey and Blanchet 2013, Jones & Klenow 2012)
Living standards = equivalent income of ‘representative’ household=

• Growth is inclusive if ΔW>0• Note normative nature of defining
whose equivalent income is ‘representative’
• OECD default: median household• But other possibilities, e.g., lowest
decile or quintile
Finally, our definition of Inclusive Growth

• Requires shadow prices of unemployment risk and health status
• Derived by regressing results of life satifsfaction surveys on income, unemployment and life expectancy
Measuring equivalent income (loss) for jobs and health

Some Results

Living standards and GDP/capita
ΔlnW >0: a priori, growth has been inclusive But: possible upward bias as only income distribution considered
Positive but weak correleation with GDP (only 38% of variance explained): Large differences between countries ΔlnW-ΔlnGDP: ex. France and Germany
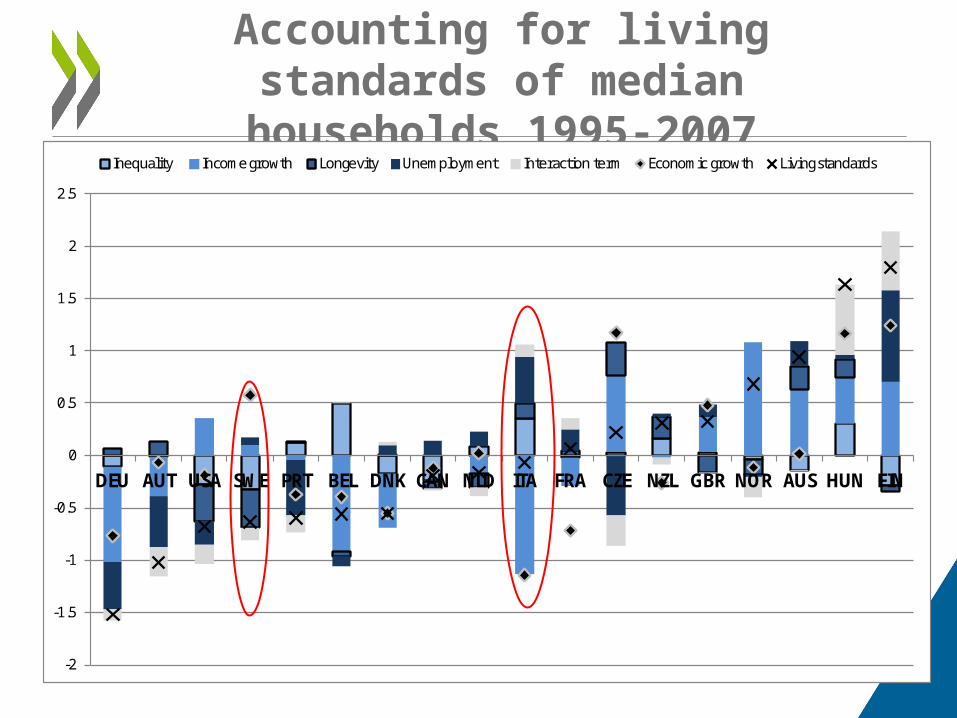
Accounting for living standards of median households 1995-
2007
-2
-1.5
-1
-0.5
0
0.5
1
1.5
2
2.5
DEU AUT USA SWE PRT BEL DNK CAN NLD ITA FRA CZE NZL GBR NOR AUS HUN FIN
Inequality Income growth Longevity Unemployment Interaction term Economic growth Living standards

Sensitivity to definition of W, average annual % change 1995-2007
Belgium Denmark Finland Sweden UK USA All countries0
1
2
3
4
5
6
7
AverageMeanPercentile 10
Grow
th in
livi
ng st
anda
rds
Normative choices matter

-15
-10
-5
0
5
10
Inequality Income growth Longevity Unemployment Interaction term Economic growth Living standards
Welfare accounting during the crisis
Rise in unemployment, inequality and slow income drags down growth of living standardsNote: full effects of the crisis likely to be observed post 2009

Level comparisons: loss of living standards relative to best
performer

Issues

• Is the OECD approach towards measuring IG relevant in LAC context?
• Do income, jobs and health capture the essential outcomes and opportunities?
• Choice of ‘representative’ HH in LAC?• Key methodological and data
challenges?• Link to policies?

Looking ahead – links to policies
Outcomes and their distribution:
Living standards: Income, JobsHealth
Other areas of quality of life: JobsEducationPersonal SecurityEnv. quality of life…
Dimensions of well-being
Production function or process
Return on physical and human capital, demand for jobs …
Sources of growth, equality of opportunities
Going for Growth /
Green growth /
Divided we stand
Work on education and health etc.Work on side-effects of growth policiesWork on equality of outcomes and opportunities
Other drivers(institutions; norms; exogenous factors)