Embed Size (px)
Citation preview

Investor Presentation February 2015

These slides and the accompanying oral discussion contain certain statements that are not historical facts, including information concerning possible or assumed future results of our operations. Those statements constitute “forward-looking statements” within the meaning of the Private Securities Litigation Reform Act of 1995. Such statements involve known and unknown risks, uncertainties and other factors that could cause the actual results of the Company to differ materially from the results expressed in or implied by our forward-looking statements, including the availability and cost of raw materials and purchased components, the level of construction and remodeling activity, changes in general economic and business conditions, conditions affecting the industries we serve and our customers, the rate of sales growth, availability of labor force and efficiencies, product liability claims, our high degree of leverage and other factors discussed in the Company’s offering circular relating to the 6.50% senior unsecured notes due 2022, including the documents incorporated therein by reference to the Company’s filings with the Securities and Exchange Commission, including the Company’s most recent Annual and Quarterly Reports on Form 10-K and Form 10-Q. Many of these factors are outside of the Company’s control and all of these factors are difficult or impossible to predict accurately. The Company undertakes no obligation to update publicly any forward-looking statements, whether as a result of new information, future events or otherwise. In addition, these slides and the accompanying oral discussion reference financial information determined by methods other than in accordance with accounting principles generally accepted in the United States of America (“GAAP”), such as adjusted EBITDA. The Company’s management uses these non-GAAP measures in its analysis of the Company’s performance. The Company believes that the presentation of certain non-GAAP measures provides useful supplemental information that is essential to a proper understanding of the operating results of the Company’s core business. These non-GAAP measures should not be viewed as a substitute for operating results determined in accordance with GAAP, nor are they necessarily comparable to non-GAAP performance measures that may be presented by other companies. A reconciliation of each non-GAAP financial measure to the most directly comparable GAAP financial measure is provided as an appendix to the slides.
Legal Disclaimer
1

Ply Gem Overview
2

• $1.8 Billion in LTM 9/27/14 (1)
• Approximately 8,700 associates
One of the Largest Manufacturers of Exterior Building and Home Improvement Products in North America
3
Company Overview
(1) LTM 9/27/14; Pro Forma for the Simonton acquisition.
44% 56% 52% 48%
NEW CONSTRUCTION / R&R(1) WINDOWS / SIDING (1)
16%
84%
U.S. / Canada(1)

• #1 in vinyl siding in North America
• #1 in aluminum accessories in U.S.
• #1 in vinyl / aluminum windows in U.S.
• #1 in windows in Western Canada
Leading Manufacturer of Exterior Building Products
4
Company Overview
Provider of branded products for new construction and home improvement markets, sold through a multitude of distribution channels covering a variety of price points

Extensive Exterior Product Portfolio
Engineered roofing products
Gable vents and accessories
Gutter protection systems
Vinyl and aluminum soffit
Window mantles
Manufactured stone
Vinyl and aluminum siding
Shutters
Mounting blocks
Decorative corner posts
Rain removal systems
Door surround systems
Patio Doors
Windows
Railing and fencing
Outdoor structures
Exterior doors
PVC trim
5
Company Overview

• Provides differentiation for Ply Gem customers
• Provides a single sourcing opportunity
• Hits the sweet spot of an emerging trend
• Features NAHB Green Approved products
• Fulfills the “One Ply Gem” MISSION
Alexandria, VA Designed Exterior Remodel
BEFORE
Three Weeks later using The Designed Exterior concept
AFTER
Complete Exterior Solution Offering for Customers Company Overview
6

Vinyl Siding Market Leader
• #1 vinyl siding manufacturer in North America (~39% share in the US)
• Consolidated industry with 4 participants holding over 90% share
• Strong trade brands
• Multi-channel distribution network servicing both new construction and R&R
• State-of-the-art automated manufacturing facilities with excess capacity
~$5,600
~$1,500 $738
Exterior CladdingMarket Size
Vinyl SidingMarket Size
Ply Gem 2013Net Sales
($ in mm)
Market size: According to Principia Partners.
Why Ply Gem Key Brands
North American Market Summary
7
Company Overview

• #1 vinyl and aluminum window manufacturer in the US
• #1 window and door manufacturer in Western Canada
• Multi-channel distribution network servicing both new construction and R&R covering every price point
• Highly efficient, vertically integrated production
• Continued to gain market share during downturn
$9,000
$628
Market Size Ply Gem 2013 Net Sales
($ in mm)
Market size: Company estimate – new construction and R&R. (1) Excludes Simonton net sales.
~
Vinyl and Aluminum Windows Market Leader
Why Ply Gem Key Brands
North American Market Summary
8
Company Overview
(1)

Regional local one-step distributors
New Construction
Regional/local one-step distributors
National one-step distributors
Retailers
Two-step distributors
Home Repair and Remodeling
• Homebuilders
• Contractors
• Contractors
• Individuals
Two-step distributors
National one-step distributors
Retailers
Homebuilders
Representative Customers Broad Supply Chain
Diversity of channels and customers with limited customer concentration Top 10 customers account for only ~40% of 2013 net sales 9
Multi-Channel Distribution Network Serving a Broad Customer Base
Company Overview

Manufacturing & Distribution Platform
10
Company Overview
Ply Gem Windows Manufacturing Siding Manufacturing Fence + Rail Manufacturing Corporate / HQ Stone Manufacturing Window Distribution – Canada Siding Distribution - Canada
Simonton Windows Manufacturing
29 Manufacturing Plants
34 Distribution Centers

• Customer solutions
• Customer experience
• Leading brands
• Measure, Engagement
• New Products / Solutions
• Utilize technology
• Open collaboration
• Sustainability
• Business diversity
• Cross sell our products
• Double digit growth
• World class safety & quality
• Low cost producer
• Efficient supply chain
Customer Focus
Innovation
Profitable Growth
Continuous Improvement
Human Resources
LEVERAGE
Company Overview
11
• Associate development
• Succession planning
• Communicate & empower

Company Overview
3.99 3.98
3.30
1.81 1.76 1.59 1.88 1.98
7.26 7.11
6.65
5.42 5.47 5.21 5.27
4.56
2006 2007 2008 2009 2010 2011 2012 2013
Ply Gem Combined National (US) Trend
WORLD CLASS
Ply Gem Safety is Top Priority
Recordable Incident Rate

Market and Housing Update
13
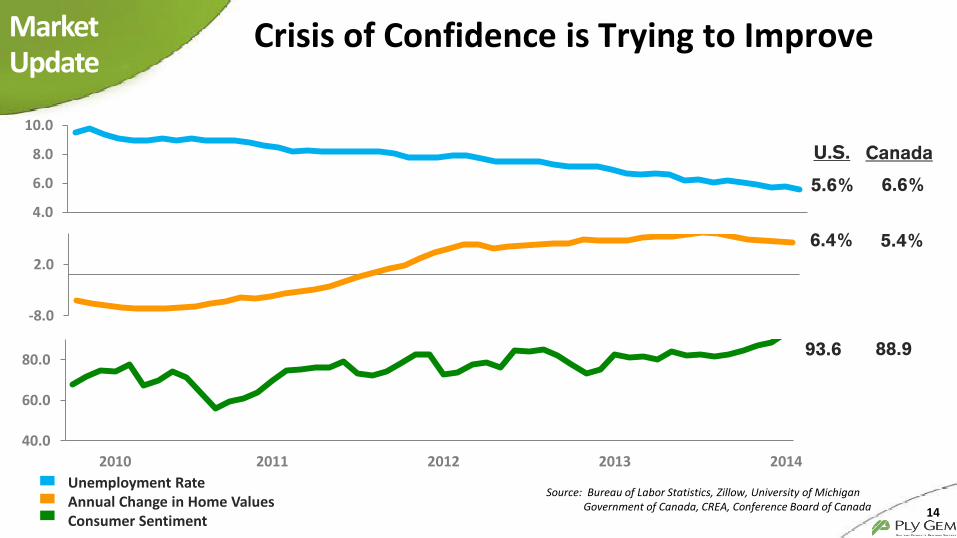
Crisis of Confidence is Trying to Improve
14
Market Update
-8.0
2.0
4.0
6.0
8.0
10.0
40.0
60.0
80.0
2010 2011 2012 2013 2014
Source: Bureau of Labor Statistics, Zillow, University of Michigan Government of Canada, CREA, Conference Board of Canada
Unemployment Rate Annual Change in Home Values Consumer Sentiment
5.6%
6.4%
93.6
Canada
6.6%
5.4%
88.9
U.S.

U.S. SFHS Forecasted to Increase
15
1,719 1,474
1,036
616 442 471 434 537 621 647
803 1,100
354
338
306
284
112 114 178 247
309 357 365
359
0
500
1,000
1,500
2,000
2,500
2005 2006 2007 2008 2009 2010 2011 2012 2013 2014 2015E 2016E
Single-Family Multi-Family(in thousands)
-75%
Market Update
Source: NAHB

Canada SFHS Forecast
16
121 119 93 76
94 82 84 77 75 78 75
106 109
118
73
97 112 131
111 114 112 112
0
50
100
150
200
250
2006 2007 2008 2009 2010 2011 2012 2013 2014E 2015E 2016E
Single-Family Multi-Family
Market Update
Source: CMHC
(in thousands)

Growth Will be in Healthier Markets
17
Market Update
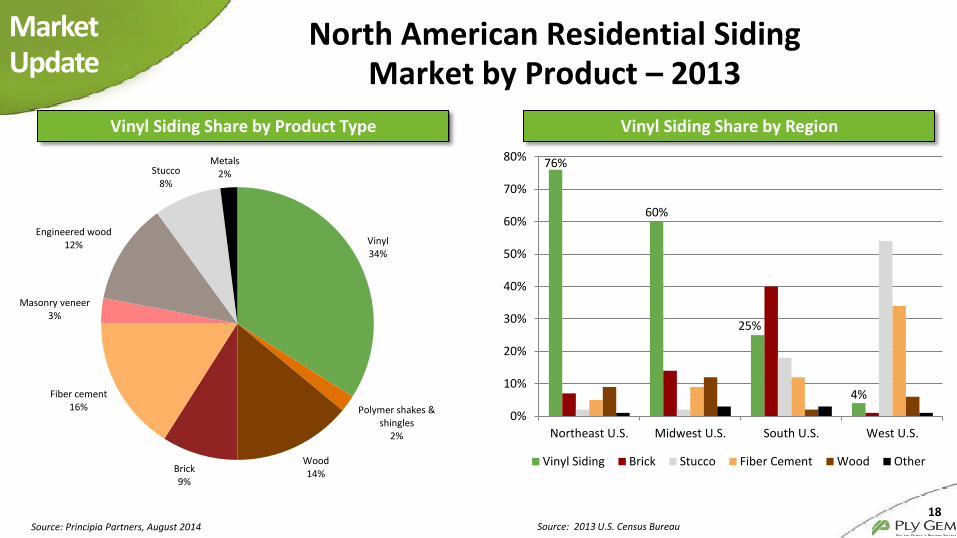
North American Residential Siding Market by Product – 2013
18
Market Update
Source: Principia Partners, August 2014
Vinyl 34%
Polymer shakes & shingles
2%
Wood 14% Brick
9%
Fiber cement 16%
Masonry veneer 3%
Engineered wood 12%
Stucco 8%
Metals 2%
76%
60%
25%
4%
0%
10%
20%
30%
40%
50%
60%
70%
80%
Northeast U.S. Midwest U.S. South U.S. West U.S.
Vinyl Siding Brick Stucco Fiber Cement Wood Other
Source: 2013 U.S. Census Bureau
Vinyl Siding Share by Region Vinyl Siding Share by Product Type
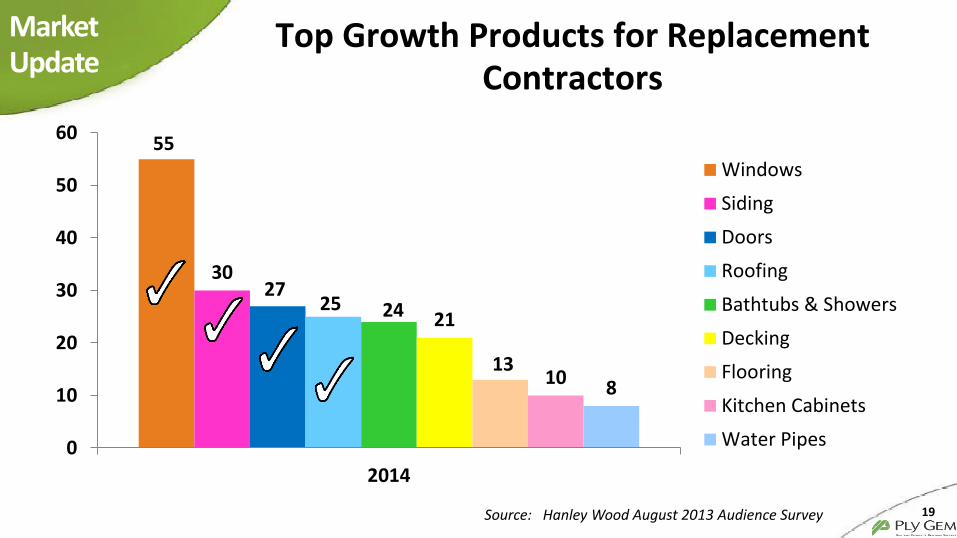
Top Growth Products for Replacement Contractors
19
55
30 27
25 24 21
13 10 8
0
10
20
30
40
50
60
2014
Windows
Siding
Doors
Roofing
Bathtubs & Showers
Decking
Flooring
Kitchen Cabinets
Water Pipes
Market Update
Source: Hanley Wood August 2013 Audience Survey

Financial Overview
20

Expected Achieved
MW Windows
($331mm)
2004 2005 2006 2007 2008
Alenco Windows
($127mm)
MHE (Alcoa) siding business ($296mm)
CT Windows
($37mm)
United Stone Veneer
($4mm)
Ply Gem purchased
by CI Capital
Expected Achieved Expected Achieved
2013
Gienow
(CAD$20mm)
Acq
uis
itio
ns
Co
st s
avin
gs
Mitten
(CAD$79mm)
Proven Track Record of Acquisition Integration / Cost Savings Realization
Acquisitions provide incremental capabilities and growth along with significant synergy opportunities
$6.8 $11.0 $4.0 $4.9 $22.0
$55.0
($ in mm)
21
Company Overview
Simonton
($130mm)
2014

Net Sales Adjusted EBITDA
$176
$96 $116 $123 $115 $127 $117 $114
0%
6%
12%
18%
24%
30%
2007 2008 2009 2010 2011 2012 2013 LTM9/27/14
Adj. EBITDA % of Sales
$1,364 $1,175
$951 $996 $1,035 $1,121
$1,366 $1,449
0
400
800
1200
1600
2007 2008 2009 2010 2011 2012 2013 LTM9/27/14
Ply Gem sales Single family housing starts
Key Consolidated Financial Performance
($ in mm) ($ in mm)
Source: Management, U.S. Census Bureau. Note: 2Q13 numbers include Gienow and Mitten from date of acquisition. 3Q14 numbers include Simonton from date of acquisition.
22
Financial Overview
Consistent Seasonal Adjusted EBITDA Performance
$12 $7 $15 $12
($1)
1Q10 1Q11 1Q12 1Q13 1Q14
$47 $44 $45 $41 $44
2Q10 2Q11 2Q12 2Q13 2Q14
$23 $24 $25 $16
4Q10 4Q11 4Q12 4Q13
$41 $40 $42 $48
$55
3Q10 3Q11 3Q12 3Q13 3Q14
% of net
sales 5.9% 3.3% 5.1% 4.6% (0.5%) 15.3% 14.5% 14.4% 11.2% 10.8% 14.9% 13.2% 13.3% 11.9% 12.6% 10.0% 9.8% 9.2% 4.8%
($ in mm)

Ply Gem 38%
CertainTeed 26%
Associated Materials 12%
Exterior/Royal 15%
Kaycan 5%
Other 4%
Ply Gem/Simonton 14%
Atrium 3%
Other(1) 26%
Pella 16%
Jeld Wen (includes doors) 13%
Marvin 8%
Anderson 20%
$535 $466
$374 $392 $396
$463
$628 $667
(20.0%)
(10.0%)
0.0%
10.0%
20.0%
30.0%
40.0%
$0
$200
$400
$600
$800
$1,000
2007 2008 2009 2010 2011 2012 2013 LTM 9/27/14
Sales Operating earnings margin
Andersen Pella Marvin JELD-WEN Atrium Associated Materials Milgard Simonton
Windows manufacturers (all substrates)
Source: Principia Partners 2014 study, management estimates.
One, Integrated Business with Two Reportable Segments
($ in mm) ($ in mm)
Siding, Fencing, and Stone Windows and Doors
Window Market Share in Units (All Types) - 2013 Vinyl Siding Market Share -2013
23
Company Overview
(1) Includes Associated Materials, Milgard, MI, Weathershield, Windsor, Harvey, Champion, Amsco, Cascade, and Kolbe.
$828
$709
$577 $604 $639 $658
$738 $782
(20.0%)
(10.0%)
0.0%
10.0%
20.0%
30.0%
40.0%
$0
$200
$400
$600
$800
$1,000
2007 2008 2009 2010 2011 2012 2013 LTM 9/27/14
Sales Operating earnings margin
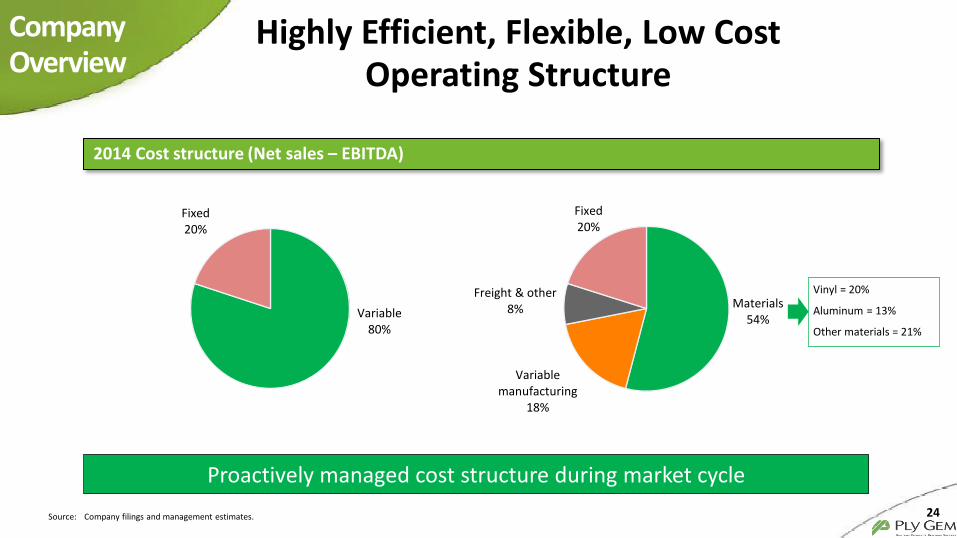
2014 Cost structure (Net sales – EBITDA)
Variable 80%
Fixed 20%
Materials 54%
Variable manufacturing
18%
Freight & other 8%
Fixed 20%
Vinyl = 20%
Aluminum = 13%
Other materials = 21%
Highly Efficient, Flexible, Low Cost Operating Structure
Source: Company filings and management estimates. 24
Company Overview
Proactively managed cost structure during market cycle

$20 $17
$8 $11 $11
$25 $26 $24
0.0%
0.8%
1.6%
2.4%
3.2%
2007 2008 2009 2010 2011 2012 2013 LTM9/27/14Capex % of Sales
FCF: Adjusted EBITDA – Capital Expenditures Capital Spending
• Modest capex ~1.7% of sales in LTM 9/27/14
• In excess of $248M in available liquidity at 3Q14
• No near-term maturities
$20
$430
$650
2017 2018 2019 2020 2021 2022ABL Term Loan Senior Notes
Debt Maturity - 3Q14
Substantial / Sustainable Free Cash Flow
History of strong EBITDA performance, modest capital expenditure requirements and efficient use of working capital 25
Financial Overview
$156
$80 $108 $112 $103
$103 $91 $90
2007 2008 2009 2010 2011 2012 2013 LTM9/27/14
($ in mm) ($ in mm)
($ in mm)

Questions
26

Appendix
27

Year Ended December 31,
(amounts in thousands) 2007 2008 2009
Net income (loss) $4,982 $(498,475) $(76,752)
Interest expense, net 97,994 137,398 135,303
Benefit for income taxes 3,634 (69,951) (17,966)
Depreciation and amortization 54,067 61,765 56,271
EBITDA $160,677 $(369,263) $96,856
Non cash loss (gain) on foreign currency transactions (3,961) 911 (475)
Goodwill impairment - 450,000 -
Intangible asset impairment 4,150 - -
Customer inventory buybacks - 1,890 8,345
Restructuring/integration expense 10,356 10,859 8,992
Non cash charge of purchase price allocated to inventories 1,289 19 -
Management fees 3,505 1,679 2,497
Adjusted EBITDA $176,016 $96,095 $116,215
28
Adjusted EBITDA Reconciliation Appendix

(amounts in thousands) Year Ended
December 31, 2010 1Q10 2Q10 3Q10 4Q10
Net income (loss) $27,667 $54,102 $(409) $(6,394) $(19,632)
Interest expense, net 122,833 33,954 30,152 29,752 28,975
Provision (benefit) for income taxes 5,027 6,532 664 1,332 (3,501)
Depreciation and amortization 60,718 15,454 15,711 15,133 14,420
EBITDA $216,245 $110,042 $46,118 $39,823 $20,262
Non cash loss (gain) on foreign currency transactions
(510) (104) (122) (104) (180)
Write-off capitalized offering costs 1,571 1,571
Customer inventory buybacks 574 252 124 117 81
Restructuring/integration expense 910 106 83 405 316
Loss on modification or extinguishment of debt
(98,187) (98,187) - - -
Management fee 2,451 200 900 900 451
Adjusted EBITDA $123,054 $12,309 $47,103 $41,141 $22,501
29
Adjusted EBITDA Reconciliation Appendix

(amounts in thousands) Year Ended
December 31, 2011 1Q11 2Q11 3Q11 4Q11
Net income (loss) $(84,507) $(70,892) $2,063 $(458) $(15,220)
Interest expense, net 101,384 26,424 24,911 25,176 24,873
Provision (benefit) for income taxes 683 2,472 (959) 466 (1,296)
Depreciation and amortization 54,020 13,690 13,393 13,471 13,466
EBITDA $71,580 $(28,306) $39,408 $38,655 $21,823
Non cash loss (gain) on foreign currency transactions
(492) (133) (218) (115) (26)
Environmental remediation 1,580 - - - 1,580
Customer inventory buybacks 10,087 6,692 2,971 315 110
Restructuring/integration expense 1,616 429 477 547 163
Gain on modification or extinguishment of debt
27,863 27,863 - - -
Management fee 2,267 100 900 800 467
Adjusted EBITDA $114,501 $6,645 $43,538 $40,201 $24,117
30
Adjusted EBITDA Reconciliation Appendix
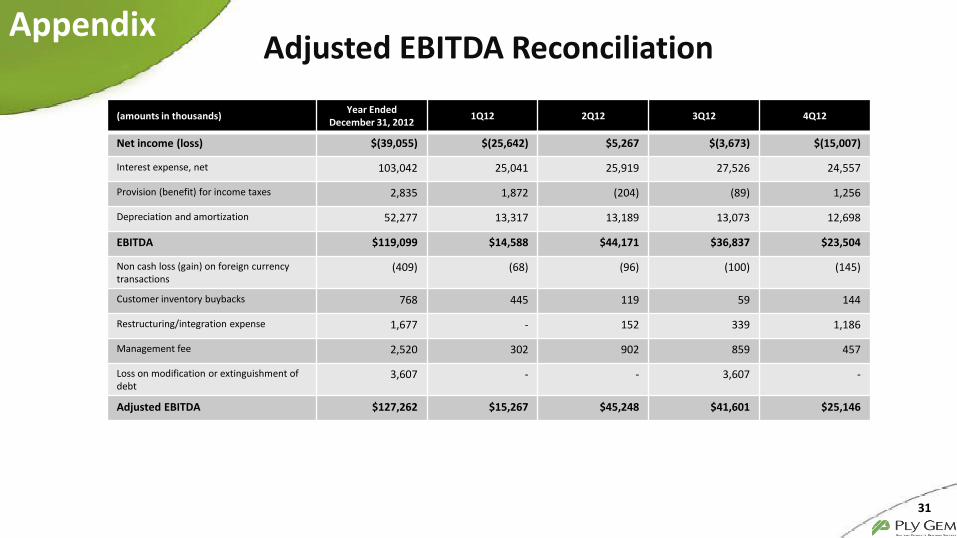
(amounts in thousands) Year Ended
December 31, 2012 1Q12 2Q12 3Q12 4Q12
Net income (loss) $(39,055) $(25,642) $5,267 $(3,673) $(15,007)
Interest expense, net 103,042 25,041 25,919 27,526 24,557
Provision (benefit) for income taxes 2,835 1,872 (204) (89) 1,256
Depreciation and amortization 52,277 13,317 13,189 13,073 12,698
EBITDA $119,099 $14,588 $44,171 $36,837 $23,504
Non cash loss (gain) on foreign currency transactions
(409) (68) (96) (100) (145)
Customer inventory buybacks 768 445 119 59 144
Restructuring/integration expense 1,677 - 152 339 1,186
Management fee 2,520 302 902 859 457
Loss on modification or extinguishment of debt
3,607 - - 3,607 -
Adjusted EBITDA $127,262 $15,267 $45,248 $41,601 $25,146
31
Adjusted EBITDA Reconciliation Appendix

(amounts in thousands) Year Ended
December 31, 2013 1Q13 2Q13 3Q13 4Q13
Net income (loss) $(79,520) $(28,107) $(50,877) $16,895 $(17,431)
Interest expense, net 91,684 23,653 24,833 21,760 21,438
Provision (benefit) for income taxes 298 3,849 (731) (1,442) (1,378)
Depreciation and amortization 45,646 9,715 11,171 12,097 12,663
EBITDA $58,108 $9,110 $(15,604) $49,310 $15,292
Non cash loss (gain) on foreign currency transactions
1,533 33 346 376 778
Acquisition costs 1,490 315 1,025 150 -
Customer inventory buybacks 4,837 - 2,172 2,503 162
Restructuring/integration expense 11,759 2,380 1,439 1,529 6,411
Non cash charge of purchase price allocated to inventories
2,015 - 883 1,132 -
Management fee 410 235 175 - -
Loss on modification or extinguishment of debt
18,948 - 18,948 - -
Initial public offering costs 23,527 - 23,527 - -
Tax receivable agreement liability adjustment
(5,167) - 8,143 (6,669) (6,641)
Adjusted EBITDA $117,460 $12,073 $41,054 $48,331 $16,002 32
Adjusted EBITDA Reconciliation Appendix

(amounts in thousands) 1Q14 2Q14 3Q14 LTM Sept 14
Net income (loss) $(51,578) $11,380 $21,405 $(36,224)
Interest expense, net 18,494 17,225 16,282 73,439
Provision (benefit) for income taxes (12,470) 7,051 (10,514) (17,311)
Depreciation and amortization 11,284 11,254 11,378 46,579
EBITDA $(34,270) $46,910 $38,551 $66,483
Non cash loss (gain) on foreign currency transactions
228 (477) 766 1,295
Acquisition costs - - 664 664
Customer inventory buybacks 123 359 306 950
Restructuring/integration expense 1,717 1,462 1,067 10,657
Litigation settlement 5,000 - - 5,000
Loss on modification or extinguishment of debt 21,364 - - 21,364
Non cash charge of purchase price allocated to inventories
- - 38 38
Tax receivable agreement liability adjustment 4,373 (3,942) 13,988 7,778
Adjusted EBITDA $(1,465) $44,312 $55,380 $114,229
33
Adjusted EBITDA Reconciliation Appendix