DPRIETI Discussion Paper Series 16-E-060
Working Hours, Promotion, and Gender Gaps in the Workplace
KATO TakaoColgate University
OGAWA HiromasaGRIPS
OWAN HideoRIETI
The Research Institute of Economy, Trade and Industryhttp://www.rieti.go.jp/en/

RIETI Discussion Paper Series 16-E-060 March 2016
Working Hours, Promotion, and Gender Gaps in the Workplace*
KATO Takao, OGAWA Hiromasa, and OWAN Hideo **
Abstract This paper presents a model of promotion which features two different sources of asymmetric information—disutility of working long hours and on the job training (OJT) ability, or the ability to accumulate human capital on the job via learning by doing. The former is the worker’s private information while the latter is the employer’s. The firm decides whether or not to reveal its private information on the worker’s OJT ability to him/her and how much training it provides to him/her. The worker chooses working hours to signal its commitment to the firm. We show that there always is a separating equilibrium in which the worker’s working hours fully reveal his/her commitment level. The firm’s optimal feedback policy depends on the nature of the training and learning, and the level of overtime pay. Not revealing private information on the worker’s ability could be optimal for the firm under certain circumstances. We argue that two recent changes in the Japanese human resource management system—more selective training and an increasing share of occupations exempt from overtime work payment—may be making information revelation optimal for many firms. We further show that revealing information on the worker’s ability tends to be optimal for the firm when many in the workforce have high disutility of working long hours. As such, if the firm can use different feedback policies for men and women, it may reveal its private information on the worker’s ability only to women but not to men. If this is the case, there is a testable implication: the incidence of promotion should be more highly correlated with the number of hours worked for women than for men. Using personnel records of a large Japanese manufacturing firm, we find evidence in support of this prediction. Keywords: Working hours, Promotion, Gender gap, Signaling JEL classification: J16, J31, M51
* This study is conducted as a part of the Project “Economic Analysis of Human Resource Allocation Mechanisms within the Firm: Insider econometrics using HR data” undertaken at Research Institute of Economy, Trade and Industry (RIETI). ** Takao Kato is W.S. Schupf Professor of Economics and Far Eastern Studies, Colgate University ([email protected] ); Research Fellow, IZA (Bonn); Research Associate, CJEB (Columbia Business School); TCER (Tokyo); CCP (Copenhagen and Aarhus); and ETLA (Helsinki). Hiromasa Ogawa is Assistant Professor in National Graduate Institute for Policy Studies ([email protected]). Hideo Owan is Professor in the Institute of Social Science, the University of Tokyo ([email protected]); and Faculty Fellow, RIETI (Tokyo).
RIETI Discussion Papers Series aims at widely disseminating research results in the form of professional papers, thereby stimulating lively discussion. The views expressed in the papers are solely those of the author(s), and neither represent those of the organization to which the author(s) belong(s) nor the Research Institute of Economy, Trade and Industry.
1
1. Introduction
We develop a new model of promotion within the firm which provides fresh insight on
interplay between working hours and the odds of subsequent promotion. Specifically the
worker differs in his/her level of disutility of working long hours as well as in his/her ability
to accumulate human capital on the job though learning by doing or On-the-Job Training
(OJT) ability. The productivity of the worker with a higher OJT ability will grow more
rapidly over time. In addition, he/she will become a more productive manager if and when
gets promoted, for he/she can acquire a variety of skills and knowledge by experiencing a
wide range of jobs more effectively thanks to his/her higher OJT ability (see, for instance,
Gibbons and Waldman, 2004; Lazear, 2012, Frederiksen and Kato, 2016). The worker’s cost
of working long hours is known to the worker but not to the firm at the beginning of his/her
tenure at the firm---the worker’s cost of working long hours is his/her private information.
The worker’s OJT ability is initially unknown to both parties when he/she starts working at
the firm, yet it is revealed to the employer earlier than the worker himself/herself at a
relatively early stage of his/her tenure.
It is highly unlikely that either the firm or the worker knows accurately how well the
worker accumulates human capital (in particular firm-specific human capital) on the job
before he/she starts actually working at the firm. As he/she starts working and engaging in
learning-by-doing, it is reasonable to assume that the firm continues to observe the worker’s
2
progress in his/her accumulation of human capital on the job and collect/keep relevant
information (not only formal but also informal) on the worker’s OJT ability. At some point
the firm will have a sufficient amount of information to discern the worker’s OJT ability with
precision. We argue that such information is the firm’s private information which the worker
cannot access unless the firm decides to share it with him/her. The worker himself/herself can
probably learn his/her own OJT ability as he/she continues to work. However, having
observed many workers and have discerned their OJT abilities in the past as well as
understanding deeply what type of human capital is more valuable for the firm, the firm has a
clear advantage over the worker in figuring out the worker’s OJT ability quickly. Prendergast
(1993) have shown that the model with this feature can illustrate how late promotion policy,
an important characteristics of the Japanese human resource management system, arises in
the equilibrium.
After learning each worker’s OJT ability and having observed his/her hours worked in
the first period, the employer will then decide which worker will receive a sufficient amount
of managerial training. Only those workers who have completed such training can potentially
perform managerial tasks effectively and thus get promoted to managers.
Using this model, we illustrate how a “rat race” equilibrium in which a substantial
portion of workers work inefficiently long hours could arise. We also examine under what
conditions it is optimal for the firm to share its private information on the worker’s OJT

3
ability with the worker. The firm’s revealing its private information on the worker’s OJT
ability to the worker (thereafter we call it information revelation) has two effects. First,
information revelation affects who get promoted to managerial positions. If training and OJT
ability are complementary inputs in the production of promotion, more high-ability workers
will get promoted with information revelation, for such workers with high OJT ability who
become aware of their high ability through information revelation have a higher incentive to
work long hours, knowing that doing so will lead to more training, which in turn further
increases their chance of promotion. Without knowing that they have high OJT ability, some
workers with relatively high cost of working long hours would give up working hard to
receive more training. So, information revelation could improve the ex-post efficiency in
having the right kind of workers (or workers with high OJT ability) receive training and get
promoted to managerial positions.
Second, information revelation affects the number of hours worked by each worker. In
general information on the worker’s OJT ability when shared with the worker could raise or
lower the average incentive for workers with high cost of working long hours to mimic the
low-cost workers. When training and OJT ability are complementary inputs in the production
of promotion, information revelation will intensify competition for promotion which leads to
more excessive efforts among qualified workers. Here, information sharing aggravates the
ex-ante efficiency in terms of how much effort the workers put forth in order to be selected as

4
managers.
There are three factors that affect the trade-offs involving the above sorting and incentive
effects. First, the nature of training matters. If the training programs are designed to target
high-performers and thus complement worker ability, information revelation of worker ability
is likely to motivate high-ability workers to work harder and longer, and thereby receive more
managerial training. In contrast, if the training programs mainly target bottom workers to
develop uniform skill distribution among workers, thus training and ability are substitutable
inputs in the production of promotion, the information revelation policy will discourage
high-ability workers from working longer. Second, overtime hourly wage is also important. If
overtime pay is zero, the firm will always prefer to maximize working hours whereas, if
overtime pay is very high, the firm will try to minimize overtime work hours. Thirdly, the
distribution of the disutility of working long hours is an important determinant. When
training complements ability, if a majority of workers have high disutility of working long
hours, revealing ability information tends to improve the ex ante efficiency, for such
information sharing significantly reduces the number of hours worked for low-ability workers
while having a positive but relatively limited impact on the working hours of high-ability
workers due to the complementarity between ability and low disutility of working long hours
in the production function . In contrast, if a majority of workers have relatively low costs,
revealing ability information is more likely to lower the ex ante efficiency by inducing
5
high-ability workers to raise their working hours excessively while reducing working hours
of low-ability workers to a limited extent. In this case, concealing information on worker
ability to ease the rat-race competition tends to be efficient.
We then consider the implications for gender differences in promotion. Under a plausible
assumption that female workers face more demanding obligations at home than male workers,
the distribution of commitment (lower disutility of working long hours) for women should be
downward skewed. Then, based on the above deliberation, if different promotion policies can
be applied to men and women separately, it is quite possible that information sharing is
efficient for women but not for men. This gives us a new empirical prediction that the
relationship between working hours and promotion rates is stronger for women than for men.
For women, only those informed of their high OJT ability tend to work long hours and
receive more managerial training. As such, the correlation between working hours and the
odds of promotion is quite high. For men, such information is concealed, and the firm treats
all workers equally as if they were of equal OJT ability. Since everyone thinks that he has
some chance to get promoted, everyone works long hours to signal their low cost. But, in fact,
only those with high OJT ability are chosen for managerial training and get promoted to
management positions. Therefore, the correlation between working hours and promotion is
weaker for men.
After presenting the model, we demonstrate its utility by using the model to provide a
6
coherent interpretation of stylized facts about international differences in the gender gaps in
the labor market. Finally we provide rigorous econometric evidence on the key prediction
from the model by analyzing unique longitudinal personnel data that we recently obtained
from a large Japanese firm. The longitudinal personnel data contains information on both
hours worked and job assignment records for all domestic workers who ever worked for the
firm’s domestic establishments between FY2004 and FY2009.
Our model of promotion within the firm and evidence from an econometric case study
contribute to the literature on gender discrimination in the labor market in general and the
gender gap in promotion in particular. Relative to the vast literature on the gender pay gap,
the literature on the gender gap in promotion is relatively small. Most early works focus on
documenting that promotion rates are lower for women than for men with similar observed
characteristics (e.g., Cabral, Ferber, and Green 1981, Cannings 1988, Cobb-Clark 2001,
Paulin and Mellor 1996, Pekkarinen and Vartianinen, 2004).
Two competing explanations for such “unexplained” gender differences in promotion
were proposed. First, there may be unobserved productivity differences or female preferences
for different job characteristics (e.g. for less authority or fewer working hours required).1
Such differences may be caused, for example, by a division of labor in the family—married
1 The sociological literature emphasizes that the disadvantages associated with being in an occupation dominated by women persistently exists simply because bureaucratization and rationalization institutionalize the disadvantage in formal job description, job ladders, and patterns of pay progression. See Barnett, Baron, and Stuart (2000) for example.

7
women allocate more effort to child care and housework, and exert less effort on each hour of
market work and seek less demanding work (Becker 1985). More recent variants of this line
of theorizing include behavioral models of the gender gap in promotion tournament with the
gender difference in preferences for competition and risk (e.g., Booth and Nolen, 2012 and
Niederle and Vesterlund (2007).
The second explanation attributes the differences to taste-based discrimination or
statistical discrimination (Becker 1957, Phelps 1972, Arrow 1973, Lazear and Rosen 1990).
Later works extend the statistical discrimination model to focus on more specific aspects of
the gender gap in promotion. For instance, Booth, Francesconi, and Frank (2003) focus on the
limited outside job opportunities for female managers due to their demanding obligations at
home and show that promotion is accompanied by smaller pay raise for women than for men.
Most recent works explore the dynamics of the statistical discrimination model and derive
somewhat more mixed predictions on the gender gap in promotion (Fryer, 2007 and Bjerk,
2008).
Recent evidence on the gender gap in promotion is rather limited mostly due to the
scarcity of the data suitable for testing alternative hypotheses concerning the gender gap in
promotion. Blau and DeVaro (2006), using the Multi-City Study of Urban Inequality, find
that gender differences in the odds of promotion still remain even after accounting for job
performance, occupation, and detailed firm characteristics. Their work reinforces the view
8
that some form of discrimination may be at work behind the gender differences. Similar
results are also found by McCue 1996; Cobb-Clark 2001; and Frederiksen and Kato 2016.
Most recently Smith, Smith, and Verner (2013) take advantage of detailed and reliable
registry data from Denmark and confirm that the significant gender gap in the odds of
promotion to top management is still pervasive and that such gender gap cannot be explained
fully by a variety of individual and firm characteristics.
As mentioned, the literature on the gender pay gap is immense. We refer to only a few
recent contributions to the literature that are of particular relevance to our study. Among other
things, a number of researchers started to pay particular attention to the importance of the
gender difference in working hours as a major culprit for the persistent gender wage gap. For
example, Bertrand, Goldin and Katz (2010) use a panel of MBAs from the University of
Chicago find that much of the gender pay gap can be accounted for by career interruptions
due to parenting and short working hours. More recently similar evidence on the importance
of the gender difference in working hours for the gender pay gap is found for a more general
sample of workers (Cha and Weeden, 2013 for the U.S. and Frederisen, Kato, and Smith 2015
for Denmark) and for the population of all employees at a large manufacturing firm in Japan
(Kato, Kawaguchi and Owan, 2013). Goldin (2014) also shows that occupations
characterized by high returns to overwork are also those with the largest gender gap in
earnings. Taking a step forward, Cortes and Pan (2014) have shown that low-skilled

9
immigration leads to a reduction in the gender gap in weekly hours worked, as well as the
gender pay gap, particularly in occupations that disproportionately reward longer hours of
work.
On our reading of the literature, although there are a plenty of circumstantial evidence,
no rigorous attempt has been made to examine the gender difference in working hours as a
possible culprit for the gender gap in promotion although we are certainly not the first to
suggest the possibility that the gender gap in hours may account for the gender difference in
promotion. For instance, Bardsley and Sherstyuk (2006)’s theoretical work considers possible
linkage between rat race and glass ceiling in an overlapping generation model of rat race with
the agent becoming the principal after promoted successfully in an continuous organization
such as law firms in the U.S.. More recently Gicheva (2013), after presenting rigorous
evidence on the relationships between working hours and wage growth (and promotion) in
general, provide additional insight on the gender gap in pay and promotion in the context of
her dynamic labor supply model. In fact, in developing our empirical strategy to yield
evidence that is consistent with our model, we draw on her approach.2
In the next section we present the model, and demonstrate its utility by deriving
2 Gicheva (2013) finds that the relationship between hours and wage growth is non-linear—for workers who put in 48 hours per week or more, working 5 extra hours per week increases annual wage growth by 1 percent, but when hours are less than 48, the average effect is zero. She also shows that working five extra hours per week increases the probability of receiving a promotion by more than 2.5%. We will identify similar non-linear relationships between hours and promotion odds. However unlike Gicheva (2013), we study the gender differences in the relationships between hours and promotion odds explicitly and uncover significant gender differences.

10
numerical examples from the model which will help providing a coherent interpretation of
stylized facts about international differences in the gender gaps in the labor market. In section
3, from the model (signaling regime), we derive a prediction concerning the gender difference
in the hours-promotion linkage and provide econometric evidence that is consistent with the
prediction. Concluding remarks are given in section 4.
2. The Theory
2.1 Set up
There are many firms and workers in a competitive labor market. Firms can enter the
market without cost. All workers are employed for two periods. We assume the discount rate
to be zero. Workers are different in their commitment level and their ability—learning
capability.
A worker’s commitment level 𝑏𝑏 determines his/her disutility of working long hours
with 𝑏𝑏 ∈ 𝐵𝐵 = {𝑏𝑏1, 𝑏𝑏2, 𝑏𝑏3, . . . , 𝑏𝑏𝑛𝑛} where 𝑏𝑏1 < 𝑏𝑏2 <. . < 𝑏𝑏𝑛𝑛. More precisely, Type-𝑖𝑖’s utility is
given by 𝑤𝑤1 + 𝑤𝑤2 −𝑐𝑐ℎ𝑏𝑏𝑖𝑖
where wt is the wage in period t, c is the cost parameter, and h is the
overtime working hours. Let 𝑞𝑞𝑖𝑖 be the probability that 𝑏𝑏 = 𝑏𝑏𝑖𝑖. A worker’s ability or learning
capability is denoted by 𝑎𝑎∈{𝑎𝑎𝐻𝐻, 𝑎𝑎𝐿𝐿} where 𝑎𝑎𝐿𝐿 < 𝑎𝑎𝐻𝐻. The ability affects the probability that
he/she gets promoted to a manager 𝜇𝜇(𝑎𝑎, 𝛿𝛿) and the speed of learning-by-doing 𝑓𝑓(𝑎𝑎) where
11
𝛿𝛿 is the amount of training provided by the employer. Let p be the share of the workers with
ability 𝑎𝑎𝐻𝐻.
A worker become privately informed about his/her commitment level 𝑏𝑏𝑖𝑖 (or type i)
after the worker enters the firm and its distribution {𝑞𝑞𝑖𝑖} is public knowledge. A worker’s
OJT ability is initially unknown for all participants (even for the worker himself/herself) but
is revealed to the firm soon after the entry but not to the worker. The key assumption in the
model is that the firm can share this private information with the worker in order to influence
his/her choice of hours of work. We assume that, when private information on the worker’s
OJT ability is shared with the worker, the employer can verify the accuracy of the
information with sufficient persuasive evidence. In other words, although concealing the
information is feasible, presenting fabricated information is not allowed. Let 𝑠𝑠 ∈ {𝑅𝑅,𝑁𝑁} be
the information revelation strategy where s = R indicates that the firm truthfully signals 𝑎𝑎𝐻𝐻
or 𝑎𝑎𝐿𝐿 while s = N indicates that the firm sends no signal. We assume that the firm can
commit to its information revelation policy.
When workers are employed, workers produce output by working in each period. In
the first period, they are assigned to easy jobs and their marginal productivity is constant and
independent of their ability and the same across firms. Then, their output depends only on the
number of hours worked. We assume workers produce 𝑦𝑦1 = 𝑥𝑥1 + 𝑚𝑚ℎ, where 𝑥𝑥1 is the

12
productivity during regular hours which is constant, 𝑚𝑚 > 0 is the marginal productivity of
overtime work, and ℎ is the overtime working hours in period 1.
In the second period, the worker gets promoted with the probability 𝜇𝜇(𝑎𝑎, 𝛿𝛿) and
produces 𝑦𝑦2 = 𝑥𝑥2 + 2𝑓𝑓(𝑎𝑎)ℎ + 2𝑅𝑅(𝑏𝑏) whereas those who do not get promoted (with the
probability 1- 𝜇𝜇(𝑎𝑎, 𝛿𝛿)) produce 𝑦𝑦2 = 𝑥𝑥2 + 2𝑓𝑓(𝑎𝑎)ℎ. 𝑥𝑥2 is again constant. Note that overtime
work done by a young worker positively affect the productivity when he/she gets older. So,
we assume learning-by-doing here. Their ability is fully revealed to the workers themselves
perhaps as a result of training before the production starts in the second period. We assume
𝑓𝑓(𝑎𝑎𝐻𝐻) > 𝑓𝑓(𝑎𝑎𝐿𝐿), 𝜇𝜇(𝑎𝑎𝐻𝐻, 𝛿𝛿) > 𝜇𝜇(𝑎𝑎𝐿𝐿 ,𝛿𝛿), 𝜇𝜇𝛿𝛿 > 0, 𝜇𝜇𝛿𝛿𝛿𝛿 < 0, and 𝑅𝑅(𝑏𝑏) is increasing in 𝑏𝑏.
Simply said, workers who have high learning capability are more likely to be qualified for
managerial jobs (𝜇𝜇 is increasing in 𝑎𝑎) and more committed managers generate more value (R
is increasing in b).
Note that the worker’s learning ability and his/her overtime working hours in period
1 are complementary in the second-period productivity, which gives the employer an
incentive to reveal the worker’s ability to the worker himself/herself in period 1. The firm can
increase the probability that a worker is qualified for a managerial position by training the
worker (i.e. 𝜇𝜇𝛿𝛿 > 0) with the cost 𝜅𝜅(𝛿𝛿) where 𝜅𝜅(𝛿𝛿) is increasing and convex in 𝛿𝛿. We
argue that workers who receive managerial training experience a wider range of tasks and
thus become more capable of identifying the cause of a problem and better coordinating with
13
other workers (for theory and evidence on the importance of job rotation and broadening the
scope of human capital for appointments to top management, see Gibbons and Waldman.
2004, Lazear, 2012, and Frederiksen and Kato, 2016)
In our model, the long-term contract is not feasible. When hiring workers, a firm can
only offer a first-period base wage 𝑤𝑤𝐵𝐵. We assume that the regular working hours ℎ is
determined exogenously by working hour regulations, whereas the overtime hourly wage is
also legally determined by 𝑤𝑤𝑂𝑂𝑂𝑂= ρ⋅ 𝑤𝑤𝐵𝐵/ℎ. Therefore, the first-period wage is given by
𝑤𝑤1 = 𝑤𝑤𝐵𝐵 + 𝑤𝑤𝑂𝑂𝑂𝑂ℎ. Note that the training level δ is not part of the initial contract and we
assume that the firm cannot commit to a specific level of δ. Also that, since the workers’
commitment type and ability type are unknown for all participants before the firm hires them,
it is impossible to screen out the workers through designing the base wage and information
revelation policy. Then, in competitive labor market the equilibrium base wage is simply
pinned down as to make the expected profit of the firm to be zero.
In the second period, the firm and the worker bargain over wage. Note that at this
point, there is no asymmetric information between the firm and the worker. We assume that
skills acquired through learning-by-doing and managerial training are firm-specific and those
who quit at the beginning of the second period produce 𝑥𝑥2 by working for other firms.
Assuming the Nash bargaining solution, the second period wage is determined by 𝑤𝑤2 = 𝑥𝑥2 +
𝑓𝑓(𝑎𝑎)ℎ + 𝑅𝑅(𝑏𝑏) for managers and 𝑤𝑤2 = 𝑥𝑥2 + 𝑓𝑓(𝑎𝑎)ℎ for regular workers.

14
As we state earlier, the worker’s ability is the employer’s private information in the
first period. The firm has to decide whether to feedback this ability information to the worker
or not. Our key assumption is that the firm can commit to its feedback policy—either
information revelation (early selection) or non-information revelation (late selection). We
postulate that the reputation mechanism works until some parameter change makes it
profitable for the firm to switch. Otherwise, the firm often has an incentive to reveal the
information to a high-ability worker and hide it from low-ability one (or vice versa).
The game flow is depicted in Figure 1:
1. Firms offer base wage 𝑤𝑤𝐵𝐵 to workers in the labor market and the workers decide
whether to accept it or not. A worker who accepts the contact enters the firm. Firms
also decide on their feedback policy (either information revelation or non-information
revelation).
2. In the first period:
(a) each worker recognizes his/her commitment level b;
(b) the firm observes each hired worker’s ability to acquire human capital on the
job and decides whether to reveal this assessment to the worker or not; and
(c) after receiving the assessment, the worker chooses hours of work and earns a
wage according to the contract.
3. In the second period:

15
(a) the firm provides each worker with a certain amount of training δ and the size
of δ is determined by the firm, based on its assessment of the worker ability
and the hours of work in the first period;
(b) workers are promoted with the probability 𝜇𝜇(𝑎𝑎, 𝛿𝛿);
(c) the firm and the worker bargain over the wage and hours of work after the
worker’s ability and commitment type are known to both parties; and
(d) the worker works and the wage is paid out.
Note that the worker does not make any decisions in the second period. The above game of
flow is illustrated in Figure 1.
The solution concept we use is the notion of perfect Bayesian equilibrium, which
requires the following elements:
(i) the firm’s feedback policy s and its strategy in training δ∗(𝑎𝑎,ℎ) maximize the firm’s
expected profit given the belief function 𝜆𝜆(𝑏𝑏|𝑎𝑎,ℎ, 𝑠𝑠);
(ii) a worker’s strategy in choosing working hours ℎ(𝑠𝑠,𝑎𝑎, 𝑏𝑏) maximizes the worker’s utility;
and
(iii) the belief function 𝜆𝜆(𝑏𝑏|𝑎𝑎,ℎ, 𝑠𝑠) is consistent with ℎ(𝑠𝑠,𝑎𝑎, 𝑏𝑏); for any i,
𝜆𝜆(𝑏𝑏𝑖𝑖|𝑎𝑎,ℎ, 𝑠𝑠) = �0 if ℎ ∉ ℎ(𝑠𝑠,𝑎𝑎, 𝑏𝑏𝑖𝑖),
𝑞𝑞𝑖𝑖∑ 𝑞𝑞𝑗𝑗ℎ∈ℎ(𝑠𝑠,𝑎𝑎,𝑏𝑏𝑗𝑗)
if ℎ ∈ ℎ(𝑠𝑠,𝑎𝑎, 𝑏𝑏𝑖𝑖)
Note that ℎ(𝑠𝑠,𝑎𝑎, 𝑏𝑏) becomes a set when the maximization problem in (ii) has multiple
solutions.

16
As we explain in more details later, perfect Bayesian equilibrium cannot rule out
some unreasonable equilibria. We refine the set of equilibria by further imposing
D1-Criterion.
2.2 Results
Preliminary
Let 𝑢𝑢(𝑎𝑎, 𝑏𝑏,ℎ, δ) be the utility of the worker with ability a and the commitment type
b when he/she chooses the hours of work ℎ in the first period and the employer provides the
amount of training δ. Then,
𝑢𝑢(𝑎𝑎, 𝑏𝑏,ℎ, 𝛿𝛿) = 𝑤𝑤𝐵𝐵 + ℎ �𝑤𝑤𝑂𝑂𝑂𝑂 + 𝑓𝑓(𝑎𝑎) − 𝑐𝑐𝑏𝑏� + 𝑥𝑥2 + 𝜇𝜇(𝑎𝑎, 𝛿𝛿)𝑅𝑅(𝑏𝑏) (1)
Our baseline scenario is that nobody wants to work overtime if there is no
information asymmetry. The following assumption precisely describes such situation.
Assumption 1: 𝑤𝑤𝑂𝑂𝑂𝑂 + 𝑓𝑓(𝑎𝑎) − 𝑐𝑐𝑏𝑏
< 0 for any 𝑎𝑎 and 𝑏𝑏
Let π(𝑎𝑎, 𝑏𝑏,ℎ, 𝛿𝛿) be the firm profit when the worker’s ability and commitment type
is (a,b), he/she chooses the hours of work ℎ in the first period and the employer provides the
level of training δ. Then,
π(𝑎𝑎, 𝑏𝑏,ℎ, 𝛿𝛿) = 𝑥𝑥1 − 𝑤𝑤𝐵𝐵 + (𝑚𝑚 + 𝑓𝑓(𝑎𝑎) − 𝑤𝑤𝑂𝑂𝑂𝑂)ℎ + 𝜇𝜇(𝑎𝑎, 𝛿𝛿)𝑅𝑅(𝑏𝑏𝑖𝑖) − 𝜅𝜅(𝛿𝛿) (2)
Note that, if 𝑚𝑚 + 𝑓𝑓(𝑎𝑎𝑘𝑘) − 𝑤𝑤𝑂𝑂𝑂𝑂 > 0, overtime work is profitable. We consider both cases
when it is profitable and unprofitable.

17
We solve the model backward. Since the worker does not make any decisions in the
second period, we first solve for the firm’s choice of training. If the firm can observe the
worker’s commitment type 𝑏𝑏 (we later show that a separating equilibrium exist), it solves
𝛿𝛿∗(𝑎𝑎, 𝑏𝑏) = 𝑎𝑎𝑎𝑎𝑎𝑎max𝛿𝛿
𝜇𝜇 (𝑎𝑎, 𝛿𝛿)𝑅𝑅(𝑏𝑏) − 𝜅𝜅(𝛿𝛿)
From the concavity assumed, there is a unique solution. Furthermore, there are some
comparative statics results as follows:
- When 𝜇𝜇𝑎𝑎δ > (<)0, 𝜕𝜕𝛿𝛿∗
𝜕𝜕𝑎𝑎= − 𝜇𝜇𝑎𝑎𝑎𝑎𝑅𝑅(𝑏𝑏)
𝜇𝜇𝑎𝑎𝑎𝑎𝑅𝑅(𝑏𝑏)−𝜅𝜅′′ (𝛿𝛿) > (<)0
- 𝜕𝜕𝛿𝛿∗
𝜕𝜕𝑏𝑏= − 𝜇𝜇𝑎𝑎𝑅𝑅′ (𝑏𝑏)
𝜇𝜇𝑎𝑎𝑎𝑎𝑅𝑅(𝑏𝑏)−𝜅𝜅′′ (𝛿𝛿) > 0 because 𝑅𝑅(𝑏𝑏) is increasing in 𝑏𝑏.
To simplify our notation, let us redefine 𝜇𝜇∗(𝑎𝑎, 𝑏𝑏) ≡ 𝜇𝜇(𝑎𝑎, 𝛿𝛿∗(𝑎𝑎, 𝑏𝑏)). Then,
– 𝜕𝜕𝜇𝜇∗
𝜕𝜕𝑎𝑎= 𝜇𝜇𝑎𝑎(𝑎𝑎, 𝛿𝛿∗) + 𝜇𝜇𝛿𝛿
𝜕𝜕𝛿𝛿∗
𝜕𝜕𝑎𝑎> (<)0 if 𝜇𝜇𝑎𝑎δ > (<)0,
– 𝜕𝜕𝜇𝜇∗
𝜕𝜕𝑏𝑏= 𝜇𝜇𝛿𝛿
𝜕𝜕𝛿𝛿∗
𝜕𝜕𝑏𝑏> 0.
– 𝜕𝜕2𝜇𝜇∗
𝜕𝜕𝑎𝑎𝜕𝜕𝑏𝑏= 𝜇𝜇𝑎𝑎𝛿𝛿
𝜕𝜕𝛿𝛿∗
𝜕𝜕𝑏𝑏+ 𝜇𝜇𝛿𝛿𝛿𝛿
𝜕𝜕𝛿𝛿∗
𝜕𝜕𝑎𝑎𝜕𝜕𝛿𝛿∗
𝜕𝜕𝑏𝑏+ 𝜇𝜇𝛿𝛿
𝜕𝜕2𝛿𝛿∗
𝜕𝜕𝑎𝑎𝜕𝜕𝑏𝑏
= (1+𝜇𝜇𝑎𝑎)𝜇𝜇𝑎𝑎𝑎𝑎𝑅𝑅′(𝑏𝑏)𝜅𝜅′′ (𝛿𝛿)(𝜇𝜇𝑎𝑎𝑎𝑎𝑅𝑅(𝑏𝑏)−𝜅𝜅′′ (𝛿𝛿))2
> (<)0 if 𝜇𝜇𝑎𝑎δ > (<)0
These analyses show that the sign of 𝜇𝜇𝑎𝑎δ determines the key comparative statics
results. We consider both cases, 𝜇𝜇𝑎𝑎δ > 0 (Case 1) and 𝜇𝜇𝑎𝑎δ < 0 (Case 2). Before solving for
the equilibrium, let us discuss the interpretation of the two cases.
First, 𝜇𝜇𝑎𝑎𝛿𝛿 < 0 is a reasonable assumption for Japan’s post-war period of high
growth. During the period, coordinating activities across firms and across businesses in
growing markets was a primary task for managers rather than devising innovations and
18
formulating strategies. The main focus of managerial training was placed on expanding
cross-functional knowledge and developing relations with colleagues and customers. Those
who got promoted were not necessarily those who were smartest or those with highest
leadership skills. Training had an effect of offsetting ability differences. In other words, in the
production function of promotion to management positions, training and ability are two
substitutable inputs.
In contrast, the case of 𝜇𝜇𝑎𝑎𝛿𝛿 > 0 has become a more realistic assumption in recent
years. According to our interview with a senior manager of a leading training company in
Japan, there has been a trend toward more human resources development budget spent on
more selective training programs targeting future leaders and women those aimed at
developing strategies and leadership skills and tailored for high-ability workers over the past
decade or two. As such, the same training benefits high-ability workers more than low-ability
workers. In other words, training and ability are now complementary (rather than
substitutable) inputs for promotion.
Working hours in separating equilibria
We next solve for a Perfect Bayesian equilibrium given the firm’s feedback policy. In
both cases, a separating equilibrium exists in which the commitment type is fully revealed to
the employer. We state our first main results in Proposition 1 and 2.
19
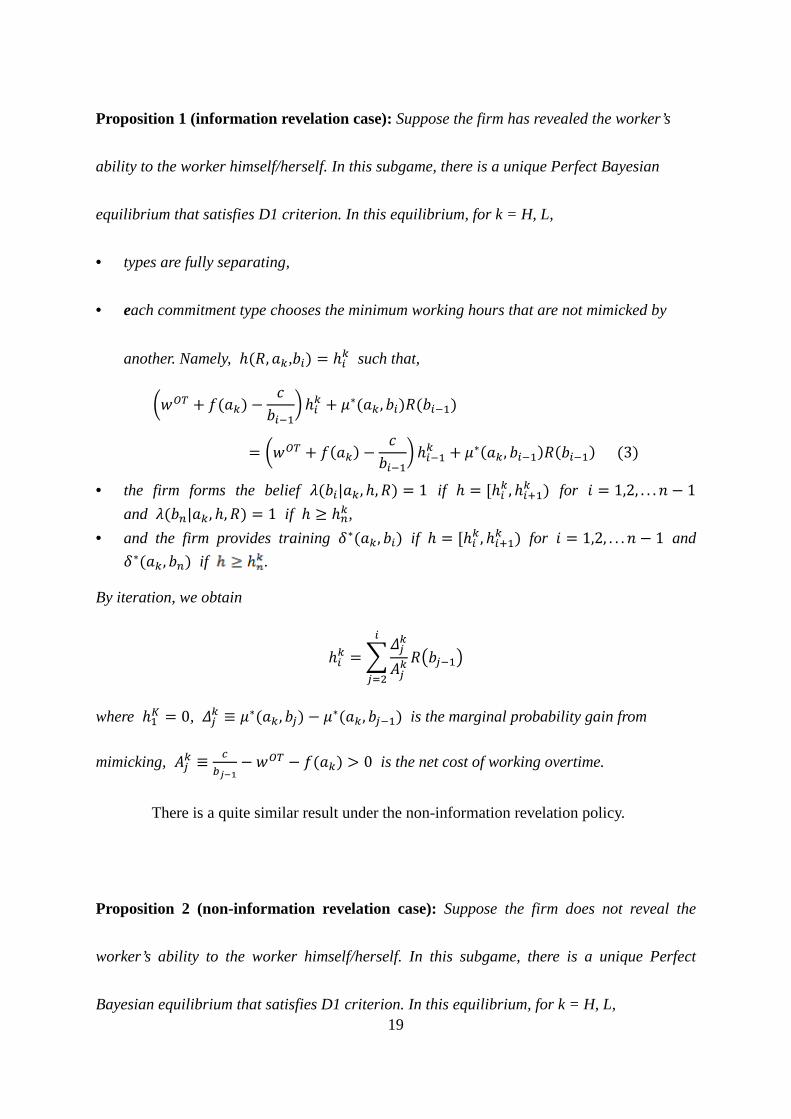
Proposition 1 (information revelation case): Suppose the firm has revealed the worker’s
ability to the worker himself/herself. In this subgame, there is a unique Perfect Bayesian
equilibrium that satisfies D1 criterion. In this equilibrium, for k = H, L,
• types are fully separating,
• each commitment type chooses the minimum working hours that are not mimicked by
another. Namely, ℎ(𝑅𝑅,𝑎𝑎𝑘𝑘,𝑏𝑏𝑖𝑖) = ℎ𝑖𝑖𝑘𝑘 such that,
�𝑤𝑤𝑂𝑂𝑂𝑂 + 𝑓𝑓(𝑎𝑎𝑘𝑘) −𝑐𝑐
𝑏𝑏𝑖𝑖−1� ℎ𝑖𝑖𝑘𝑘 + 𝜇𝜇∗(𝑎𝑎𝑘𝑘,𝑏𝑏𝑖𝑖)𝑅𝑅(𝑏𝑏𝑖𝑖−1)
= �𝑤𝑤𝑂𝑂𝑂𝑂 + 𝑓𝑓(𝑎𝑎𝑘𝑘) −𝑐𝑐
𝑏𝑏𝑖𝑖−1� ℎ𝑖𝑖−1𝑘𝑘 + 𝜇𝜇∗(𝑎𝑎𝑘𝑘, 𝑏𝑏𝑖𝑖−1)𝑅𝑅(𝑏𝑏𝑖𝑖−1) (3)
• the firm forms the belief 𝜆𝜆(𝑏𝑏𝑖𝑖|𝑎𝑎𝑘𝑘,ℎ,𝑅𝑅) = 1 if ℎ = [ℎ𝑖𝑖𝑘𝑘,ℎ𝑖𝑖+1𝑘𝑘 ) for 𝑖𝑖 = 1,2, . . .𝑛𝑛 − 1 and 𝜆𝜆(𝑏𝑏𝑛𝑛|𝑎𝑎𝑘𝑘,ℎ,𝑅𝑅) = 1 if ℎ ≥ ℎ𝑛𝑛𝑘𝑘,
• and the firm provides training 𝛿𝛿∗(𝑎𝑎𝑘𝑘,𝑏𝑏𝑖𝑖) if ℎ = [ℎ𝑖𝑖𝑘𝑘,ℎ𝑖𝑖+1𝑘𝑘 ) for 𝑖𝑖 = 1,2, . . .𝑛𝑛 − 1 and 𝛿𝛿∗(𝑎𝑎𝑘𝑘,𝑏𝑏𝑛𝑛) if .
By iteration, we obtain
ℎ𝑖𝑖𝑘𝑘 = �𝛥𝛥𝑗𝑗𝑘𝑘
𝐴𝐴𝑗𝑗𝑘𝑘
𝑖𝑖
𝑗𝑗=2
𝑅𝑅�𝑏𝑏𝑗𝑗−1�
where ℎ1𝐾𝐾 = 0, 𝛥𝛥𝑗𝑗𝑘𝑘 ≡ 𝜇𝜇∗(𝑎𝑎𝑘𝑘,𝑏𝑏𝑗𝑗) − 𝜇𝜇∗(𝑎𝑎𝑘𝑘,𝑏𝑏𝑗𝑗−1) is the marginal probability gain from
mimicking, 𝐴𝐴𝑗𝑗𝑘𝑘 ≡𝑐𝑐
𝑏𝑏𝑗𝑗−1− 𝑤𝑤𝑂𝑂𝑂𝑂 − 𝑓𝑓(𝑎𝑎𝑘𝑘) > 0 is the net cost of working overtime.
There is a quite similar result under the non-information revelation policy.
Proposition 2 (non-information revelation case): Suppose the firm does not reveal the
worker’s ability to the worker himself/herself. In this subgame, there is a unique Perfect
Bayesian equilibrium that satisfies D1 criterion. In this equilibrium, for k = H, L,

20
• types are fully separating,
• the worker with the commitment type 𝑏𝑏𝑖𝑖 chooses the minimum working hours that
cannot be mimicked by the worker with 𝑏𝑏𝑖𝑖−1 and the working hour is independent of the
ability type. Namely, ℎ(𝑁𝑁, 𝑎𝑎𝐻𝐻, 𝑏𝑏𝑖𝑖) = ℎ(𝑁𝑁,𝑎𝑎𝐿𝐿 , 𝑏𝑏𝑖𝑖) = ℎ𝑖𝑖𝑁𝑁 such that,
�𝑤𝑤𝑂𝑂𝑂𝑂 + 𝑝𝑝𝑓𝑓(𝑎𝑎𝐿𝐿) + (1 − 𝑝𝑝)𝑓𝑓(𝑎𝑎𝐻𝐻) −𝑐𝑐
𝑏𝑏𝑖𝑖−1� ℎ𝑖𝑖𝑁𝑁 + �𝑝𝑝𝜇𝜇∗(𝑎𝑎𝐿𝐿, 𝑏𝑏𝑖𝑖) + (1 − 𝑝𝑝)𝜇𝜇∗(𝑎𝑎𝐻𝐻, 𝑏𝑏𝑖𝑖)�𝑅𝑅�𝑏𝑏𝑗𝑗−1�
= �𝑤𝑤𝑂𝑂𝑂𝑂 + 𝑝𝑝𝑓𝑓(𝑎𝑎𝐿𝐿) + (1 − 𝑝𝑝)𝑓𝑓(𝑎𝑎𝐻𝐻) −𝑐𝑐
𝑏𝑏𝑖𝑖−1� ℎ𝑖𝑖−1𝑁𝑁
+ �𝑝𝑝𝜇𝜇∗(𝑎𝑎𝐿𝐿, 𝑏𝑏𝑖𝑖−1) + (1 − 𝑝𝑝)𝜇𝜇∗(𝑎𝑎𝐻𝐻,𝑏𝑏𝑖𝑖−1)�𝑅𝑅�𝑏𝑏𝑗𝑗−1� (4)
• the firm forms the belief 𝜆𝜆(𝑏𝑏𝑖𝑖|𝑎𝑎𝑘𝑘,ℎ,𝑁𝑁) = 1 if ℎ = [ℎ𝑖𝑖𝑁𝑁 ,ℎ𝑖𝑖+1𝑁𝑁 ) for 𝑖𝑖 = 1,2, . . .𝑛𝑛 − 1 and 𝜆𝜆(𝑏𝑏𝑛𝑛|𝑎𝑎𝑘𝑘,ℎ,𝑁𝑁) = 1 if ℎ ≥ ℎ𝑛𝑛𝑁𝑁,
• and the firm provides training 𝛿𝛿∗(𝑎𝑎𝑘𝑘,𝑏𝑏𝑖𝑖) if ℎ = [ℎ𝑖𝑖𝑁𝑁 ,ℎ𝑖𝑖+1𝑁𝑁 ) for 𝑖𝑖 = 1,2, . . .𝑛𝑛 − 1 and 𝛿𝛿∗(𝑎𝑎𝑘𝑘,𝑏𝑏𝑛𝑛) if ℎ ≥ ℎ𝑛𝑛𝑁𝑁.
By iteration, we obtain
ℎ𝑖𝑖𝑁𝑁 = �𝛥𝛥𝑗𝑗𝑁𝑁
𝐴𝐴𝑗𝑗𝑁𝑁
𝑖𝑖
𝑗𝑗=2
𝑅𝑅�𝑏𝑏𝑗𝑗−1�
where ℎ1𝑁𝑁 = 0,𝛥𝛥𝑗𝑗𝑁𝑁 ≡ 𝑝𝑝 �𝜇𝜇∗�𝑎𝑎𝐿𝐿 ,𝑏𝑏𝑗𝑗� − 𝜇𝜇∗�𝑎𝑎𝐿𝐿 , 𝑏𝑏𝑗𝑗−1��+ (1 − 𝑝𝑝) �𝜇𝜇∗�𝑎𝑎𝐻𝐻, 𝑏𝑏𝑗𝑗� − 𝜇𝜇∗�𝑎𝑎𝐻𝐻, 𝑏𝑏𝑗𝑗−1��
is the marginal probability gain from mimicking, 𝐴𝐴𝑗𝑗𝑁𝑁 ≡ 𝑝𝑝𝐴𝐴𝑗𝑗𝐿𝐿 + (1 − 𝑝𝑝)𝐴𝐴𝑗𝑗𝐻𝐻 = 𝑐𝑐𝑏𝑏𝑗𝑗−1
− 𝑤𝑤𝑂𝑂𝑂𝑂 −
𝑝𝑝𝑓𝑓(𝑎𝑎𝐿𝐿)− (1 − 𝑝𝑝)𝑓𝑓(𝑎𝑎𝐻𝐻) > 0 is the net cost of working overtime.
The proofs are presented in the Appendix.
D1-criterion is necessary to rule out equilibria that are supported by unreasonable
beliefs. For example, consider a pooling equilibrium where all types choose ℎ = 0. This
could constitutes a perfect Bayesian Nash equilibrium with the belief that anybody who

21
deviates from this action has the lowest commitment. However, suppose somebody deviates
from this equilibrium strategy (i.e. ℎ = 0) and work overtime. The type of workers who are
most likely to benefit from this deviation is the one who has the highest commitment (i.e. 𝑏𝑏𝑛𝑛
or lowest disutility). If the employer believes that only those with 𝑏𝑏𝑛𝑛 deviate, they are better
off by deviating than in the equilibrium if the overtime work hours are not excessively high.
Hence, the above pooling equilibrium does not survive D1-criterion.
How D1 criterion works can be illustrated by Figure 2. Consider three commitment
types 𝑏𝑏1, 𝑏𝑏2, and 𝑏𝑏3, and suppose that their equilibrium strategies are to choose ℎ1𝑘𝑘 ,ℎ2𝑘𝑘, and
ℎ3𝑘𝑘, respectively. The indifference curves for each type are drawn in the chart. Note that the
slopes of the indifference curves are decreasing in the worker’s commitment type because,
from equations (3) and (4), 𝑑𝑑𝛿𝛿𝑑𝑑ℎ
=𝑐𝑐𝑏𝑏𝑖𝑖−𝑤𝑤𝑂𝑂𝑂𝑂−𝑓𝑓(𝑎𝑎𝑘𝑘)𝜕𝜕𝜕𝜕𝜕𝜕𝑎𝑎𝑅𝑅(𝑏𝑏𝑖𝑖)
, which is decreasing in 𝑏𝑏𝑖𝑖. Suppose a worker
whose commitment type is unknown for the employer has worked x hours where ℎ2𝑘𝑘 < 𝑥𝑥 <
ℎ3𝑘𝑘. Which type of workers are more likely to deviate from their equilibrium strategy and
choose x? Note that the commitment type i will deviate if the firm’s resultant choice of
training exceeds 𝑃𝑃𝑖𝑖, which is the point on type i’s indifference curve corresponding to the
hours worked x. Namely, the commitment type i is indifference between 𝛿𝛿∗ (𝑎𝑎, 𝑏𝑏𝑖𝑖) and 𝑃𝑃𝑖𝑖.
As the figure shows, if some types find it beneficial to deviate to working x hours, it must be
type 2 because 𝑃𝑃2 < 𝑃𝑃3 < 𝑃𝑃1. This means that the commitment type 2 is most likely to
deviate. If deviation comes only from the commitment type 2, the firm will offer the original

22
level of training 𝛿𝛿∗ (𝑎𝑎, 𝑏𝑏2). Since 𝛿𝛿∗ (𝑎𝑎, 𝑏𝑏2) < 𝑃𝑃2, this deviation by type 2 does give the
worker a higher payoff than their equilibrium payoff, which means that the equilibrium in
Proposition 1 and 2 survive D1-criterion.
Next, we characterize the working hours in the equilibrium.
Lemma 1 When Assumption 1 holds, ℎ𝑖𝑖𝐿𝐿 < ℎ𝑖𝑖𝑁𝑁 < ℎ𝑖𝑖𝐻𝐻 for any 𝑖𝑖 in case 1 (i.e. 𝜇𝜇𝑎𝑎δ > 0) and
ℎ𝑖𝑖𝐻𝐻 < ℎ𝑖𝑖𝑁𝑁 < ℎ𝑖𝑖𝐿𝐿 for any 𝑖𝑖 if 𝑓𝑓(𝑎𝑎𝐻𝐻) − 𝑓𝑓(𝑎𝑎𝐿𝐿) is small enough in case 2 (i.e. 𝜇𝜇𝑎𝑎δ < 0).
Proof: We first show 𝛥𝛥𝑗𝑗𝐿𝐿
𝐴𝐴𝑗𝑗𝐿𝐿 −
𝛥𝛥𝑗𝑗𝐻𝐻
𝐴𝐴𝑗𝑗𝐻𝐻 < 0 for any 𝑗𝑗 in case 1.
• 𝐴𝐴𝑗𝑗𝐿𝐿 > 𝐴𝐴𝑗𝑗𝐻𝐻 from the assumption 𝑓𝑓(𝑎𝑎𝐿𝐿) < 𝑓𝑓(𝑎𝑎𝐻𝐻).
• Δ𝑗𝑗𝐿𝐿 < Δ𝑗𝑗𝐻𝐻 if 𝜕𝜕2𝜇𝜇∗
𝜕𝜕𝑎𝑎𝜕𝜕𝑏𝑏> 0 (case 1). Then,
𝛥𝛥𝑗𝑗𝐿𝐿
𝐴𝐴𝑗𝑗𝐿𝐿 −
𝛥𝛥𝑗𝑗𝐻𝐻
𝐴𝐴𝑗𝑗𝐻𝐻 < 0. Thus,
ℎ𝑖𝑖𝐿𝐿 − ℎ𝑖𝑖𝑁𝑁 = ��𝛥𝛥𝑗𝑗𝐿𝐿
𝐴𝐴𝑗𝑗𝐿𝐿−𝛥𝛥𝑗𝑗𝑁𝑁
𝐴𝐴𝑗𝑗𝑁𝑁�
𝑖𝑖
𝑗𝑗=2
𝑅𝑅(𝑏𝑏𝑗𝑗−1) = (1 − 𝑝𝑝)�𝐴𝐴𝑗𝑗𝐻𝐻
𝐴𝐴𝑗𝑗𝑁𝑁
𝑖𝑖
𝑗𝑗=2
�𝛥𝛥𝑗𝑗𝐿𝐿
𝐴𝐴𝑗𝑗𝐿𝐿−𝛥𝛥𝑗𝑗𝐻𝐻
𝐴𝐴𝑗𝑗𝐻𝐻� 𝑅𝑅(𝑏𝑏𝑗𝑗−1) < 0
ℎ𝑖𝑖𝐻𝐻 − ℎ𝑖𝑖𝑁𝑁 = ��𝛥𝛥𝑗𝑗𝐻𝐻
𝐴𝐴𝑗𝑗𝐻𝐻−𝛥𝛥𝑗𝑗𝑁𝑁
𝐴𝐴𝑗𝑗𝑁𝑁�
𝑖𝑖
𝑗𝑗=2
Δ𝑅𝑅(𝑏𝑏𝑗𝑗−1) = 𝑝𝑝�𝐴𝐴𝑗𝑗𝐿𝐿
𝐴𝐴𝑗𝑗𝑁𝑁
𝑖𝑖
𝑗𝑗=2
�𝛥𝛥𝑗𝑗𝐻𝐻
𝐴𝐴𝑗𝑗𝐻𝐻−𝛥𝛥𝑗𝑗𝐿𝐿
𝐴𝐴𝑗𝑗𝐿𝐿� 𝑅𝑅(𝑏𝑏𝑗𝑗−1) > 0
Similarly, in case 2, when 𝑓𝑓(𝑎𝑎𝐻𝐻) − 𝑓𝑓(𝑎𝑎𝐿𝐿) is small enough, 𝛥𝛥𝑗𝑗𝐿𝐿
𝐴𝐴𝑗𝑗𝐿𝐿 −
𝛥𝛥𝑗𝑗𝐻𝐻
𝐴𝐴𝑗𝑗𝐻𝐻 > 0. This concludes the
proof. Q.E.D.
Lemma 1 implies that more capable workers, if they are told so, work longer when
the training is more selective while less capable workers, if they are told so, work longer
when the training is more leveling. In case when the workers are not informed of their ability,
the hours of work are chosen between the levels for the high-ability workers and the
low-ability ones when the worker ability is revealed. The next proposition compared the

23
average working hours between the information revelation and non-information revelation
policies.
Proposition 3: Under Assumption 1, 𝑝𝑝∑ 𝑞𝑞𝑖𝑖𝑛𝑛𝑖𝑖=1 ℎ𝑖𝑖𝐿𝐿 + (1 − 𝑝𝑝)∑ 𝑞𝑞𝑖𝑖𝑛𝑛
𝑖𝑖=1 ℎ𝑖𝑖𝐻𝐻 > ∑ 𝑞𝑞𝑖𝑖𝑛𝑛𝑖𝑖=1 ℎ𝑖𝑖𝑁𝑁 holds
in case 1. In case 2, on the other hand, 𝑝𝑝∑ 𝑞𝑞𝑖𝑖𝑛𝑛𝑖𝑖=1 ℎ𝑖𝑖𝐿𝐿 + (1 − 𝑝𝑝)∑ 𝑞𝑞𝑖𝑖𝑛𝑛
𝑖𝑖=1 ℎ𝑖𝑖𝐻𝐻 < ∑ 𝑞𝑞𝑖𝑖𝑛𝑛𝑖𝑖=1 ℎ𝑖𝑖𝑁𝑁 if
𝑓𝑓(𝑎𝑎𝐻𝐻) − 𝑓𝑓(𝑎𝑎𝐿𝐿) is small enough.
Proof: In case 1, since 𝐴𝐴𝑗𝑗𝐻𝐻 − 𝐴𝐴𝑗𝑗𝐿𝐿 = 𝑓𝑓(𝑎𝑎𝐿𝐿)− 𝑓𝑓(𝑎𝑎𝐻𝐻) < 0 and 𝛥𝛥𝑗𝑗𝐿𝐿
𝐴𝐴𝑗𝑗𝐿𝐿 −
𝛥𝛥𝑗𝑗𝐻𝐻
𝐴𝐴𝑗𝑗𝐻𝐻 < 0 for any 𝑗𝑗,
𝑝𝑝ℎ𝑗𝑗𝐿𝐿 + (1 − 𝑝𝑝)ℎ𝑗𝑗𝐻𝐻 − ℎ𝑗𝑗𝑁𝑁 = 𝑝𝑝(1 − 𝑝𝑝)�𝐴𝐴𝑗𝑗𝐻𝐻 − 𝐴𝐴𝑗𝑗𝐿𝐿
𝐴𝐴𝑗𝑗𝑁𝑁
𝑖𝑖
𝑗𝑗=2
�𝛥𝛥𝑗𝑗𝐿𝐿
𝐴𝐴𝑗𝑗𝐿𝐿−𝛥𝛥𝑗𝑗𝐻𝐻
𝐴𝐴𝑗𝑗𝐻𝐻� 𝑅𝑅�𝑏𝑏𝑗𝑗−1� > 0
Therefore, 𝑝𝑝∑ 𝑞𝑞𝑖𝑖𝑛𝑛𝑖𝑖=1 ℎ𝑖𝑖𝐿𝐿 + (1 − 𝑝𝑝)∑ 𝑞𝑞𝑖𝑖𝑛𝑛
𝑖𝑖=1 ℎ𝑖𝑖𝐻𝐻 > ∑ 𝑞𝑞𝑖𝑖𝑛𝑛𝑖𝑖=1 ℎ𝑖𝑖𝑁𝑁. The proof is similar for case 2.
Q.E.D.
This result comes from the complementarity among the ability, training, commitment,
and working hours. When information on worker ability is revealed, knowing that a greater
amount of training is provided, more capable workers work longer to signal their
commitment so that the firm further increases the amount of training securing the opportunity
of promotion. Less capable workers work less but the average working hours are still higher
than when the ability information is not revealed. The result changes when 𝜇𝜇𝑎𝑎δ < 0 under
which ability and training are substitute in producing promotion. Although the worker still
has an incentive to work longer to signal their commitment, this signaling has a lower return
for capable workers. Therefore, the average working hours are shorter when the ability
information is revealed.
24
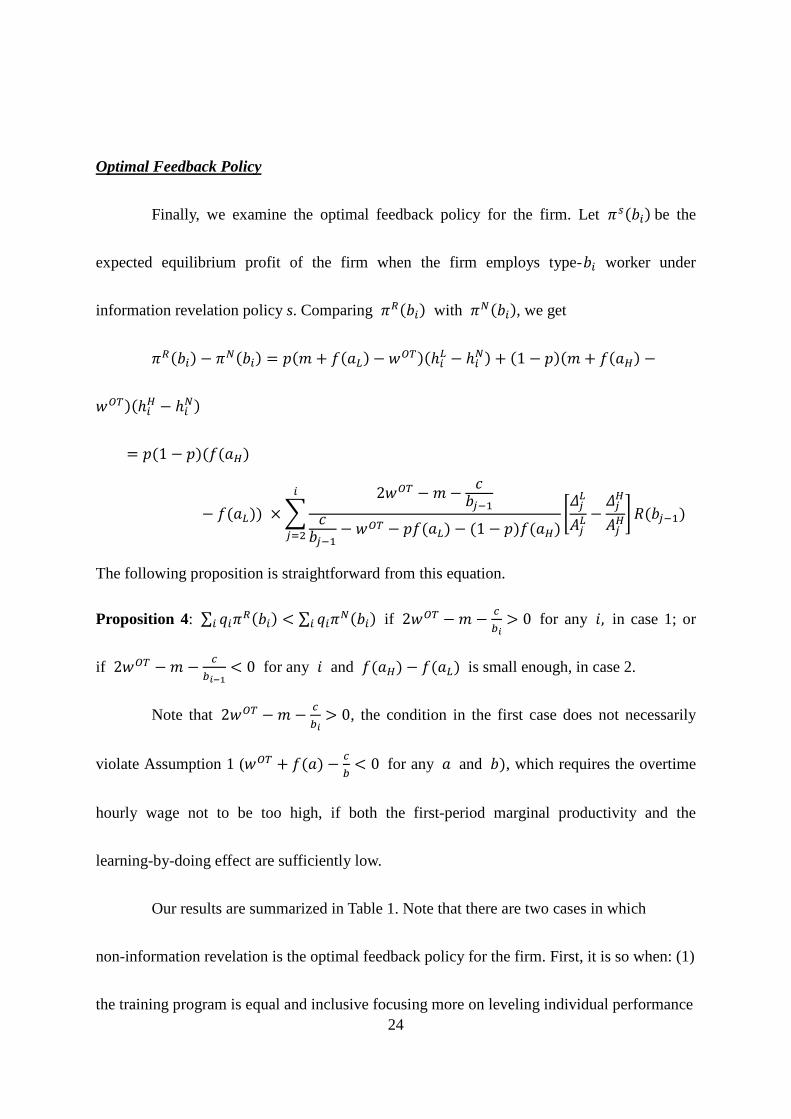
Optimal Feedback Policy
Finally, we examine the optimal feedback policy for the firm. Let 𝜋𝜋𝑠𝑠(𝑏𝑏𝑖𝑖) be the
expected equilibrium profit of the firm when the firm employs type-𝑏𝑏𝑖𝑖 worker under
information revelation policy s. Comparing 𝜋𝜋𝑅𝑅(𝑏𝑏𝑖𝑖) with 𝜋𝜋𝑁𝑁(𝑏𝑏𝑖𝑖), we get
𝜋𝜋𝑅𝑅(𝑏𝑏𝑖𝑖) − 𝜋𝜋𝑁𝑁(𝑏𝑏𝑖𝑖) = 𝑝𝑝(𝑚𝑚 + 𝑓𝑓(𝑎𝑎𝐿𝐿)− 𝑤𝑤𝑂𝑂𝑂𝑂)(ℎ𝑖𝑖𝐿𝐿 − ℎ𝑖𝑖𝑁𝑁) + (1 − 𝑝𝑝)(𝑚𝑚 + 𝑓𝑓(𝑎𝑎𝐻𝐻) −
𝑤𝑤𝑂𝑂𝑂𝑂)(ℎ𝑖𝑖𝐻𝐻 − ℎ𝑖𝑖𝑁𝑁)
= 𝑝𝑝(1 − 𝑝𝑝)(𝑓𝑓(𝑎𝑎𝐻𝐻)
− 𝑓𝑓(𝑎𝑎𝐿𝐿)) × �2𝑤𝑤𝑂𝑂𝑂𝑂 − 𝑚𝑚 − 𝑐𝑐
𝑏𝑏𝑗𝑗−1𝑐𝑐𝑏𝑏𝑗𝑗−1
− 𝑤𝑤𝑂𝑂𝑂𝑂 − 𝑝𝑝𝑓𝑓(𝑎𝑎𝐿𝐿) − (1 − 𝑝𝑝)𝑓𝑓(𝑎𝑎𝐻𝐻)
𝑖𝑖
𝑗𝑗=2
�𝛥𝛥𝑗𝑗𝐿𝐿
𝐴𝐴𝑗𝑗𝐿𝐿−𝛥𝛥𝑗𝑗𝐻𝐻
𝐴𝐴𝑗𝑗𝐻𝐻� 𝑅𝑅(𝑏𝑏𝑗𝑗−1)
The following proposition is straightforward from this equation.
Proposition 4: ∑ 𝑞𝑞𝑖𝑖𝜋𝜋𝑅𝑅(𝑏𝑏𝑖𝑖)𝑖𝑖 < ∑ 𝑞𝑞𝑖𝑖𝜋𝜋𝑁𝑁(𝑏𝑏𝑖𝑖)𝑖𝑖 if 2𝑤𝑤𝑂𝑂𝑂𝑂 − 𝑚𝑚 − 𝑐𝑐𝑏𝑏𝑖𝑖
> 0 for any 𝑖𝑖, in case 1; or
if 2𝑤𝑤𝑂𝑂𝑂𝑂 − 𝑚𝑚 − 𝑐𝑐𝑏𝑏𝑖𝑖−1
< 0 for any 𝑖𝑖 and 𝑓𝑓(𝑎𝑎𝐻𝐻) − 𝑓𝑓(𝑎𝑎𝐿𝐿) is small enough, in case 2.
Note that 2𝑤𝑤𝑂𝑂𝑂𝑂 − 𝑚𝑚 − 𝑐𝑐𝑏𝑏𝑖𝑖
> 0, the condition in the first case does not necessarily
violate Assumption 1 (𝑤𝑤𝑂𝑂𝑂𝑂 + 𝑓𝑓(𝑎𝑎) − 𝑐𝑐𝑏𝑏
< 0 for any 𝑎𝑎 and 𝑏𝑏), which requires the overtime
hourly wage not to be too high, if both the first-period marginal productivity and the
learning-by-doing effect are sufficiently low.
Our results are summarized in Table 1. Note that there are two cases in which
non-information revelation is the optimal feedback policy for the firm. First, it is so when: (1)
the training program is equal and inclusive focusing more on leveling individual performance

25
differences, resulting in offsetting ability differences (i.e. 𝜇𝜇𝑎𝑎𝛿𝛿 < 0); (2) learning by doing is
not drastically different between more capable and less capable workers (i.e. 𝑓𝑓(𝑎𝑎𝐻𝐻) − 𝑓𝑓(𝑎𝑎𝐿𝐿)
is small); and (3) the overtime hourly wage 𝑤𝑤𝑂𝑂𝑂𝑂 is sufficiently low. Another case is when:
(1) the training program is selective focusing more on developing capable leaders (i.e.
𝜇𝜇𝑎𝑎𝛿𝛿 > 0); and (2) the overtime hourly wage 𝑤𝑤𝑂𝑂𝑂𝑂 is sufficiently high. In all other quadrants,
revealing the worker ability is optimal. As we have argued earlier, during the post-war period
of high growth, training opportunities were offered equally to all employees and helped to
improve the standard and to level performance differences. Furthermore, many workers
voluntarily worked without overtime pay because such efforts were rewarded by promotion.
According to our model, non-information revelation was presumably optimal in those days.
In recent years, we believe that there have been two major changes. First, our
interview with a senior manager at a leading training company and our casual conversations
with Japanese HR managers reveal that Japanese firms are reducing the budget for periodical
cohort training programs and increasing more selective training programs designed to make
high-performers more productive. If our interpretation is correct, we now have 𝜇𝜇𝑎𝑎𝛿𝛿 > 0.
Second, overtime regulations are being more strictly enforced and fewer non-managerial
workers are willing to work voluntarily without overtime pay because of limited promotion
opportunities. According to Table 1, these changes may still imply that non-information
revelation is optimal.
26
There is another view, however. Overtime pay is not calculated for an expanding set
of workers: (1) discretionary working hour system which target professionals; and (2)
deemed overtime pay system under which fixed overtime pay is paid out to those whose
working hours are hard to monitor such as sales people. White-collar exemption is also being
considered to exempt high-income white-collar workers from overtime pay regulations. If so,
at least for those whose marginal pay for overtime work is very low, information revelation
may be optimal lately.
Efficiency
Note that, if there is no asymmetric information, the working hours should be minimal
ℎ(𝑎𝑎, 𝑏𝑏𝑖𝑖, 𝑠𝑠) = ℎ for all i. Then, the efficient level of training is obtained by solving
max𝛿𝛿
2𝜇𝜇 (𝑎𝑎, 𝛿𝛿)𝑅𝑅(𝑏𝑏) − 𝜅𝜅(𝛿𝛿).
Given the information asymmetry, the second best can be achieved by a long-term contract.
The efficient information revelation policy minimize the total cost of working hours
𝑐𝑐 ∑ 𝑞𝑞𝑖𝑖ℎ𝑖𝑖𝑏𝑏𝑖𝑖
𝑛𝑛𝑖𝑖=1 with the incentive compatibility constraints for each type. The employer should
solve 𝛿𝛿∗(𝑎𝑎, 𝑏𝑏) = 𝑎𝑎𝑎𝑎𝑎𝑎max𝛿𝛿 2𝜇𝜇 (𝑎𝑎, 𝛿𝛿)𝑅𝑅(𝑏𝑏) − 𝜅𝜅(𝛿𝛿). Without long-term contracts feasible, the
total cost of working hours won’t be minimized.
Heterogeneity among work groups
In the rest of the discussion, we assume 𝜇𝜇𝑎𝑎𝛿𝛿 > 0 because we believe that the inequality best

27
describes the current situation of human resource development policy among Japanese firms.
With this condition, revealing the firm’s private information on the worker’s ability to
himself/herself encourages high-ability workers work longer but low-ability workers work
shorter.
Proposition 4 implies that 𝜋𝜋𝑅𝑅(𝑏𝑏𝑖𝑖) > 𝜋𝜋𝑁𝑁(𝑏𝑏𝑖𝑖) is more likely for low commitment
types whereas 𝜋𝜋𝑅𝑅(𝑏𝑏𝑖𝑖) < 𝜋𝜋𝑁𝑁(𝑏𝑏𝑖𝑖) is more likely for high commitment types. We illustrate this
comparison in Figure 3. Therefore, if low-commitment (high-commitment) types have a high
share of the total population, information revelation (non-information revelation) is optimal.
Suppose it is feasible to employ different information revelation policies for
demographically clearly distinct groups: men and women. The pattern we observe in the
gender division of household labor in Japan appears to suggest that the distribution of the cost
of working long hours is quite different between men and women. Fuwa (2006) reports that
among 22 industrialized nations Japanese husbands share housework with their wives the
least, and argues and provide evidence that gender ideology plays a significant role in
explaining cross-national variations in gender division of household labor. It is plausible that
male workers in Japan are more likely to enjoy greatly reduced cost of long working hours
due to social norm that favors the division of household labor that assigns more tasks to
women. The other side of the coin is that female workers in Japan are more likely to face
greatly elevated cost of long working hours due to the same social norm. As such, it is
28
probably safe to assume that work hour flexibility (i.e. parameter b) has larger density for
higher values with men whereas it has larger density for lower values with women—Japan is
subject to great inequality in the cost of working long hours between men and women.3 In
sum, low-commitment types with higher cost of working long hours are likely to have a
higher share among women than among men in Japan.
It follows that adopting non-information revelation policy for women is likely to be
suboptimal because there are more “low commitment” types among women than among men.
If firms can adopt different information revelation policies for men and women, they might
adopt information revelation policy for women while choosing non-information revelation for
men. This is especially likely in the current policy situation where the Abe administration is
pressing the industry to increase the number of female managers. Then, we would observe
distinctly different promotion patterns between male and female workers. Figure 4 illustrates
such a likely pattern. If women are informed of their ability, more capable women work
longer hours, knowing that the return to doing so is higher than otherwise while less able
women work shorter hours, knowing that their chance of promotion is lower than otherwise
(thus any voluntary overtime work is likely to be a waste of time). There will be a substantial
difference in the promotion rate between the two groups. In contrast, there will be little
dichotomy between high- and low-ability men since there is no information revelation for
3 For stylized facts about the status of Japanese women in the labor market in international perspective, see Steinberg and Nakane, 2012
29
men, and men decide on their working hours without knowing their ability types. To the
extent to which commitment types and ability types are uncorrelated, the slope of the
hours-promotion profile should be flatter.
The discussion so far generates the following testable implication.
Hypothesis: The incidence of promotion should be more highly correlated with hours of
work for women than for men.
3. Evidence from an Econometric Case Study of a Large Japanese Firm
We provide evidence from our econometric case study of a Japanese manufacturing firm
in support of this hypothesis—the relationship between working hours and promotion rates is
stronger for women than for men.
Specifically we use longitudinal personnel records from a large Japanese manufacturing
company, which employs about 6,000 regular employees within Japan, including affiliated
firms, 10,000 employees domestically, and well over 20,000 employees worldwide.4 We are
granted access to detailed personnel records between FY2004 and FY2009 on all domestic
employees directly employed by the firm. It is one of the first firms which participated in our
IAG (Industry-Academia-Government) personnel data repository project.5
4 Our confidentiality agreement with the firm prohibits us from revealing the name of the firm as well as further details on their product lines 5 Our partner, Works Applications, Co. is a major ERP software package provider in Japan with approximately 300 listed firms in their user network. The Research Institute of Economy, Trade and Industry (RIETI), a think tank established by the Ministry of Economy, Trade, and Industry for
30
Important employee characteristics available in the dataset include gender, date of birth,
date of hire, nationality, education, and marital status among others.
Although data are available from FY2004 in general, our analysis in this paper needs to
be restricted to the period between FY2005 and FY2009 since working hour information is
available only after FY2004. Employee performance was evaluated annually using a
seven-point scale (SS, S, A1, A2, A3, B, and C).
A major advantage of our dataset over many data used in the literature is the availability
of the accurate job assignment history data that allow us to define promotion with precision,
which is our key dependent variable. In addition, the job assignment data enable us to find
who takes a parental leave and when, and most importantly when he/she returns from his/he
parental leave.
We first describe employee composition by gender and marital status. Since pregnant
women are entitled to maternity leave of fourteen weeks (eight weeks immediately after
delivery is mandatory) and we have the precise records of maternity leave since FY1999, we
can utilize the incidence of maternity leave as an indicator of having small children. Table 2
shows the composition of single/married men and women, and married women who took at
policy-oriented research provided us with technical resources to store the data in a secure environment. In this project, almost all personnel records stored in the firm’s human resource management system were deposited into RIETI’s high-security server (with the exception of sensitive identity information such as names and addresses). Researchers analyze the data remotely using RIETI’s virtual private network.

31
least one maternity leave since FY1999.6 As Table 2 shows, the share of female employees
hovered around 11% during the period under observation, which is lower than the 16-18%
average of large manufacturing firms with 1,000 employees or more according to Basic
Survey on Wage Structure from the Ministry of Health, Labour and Welfare. As in the case of
most large Japanese firms in manufacturing, overall separation rates at the firm are low, and
we did not find much significant correlation between separation rates and individual worker
characteristics.
Table 3 shows the raw (unadjusted for observable individual characteristics) gender pay
gap. Compared to married men, single men, single women, married women without small
children, and married women with small children earn 28%, 36%, 32%, and 43% less,
respectively.7 Since married men are 5-10 years older than the other groups on average, a
substantial portion of the gaps may come from differences in the amount of human capital
accumulated through working in the firm. Furthermore, women, especially those who are
married and have small children, work substantially fewer hours than men. Single women,
married women without small children, and married women with small children work 7%,
12%, and 22% fewer hours, respectively, than married men, while single men do not work 6 We include a very small number of single women with small children in this category, for they will be subject to at least the same level of motherhood/ immobility penalty as married women with small children. In principle if a woman with small children is entering the firm, our definition of married women with small children will fail to count her unless she has another childbirth after entering the firm and hence take a mandatory maternity leave. Based on our interviews with the firm’s HR managers, we are reasonably confident that our definition of married women with small children will capture most if not all of married women with small children at the firm. 7 There is a companion paper which analyzes the same data and studies the nature and scope of the gender pay gap of the firm (Kato, Kawaguchi, and Owan, 2013)
32
significantly different hours than married men. Since we excluded records in the years when
employees took at least one month of leave, low numbers for women with small children are
not the result of parental leave. One relevant company policy that contributed to the observed
difference is that women with children less than three years old can reduce their work hours
to 6 hours per day. The provision of this policy or an equivalent substitute is required by the
2002 Amendment to the 1992 Child Care and Family Care Leave Act.8
Table 4 shows the changes in the distribution of education levels by gender over the past
two decades. Due to a major shift in this firm’s hiring policy in the 1990s, the gender gap in
educational background has narrowed substantially since then. In the 1990s, the share of
college graduates (including those with graduate degrees but excluding those with 2-year
college degrees) was 43% for men and 18% for women. In the 2000s, this gender gap
reversed with the share becoming 52% for men and 59% for women.9 As the firm slashed
administrative assistant jobs, it stopped hiring women with 2-year college degrees or less.
Instead, it recruited more women with 4-year college degrees, master’s degrees, and more
women from vocational schools.10 Almost all men with high school diplomas are hired as
production workers, and they are not expected to decline in number as drastically as women
8 See Asai (2013) for the efficacy of parental policy reforms in Japan. 9 See Abe (2010) for Japan’s increasing female enrollment in college and a rise in the recruitment of college-educated women by large firms following the enactment of Equal Employment Opportunity Act (EEOA) in 1986. 10 The company also beefed up its hiring of medical technicians from medical vocational schools as it expanded its line of healthcare products.

33
with similar educational background, unless the company decides to shut down many of its
domestic plants.
The higher education level of women should naturally lead to an increase of women in
upper-level jobs in the hierarchy. The firm has a job grade system where each job is assigned
a specific job grade level based on an evaluation of the job content value. Each job grade
level corresponds to a particular pay range, according to which monthly salary is set (100
percent for managers and 50% for non-managers). Therefore, moving up to a higher job
grade level is associated with a discrete pay raise, and as such is announced and more
importantly recorded as a promotion.
Figure 5 illustrates the promotion ladders observed in the company. Solid lines indicate
typical paths for those who get promoted and dotted lines represent atypical but not unusual
cases of promotion. College graduates on the management track are first assigned to J1 but
quickly move up to J2. Almost all members of this group move to SA and SB, and the
majority eventually move to the management ranks of G6 and up. Production workers start at
the same level (J1) but more slowly climb to J2 and J3. Some highly talented blue-collar
workers may be considered for managerial positions and they will be typically assigned to J4.
Some of them may move up to the management track (e.g. SA, SB or G6) or get promoted to
level JH, which is the level of foremen. Administrative support staff members who typically
34
have high-school or two-year college degrees can move up to J2 and J3 levels, but it is
extremely rare for them to get promoted to managerial positions.
Table 5 shows the distribution of the workforce across job grade levels, gender and
marital status in FY2004 and FY2009. Since our dataset does not include employees who left
the firm before FY2004, the precise employee composition can only be calculated for the
period between FY2004 and FY2009. Although a higher percentage of women are observed
in higher level positions in FY2009 than in FY2004, there are still far fewer women in
upper-level positions. For example, as of FY2009, only 3.4% of managers are filled by
women. Among senior managers, only 19 (1.6%) are women. None of the women with small
children are managers. Given that 11% of its workforce are women, this share of women in
managerial positions is disproportionately low.
We first examine how the odds of promotion differ between men and women. Table 6
shows the frequency of promotion by gender and marital status. We compress the original 11
job grade levels (J1 to G3) to 8 levels in order to study the white-collar track and blue-collar
track on a comparable scale. In this table, promotions from J2 to J3 for production workers
and administrative assistants are not counted as promotions because these two job grades are
combined as one job level in our analysis. High odds of promotion at the entry level J1 are
not surprising because the company has a policy of assigning new college graduates to J1 and
quickly move them all up to J2 after one year. Low odds of promotion from the J2/J3 level to
35
the SA/J4 level are not surprising, either, for many production workers and administrative
support staff members with high school and 2-year college degrees are stuck at the J2/J3 level
with no further promotions. Although talented production workers still have prospects of
getting promoted to foremen or plant management positions, such a career track is very
limited for female administrative assistants, who, as a result, show very low promotion rates
at this level.
Although women have a higher promotion rate at the SA/J4 level than men, this
advantage disappears once women reach the SB/JH level, and they continue to lag behind
men. For example, although 17% of men at grade G5 get promoted to G4 every year on
average, only 8% of women at the same grade get promoted in a similar manner. Since three
quarters of women at G5 grade are married, this slow promotion of women may be associated
with a constraint on work hours or lack of geographic mobility.
Since there is a rather well-defined and well-established promotion ladder at the firm, we
can estimate a logit model of promotion, conditional on the current job level as a function of
a number of explanatory variables---a major advantage of an econometric case study as
opposed to conventional econometric studies with data gathered from a variety of firms with
less precise definitions of promotions. Table 7 reports the logit estimates of the most
parsimonious specification with female, age, tenure, and education, and year effects for the
full sample as well as for the subsample of college graduates. For the full sample, we find
36
evidence for gender gap in promotion, i.e., the estimated coefficient on Female is negative
and statistically significant at the 5 percent level. Note that for the college graduate sample
the estimated coefficient on Female is found to be still negative yet not statistically
significant.
Table 8 presents a less parsimonious model with additional explanatory
variables—maternity experience, lagged hours worked, lagged reduced hours, lagged night
hours as well as evaluations. To test whether the effect on promotion of lagged hours worked
differ significantly between women and men, we also consider an interaction term involving
lagged hours worked and Female (since reduced hours are used almost exclusively by women
and night hours by men, they are not interacted with Female). Multiple maternity leaves
indicator is not included due to the rarity of promoted women with such multiple maternity
leave spells.
We find consistently for all specifications that hours worked in the previous year are
positively associated with the odds of promotion. Most important (for the objective of the
paper) is that such positive associations between hours worked and promotion are also found
(consistently for all specifications) to be significantly stronger for women than for men,
supporting our testable hypothesis developed in the previous section.
Using the U.S. National Longitudinal Survey of Youth, Gicheva (2013) finds that the
relationship between hours worked and wage growth is non-linear—only workers who put

37
forth more hours than a certain threshold see the positive impact of working additional hours.
It is plausible that the relationship between hours worked and the odds of promotion may be
also non-linear in our case. To investigate such possible non-linearity, we re-estimate the
model, transforming Hours (continuous variable) to a categorical variable Hours Range
which takes a value of 1 if hours worked is less than 1800 hours per year; 2 if it is 1800 or
more but less than 1900, 3 if it is 1900 or more but less than 2000, 4 if it is 2000 or more but
less than 2100, 5 if it is 2100 or more but less than 2200, 6 if it is 2200 or more but less than
2400, and 7 if it is 2400 hours or more.
We calculate the predicted odds of promotion for each categorical value of Hours Range
evaluated at means for all other explanatory variables for women and men separately, and
plot such predicted promotion odds in Figure 5. As expected, the hours-promotion profiles for
all employees as well as for college graduates are indeed steeper for women than for men.
For women, the benefit of working extra hours in the previous year for the worker’s
promotion prospect is particularly large when hours worked exceed 2200 hours per year.
Note that Figure 5 appears to suggest that the odds of promotion are generally higher for
women than for men. However, this is mostly due to the fact that Figure 5 is drawn using
mean values calculated separately for women and men. Since women’s promotion is more
concentrated in lower job levels than men’s promotion and the odds of promotion are higher
in such lower job levels, women’s predicted promotion odds are artificially higher than men’s
38
promotion odds. When we use an alternative Marginal Effects at the Means (MEM) approach
(or using mean values calculated for all employees including both women and men),
reassuringly women’s predicted promotion odds appear lower than men’s predicted
promotion odds.
However, the observed stark difference between men and women in the association
between hours and the subsequent promotion rates which support our hypothesis derived
from the theory may be simply reflecting job segregation. Many scholars including Blau and
Kahn (2000) and Goldin (2014) have reported that women were concentrated in low-paying
jobs such as administrative support and service occupations.11 Some college-educated
women may be assigned to jobs with little training and promotion prospects while others join
college-educated men for management trainee jobs. If women in the former group have no
reasonable promotion prospects, they will not work long hours. Combining members from
the two groups may result in a high correlation between the odds of promotion and hours
worked.
To rule out this alternative interpretation of job segregation by gender, we further
estimate the model with organizational unit fixed effects. In our case firm, a typical
organization unit is a section of 3-9 people for white-collar workers and a group of people
11 Historically in Japan, women were typically assigned to administrative support and clerical jobs called ippan-shoku (general job), while college educated men were assigned to management trainee positions called sogo-shoku (composite job). Although such differentiation was prohibited by the EEOA, a similar pattern of task assignment may still remain.
39
working on the same production line or support function (up to 90) for blue-collar workers.
The organizational unit fixed effects can account for the gender gaps in promotion caused by
such job segregation within the firm, to the extent to which good jobs and bad jobs are
separated into different organizational units.
As an efficient way to control for such organizational unit fixed effects in the logit
framework, we employ a fixed effects logit model in which organizational unit fixed effects
are accounted for by the number of promotion within each unit. Reassuringly the results
change little when we use such a fixed effects logit model instead of a standard logit model.12
The observed high correlation between the odds of promotion and hours worked among
women does not appear to be driven by job segregation by gender within the firm.
4. Conclusions
This paper has presented a new model of promotion within the firm which sheds new
light on interplay between working hours and the odds of subsequent promotion. The key
feature of our model is two different sources of asymmetric information—disutility from
working long hours and OJT ability (ability to accumulate valuable human capital on the job
through learning by doing). The level of the employee’s disutility from working long hours is
known to the worker but not to the firm at the beginning of his/her tenure at the firm---the
12 These results as well as all other unreported results are available upon request from the corresponding author.

40
level of the employee’s disutility from working long hours is his/her private information. The
worker’s OJT ability is initially unknown to both parties when he/she starts working at the
firm, yet it is revealed to the employer earlier than the worker himself/herself at a relatively
early stage of his/her tenure. Long hours signal the worker’s commitment or low disutility
from doing so, which determines the surplus produced when the worker is promoted. Thus,
the firm provides the worker with managerial training only after observing the worker’s hours
worked. The firm’s decision to provide training also depends on its private information about
the worker’s OJT ability, which also affects the second period productivity when the worker
gets promoted. Upon completion of training, the firm then promotes the worker.
Key to our result is the firm’s decision to reveal or conceal its private information on the
worker’s OJT ability. Assuming that training and ability are complementary inputs in the
production of promotion, on the one hand, information revelation motivates the worker to
work long hours if he/she has high OJT ability, for the marginal return to signal his/her
commitment becomes greater. On the other hand, those who do not receive positive feedback
(or deemed lacking high OJT ability) will be discouraged and choose shorter working hours.
In contrast, concealing its private information on the worker’s OJT ability helps to retain the
minimal incentive, and those with low level of disutility from working long hours will work
long hours regardless of their OJT ability.
The firm’s optimal choice of information revelation policy crucially depends on three
41
factors. First, the nature of training matters. If the training programs are designed to target
high-performers and thus complement worker ability in raising the odds of promotion,
information revelation of worker ability motivates workers to work longer. In contrast, if the
training programs mainly target the left tail of the ability distribution of workers, aimed at
developing uniform skill distribution among workers, training and ability will be substitutable
inputs in raising the odds of promotion. It follows that information revelation will discourage
workers from working longer.
Second, overtime hourly pay determines both the signaling cost for the worker and the
marginal return to information revelation for the firm. If overtime pay is zero, the firm will
always want to maximize working hours and signaling becomes more effective for the worker.
In contrast, if overtime pay is very high, the firm will try to minimize overtime work hours
and the incentive to mimic the higher commitment type becomes greater for the worker.
Thirdly, the distribution of the disutility of working long hours also significantly affect
the marginal return to information revelation. Assuming that training complements ability in
raising the odds of promotion, if a majority of workers have high disutility of working long
hours, information revelation tends to be optimal because it reduces the number of hours
worked for low-ability workers while having a positive but relatively limited impact on the
number of hours worked of high-ability workers. In contrast, if a majority of workers have
relatively low costs, concealing information to ease the rat-race competition tends to be
42
efficient because the complementarity between ability and commitment causes excessively
long working hours. Since the late selection (non-information revelation) is more profitable
for the firm when a majority of its employees have low cost of working long hours, unequal
gender division of household labor and low labor participation of female workers in Japan
must have encouraged the adoption of non-information revelation policy in the country. This
also means that a recent increase in the number of college-graduate female workers in
full-time positions may make the early selection or information revelation efficient. It might
also be possible that firms adopt different information revelation policies between men and
women. Such a difference in the firm’s treatment of men and women, if exists, will
potentially lead to a different pattern in the relationship between working hours and
promotion for men and women.
Using this model, we have demonstrated that, under a reasonable set of conditions, the
correlation between working hours and subsequent promotion will be stronger for women
than for men. Our analysis of longitudinal personnel data from a large Japanese
manufacturing firm has yielded rigorous econometric evidence that is consistent with this
prediction—we have found significantly stronger relationship between hours and promotion
rates for women than for men.

43
Appendix
We will provide the proof of proposition 1. Preparing for the proof, we introduce some
notations and provide useful lemmas.
Fix the worker’s type k. Consider the set of working hour 𝐻𝐻 = {ℎ1, . . . , ℎ𝑚𝑚} such that
ℎ1 < ℎ2 <. . . < ℎ𝑚𝑚 which are chosen by ability-𝑎𝑎𝑘𝑘 worker in an equilibrium with strictly
positive probability and the amount of training 𝛿𝛿𝑘𝑘(ℎ) that the firm provides to the worker
who choses ℎ ∈ 𝐻𝐻. For ℎ,ℎ′ ∈ 𝐻𝐻, it have to be satisfied that if ℎ′ < ℎ then 𝛿𝛿𝑘𝑘(ℎ′) <
𝛿𝛿𝑘𝑘(ℎ) (otherwise no one chooses ℎ).
We say an equilibrium is a partition equilibrium if both type-𝑏𝑏′ and type-𝑏𝑏′′ worker
choose the same working hour ℎ and 𝑏𝑏′′ > 𝑏𝑏′ then any type- 𝑏𝑏 worker such that
𝑏𝑏′ < 𝑏𝑏 < 𝑏𝑏′′ also chooses ℎ . The following lemma says any equilibrium is either
completely separating equilibrium or partition equilibrium.
Lemma A1. Any pooling equilibrium is the partition equilibrium.
proof. Consider equilibrium working hours ℎ, ℎ′ and ℎ′′ such as ℎ′ < ℎ < ℎ′′. Because
𝜕𝜕2𝑢𝑢𝜕𝜕𝛿𝛿𝜕𝜕𝑏𝑏
> 0 and 𝜕𝜕2𝑢𝑢𝜕𝜕ℎ𝜕𝜕𝑏𝑏
> 0, if type-𝑏𝑏′ prefers (ℎ, 𝛿𝛿𝑘𝑘(ℎ)) to (ℎ′, 𝛿𝛿𝑘𝑘(ℎ′)), for 𝑏𝑏 > 𝑏𝑏′ type-𝑏𝑏
also prefer (ℎ, 𝛿𝛿𝑘𝑘(ℎ)) to (ℎ′, 𝛿𝛿𝑘𝑘(ℎ′)) . Also that, if type- 𝑏𝑏′′ prefers (ℎ, 𝛿𝛿𝑘𝑘(ℎ)) to
(ℎ′′, 𝛿𝛿𝑘𝑘(ℎ′′)), for 𝑏𝑏 < 𝑏𝑏′′ type-𝑏𝑏 also prefer (ℎ, 𝛿𝛿𝑘𝑘(ℎ)) to (ℎ′′, 𝛿𝛿𝑘𝑘(ℎ′′)). Thus, if type-𝑏𝑏′
and type-𝑏𝑏′′ choose ℎ, type-𝑏𝑏 chooses ℎ. �
Consider an off-path working hour ℎ𝑑𝑑. Let 𝑥𝑥𝑖𝑖 be the equilibrium working hour which

44
type-𝑏𝑏𝑖𝑖 worker chooses. Because 𝜕𝜕𝑢𝑢𝜕𝜕𝛿𝛿
> 0 and 𝜕𝜕𝑢𝑢𝜕𝜕ℎ
< 0 , there exist an unique training
𝛿𝛿𝑖𝑖𝑖𝑖𝑑𝑑(ℎ𝑑𝑑) such that type-𝑏𝑏𝑖𝑖 worker is indifferent between his/her equilibrium outcome
(𝑥𝑥𝑖𝑖, 𝛿𝛿(𝑥𝑥𝑖𝑖)) and (ℎ𝑑𝑑, 𝛿𝛿𝑖𝑖𝑖𝑖𝑑𝑑(ℎ𝑑𝑑)). The following lemma is useful in applying D1 criterion.
Lemma A2. (i) For ℎ < ℎ𝑑𝑑 < ℎ′, 𝛿𝛿𝑖𝑖𝑖𝑖𝑑𝑑(ℎ𝑑𝑑) < 𝛿𝛿𝑗𝑗𝑖𝑖𝑑𝑑(ℎ𝑑𝑑) for 𝑖𝑖, 𝑗𝑗 ∈ (𝑙𝑙|𝑥𝑥(𝑙𝑙) ≤ ℎ) and 𝑖𝑖 > 𝑗𝑗,
and 𝛿𝛿𝑗𝑗𝑖𝑖𝑑𝑑(ℎ𝑑𝑑) < 𝛿𝛿𝑖𝑖𝑖𝑖𝑑𝑑(ℎ𝑑𝑑) for 𝑖𝑖, 𝑗𝑗 ∈ (𝑙𝑙|𝑥𝑥(𝑙𝑙) ≥ ℎ′) and 𝑖𝑖 > 𝑗𝑗, (ii) for ℎ𝑑𝑑 < ℎ1 , 𝛿𝛿1𝑖𝑖𝑑𝑑(ℎ𝑑𝑑) <
𝛿𝛿𝑖𝑖𝑖𝑖𝑑𝑑(ℎ𝑑𝑑) for any 𝑖𝑖 ≠ 1, and (iii) for ℎ𝑚𝑚 < ℎ𝑑𝑑 , 𝛿𝛿𝑛𝑛𝑖𝑖𝑑𝑑(ℎ𝑑𝑑) < 𝛿𝛿𝑖𝑖𝑖𝑖𝑑𝑑(ℎ𝑑𝑑) for any 𝑖𝑖 ≠ 𝑛𝑛.
proof. The former part of (i) holds from the following; for 𝑖𝑖, 𝑗𝑗 ∈ {𝑙𝑙|ℎ(𝑙𝑙) ≤ ℎ} and 𝑖𝑖 > 𝑗𝑗,
0 = 𝑢𝑢(𝑎𝑎𝑘𝑘, 𝑏𝑏𝑖𝑖,ℎ𝑑𝑑 , 𝛿𝛿𝑖𝑖𝑖𝑖𝑑𝑑(ℎ𝑑𝑑)) − 𝑢𝑢(𝑎𝑎𝑘𝑘, 𝑏𝑏𝑖𝑖, 𝑥𝑥𝑖𝑖 , 𝛿𝛿𝑘𝑘(𝑥𝑥𝑖𝑖))
> 𝑢𝑢(𝑎𝑎𝑘𝑘, 𝑏𝑏𝑗𝑗 ,ℎ𝑑𝑑 , 𝛿𝛿𝑖𝑖𝑖𝑖𝑑𝑑(ℎ𝑑𝑑)) − 𝑢𝑢(𝑎𝑎𝑘𝑘, 𝑏𝑏𝑗𝑗, 𝑥𝑥𝑖𝑖, 𝛿𝛿𝑘𝑘(𝑥𝑥𝑖𝑖))
≥ 𝑢𝑢(𝑎𝑎𝑘𝑘, 𝑏𝑏𝑗𝑗 ,ℎ𝑑𝑑 , 𝛿𝛿𝑖𝑖𝑖𝑖𝑑𝑑(ℎ𝑑𝑑)) − 𝑢𝑢(𝑎𝑎𝑘𝑘, 𝑏𝑏𝑗𝑗, 𝑥𝑥𝑗𝑗 , 𝛿𝛿𝑘𝑘(𝑥𝑥𝑗𝑗))
= 𝑢𝑢(𝑎𝑎𝑘𝑘, 𝑏𝑏𝑗𝑗 ,ℎ𝑑𝑑 , 𝛿𝛿𝑖𝑖𝑖𝑖𝑑𝑑(ℎ𝑑𝑑)) − 𝑢𝑢(𝑎𝑎𝑘𝑘,𝑏𝑏𝑗𝑗 ,ℎ𝑑𝑑 , 𝛿𝛿𝑗𝑗𝑖𝑖𝑑𝑑(ℎ𝑑𝑑)).
The first inequality follows from 𝛿𝛿𝑖𝑖𝑖𝑖𝑑𝑑(ℎ𝑑𝑑) > 𝛿𝛿(𝑥𝑥𝑖𝑖), 𝜕𝜕2𝑢𝑢𝜕𝜕𝛿𝛿𝜕𝜕𝑏𝑏
> 0 and 𝜕𝜕2𝑢𝑢𝜕𝜕ℎ𝜕𝜕𝑏𝑏
> 0. Because 𝑢𝑢 is
strictly increasing in 𝛿𝛿, we obtain 𝛿𝛿𝑗𝑗𝑖𝑖𝑑𝑑(ℎ𝑑𝑑) > 𝛿𝛿𝑖𝑖𝑖𝑖𝑑𝑑(ℎ𝑑𝑑). (iii) also hold from above.
The later part of (i) holds from the following; for 𝑖𝑖, 𝑗𝑗 ∈ {𝑙𝑙|ℎ(𝑙𝑙) ≥ ℎ′} and 𝑖𝑖 > 𝑗𝑗,
0 = 𝑢𝑢(𝑎𝑎𝑘𝑘, 𝑏𝑏𝑗𝑗, ℎ𝑑𝑑 , 𝛿𝛿𝑗𝑗𝑖𝑖𝑑𝑑(ℎ𝑑𝑑)) − 𝑢𝑢(𝑎𝑎𝑘𝑘,𝑏𝑏𝑗𝑗 , 𝑥𝑥𝑗𝑗 , 𝛿𝛿𝑘𝑘(𝑥𝑥𝑗𝑗))
> 𝑢𝑢(𝑎𝑎𝑘𝑘, 𝑏𝑏𝑖𝑖,ℎ𝑑𝑑 , 𝛿𝛿𝑗𝑗𝑖𝑖𝑑𝑑(ℎ𝑑𝑑)) − 𝑢𝑢(𝑎𝑎𝑘𝑘, 𝑏𝑏𝑖𝑖, 𝑥𝑥𝑗𝑗 , 𝛿𝛿𝑘𝑘(𝑥𝑥𝑗𝑗))
≥ 𝑢𝑢(𝑎𝑎𝑘𝑘, 𝑏𝑏𝑖𝑖,ℎ𝑑𝑑 , 𝛿𝛿𝑗𝑗𝑖𝑖𝑑𝑑(ℎ𝑑𝑑)) − 𝑢𝑢(𝑎𝑎𝑘𝑘, 𝑏𝑏𝑖𝑖, 𝑥𝑥𝑖𝑖 , 𝛿𝛿𝑘𝑘(𝑥𝑥𝑖𝑖))
= 𝑢𝑢(𝑎𝑎𝑘𝑘,𝑏𝑏𝑖𝑖 ,ℎ𝑑𝑑 , 𝛿𝛿𝑗𝑗𝑖𝑖𝑑𝑑(ℎ𝑑𝑑)) − 𝑢𝑢(𝑎𝑎𝑘𝑘,𝑏𝑏𝑖𝑖 ,ℎ𝑑𝑑 , 𝛿𝛿𝑖𝑖𝑖𝑖𝑑𝑑(ℎ𝑑𝑑)).
The first inequality follows from 𝛿𝛿𝑗𝑗𝑖𝑖𝑑𝑑(ℎ𝑑𝑑) < 𝛿𝛿𝑘𝑘(𝑥𝑥𝑗𝑗), 𝜕𝜕2𝑢𝑢𝜕𝜕𝛿𝛿𝜕𝜕𝑏𝑏
> 0 and 𝜕𝜕2𝑢𝑢𝜕𝜕ℎ𝜕𝜕𝑏𝑏
> 0. Then, we
45
obtain 𝛿𝛿𝑖𝑖𝑖𝑖𝑑𝑑(ℎ𝑑𝑑) > 𝛿𝛿𝑗𝑗𝑖𝑖𝑑𝑑(ℎ𝑑𝑑). (ii) also hold from above. �
We check an equilibrium whether or not to survive D1 criterion as the following two steps.
First, we specify how the firm makes a belief when the firm observes an off-path working
hour. Let 𝑀𝑀𝐵𝐵𝑅𝑅𝑘𝑘(𝜆𝜆𝑘𝑘,ℎ) be the set of the mixed best-response training strategy to the worker
whose working hour is ℎ given the belief 𝜆𝜆𝑘𝑘. Abusing notation, 𝜆𝜆𝑘𝑘(𝑇𝑇|ℎ) also represents
the posterior probability with which the firm believes the worker is in set T. Applying D1
criterion, the firm makes the belief that the deviator is NOT type-𝑏𝑏𝑖𝑖 worker on off-path
working hour ℎ𝑑𝑑 if there exist 𝑗𝑗 ≠ 𝑖𝑖 such that
{𝐷𝐷𝑘𝑘(𝑏𝑏𝑖𝑖,𝐵𝐵,ℎ𝑑𝑑) ∪ 𝐷𝐷𝑘𝑘0(𝑏𝑏𝑖𝑖,𝐵𝐵,ℎ𝑑𝑑)} ⊂ 𝐷𝐷𝑘𝑘�𝑏𝑏𝑗𝑗 ,𝐵𝐵,ℎ𝑑𝑑�
where
𝐷𝐷𝑘𝑘(𝑏𝑏𝑖𝑖,𝐵𝐵,ℎ𝑑𝑑) = � {𝛿𝛿∈ 𝑀𝑀𝐵𝐵𝑅𝑅𝑘𝑘(𝜆𝜆𝑘𝑘,ℎ𝑑𝑑)|𝑢𝑢(𝑎𝑎𝑘𝑘, 𝑏𝑏𝑖𝑖, 𝑥𝑥𝑖𝑖 , 𝛿𝛿𝑘𝑘(𝑥𝑥𝑖𝑖)) < 𝑢𝑢(𝑎𝑎𝑘𝑘, 𝑏𝑏𝑖𝑖,ℎ𝑑𝑑 , 𝛿𝛿)}{𝜆𝜆𝑘𝑘|𝜆𝜆𝑘𝑘(𝐵𝐵|ℎ)=1}
,
which represents the set of mixed best-response training strategy to working hour ℎ𝑑𝑑 and
beliefs concentrated on 𝐵𝐵 that make type-𝑏𝑏𝑖𝑖 worker strictly to prefer to the equilibrium
strategy in the sense of expectation and
𝐷𝐷𝑘𝑘(𝑏𝑏𝑖𝑖,𝐵𝐵,ℎ𝑑𝑑) = � {𝛿𝛿∈ 𝑀𝑀𝐵𝐵𝑅𝑅𝑘𝑘(𝜆𝜆𝑘𝑘,ℎ𝑑𝑑)|𝑢𝑢(𝑎𝑎𝑘𝑘,𝑏𝑏𝑖𝑖, 𝑥𝑥𝑖𝑖 , 𝛿𝛿𝑘𝑘(𝑥𝑥𝑖𝑖)) = 𝑢𝑢(𝑎𝑎𝑘𝑘, 𝑏𝑏𝑖𝑖,ℎ𝑑𝑑 , 𝛿𝛿)}{𝜆𝜆𝑘𝑘|𝜆𝜆𝑘𝑘(𝐵𝐵|ℎ)=1}
,
which represent the set of expected mixed-strategy best-response training strategy that make
type- 𝑏𝑏𝑖𝑖 worker exactly indifferent. Note that
{𝐷𝐷𝑘𝑘(𝑏𝑏𝑖𝑖,𝐵𝐵,ℎ𝑑𝑑) ∪ 𝐷𝐷𝑘𝑘0(𝑏𝑏𝑖𝑖,𝐵𝐵,ℎ𝑑𝑑)} = [𝛿𝛿𝑖𝑖𝑖𝑖𝑑𝑑(ℎ𝑑𝑑),𝛿𝛿∗(𝑎𝑎𝑘𝑘, 𝑏𝑏𝑛𝑛) ] ,
then{𝐷𝐷𝑘𝑘(𝑏𝑏𝑖𝑖,𝐵𝐵, ℎ𝑑𝑑) ∪ 𝐷𝐷𝑘𝑘0(𝑏𝑏𝑖𝑖,𝐵𝐵,ℎ𝑑𝑑)} ⊂ 𝐷𝐷𝑘𝑘(𝑏𝑏𝑗𝑗,𝐵𝐵, ℎ𝑑𝑑) holds if 𝛿𝛿𝑖𝑖𝑖𝑖𝑑𝑑(ℎ𝑑𝑑) > 𝛿𝛿𝑗𝑗𝑖𝑖𝑑𝑑(ℎ𝑑𝑑).
46
Second, we check the type of the worker who is considered as the deviator whether prefers
the deviation to the equilibrium outcome. We define,
𝐵𝐵∗(ℎ𝑑𝑑) = {𝑖𝑖|{𝐷𝐷𝑘𝑘(𝑏𝑏𝑖𝑖,𝐵𝐵,ℎ𝑑𝑑) ∪ 𝐷𝐷0𝑘𝑘(𝑏𝑏𝑖𝑖,𝐵𝐵,ℎ𝑑𝑑)} ⊂ 𝐷𝐷𝑘𝑘(𝑏𝑏𝑗𝑗 ,𝐵𝐵,ℎ𝑑𝑑)∀𝑗𝑗 ≠ 𝑖𝑖}
as the set of the type which the firm consider as the deviators and
Δ∗(𝐵𝐵∗(ℎ𝑑𝑑),ℎ𝑑𝑑) = � {𝛿𝛿 ∈ 𝐵𝐵𝑅𝑅𝑘𝑘(𝜆𝜆𝑘𝑘,ℎ𝑑𝑑)}{𝜆𝜆𝑘𝑘|𝜆𝜆𝑘𝑘(𝐵𝐵∗(ℎ𝑑𝑑)|ℎ𝑑𝑑)=1}
as the set of expected best-response training strategy to ℎ𝑑𝑑 for belief 𝜆𝜆𝑘𝑘(⋅ |ℎ𝑑𝑑) such that
𝜆𝜆𝑘𝑘(𝐵𝐵∗(ℎ𝑑𝑑)|ℎ𝑑𝑑) = 1. The equilibrium does not survive D1 criterion if there exist a type of
worker 𝑏𝑏𝑖𝑖 such that, for some ℎ𝑑𝑑 ∈ 𝐻𝐻,
min∈Δ∗(𝐵𝐵∗(ℎ𝑑𝑑),ℎ𝑑𝑑)
𝑢𝑢 (𝑎𝑎𝑘𝑘,𝑏𝑏𝑖𝑖, ℎ𝑑𝑑 , 𝛿𝛿) > 𝑢𝑢(𝑎𝑎𝑘𝑘,𝑏𝑏𝑖𝑖, 𝑥𝑥𝑖𝑖 , 𝛿𝛿𝑘𝑘(𝑥𝑥𝑖𝑖)).
Proof of Proposition 1
proof. We show that the equilibrium characterized in Proposition 1 is the only equilibrium
that survive D1 criterion under 𝑠𝑠 = 𝑅𝑅.
We first show that, in the equilibrium that survive D1 criterion, the longest hour chosen in
the equilibrium, denoted by ℎ𝑚𝑚, is chosen by only type-𝑏𝑏𝑛𝑛 worker. Suppose not. If more
than two types of worker choose ℎ𝑚𝑚 , then 𝛿𝛿𝑘𝑘(ℎ𝑚𝑚) < 𝛿𝛿∗(𝑎𝑎𝑘𝑘,𝑏𝑏𝑛𝑛). Consider a deviation
strategy ℎ𝑚𝑚 + 𝜖𝜖 , 𝜖𝜖 > 0 . From Lemma A2(iii), 𝐵𝐵∗(ℎ𝑚𝑚 + 𝜖𝜖) = {𝑏𝑏𝑛𝑛} then Δ∗(𝐵𝐵∗(ℎ𝑚𝑚 +
𝜖𝜖),ℎ𝑚𝑚 + 𝜖𝜖) = {𝛿𝛿∗(𝑎𝑎𝑘𝑘,𝑏𝑏𝑛𝑛)} . There is small 𝜖𝜖 such that 𝑢𝑢(𝑎𝑎𝑘𝑘, 𝑏𝑏𝑛𝑛,ℎ𝑚𝑚 + 𝜖𝜖, 𝛿𝛿∗(𝑎𝑎𝑘𝑘,𝑏𝑏𝑛𝑛)) >

47
𝑢𝑢(𝑎𝑎𝑘𝑘,𝑏𝑏𝑛𝑛, ℎ𝑚𝑚, 𝛿𝛿𝑘𝑘(ℎ𝑚𝑚)) then type- 𝑏𝑏𝑛𝑛 worker deviates from the equilibrium. This is
contradiction.
Next, we show that, in the equilibrium that survive D1 criterion, the second longest hour
chosen in the equilibrium, denoted by ℎ𝑚𝑚−1, is chosen by only type-𝑏𝑏𝑛𝑛−1 worker and that
worker is indifferent between ℎ𝑚𝑚 and ℎ𝑚𝑚−1. Suppose he/she is not indifferent, that is,
𝑢𝑢(𝑎𝑎𝑘𝑘,𝑏𝑏𝑛𝑛−1,ℎ𝑚𝑚, 𝛿𝛿𝑘𝑘(ℎ𝑚𝑚)) < 𝑢𝑢(𝑎𝑎𝑘𝑘, 𝑏𝑏𝑛𝑛−1,ℎ𝑚𝑚−1, 𝛿𝛿𝑘𝑘(ℎ𝑚𝑚−1)) . Then, there exist small 𝜖𝜖′ > 0
such that 𝑢𝑢(𝑎𝑎𝑘𝑘, 𝑏𝑏𝑛𝑛−1,ℎ𝑚𝑚 − 𝜖𝜖′, 𝛿𝛿𝑘𝑘(ℎ𝑚𝑚)) < 𝑢𝑢(𝑎𝑎𝑘𝑘, 𝑏𝑏𝑛𝑛−1,ℎ𝑚𝑚−1, 𝛿𝛿𝑘𝑘(ℎ𝑚𝑚−1)) and
𝑢𝑢(𝑎𝑎𝑘𝑘,𝑏𝑏𝑛𝑛, ℎ𝑚𝑚 − 𝜖𝜖′, 𝛿𝛿𝑘𝑘(ℎ𝑚𝑚)) > 𝑢𝑢(𝑎𝑎𝑘𝑘,𝑏𝑏𝑛𝑛,ℎ𝑚𝑚 , 𝛿𝛿𝑘𝑘(ℎ𝑚𝑚)) . This implies 𝛿𝛿𝑛𝑛𝑖𝑖𝑑𝑑(ℎ𝑚𝑚 − 𝜖𝜖′) <
𝛿𝛿𝑛𝑛−1𝑖𝑖𝑑𝑑 (ℎ𝑚𝑚 − 𝜖𝜖′) . Together with Lemma A2(i), we obtain 𝐵𝐵∗(ℎ𝑚𝑚 − 𝜖𝜖′) = {𝑏𝑏𝑛𝑛} and
Δ∗(𝐵𝐵∗(ℎ𝑚𝑚 − 𝜖𝜖′),ℎ𝑚𝑚 − 𝜖𝜖′) = {𝛿𝛿∗(𝑎𝑎𝑘𝑘,𝑏𝑏𝑛𝑛)} , then
𝑢𝑢(𝑎𝑎𝑘𝑘,𝑏𝑏𝑛𝑛, ℎ𝑚𝑚 − 𝜖𝜖′, 𝛿𝛿∗(𝑎𝑎𝑘𝑘, 𝑏𝑏𝑛𝑛)) > 𝑢𝑢(𝑎𝑎𝑘𝑘,𝑏𝑏𝑛𝑛,ℎ𝑚𝑚, 𝛿𝛿𝑘𝑘(ℎ𝑚𝑚)) . Thus, type- 𝑏𝑏𝑛𝑛 worker deviates
from the equilibrium, this is contradiction.
Suppose he/she is indifferent but ℎ𝑚𝑚−1 is chosen by more than two types. Since type-𝑏𝑏𝑛𝑛
chooses ℎ𝑚𝑚, if more than two types of worker choose ℎ𝑚𝑚−1, 𝛿𝛿𝑘𝑘(ℎ𝑚𝑚−1) < 𝛿𝛿∗(𝑎𝑎𝑘𝑘,𝑏𝑏𝑛𝑛−1).
Consider a deviation strategy ℎ𝑚𝑚−1 + 𝜖𝜖′′ < ℎ𝑚𝑚, 𝜖𝜖′′ > 0. Comparing 𝛿𝛿𝑛𝑛𝑖𝑖𝑑𝑑(ℎ𝑚𝑚−1 + 𝜖𝜖′′) and
𝛿𝛿𝑛𝑛−1𝑖𝑖𝑑𝑑 (ℎ𝑚𝑚−1 + 𝜖𝜖′′),
0 = 𝑢𝑢(𝑎𝑎𝑘𝑘, 𝑏𝑏𝑛𝑛−1,ℎ𝑚𝑚, 𝛿𝛿𝑘𝑘(ℎ𝑚𝑚)) − 𝑢𝑢(𝑎𝑎𝑘𝑘, 𝑏𝑏𝑛𝑛−1,ℎ𝑚𝑚−1, 𝛿𝛿𝑘𝑘(ℎ𝑚𝑚−1))
= 𝑢𝑢(𝑎𝑎𝑘𝑘, 𝑏𝑏𝑛𝑛−1,ℎ𝑚𝑚 , 𝛿𝛿𝑘𝑘(ℎ𝑚𝑚)) − 𝑢𝑢(𝑎𝑎𝑘𝑘, 𝑏𝑏𝑛𝑛−1,ℎ𝑚𝑚−1 + 𝜖𝜖′′, 𝛿𝛿𝑛𝑛−1𝑖𝑖𝑑𝑑 (ℎ𝑚𝑚−1 + 𝜖𝜖′′))
< 𝑢𝑢(𝑎𝑎𝑘𝑘, 𝑏𝑏𝑛𝑛,ℎ𝑚𝑚, 𝛿𝛿𝑘𝑘(ℎ𝑚𝑚)) − 𝑢𝑢(𝑎𝑎𝑘𝑘,𝑏𝑏𝑛𝑛,ℎ𝑚𝑚−1 + 𝜖𝜖′′, 𝛿𝛿𝑛𝑛−1𝑖𝑖𝑑𝑑 (ℎ𝑚𝑚−1 + 𝜖𝜖′′))
48
= 𝑢𝑢(𝑎𝑎𝑘𝑘, 𝑏𝑏𝑛𝑛,ℎ𝑚𝑚−1 + 𝜖𝜖′′, 𝛿𝛿𝑛𝑛𝑖𝑖𝑑𝑑(ℎ𝑚𝑚−1 + 𝜖𝜖′′)) − 𝑢𝑢(𝑎𝑎𝑘𝑘,𝑏𝑏𝑛𝑛, ℎ𝑚𝑚−1 + 𝜖𝜖′′, 𝛿𝛿𝑛𝑛−1𝑖𝑖𝑑𝑑 (ℎ𝑚𝑚−1 + 𝜖𝜖′′))
where the first inequality follows from 𝛿𝛿𝑘𝑘(ℎ𝑚𝑚) > 𝛿𝛿𝑛𝑛−1𝑖𝑖𝑑𝑑 (ℎ𝑚𝑚−1 + 𝜖𝜖′′) , 𝜕𝜕2𝑢𝑢𝜕𝜕𝛿𝛿𝜕𝜕𝑏𝑏
> 0 and
𝜕𝜕2𝑢𝑢𝜕𝜕ℎ𝜕𝜕𝑏𝑏
> 0, then we obtain 𝛿𝛿𝑛𝑛𝑖𝑖𝑑𝑑(ℎ𝑚𝑚−1 + 𝜖𝜖′′) > 𝛿𝛿𝑛𝑛−1𝑖𝑖𝑑𝑑 (ℎ𝑚𝑚−1 + 𝜖𝜖′′). Together with Lemma A2(i),
𝐵𝐵∗(ℎ𝑚𝑚−1 + 𝜖𝜖′′) = {𝑏𝑏𝑛𝑛−1} and Δ∗(𝐵𝐵∗(ℎ𝑚𝑚−1 + 𝜖𝜖′′),ℎ𝑚𝑚−1 + 𝜖𝜖′′) = {𝛿𝛿∗(𝑎𝑎𝑘𝑘,𝑏𝑏𝑛𝑛−1)}. There is
small 𝜖𝜖′′ such that 𝑢𝑢(𝑎𝑎𝑘𝑘, 𝑏𝑏𝑛𝑛−1,ℎ𝑚𝑚−1 + 𝜖𝜖′′, 𝛿𝛿∗(𝑎𝑎𝑘𝑘,𝑏𝑏𝑛𝑛−1)) > 𝑢𝑢(𝑎𝑎𝑘𝑘,𝑏𝑏𝑛𝑛−1,ℎ𝑚𝑚−1, 𝛿𝛿𝑘𝑘(ℎ𝑚𝑚−1))
then type-𝑏𝑏𝑛𝑛−1 worker deviates from the equilibrium. This is contradiction. Applying the
same manner downward, we can show that any equilibrium hour is chosen by only one type
of worker and that type is indifferent between his/her equilibrium outcome and the one-rank
higher worker’outcome. Finally, since the worker’s commitment type is completely separated
in the equilibrium, the lowest commitment worker does not need to signal his/her type to the
firm and chooses his/her optimal working hour ℎ = 0. Therefore, the equilibrium survive D1
criterion is only the equilibrium characterized in the proposition. �
Since it is straightforward to prove Proposition 2 by applying almost the same manner, we
omit the proof of Proposition 2. The only difference from the proof of Proposition 1 is that
the worker’s utility is expected utility with regard to his/her ability. The firm makes belief on
off-path hours depending on the range of expected promotion probability 𝑝𝑝𝜇𝜇(𝑎𝑎𝐻𝐻,𝛿𝛿𝐻𝐻) + (1 −
𝑝𝑝)𝜇𝜇(𝑎𝑎𝐻𝐻, 𝛿𝛿𝐻𝐻) which can improve the worker’s utility, that is, the deviator the firm believes is
the worker whose equilibrium utility can be improved with the lowest promotion probability.
49
References Abe, Yukiko. "Equal Employment Opportunity Law and the Gender Wage Gap in Japan: A
Cohort Analysis." Journal of Asian Economics, 2010, 21(2), pp. 142-55. Arrow, Kenneth J. and Arrow, Kenneth J. "The Theory of Discrimination," Collected
Papers of Kenneth J. Arrow. Volume 6 Applied Economics. Cambridge, Mass. and London: Harvard Univeristy Press, Belknap Press, 1985, 143-64.
Asai, Yukiko. "Parental Leave Reforms and the Employment of New Mothers: Quasi-Experimental Evidence from Japan," Paper Presented at the SOLE meeting, 2013.
Barnett, William P.; Baron, James N. and Stuart, Toby E. "Avenues of Attainment: Occupational Demography and Organizational Careers in the California Civil Service." American Journal of Sociology, 2000, 106(1), pp. 88-144.
Becker, Gary S. The Economics of Discrimination. Chicago, IL: University of Chicago Press., 1957.
Bertrand, Marianne; Goldin, Claudia and Katz, Lawrence F. "Dynamics of the Gender Gap for Young Professionals in the Financial and Corporate Sectors." American Economic Journal: Applied Economics, 2010, 2(3), pp. 228-55.
Bjerk, David. "Glass Ceilings or Sticky Floors? Statistical Discrimination in a Dynamic Model of Hiring and Promotion." Economic Journal, 2008, 118(530), pp. 961-82.
Blau, Francine D. and DeVaro, Jed. "New Evidence on Gender Differences in Promotion Rates: An Empirical Analysis of a Sample of New Hires." Industrial Relations, 2007, 46(3), pp. 511-50.
Blau, Francine D. and Kahn, Lawrence M. "Gender Differences in Pay." Journal of Economic Perspectives, 2000, 14(4), pp. 75-99.
Booth, Alison L.; Francesconi, Marco and Frank, Jeff. "A Sticky Floors Model of Promotion, Pay, and Gender." European Economic Review, 2003, 47(2), pp. 295-322.
Booth, Alison and Nolen, Patrick. "Choosing to Compete: How Different Are Girls and Boys?" Journal of Economic Behavior and Organization, 2012, 81(2), pp. 542-55.
Cabral, Robert; Ferber, Marianne A. and Green, Carole A. "Men and Women in Fiduciary Institutions: A Study of Sex Differences in Career Development." Review of Economics and Statistics, 1981, 63(4), pp. 573-80.
Cannings, Kathy. "Managerial Promotion: The Effects of Socialization, Specialization, and Gender." Industrial and Labor Relations Review, 1988, 42(1), pp. 77-88.
Cha, Youngjoo and Weeden, Kim A. "Overwork and the Slow Convergence in the Gender Gap in Wages." American Sociological Review (forthcoming), 2013.
50
Cobb-Clark, Deborah A. and Polachek, Solomon W. "Getting Ahead: The Determinants of and Payoffs to Internal Promotion for Young U.S. Men and Women," Worker Wellbeing in a Changing Labor Market. Research in Labor Economics, vol. 20. Amsterdam; London and New York: Elsevier Science, JAI, 2001, 339-72.
Cortes, Patricia, and Jessica Pan. "When Time Binds: Returns to Working Long Hours and the Gender Wage Gap among the Highly Skilled," Working Paper, 2015.
Frederiksen, Anders and Kato, Takao. "Human Capital and Career Success: Evidence from Linked Employer-Employee Data," IZA Discussion Paper No. 5764, 2011.
Fryer, Roland G. "Belief Flipping in a Dynamic Model of Statistical Discrimination." Journal of Public Economics, 2007, 91(5-6), pp. 1151-66.
Fuwa, Makiko. "Macro-Level Gender Inequality and the Division of Household Labor in 22 Countries." American Sociological Review, 2004, 69(6), pp. 751-67.
Gicheva, Dora. "Working Long Hours and Early Career Outcomes in the High-End Labor Market." Journal of Labor Economics, 2013, 31(4), pp. 785-824.
Goldin, Claudia. "A Grand Gender Convergence: Its Last Chapter," American Economic Review, 2014, 104(4): pp.1091-1119.
Kato, Takao; Kawaguchi, Daiji and Owan, Hideo. "Dynamics of the Gender Gap in the Workplace: An Econometric Case Study of a Large Japanese Firm," Paper presented at the NBER Japan Project meeting. Tokyo, 2013.
Lazear, Edward P. and Rosen, Sherwin. "Male-Female Wage Differentials in Job Ladders." Journal of Labor Economics, 1990, 8(1), pp. S106-23.
McCue, Kristin. "Promotions and Wage Growth." Journal of Labor Economics, 1996, 14(2), pp. 175-209.
Niederle, Muriel and Vesterlund, Lise. "Do Women Shy Away from Competition? Do Men Compete Too Much?" Quarterly Journal of Economics, 2007, 122(3), pp. 1067-101.
Paulin, Elizabeth A. and Mellor, Jennifer M. "Gender, Race, and Promotions within a Private-Sector Firm." Industrial Relations, 1996, 35(2), pp. 276-95.
Pekkarinen, Tuomas and Vartiainen, Juhana. "Gender Differences in Promotion on a Job Ladder: Evidence from Finnish Metalworkers." Industrial and Labor Relations Review, 2006, 59(2), pp. 285-301.
Phelps, Edmund S. "The Statistical Theory of Racism and Sexism." American Economic Review, 1972, 62(4), pp. 659-61.
Smith, Nina; Smith, Valdemar and Verner, Mette. "Why Are So Few Females Promoted into CEO and Vice President Positions? Danish Empirical Evidence, 1997-2007." Industrial and Labor Relations Review, 2013, 66(2), pp. 380-408.
Steinberg, Chad and Nakane, Masato. "Can Women Save Japan?," IMF Working Paper WP/12/248, 2012.
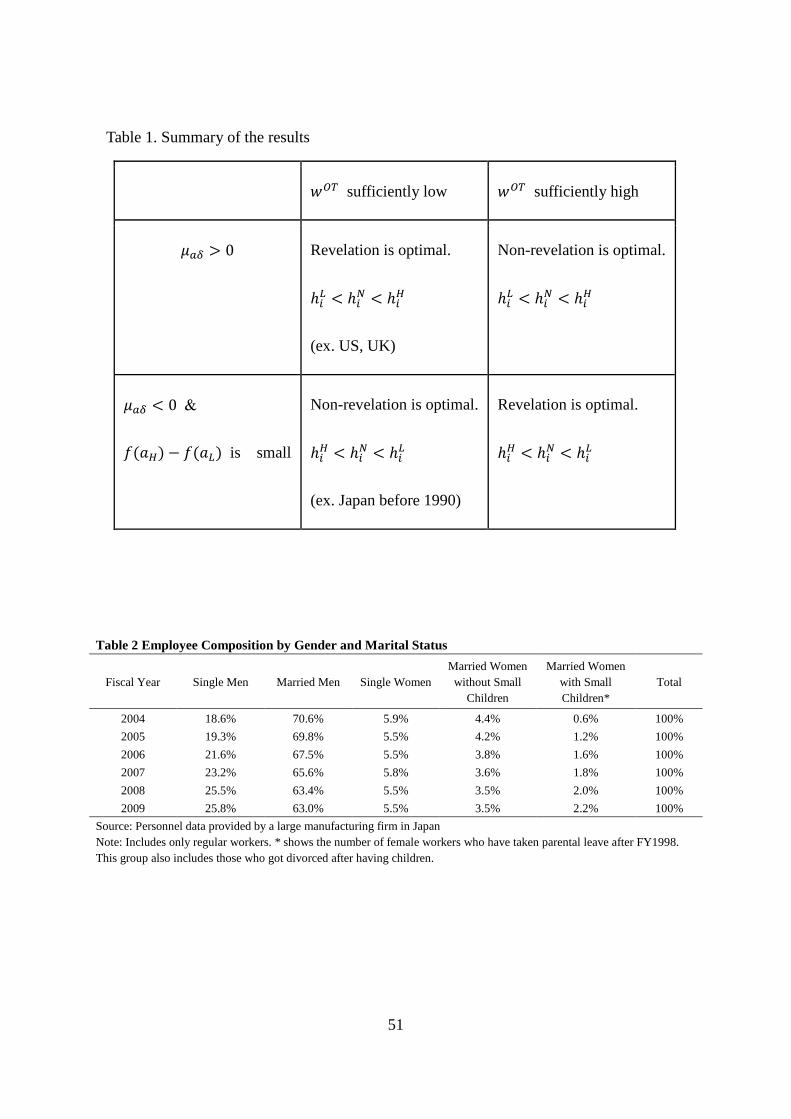
51
Table 2 Employee Composition by Gender and Marital Status
Fiscal Year Single Men Married Men Single Women Married Women without Small
Children
Married Women with Small Children*
Total
2004 18.6% 70.6% 5.9% 4.4% 0.6% 100% 2005 19.3% 69.8% 5.5% 4.2% 1.2% 100% 2006 21.6% 67.5% 5.5% 3.8% 1.6% 100% 2007 23.2% 65.6% 5.8% 3.6% 1.8% 100% 2008 25.5% 63.4% 5.5% 3.5% 2.0% 100% 2009 25.8% 63.0% 5.5% 3.5% 2.2% 100%
Source: Personnel data provided by a large manufacturing firm in Japan Note: Includes only regular workers. * shows the number of female workers who have taken parental leave after FY1998. This group also includes those who got divorced after having children.
Table 1. Summary of the results
𝑤𝑤𝑂𝑂𝑂𝑂 sufficiently low 𝑤𝑤𝑂𝑂𝑂𝑂 sufficiently high
𝜇𝜇𝑎𝑎𝛿𝛿 > 0 Revelation is optimal.
ℎ𝑖𝑖𝐿𝐿 < ℎ𝑖𝑖𝑁𝑁 < ℎ𝑖𝑖𝐻𝐻
(ex. US, UK)
Non-revelation is optimal.
ℎ𝑖𝑖𝐿𝐿 < ℎ𝑖𝑖𝑁𝑁 < ℎ𝑖𝑖𝐻𝐻
𝜇𝜇𝑎𝑎𝛿𝛿 < 0 &
𝑓𝑓(𝑎𝑎𝐻𝐻) − 𝑓𝑓(𝑎𝑎𝐿𝐿) is small
Non-revelation is optimal.
ℎ𝑖𝑖𝐻𝐻 < ℎ𝑖𝑖𝑁𝑁 < ℎ𝑖𝑖𝐿𝐿
(ex. Japan before 1990)
Revelation is optimal.
ℎ𝑖𝑖𝐻𝐻 < ℎ𝑖𝑖𝑁𝑁 < ℎ𝑖𝑖𝐿𝐿
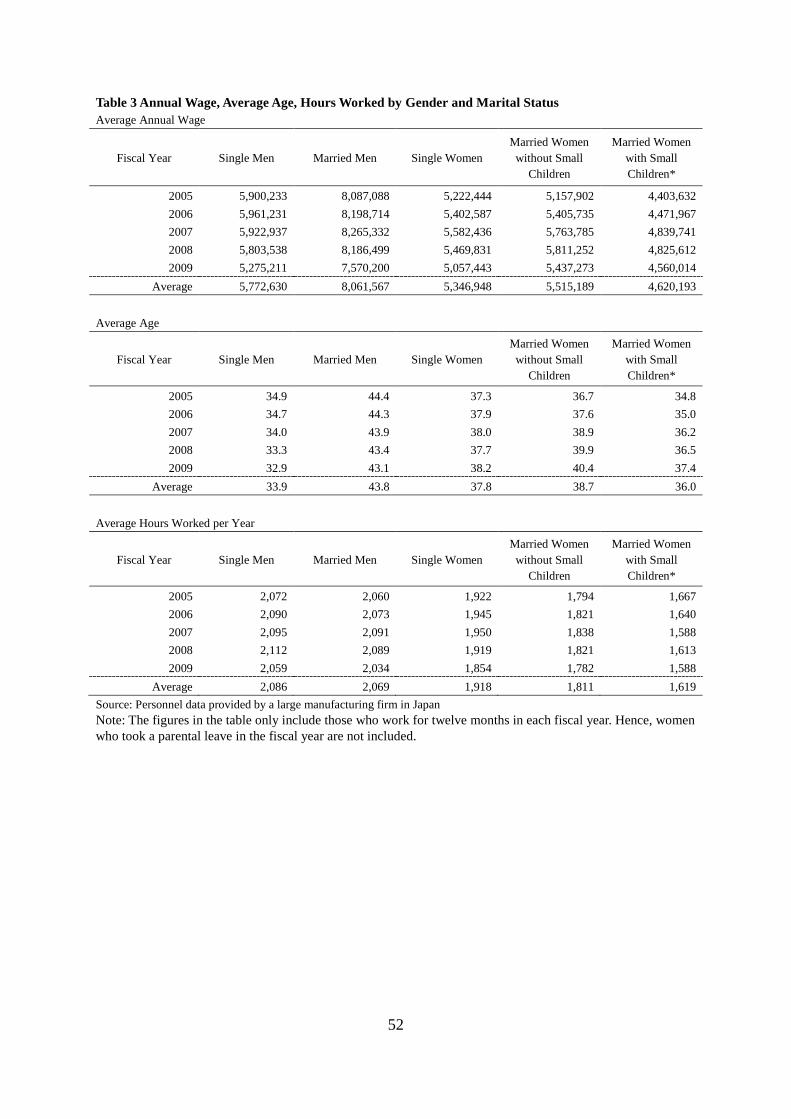
52
Table 3 Annual Wage, Average Age, Hours Worked by Gender and Marital Status Average Annual Wage
Fiscal Year Single Men Married Men Single Women Married Women without Small
Children
Married Women with Small Children*
2005 5,900,233 8,087,088 5,222,444 5,157,902 4,403,632 2006 5,961,231 8,198,714 5,402,587 5,405,735 4,471,967 2007 5,922,937 8,265,332 5,582,436 5,763,785 4,839,741 2008 5,803,538 8,186,499 5,469,831 5,811,252 4,825,612 2009 5,275,211 7,570,200 5,057,443 5,437,273 4,560,014
Average 5,772,630 8,061,567 5,346,948 5,515,189 4,620,193
Average Age
Fiscal Year Single Men Married Men Single Women Married Women without Small
Children
Married Women with Small Children*
2005 34.9 44.4 37.3 36.7 34.8 2006 34.7 44.3 37.9 37.6 35.0 2007 34.0 43.9 38.0 38.9 36.2 2008 33.3 43.4 37.7 39.9 36.5 2009 32.9 43.1 38.2 40.4 37.4
Average 33.9 43.8 37.8 38.7 36.0
Average Hours Worked per Year
Fiscal Year Single Men Married Men Single Women Married Women without Small
Children
Married Women with Small Children*
2005 2,072 2,060 1,922 1,794 1,667 2006 2,090 2,073 1,945 1,821 1,640 2007 2,095 2,091 1,950 1,838 1,588 2008 2,112 2,089 1,919 1,821 1,613 2009 2,059 2,034 1,854 1,782 1,588
Average 2,086 2,069 1,918 1,811 1,619 Source: Personnel data provided by a large manufacturing firm in Japan Note: The figures in the table only include those who work for twelve months in each fiscal year. Hence, women who took a parental leave in the fiscal year are not included.

53
Table 4 Distribution of Men and Women by Education levels Men
Year of Hiring
Ph.D. Master BS/BA Tech.
College 2-yr.
college Vocatio-nal Sch.
High School
Middle School
UNK Total
1990-99 1.8% 18.5% 23.0% 7.2% 0.7% 3.7% 44.2% 0.8% 0.1% 100.0% 2000-09 3.8% 19.7% 28.5% 3.2% 0.9% 5.0% 30.6% 0.2% 8.0% 100.0%
Women
Year of Hiring
Ph.D. Master BS/BA College of Tech.
2-y college
Vocational Sch.
High School
Middle School
UNK Total
1990-99 0.3% 3.3% 14.8% 1.3% 37.2% 9.5% 33.4% 0.0% 0.3% 100.0% 2000-09 4.2% 26.7% 28.3% 3.3% 3.6% 20.2% 5.5% 0.0% 8.1% 100.0%
Source: Personnel data provided by a large manufacturing firm in Japan Note: Employees hired before 2004 include only those who were still employed in 2004. UNK stands for unknown.
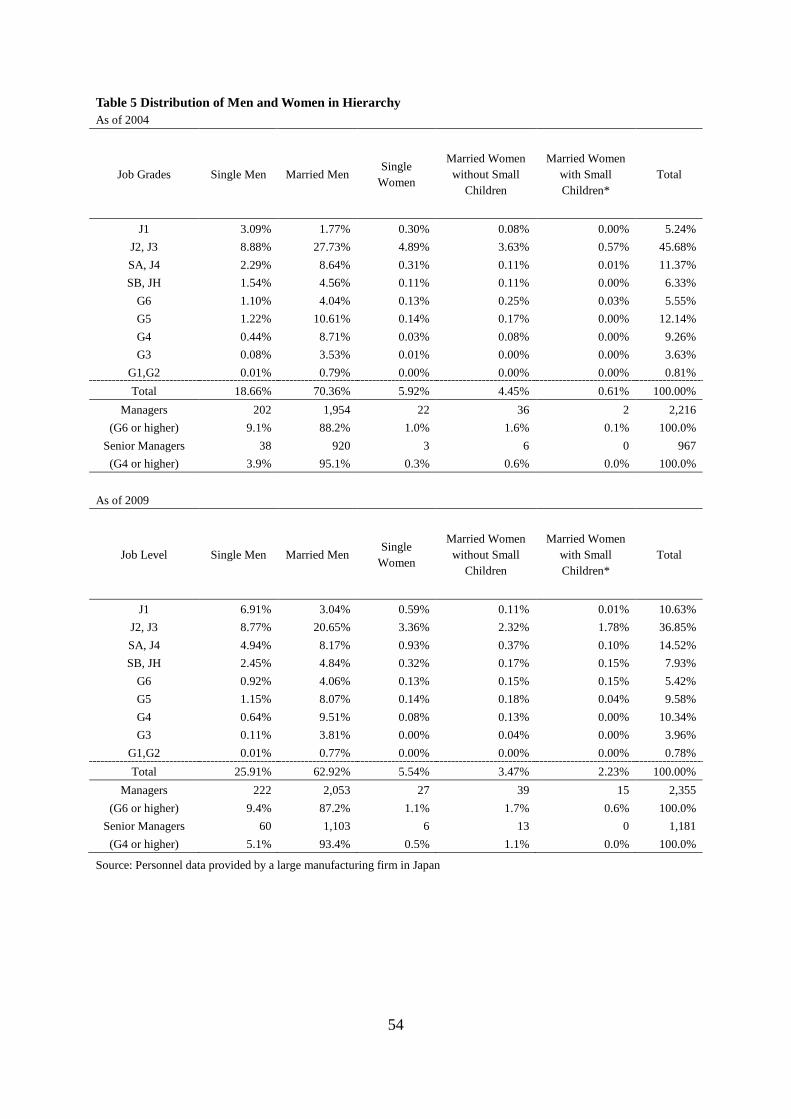
54
Table 5 Distribution of Men and Women in Hierarchy As of 2004
Job Grades Single Men Married Men Single
Women
Married Women without Small
Children
Married Women with Small Children*
Total
J1 3.09% 1.77% 0.30% 0.08% 0.00% 5.24% J2, J3 8.88% 27.73% 4.89% 3.63% 0.57% 45.68% SA, J4 2.29% 8.64% 0.31% 0.11% 0.01% 11.37% SB, JH 1.54% 4.56% 0.11% 0.11% 0.00% 6.33%
G6 1.10% 4.04% 0.13% 0.25% 0.03% 5.55% G5 1.22% 10.61% 0.14% 0.17% 0.00% 12.14% G4 0.44% 8.71% 0.03% 0.08% 0.00% 9.26% G3 0.08% 3.53% 0.01% 0.00% 0.00% 3.63%
G1,G2 0.01% 0.79% 0.00% 0.00% 0.00% 0.81% Total 18.66% 70.36% 5.92% 4.45% 0.61% 100.00%
Managers 202 1,954 22 36 2 2,216 (G6 or higher) 9.1% 88.2% 1.0% 1.6% 0.1% 100.0%
Senior Managers 38 920 3 6 0 967 (G4 or higher) 3.9% 95.1% 0.3% 0.6% 0.0% 100.0%
As of 2009
Job Level Single Men Married Men Single
Women
Married Women without Small
Children
Married Women with Small Children*
Total
J1 6.91% 3.04% 0.59% 0.11% 0.01% 10.63% J2, J3 8.77% 20.65% 3.36% 2.32% 1.78% 36.85% SA, J4 4.94% 8.17% 0.93% 0.37% 0.10% 14.52% SB, JH 2.45% 4.84% 0.32% 0.17% 0.15% 7.93%
G6 0.92% 4.06% 0.13% 0.15% 0.15% 5.42% G5 1.15% 8.07% 0.14% 0.18% 0.04% 9.58% G4 0.64% 9.51% 0.08% 0.13% 0.00% 10.34% G3 0.11% 3.81% 0.00% 0.04% 0.00% 3.96%
G1,G2 0.01% 0.77% 0.00% 0.00% 0.00% 0.78% Total 25.91% 62.92% 5.54% 3.47% 2.23% 100.00%
Managers 222 2,053 27 39 15 2,355 (G6 or higher) 9.4% 87.2% 1.1% 1.7% 0.6% 100.0%
Senior Managers 60 1,103 6 13 0 1,181 (G4 or higher) 5.1% 93.4% 0.5% 1.1% 0.0% 100.0%
Source: Personnel data provided by a large manufacturing firm in Japan
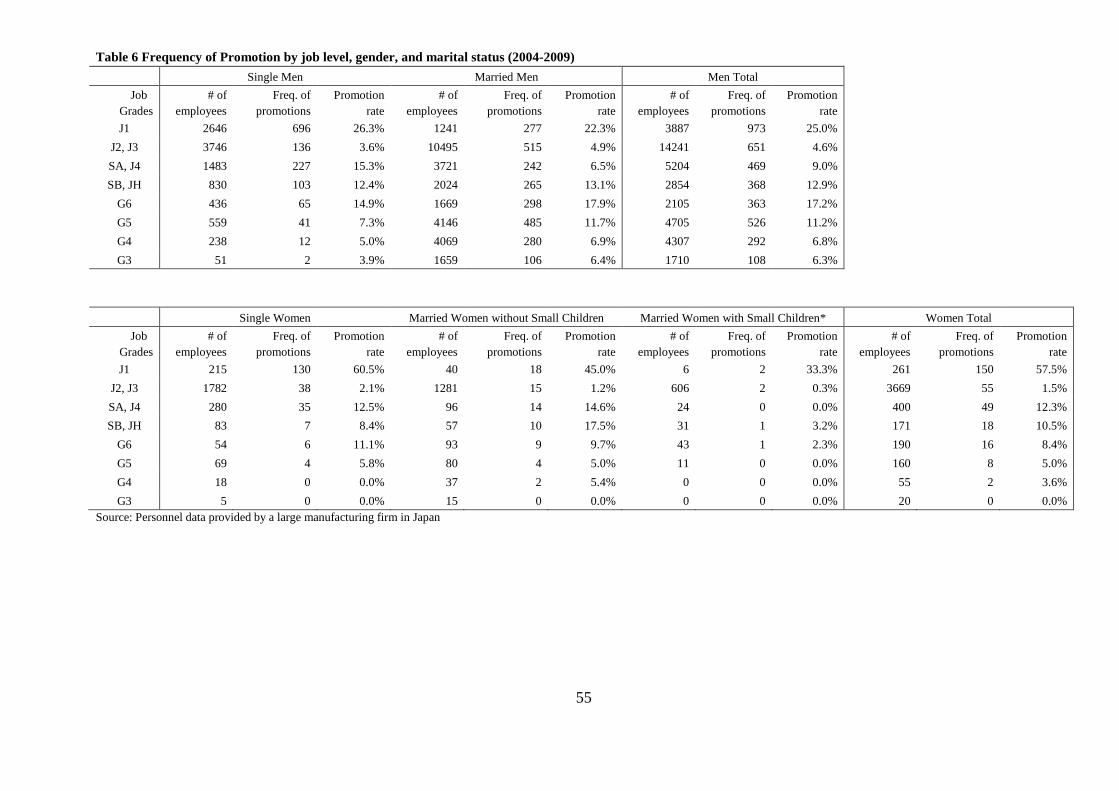
55
Table 6 Frequency of Promotion by job level, gender, and marital status (2004-2009)
Single Men Married Men Men Total
Job Grades
# of employees
Freq. of promotions
Promotion rate
# of employees
Freq. of promotions
Promotion rate
# of employees
Freq. of promotions
Promotion rate
J1 2646 696 26.3% 1241 277 22.3% 3887 973 25.0%
J2, J3 3746 136 3.6% 10495 515 4.9% 14241 651 4.6%
SA, J4 1483 227 15.3% 3721 242 6.5% 5204 469 9.0%
SB, JH 830 103 12.4% 2024 265 13.1% 2854 368 12.9%
G6 436 65 14.9% 1669 298 17.9% 2105 363 17.2%
G5 559 41 7.3% 4146 485 11.7% 4705 526 11.2%
G4 238 12 5.0% 4069 280 6.9% 4307 292 6.8%
G3 51 2 3.9% 1659 106 6.4% 1710 108 6.3%
Single Women Married Women without Small Children Married Women with Small Children* Women Total
Job Grades
# of employees
Freq. of promotions
Promotion rate
# of employees
Freq. of promotions
Promotion rate
# of employees
Freq. of promotions
Promotion rate
# of employees
Freq. of promotions
Promotion rate
J1 215 130 60.5% 40 18 45.0% 6 2 33.3% 261 150 57.5% J2, J3 1782 38 2.1% 1281 15 1.2% 606 2 0.3% 3669 55 1.5% SA, J4 280 35 12.5% 96 14 14.6% 24 0 0.0% 400 49 12.3% SB, JH 83 7 8.4% 57 10 17.5% 31 1 3.2% 171 18 10.5%
G6 54 6 11.1% 93 9 9.7% 43 1 2.3% 190 16 8.4% G5 69 4 5.8% 80 4 5.0% 11 0 0.0% 160 8 5.0% G4 18 0 0.0% 37 2 5.4% 0 0 0.0% 55 2 3.6% G3 5 0 0.0% 15 0 0.0% 0 0 0.0% 20 0 0.0%
Source: Personnel data provided by a large manufacturing firm in Japan

56
Table 7: Gender Gaps in Promotion: Logit Model Dependent variable=probability of promotion conditional on the current job level All employees College graduates Marriage 0.2664 *** 0.1690
(0.0598)
(0.1174)
Female -0.2634 ** -0.0871
(0.1203)
(0.2236)
Marriage × Female -0.1578
-0.4036
(0.1751)
(0.3428)
Maternity
-0.0709
-0.2793
(0.3346)
(0.8581)
Leave Length -0.0941 *** -0.0645 *
(0.0278)
(0.0378)
Working in the HQ 0.65101 *** 0.4387 *** (0.0835)
(0.1193)
Pseudo R2 0.1544
0.1482
Number of observations 31711 5824
Source: Personnel data provided by a large manufacturing firm in Japan Note: Age, tenure, education, job grade, and fiscal year are all controlled for but their coefficients are omitted from the table. *** p<0.01, ** p<0.05, * p<0.1

57
Table 8: Career Interruptions, Hours and Promotion: Logit Model Dependent variable=probability of promotion conditional on the current job level All employees College graduates w/ hours worked w/ evaluation w/ hours worked w/ evaluation Marriage 0.2744 *** 0.1038
0.1880
0.0851
(0.0723)
(0.0752)
(0.1467)
(0.1513) Female -19.2762 *** -20.1029 *** -17.9351 ** -18.5391 ** (4.2414)
(4.3792)
(8.7044)
(8.7111)
Marriage × Female 0.1718
0.2165
-0.2429
-0.3038 (0.2053)
(0.2098)
(0.4195)
(0.4327)
Maternity -0.2194
-0.1879
-0.0405
-0.1909
(0.4582)
(0.4715)
(0.8956)
(0.8922)
Leave Length -0.0376
-0.0317
0.0488
0.0696
(0.0298)
(0.0329)
(0.0430)
(0.0471) Lagged hours worked (log) 2.0406 *** 1.3570 *** 1.9729 *** 1.5790 ** (0.3261)
(0.3347)
(0.6711)
(0.6946)
Female × Lagged hours worked 3.6746 *** 3.8002 *** 3.4400 ** 3.5370 ** (0.8174)
(0.8451)
(1.6796)
(1.6838)
Lagged reduced hours (log) 0.1039
0.1604
(omitted)
(0.2937)
(0.2851)
Lagged late night hours (log) -0.2438 *** -0.2207 *** -0.2594 *** -0.2521 *** (0.0269)
(0.0271)
(0.0676)
(0.0690)
Evaluation : A1 or better
0.8657 ***
0.6303 ***
(0.0702)
(0.1464)
Evaluation : A3 or worse
-0.8389 ***
-0.4439 *
(0.1389)
(0.2280)
A1 or better × Female 0.3576 * 0.2255 (0.2016) (0.4715) A3 or worse × Female 0.3244 0.5213 (0.4200) (0.6777) Working in the HQ 0.7437 *** 0.7877 *** 0.6263 *** 0.6445 *** (0.0985)
(0.1019)
(0.1563)
(0.1597)
Pseudo R2 0.1607
0.1893
0.1567
0.1709 Number of observations 21562 21293 3919 3905
Source: Personnel data provided by a large manufacturing firm in Japan Note: Age, tenure, education, job grade, and fiscal year are all controlled for but their coefficients are omitted from the tab *** p<0.01, ** p<0.05, * p<0.1

58
The worker works & the wage is paid out.
Firms offer base wage 𝑤𝑤⬚𝐵𝐵 to workers and decides on their feedback policy.
First period
The firm observes its worker’s ability a and reveals it to the worker if revelation is chosen.
The worker chooses his/her hours of work
Second period
The worker receives the wage 𝑤𝑤𝐵𝐵 + 𝑤𝑤𝑂𝑂𝑂𝑂ℎ.
The firm chooses training 𝛿𝛿 and identifies those promoted according to 𝜇𝜇(𝑎𝑎, 𝛿𝛿)
Information asymmetry disappears and the firm and the worker bargain over wage.
The worker reco-gnizes his/her
it t l l
Figure 1. Timing of the game
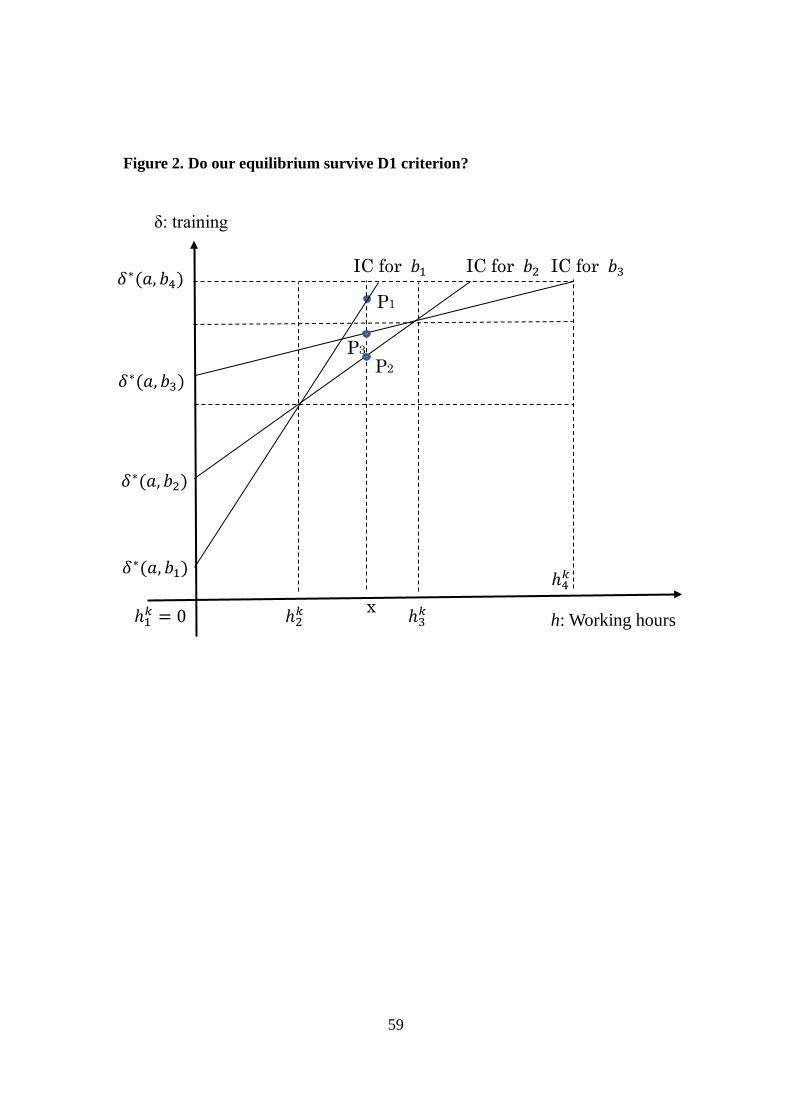
59
ℎ4𝑘𝑘
ℎ3𝑘𝑘
δ: training
𝛿𝛿∗(𝑎𝑎, 𝑏𝑏4)
ℎ2𝑘𝑘
IC for 𝑏𝑏2
P1
IC for 𝑏𝑏3 IC for 𝑏𝑏1
h: Working hours x
P3 P2
ℎ1𝑘𝑘 = 0
Figure 2. Do our equilibrium survive D1 criterion?
𝛿𝛿∗(𝑎𝑎, 𝑏𝑏2)
𝛿𝛿∗(𝑎𝑎, 𝑏𝑏3)
𝛿𝛿∗(𝑎𝑎, 𝑏𝑏1)

60
Figure 3 Expected Profit as a Function of b when 𝜇𝜇𝑎𝑎𝛿𝛿 > 0
𝜋𝜋𝑅𝑅(𝑎𝑎𝐻𝐻, 𝑏𝑏)
b
High ability
Low ability
Non-revelation
𝜋𝜋𝑁𝑁(𝑏𝑏)
𝜋𝜋𝑅𝑅(𝑎𝑎𝐿𝐿, 𝑏𝑏)
𝜋𝜋𝑅𝑅(𝑏𝑏)
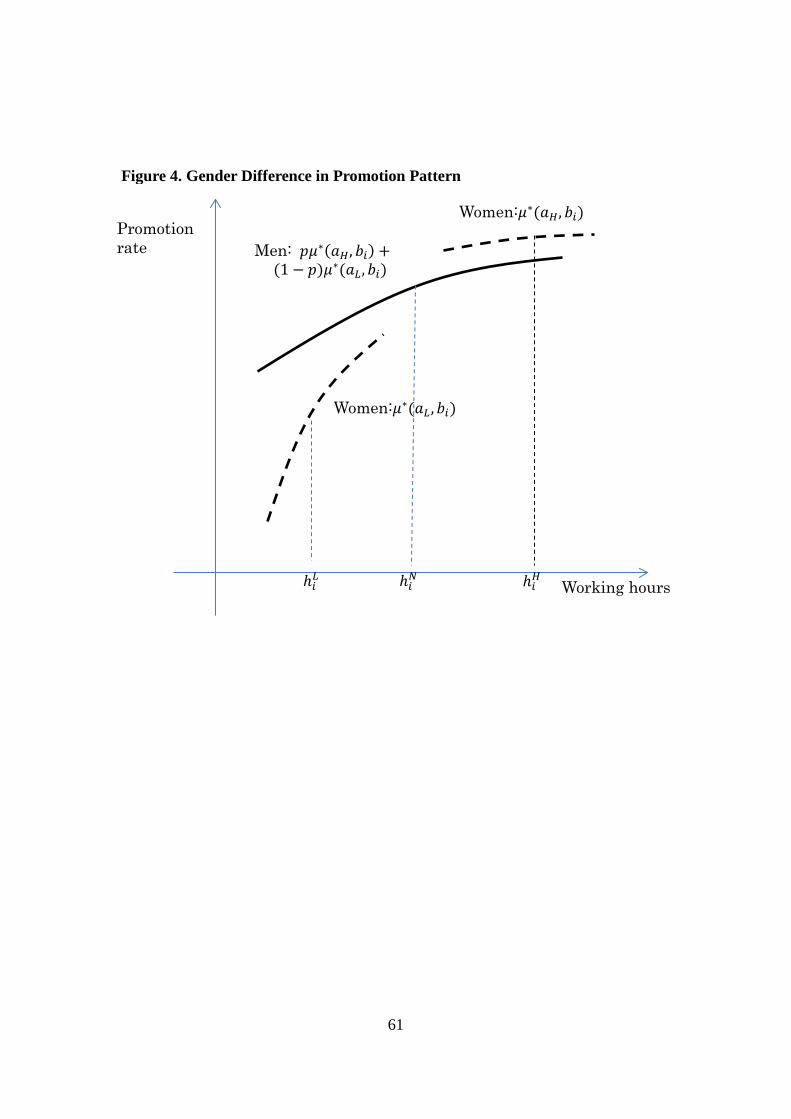
61
Women:𝜇𝜇∗(𝑎𝑎𝐻𝐻, 𝑏𝑏𝑖𝑖)
Women:𝜇𝜇∗(𝑎𝑎𝐿𝐿 ,𝑏𝑏𝑖𝑖)
(1 − 𝑝𝑝)𝜇𝜇∗(𝑎𝑎𝐿𝐿 ,𝑏𝑏𝑖𝑖) Men: 𝑝𝑝𝜇𝜇∗(𝑎𝑎𝐻𝐻, 𝑏𝑏𝑖𝑖) +
ℎ𝑖𝑖𝐻𝐻 ℎ𝑖𝑖𝐿𝐿 ℎ𝑖𝑖𝑁𝑁 Working hours
Promotion rate
Figure 4. Gender Difference in Promotion Pattern
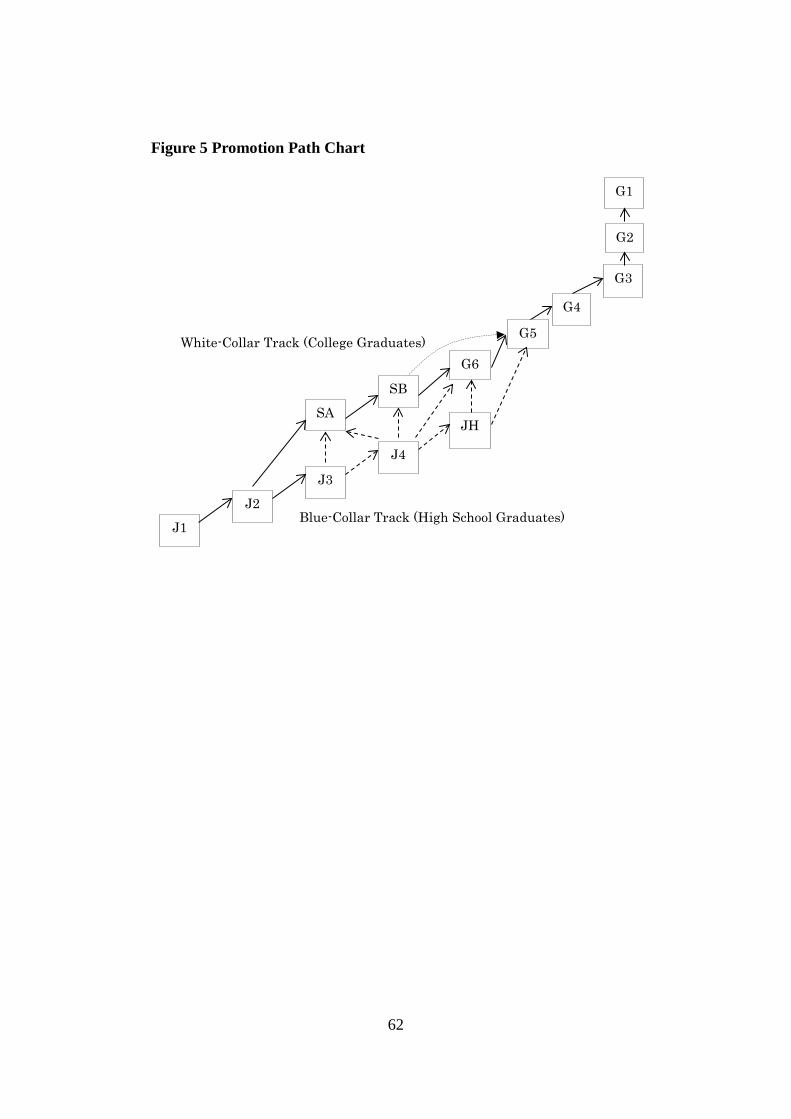
62
J1
J2
J3
J4
JH SA
SB
G6
G5
G4
G3
G1
G2
Blue-Collar Track (High School Graduates)
White-Collar Track (College Graduates)
Figure 5 Promotion Path Chart
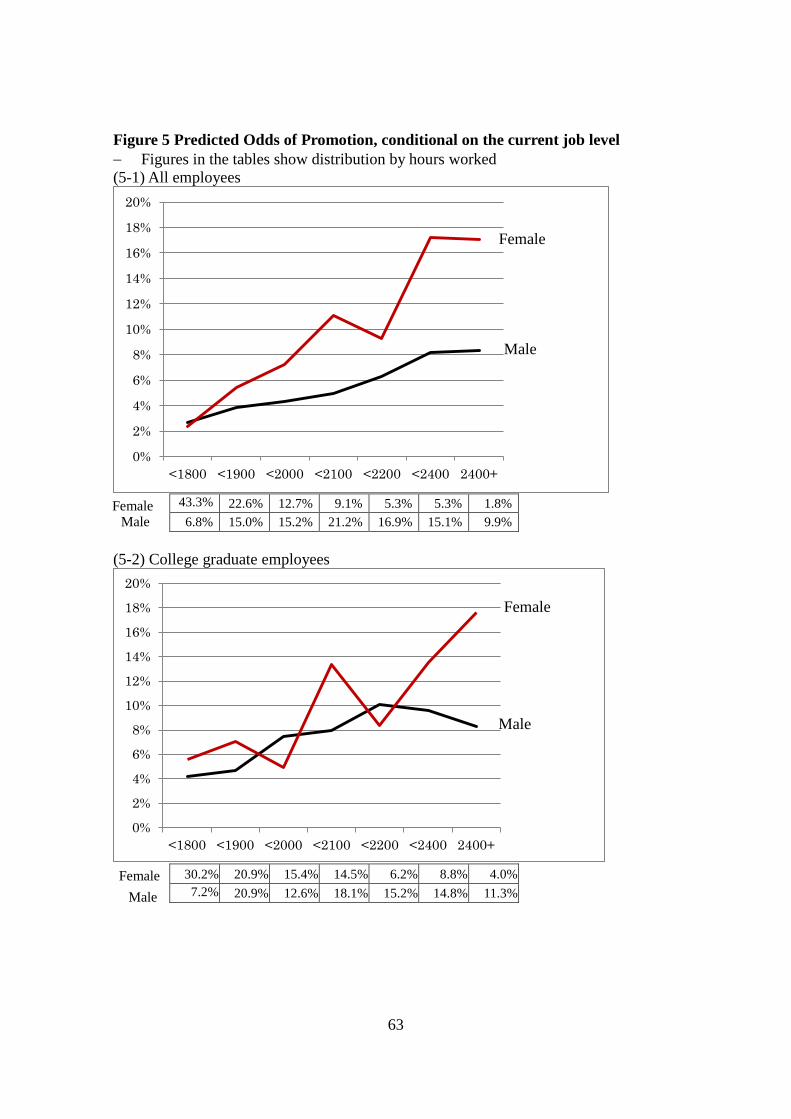
63
Figure 5 Predicted Odds of Promotion, conditional on the current job level − Figures in the tables show distribution by hours worked (5-1) All employees
43.3% 22.6% 12.7% 9.1% 5.3% 5.3% 1.8% 6.8% 15.0% 15.2% 21.2% 16.9% 15.1% 9.9%
(5-2) College graduate employees
30.2% 20.9% 15.4% 14.5% 6.2% 8.8% 4.0%
7.2% 20.9% 12.6% 18.1% 15.2% 14.8% 11.3%
0%
2%
4%
6%
8%
10%
12%
14%
16%
18%
20%
<1800 <1900 <2000 <2100 <2200 <2400 2400+
0%
2%
4%
6%
8%
10%
12%
14%
16%
18%
20%
<1800 <1900 <2000 <2100 <2200 <2400 2400+
Female
Female
Female
Male
Male
Male
Female Male
Recommended