Workers Comp. Reserving - How and When Should
You Slice the Cake?
Mark J. Mahon, FCAS, MAAA
MBA, Inc.
CLRS - September 23, 2002

It’s Easy to Want the Data - Receiving It Is Not So Easy
To Start - Keep Things Simple

It’s Easy to Want the Data - Receiving It Is Not So Easy
To Start - Keep Things SimpleFollow the Client’s Operations

It’s Easy to Want the Data - Receiving It Is Not So Easy
To Start - Keep Things SimpleFollow the Client’s OperationsWhy Do You Want the Data?

It’s Easy to Want the Data - Receiving It Is Not So Easy
To Start - Keep Things SimpleFollow the Client’s OperationsWhy Do You Want the Data?Time Consuming and Expensive
Traumatic vs. Occupational Disease (Black Lung)
Coal Mine Compensation Rating Bureau of Pennsylvania.
Traumatic vs. Occupational Disease (Black Lung)
Comparison of OD to Traumatic Cumulative

Traumatic vs. Occupational Disease (Black Lung)
Comparison of OD to Traumatic Cumulative Long Report Time

Traumatic vs. Occupational Disease (Black Lung)
Comparison of OD to Traumatic Cumulative Long Report Time Claims take time to Adjudicate

Traumatic vs. Occupational Disease (Black Lung)
Comparison of OD to Traumatic Cumulative Long Report Time Claims take time to Adjudicate Lifetime Benefits

Traumatic vs. Occupational Disease (Black Lung)
Comparison of OD to Traumatic Cumulative Long Report Time Claims take time to Adjudicate Lifetime Benefits Low Frequency/High Severity

The OD System
Frequency times Severity.

The OD Frequency
IBNR Claims Uses Typical Accident Year Triangles Claims assigned to Year based on Last
Date of Exposure Claim Count Development used to
estimate IBNR Claims

OD Frequency
Three Pieces Known Claimants Receiving Benefits at
the valuation date (Awarded Claims) An Estimate of Pending Claims that will
be Awarded An Estimate of IBNR Claims that will be
Awarded

The OD Frequency
Awarded ClaimsREPORTED DATA TOTAL
TOTAL AWARDED AWARDED AWARDEDYEAR REPORTED AWARDED PENDING DENIED PENDING IBNR IBNR CLAIMS
1992 20 5 4 11 0.428 2.532 0.271 5.6991993 28 1 2 25 0.214 2.819 0.302 1.5161994 27 2 3 22 0.321 2.688 0.288 2.6091995 20 2 1 17 0.107 2.990 0.320 2.4271996 8 0 1 7 0.107 3.253 0.348 0.4551997 8 0 2 6 0.214 3.788 0.405 0.6191998 10 2 2 6 0.214 4.031 0.431 2.6451999 5 0 0 5 0.000 5.067 0.542 0.5422000 2 0 1 1 0.107 5.745 0.615 0.7222001 0 0 0 0 0.000 7.573 0.810 0.810
TOTAL 128 12 16 100 1.712 40.485 4.332 18.044
Award Ratio: Awarded/(Awarded plus Debied) = 12/(12+100) = 10.7%

The OD Frequency
New Federal Black Lung Legislation Increase in Reported Claims Increase in Awarded Claims
Retroactive

OD Severity
Life TablesLifetime BenefitsClaimant’s AgeAnnual BenefitsMarital StatusEscalation (State - No, Federal- Yes)

OD Severity
Life Tables used to Model Future Benefits
Mortality Probability Future FutureMiner's Table of Benefit Expected
Age Lives Payment Amount COLA Payment60 46,524 0.9884 $5,935 1.000 $5,86661 45,449 0.9651 5,935 1.030 5,90062 44,355 0.9414 5,935 1.061 5,92763 43,238 0.9171 5,935 1.093 5,94864 42,096 0.8923 5,935 1.126 5,960: : : : : :
105 39 0.0007 5,935 3.782 15106 25 0.0004 5,935 3.895 10107 16 0.0003 5,935 4.012 7108 10 0.0002 5,935 4.132 4109 6 0.0001 5,935 4.256 2110 0 0.0000 5,935 4.384 0
Total 149,977
OD Severity
Act 57 Only Claims Filed After Mid 1996 WC Benefits Reduced for Social Security WC Benefits Reduced for Pensions AMA Guidelines Made it Harder To
Achieve PT Disability Status

The OD Reserve
Three Pieces>Known Awarded Claims: Sum of Each Claimant’s future payments
from severity model>Pending Claims: Pending Claims x Award Ratio x Average
Severity of Pending Claims>IBNR Claims: IBNR Claims x Award Ratio x Average
Severity of Awarded and Pending Claims

OD System - Concluding Remarks
Lifetime Payments/Long Tail

OD System - Concluding Remarks
Lifetime Payments/Long TailRelatively Few Claims

OD System - Concluding Remarks
Lifetime Payments/Long TailRelatively Few ClaimsParallels Actual Process

OD System - Concluding Remarks
Lifetime Payments/Long TailRelatively Few ClaimsParallels Actual ProcessReviewed by Interested Parties

OD System - Concluding Remarks
Lifetime Payments/Long TailRelatively Few ClaimsParallels Actual ProcessReviewed by Interested PartiesExpensive

OD System - Concluding Remarks
Lifetime Payments/Long TailRelatively Few ClaimsParallels Actual ProcessReviewed by Interested PartiesExpensiveIs This Really the Only Way to Make
Estimates?

Traumatic - Indemnity vs. Medical
Very Common SplitAlso Breakdown Medical into Medical
Only and Medical on IndemnityDifferent
Development Inflation Law Changes

Tail Factor -Inverse Power Curve
Form: ldf = 1 + a*(time+c)^(b)Transformation: ln(Ldf-1) = ln(a) + b*ln(time+c) Fitted Fitted
Period Ldf time c ln(Ldf-1) ln(time+c) Data points: 12:24 to 60-72 ln(Ldf-1) Ldf12:24 1.902 1 3 -0.103 1.386 Regression Statistics -0.248 1.78124:36 1.290 2 3 -1.238 1.609 R-Square 96.4% -0.955 1.38536:48 1.233 3 3 -1.457 1.792 Observations 5 -1.533 1.21648:60 1.144 4 3 -1.938 1.946 a 4.147 -2.021 1.13360:72 1.085 5 3 -2.465 2.079 b -3.170 -2.445 1.087
72:84 6 3 2.197 -2.818 1.06084:96 7 3 2.303 -3.152 1.043
96:108 8 3 2.398 -3.454 1.032108:120 9 3 2.485 -3.730 1.024120:132 10 3 2.565 -3.983 1.019
: : : : : :240:252 20 3 3.135 -5.792 1.003
Possible Tail Factors: 6-10 1.1896-15 1.2516-20 1.277

Tail Factor -Relate to Larger Body
A. Relationship of Company Z to IndustryLoss Development Factors Relationship
Company Z Insurance Industry Company Z Period Factor Period Factor to Industry12-24 1.902 12-24 1.351 140.8%24-36 1.290 24-36 1.091 118.2%36-48 1.233 36-48 1.040 118.6%48-60 1.144 48-60 1.024 111.7%60-72 1.085 60-72 1.017 106.7%
72-Ult 72-Ult 1.076
Average of Latest 3: 112.3%Trended: 104.5%
B. Possible Tail Factors Company Z Industry Tail Relationship Tail
Average -1 1.076 112.3% 1.210Average -2 1.076 104.5% 1.120
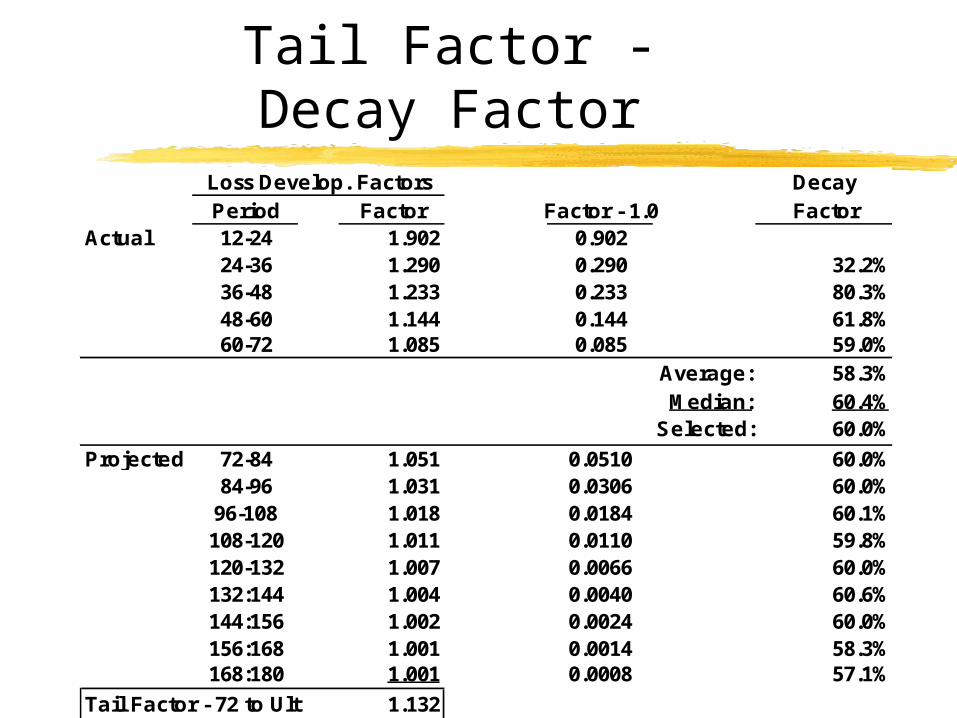
Tail Factor -Decay Factor
Loss Develop. Factors DecayPeriod Factor Factor - 1.0 Factor
Actual 12-24 1.902 0.90224-36 1.290 0.290 32.2%36-48 1.233 0.233 80.3%48-60 1.144 0.144 61.8%60-72 1.085 0.085 59.0%
Average: 58.3%Median: 60.4%
Selected: 60.0%
Projected 72-84 1.051 0.0510 60.0%84-96 1.031 0.0306 60.0%
96-108 1.018 0.0184 60.1%108-120 1.011 0.0110 59.8%120-132 1.007 0.0066 60.0%132:144 1.004 0.0040 60.6%144:156 1.002 0.0024 60.0%156:168 1.001 0.0014 58.3%168:180 1.001 0.0008 57.1%
Tail Factor - 72 to Ult 1.132

Traumatic Losses By Injury Type
Death, Permanent Total, Permanent Partial and Temporary Claims

Traumatic Losses By Injury Type
Death, Permanent Total, Permanent Partial and Temporary Claims
Proportion of Losses by Injury Type Act 57 Impacts Largest Claims Severity Subsequent to Law Change
should be Smaller

Traumatic Losses By Injury Type
Permanent Total Claim Count Development
Accident YearReport 1989 1990 1991 1992 1993 1994 1995 1996 1997 199812 mos. 1 2 2 3 1 3 2 4 2 224 mos. 4 5 4 5 3 6 5 5 636 mos. 8 9 12 7 8 7 9 1048 mos. 13 14 13 9 10 12 1360 mos. 15 16 18 10 12 1272 mos. 15 17 19 10 1386 mos. 16 16 19 1096 mos. 16 17 19108 mos. 16 17120 mos. 16

Traumatic Losses By Injury Type
PT Count Development after Act 57Accident Year
Report 1989 1990 1991 1992 1993 1994 1995 1996 1997 199812 mos. 1 2 2 3 1 3 2 0 0 024 mos. 4 5 4 5 3 6 1 0 136 mos. 8 9 12 7 8 7 1 048 mos. 13 14 13 9 8 7 260 mos. 15 16 18 10 8 672 mos. 15 17 17 9 686 mos. 16 16 15 896 mos. 14 12 14108 mos. 12 10120 mos. 11
Traumatic Losses By Injury Type
Act 57 Also made it Easier to Settle Claims Fewer Claims Being Reported as PT Retroactive - Existing PT’s Settled and
Reclassified

Traumatic Losses By Injury Type
Reserve Estimation – Be Careful Incurred Loss Triangles Double Count
Impact of Settlements Understating Reserve Need
Paid Triangles Overstate Reserve Need

Traumatic Losses By Injury Type
Safety Program Impact Drop in Number of Injuries Shift to less Severe Accidents
Losses in Higher Layers
Be Careful - Reserves in Higher Layers may be Inadequate
Loss Development Under Estimates Higher Layers in Most Recent AY Immature years don’t yet have any big losses Change in claims handling Historically there are no Higher Layer Losses
in layer but because of new severe classes or inflation new losses are expected

Losses in Higher Layers
Latest Years’ Lower than HistoricalPolicy Period
1992 1993 1994 1995 1996 1997 1998 1999 2000 2001
Losses Limited to $250,000Ultimate 9,735 14,422 12,928 11,955 14,434 11,442 6,006 11,462 7,185 8,152
Gross LossesUltimate 10,995 15,410 14,141 12,907 15,822 11,862 6,697 12,231 7,615 8,542
Ratio of Gross to $250k12.9% 6.9% 9.4% 8.0% 9.6% 3.7% 11.5% 6.7% 6.0% 4.8%
Five Year Dollar Weighted Average: 9.1% 9.1% 9.1% 9.1% 9.1%Selected Ratio: 6.4% 11.5% 9.1% 9.1% 9.1%
Restated Gross Ultimate Losses: 12,175 6,697 12,510 7,842 8,897 Losses Limited to $250k times [Selected Ratio plus 1.0]

Losses in Higher Layers
Immature Years have No LossesPolicy Period
1992 1993 1994 1995 1996 1997 1998 1999 2000 2001
Case Incurred Losses XS $250,0001,100 840 1,000 730 700 240 350 320 0 0
Excess Loss Development Factor1.145 1.176 1.213 1.304 1.411 1.750 1.974 2.403 2.900 4.500
Ultimate Losses XS $250,0001,260 988 1,213 952 988 420 691 769 0 0
Restated Ultimate Lossses (Five Year Average): 800 800

Losses in Higher Layers
Use Industry Statistics to Fill-in Excess Losses Payroll x Loss Cost x Excess Loss Factor As AY matures rely on actual data more
and moreFor Insurers Do Gross, Ceded and
Net Separately

Losses By Business Segment
Many Self-Insureds have Different Operating Units E.g., Construction vs. Shipbuilding Financial Data Already Split Usually Easy to get Actuarial Data as
Coding already there

Losses By Business Segment
Many Self-Insureds have Different Operating Units E.g., Construction vs. Shipbuilding Financial Data Already Split Usually Easy to get Actuarial Data as
Coding already thereData by Jurisdiction
USL&H Benefits Higher than State Benefits
Combining DataIncreases Credibility for Companies with
Sparse Data

Combining DataIncreases Credibility for Companies with
Sparse DataProvides a Guide to Overall Level

Combining DataIncreases Credibility for Companies with
Sparse DataProvides a Guide to Overall LevelUse Combined Data as Minimum as
usually the Sum of the Slices are greater than the Total Less Variation in Total Smaller Slice with Tail muted by Larger Slice
without Tail Shifting Losses to Longer Tail Slice

Keeping Score
Purpose of Slices - Improve Reserve Estimation Accuracy
Keep Tabs on your Estimates - Keep A Scorecard

Ultimate Losses Valued as of: ChangesPolicy 3-31-97 to 3-31-98 to 3-31-99 toYear 3-31-97 3-31-98 3-31-99 3-31-00 3-31-98 3-31-99 3-31-00
1993 12,399 12,100 12,600 11,928 (299) 500 (672)1994 11,355 11,800 11,800 12,000 445 0 2001995 13,027 13,500 13,700 14,000 473 200 3001996 11,061 10,300 10,900 11,100 (761) 600 2001997 6,563 6,500 5,900 6,000 (63) (600) 100
Subtotal 54,405 54,200 54,900 55,028 (205) 700 128
1998 9,400 9,400 10,600 10,800 0 1,200 2001999 - - 8,450 7,500 7,200 - - (950) (300)2000 - - - - 7,400 7,700 - - - - 3002001 - - - - - - 7,800 - - - - - -
Subtotal 9,400 17,850 25,500 33,500 0 250 200
Total 63,805 72,050 80,400 88,528 (205) 950 328
Keeping Score

Keeping Score
Keep Score of Your Estimates
Workers Comp. Reserving - How and When Should
You Slice the Cake?
Mark J. Mahon, FCAS, MAAA
MBA, Inc.
CLRS - September 23, 2002
Recommended


![Applications of graph traversals [CLRS] – problem 22.2 - Articulation points, bridges, and biconnected components [CLRS] – subchapter 22.4 Topological](https://img.dokumen.tips/doc/110x75/56649cf85503460f949c97af/applications-of-graph-traversals-clrs-problem-222-articulation-points.jpg)