Page1
WOMEN’S REPRESENTATION IN EPSU and AFFILIATES 2014
Introduction This report aims to identify areas of progress and remaining gaps in EPSU and its affiliates towards achieving gender parity since the last Congress. In 2009 EPSU, with the support of its Swedish affiliate Vision (then SKTF), carried out a survey of women’s representation in affiliates’ decision-making bodies and other structures. This compared data from 2008 and 2000 to see to what extent the position of women had changed over that period. The survey findings were published in a report that was presented to the EPSU Executive Committee in November 2009, Women’s representation in EPSU and affiliates, which can be found: www.epsu.org/a/6463 with detailed statistics here: www.epsu.org/a/9735.
The report to the Executive Committee said: “The survey shows there is still a lot of work to do for women and men to take part equally in trade union work at all levels. There are some good practices available but the general picture can be much improved.” This report updates the survey to see whether there have been any improvements in the position of women since 2009.
Main findings Traditionally, women tend to be under-represented in the decision making structures of trade unions, even in sectors where the workforce and union membership is predominantly female. Our aim is to see what improvements there have been and also collect information on what our affiliates might be doing to encourage better female representation and to evaluate the representation of women in EPSU’s statutory bodies. 55 unions in 31 countries replied to the survey, covering a total of 10.6 million workers. 67% of all the membership of the surveyed affiliates are women. The proportions range widely between 80%-90% in the health and social services sector, for some unions, to only 10-20% in public utilities. When we compare the percentage of women as union members with the percentage of women at congress or in the highest decision making bodies we see that there is still a gap. The averages mentioned here also mask a varied picture with greater improvement in some areas than in others. But on the whole some progress has been made and we are moving very much in the right direction in EPSU affiliates structures. On the whole women’s representation has improved. Women made up on average 52% of affiliates’ congress delegates this time round, compared to 49% in 2009. There is a similar rise in the percentage of women in the highest decision making bodies: now 53% up from 50% in 2009.

Page2
Overall 28 affiliates reported an increase in the percentage of women congress delegates while only six reported a decrease. The percentage was unchanged in 10 unions while 11 were unable to provide comparable data. The NTL (Norway) and CFDT (France) both said that they had taken specific measures to encourage women’s participation while the GdG-KMSfB (Austria) reported that it had changed its rules to require a proportional representation. Twenty-three affiliates reported that the proportion of women in their highest decision-making bodies had increased while there had been a fall in 10 unions. There was no change in a further 10 while 12 were unable to provide comparable figures. The proportion of women involved in collective bargaining varied considerably with several unions indicating that women made up either all or none of the officials mainly responsible for negotiations. Breaking it down into broad categories shows six affiliates where women made up less than a third of the collective bargaining team, eight where they were between a third and a half, 15 where they were between half and two-thirds and 10 where they made up over two-thirds of the team. Affiliates were asked whether there were particular obstacles that made it difficult to achieve a gender balance in representation in their organisation. The most common response was to say that the structure of the relevant sector or occupation meant their membership was by its nature male (or female) dominated and so women (or men) tended to be in the minority in the trade union structure. Some affiliates also noted a problem with a male culture within their organisations that made it more difficult to progress while it was also acknowledged that as women continue to be the main carers in a domestic relationship then it was often more difficult for them to find the time to take on trade union duties. EPSU Committees In addition to the survey evidence there is also data on representation in EPSU bodies between 2010 and 2013. Women’s representation on the EPSU Executive Committee has stayed more or less constant during this period at around 40%. In contrast, the Local and Regional Government and National and European Administration Committees have seen a dip in women’s representation although in both cases this was reversed in 2013 with both also achieving around 40% representation. The highest levels of representation are in the Women and Gender Equality Committee varying between 70% and 90% and the Heath and Social Services Committee with no so much variation in the range of 65% and 70%. The lowest level of women’s representation is on the Public Utilities Committee which has seen a fall from a peak of 20% down to 10%. EPSU Congress Women delegates made up 46% of the total at the 2014 Congress with the figures varying by constituency from 32% in South-East Europe to 58% in the Nordic constituency. In terms of participation women made up 49% of delegates who moved or spoke on the resolutions. However, women were less represented among the heads of delegations making up only 32% of the 186 total.

Page3
The ETUC 8th of March Survey The ETUC has been monitoring women’s representation in its affiliates for a number of years now and published its seventh “8th of March” survey in 2013. This provides some interesting data against which to compare developments in EPSU, with some of the main findings including:
- the 47 confederations providing information have a total of 44.4 million members, of
which 19.6 million are women (44.2%).
- te national confederations with the highest rates of female membership are STTK in Finland (75%), followed by LBAS (65%) in Latvia and EAKL (62%) in Estonia.
- The lowest percentage of female members is reported by the two Turkish confederations:
TURK-IS (13%) and HAK-IS (11%) and DEOK-Cyprus (13,7%).
- 12 confederations reported more female than male members: EAKL (Estonia), AKAVA and STTK (Finland), ICTU (Ireland), LBAS (Latvia), LPSK (Lithuania), LO and YS (Norway), CGT (Portugal), SACO and TCO (Sweden) and TUC (UK).
- 27 confederations (out of 47) have a female membership rate equal to or higher than the average of 44.2%.
The survey noted that In the majority of countries in Europe, the growth in female membership has partly compensated for the loss of male membership and so helped to slow the overall decline in union membership. The ETUC survey revealed that women are in minority in all senior positions in national confederations making up only:
- 4 out of 39 presidents - 18 out of 69 vice-presidents - 9 out of 36 general secretaries - 7 out of 20 deputy general secretaries - 9 out of 25 treasurers
- Only 7 women have a leadership position in their national confederation (47 are men).
Most of national confederations have implemented actions and/or policies ensuring the follow-up of ETUC Recommendations for improving gender balance. http://www.etuc.org/sites/www.etuc.org/files/other/files/etuc_8th_march_survey_2014_en_eh.pdf

Page4
ETUC Toolkit to promote initiatives on gender equality
A ‘toolkit’ of initiatives to promote gender equality was launched in Madrid in May 2014 in a joint initiative by European employers and trade union organisations. EPSU contributed a collection of examples to the toolkit. The European social partners – ETUC, Businesseurope, UEAPME and CEEP – signed a Framework of Actions on Gender Equality in 2005 to promote gender equality on the labour market and in the workplace. The toolkit outlines some of the successful initiatives of member organisations.
The toolkit shows the added value of the social dialogue between employers and trade unions, and highlights their commitment and key role in enhancing gender equality throughout the EU.
About 100 initiatives from 25 European countries are contained in the online toolkit accessible at: www.resourcecentre.etuc.org/gendertoolkit or www.erc-online.eu/gendertoolkit

Page5
EPSU affiliates responding to survey – total membership (10.8 million) Union Country Membership
1 HWUA Armenia 7652
2 GdG-KMSfB Austria 155000
3 TULIPSW Azerbaijan 22430
4 TUPHWB Belarus 320246
5 ACOD/CGSP Belgium 15943
6 FTU-HS CITUB Bulgaria 9000
7 HSSMS-MT Croatia 10500
8 Pasydy Cyprus 26383
9 TUSBI Czech Republic 19000
10 Transgas OSTG Czech Republic 652
11 TUHSS Czech Republic 32000
12 HKKF Denmark 4558
13 HK Denmark 60000
14 3F Denmark 32989
15 FOA Denmark 192670
16 Rotal Estonia 2400
17 Tehy Finland 157000
18 Pardia Finland 50023
19 JHL Finland 230264
20 FNME CGT France 60000
21 Interco-CFDT France 60506
22 PSSAWTUG Georgia 5289
23 HSMCTU Georgia 8370
24 Ver.di Germany 2060000
25 BSRB Iceland 20998
26 PSEU Ireland 9500
27 TUHWK Kazakhstan 290131
28 KHWU Kirghistan 2500
29 LVSADA Latvia 11977
30 Sindincomservice Moldova 18600
31 USSCG / Health Union Montenegro 2350
32 Abvakabo Netherlands 349105
33 NUMGE Norway 336355
34 NITO Norway 53100
35 AVYO (YS) Norway 22000
36 NNO Norway 74704
37 NTL Norway 50239
38 Delta Norway 65500
39 SANITAS Romania 10200
40 ALSWU Russia 897942
41 HWURF Russia 2327328
42 SOZZaSS Slovakia 5250
43 FSP-UGT Spain 56000
44 FSC CCOO Spain 230270
45 FEP-USO Spain 12820
46 ST Sweden 64308
47 VISION Sweden 122077
48 Kommunal Sweden 506912
49 SEKO Sweden 81609
50 Vårdförbundet Sweden 110015
51 VPOD SSP Switzerland 36000
52 THWU Tajikistan 3000
53 FBU UK 41916
54 UNISON UK 1370000
55 PROSPECT UK 115636

Page6
Percentage of women Congress delegates 2008 and 2012-2013
Union Country 2012-13 2008
HWUA Armenia 58 53
GdG-KMSfB Austria 50 30
TULIPSW Azerbaijan 39 36
TUPHWB Belarus 54 51
ACOD CGSP Belgium 36 15
FTU-HS_CITUB Bulgaria 73 70
HSSMS-MT Croatia 70 60
PASYDY Cyprus 31 25
Transgas OSTG Czech Republic 20 20
TUHSS Czech Republic 70 75
TUSBI Czech Republic 39 54
FOA Denmark 71 69
3F Denmark 38 40
HK Denmark - -
HKKF Denmark - -
ROTAL Estonia - 50
PARDIA Finland 35 58
THEY Finland 50 -
JHL Finland 50 -
FNME CGT France 18 20
CFDT Interco France 50 46
HPSCTU / HSMCTU Georgia 90 86
PSSAWTUG Georgia 45 32
Verdi Germany 50 50
BSRB Iceland 65 62
PSEU Ireland 43 38
TUHWK Kazakhstan 56 56
KHWU Kyrgyzstan 65 60
LVSADA Latvia - -
Sindindcomservice Moldova 63 60
USSCG / Health Union Montenegro 80 80
Abvakabo Netherlands 36 38
AVYO Norway 50 50
NITO Norway 40 35
DELTA Norway 80 79
NTL Norway 47 33
NNO Norway 100 -
NUMGE Norway 60 58
SANITAS Romania 60 -
HWURF Russia 62 59
ALSWU Russia 55 54
SOZZaSS Slovakia 70 71
FEP USO Spain 25 15
CCOO Spain 41 40
FSP UGT Spain 50 46
Kommunal Sweden 69 65
Vision Sweden 56 63
ST Sweden 54 -
SEKO Sweden 35 39
Vårdförbundet Sweden
VPOD Switzerland 37 31
THWU Tajikistan 72 82
UNISON UK 64 60
FBU UK
PROSPECT UK 14 22

Page7
Percentage of women in highest decision-making bodies 2008 and 2012-2013
Women in highest decision making bodies (%) Union Country 2012-13 2008
HWUA Armenia 45 48
GdG-KMSfB Austria 50 30
TULIPSW Azerbaijan 40 35
TUPHWB Belarus 58 59
ACOD CGSP Belgium
FTU-HS-CITUB Bulgaria 66 48
HSSMS-MT Croatia 90 90
PASYDY Cyprus 22 17
Transgas OSTG Czech Republic 20 20
TUHSS Czech Republic 60 50
TUSBI Czech Republic 36 48
FOA Denmark 63 64
3F Denmark 55 46
HK Denmark 65
HKKF Denmark
ROTAL Estonia 70 70
PARDIA Finland 48 43
THEY Finland 75
JHL Finland 60
FNME CGT France 30 26
CFDT Interco France 50 50
HSMCTU Georgia 60 71
PSSAWTUG Georgia 47 46
Verdi Germany 64 50
BSRB Iceland 41 67
PSEU Ireland 33 33
TUHWK Kazakhstan 46 44
KHWU Kyrgyzstan 64 63
LVSADA Latvia 82
Sindindcomservice Moldova 55 60
USSCG Montenegro 70 70
Abvakabo Netherlands 33
AVYO Norway 40 40
NITO Norway 46 36
DELTA Norway 70 57
NTL Norway 47 47
NNO Norway 89
NUMGE Norway 55 62
SANITAS Romania 21
HWURF Russia 65 60
ALSWU Russia 62 58
SOZZASS Slovakia 70 60
FEP USO Spain 35 20
CCOO Spain 44 44
FSP UGT Spain 45 50
Kommunal Sweden 71 85
Vision Sweden 62 50
ST Sweden 50
SEKO Sweden 44 30
Vårdförbundet Sweden 80
VPOD Switzerland 63 50
THWU Tajikistan 72 82
UNISON UK 68 64
FBU UK 13 11
PROSPECT UK 22
Page8
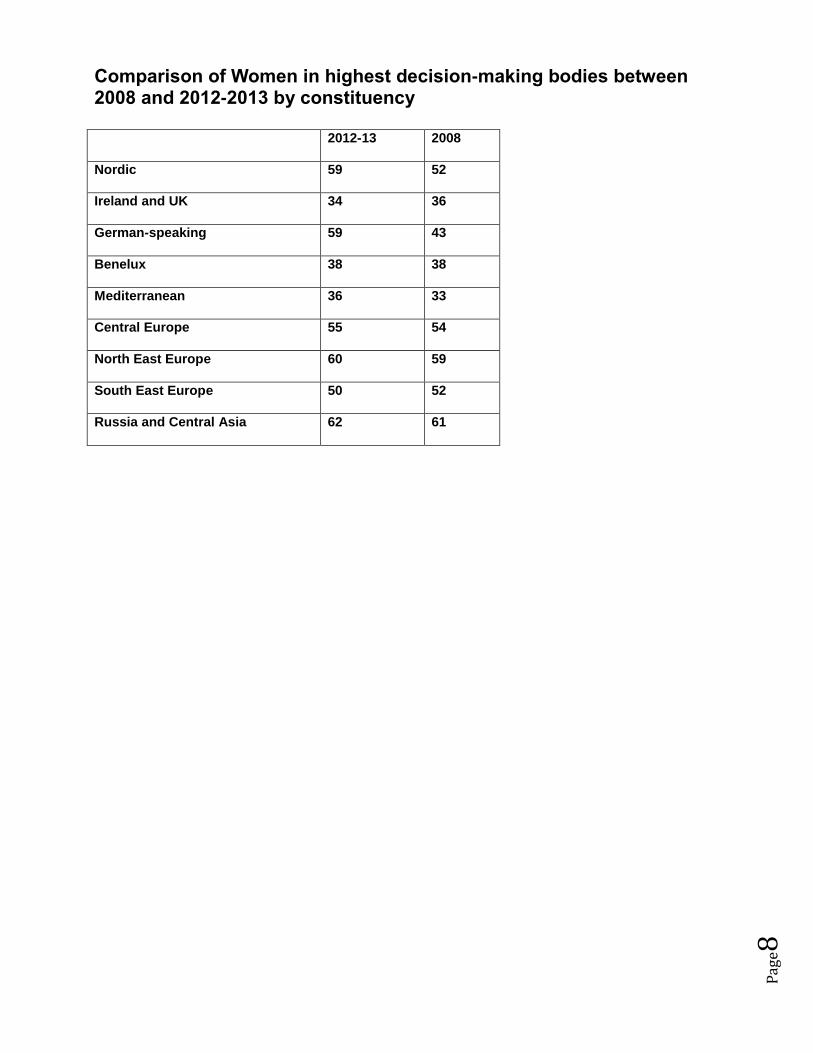
Comparison of Women in highest decision-making bodies between 2008 and 2012-2013 by constituency 2012-13 2008
Nordic 59 52
Ireland and UK 34 36
German-speaking 59 43
Benelux 38 38
Mediterranean 36 33
Central Europe 55 54
North East Europe 60 59
South East Europe 50 52
Russia and Central Asia 62 61

Page9
Percentage of women involved in collective bargaining % of women in collective bargaining/social dialogue unit, or
among union officials responsible for collective bargaining France CFDT 40% France CGT FNME 41.60% (5 out of 12) Armenia – TUHW 51% Austria - GdG-KMSfB 0 out of 2 – but varies between sectors (20%-80%) Azerbaijan – TULIPSW 50% Bulgaria –FTU-HS Headquarters: 100% (1 woman), Regionally: 65% Belarus – UPHWB 100% (1 Woman) Croatia - HSSMS-MT 100% Cyprus – PASYDY 0% Czech Republic – OS Transgas 100% (1 woman) Czech Republic – TUHSS 70% Germany – Ver.di 50% Denmark - 3F 40% Denmark – FOA 61% Denmark - HK/Kommunal 40% Denmark – HKKF 0% Estonia – ROTAL 75% Spain - FSC CC.OO 44% Spain - FEP-USO 50% Spain -FSP-UGT 63% - 5 out of 8 including technical support Filand – Pardia 25% Finland – They 73% (11 out of 15) Georgia - (HSMCTU 30% Georgia – PSSAWTUG 90% Iceland – BSRB 54% Ireland – PSEU 25% - 2 out of 8 Finland – JHL 57% Kazakhstan – TUHWK 50% Kyrgyztan – KHWU 72% Moldova - Sindindcomservice 40% Netherlands - AbvaKabo FNV 56% Norway – DELTA 50% Norway – NITO 33.3% Norway – NSF 55% Norway – NTL 57% Norway – NUMGE 50% Romania – SANITAS 2-3% Russia – ALSWU About 60% Russia - HWURF 60% Slovakia – SOZZASS 60% (3 women, 2 men) Sweden – Kommunal 50% Sweden - Fackförbundet ST 53% Sweden – Vision 38% Sweden – SAHP 73% - 8 out of 11 Switzerland - VPÖD/SSP No distinct service. Women make up half of the regional secretaries
who are involved in negotiations. Tajikistan - THWU 70% United Kingdom – FBU 12.5% - 1 out of 8 United Kingdom - PROSPECT We do not have these statistics. United Kingdom - UNISON 51%

Page10
Main obstacles in achieving a better balance between women and men members in the trade union Main obstacles in achieving a better balance between women and
men members in your union France – CFDT Trade union culture, masculine trade union practice but progress-
women are reluctant to engage and privilege family life the mining sector is very masculine
Austria – GdG-KMSfB Rules of the union Bulgaria – FTU-HS No obstacles Croatia – HSSMS-MT Members of TU are mostly women Cyprus – PASYDY Late entry of women in public services and slow ascent in the union
decision making bodies Czech Republic – OS Transgas High percentage of men in our sector Czech Republic – TUHSS resort - mostly women Germany – Ver.di Women are often passed over being seen as not being adequately
qualified. However, this is just a justification for not relinquishing positions of power and influence. Sometimes it is difficult to get women involved as they don’t have the confidence to think they can cope with the job and its related responsibilities.
Denmark – 3F 3F (creation: 2005) was formed with an agreement of Fair Representation. 2010: agreement on equality and diversity, focusing on fair representation according to sex, age and ethnicity.
Denmark – FOA The number of male and female members of FOA reflects the low percentage of male employees in most of the jobs covered by collective agreements negotiated by FOA. FOA has financed research/a PhD scholarship concerning men in caring occupations and how to overcome obstacles for a higher number and percentage of men in these occupations. FOA is mainstreaming gender as far as different actions are concerned, for example collective bargaining, and strive to appeal to both sexes when communicating to members and employees in the caring occupations.
Denmark – HK/Kommunal Majority of our members: women. In other smaller professions: most of the employees are men. “The main obstacle is that the Danish Labour Market is very gender split. Most women in public sector. Most men in the private sector”
Denmark – HKKF Recruitment of the armed forces Estonia – ROTAL We did not have so much female dominated workers members of TU. Spain – FSC CC.OO The lack of women, lack of willing to candidate in Trade Union election,
and the work organisation in the Trade Union. Spain – FSP-UGT Responsibility in Trade-Union take time. Spanish Women do the
housework, so they don’t have time + cut in childcare and there is a high level of male membership in the federation
Finland – Tehy More than 90% of members are female so that reflects in the balance. For the first time Tehy has a male president after 4 female presidents
Georgia – HSMCTU Mostly women in health sector Georgia – PSSAWTUG The existence of low wages Iceland – BSRB The labour market is highly gender segregated. The health care and
social services sectors are in majority occupied by women while the police force mainly constitutes of men. Many members of BSRB do work on those sectors.
Ireland – PSEU There are no institutional obstacles. There is a reluctance to become involved which we try to address through a continuous programme of encouragement and education. We have conducted a seminar on the issue of women’s participation recently with our Branch representatives. Hopefully, the output from those workshops will produce some actions for us to try and improve the level of participation. (Report of the seminar: www.pseu.ie/pdf/diversity13.pdf)

Page11
Finland – JHL “Many of the sectors we represent are predominantly female” Kazakhstan – TUHWK No obstacles Kyrgyztan – KHWU No obstacles Montenegro – TUHM More women than men in T.U of Health. Netherlands – AbvaKabo FNV “Although there is a majority of female members, there is a majority of
male members active for the union interests. In general female members take more interest in individual protection of interest rather than collective protection of interest. Therefore they are less active female members compared to the number of active male members. It is difficult to change this situation because the majority of male union activists rule the culture and structure of the union.”
Norway – NITO “We have not identified any specific obstacles. Actually the balance is acceptable compared to the balance between women and men among the members”.
Norway – NSF Most of our members are female and this is reflected in the whole organization
Norway – NTL Keeping a steady focus on gender equality, gender pay gap and recruitment of female elected representatives
Norway – NUMGE According to our rules it shall be at least 40% representation of the underrepresented gender in all elected organs. Our principle and action program, which has a separate chapter on gender equality and women’s rights.
Romania – SANITAS Women are more dedicated to family life + Women are not promoted Russia – ALSWU gender balance has been rather even so far due to nature of jobs
organized Slovakia – SOZZASS Predominance of women in health and social services area Sweden – SEKO Some branches dominates by men (energy…). None of our branches
dominated by women Switzerland – VPÖD/SSP Rules on quotas means that there more or less a balance both in
relation to membership and in the committees. The rules have required proportional representation on committees since the 1990s. In some committees this is difficult to implement because of well-known problems but basically the policy has been successful.
Tajikistan – THWU No obstacles UK – FBU The fire service is perceived as being a male dominated industry UK – UNISON Women’s caring responsibilities impacting on the time available for
trade union activity. Potential for employer discrimination against trade union activists, and refusal to grant paid facility time for trade union duties. Cuts in staffing due to government austerity measures have increased pressure on employees

Page12
Women’s representation in EPSU Statutory meetings 2010-2013 (based on participation in the EPSU Statutory Meetings (GEC, NEA, LRG, HSS, PUT, EC)
0
10
20
30
40
50
60
70
80
90
100
2010 2011 2012 2013
GEC
NEA
LRG
HSS
PUT
EC
Page13
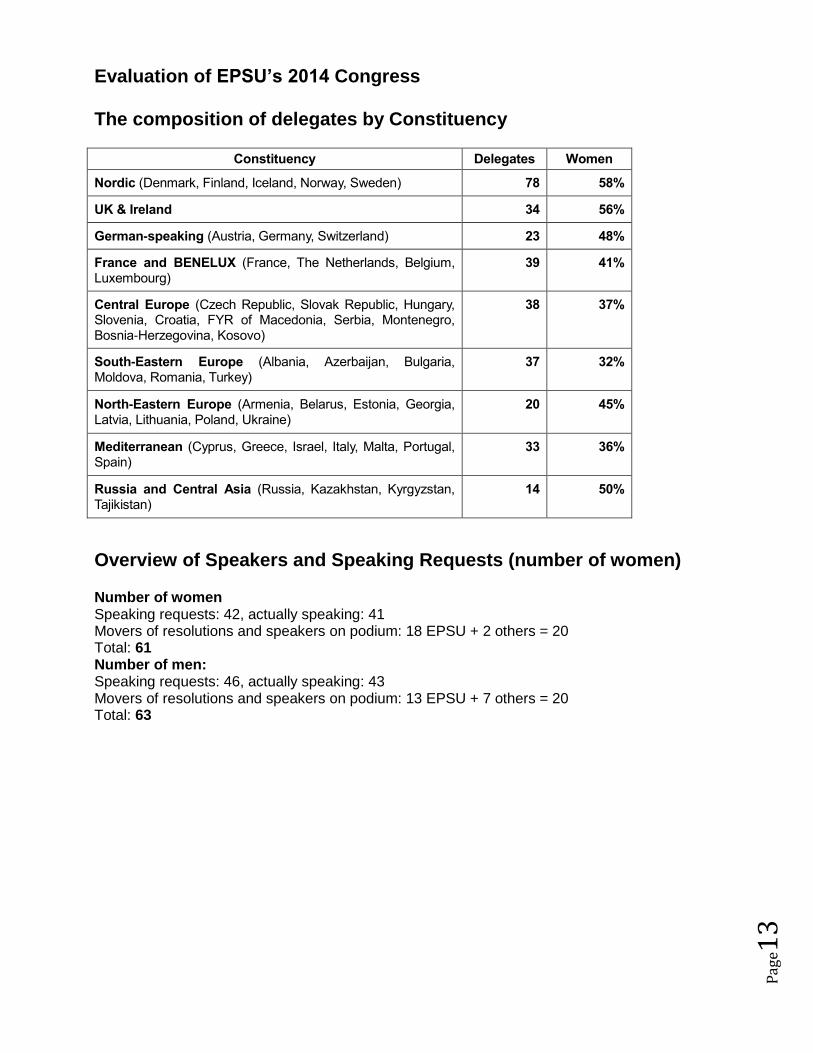
Evaluation of EPSU’s 2014 Congress The composition of delegates by Constituency
Constituency Delegates Women
Nordic (Denmark, Finland, Iceland, Norway, Sweden) 78 58%
UK & Ireland 34 56%
German-speaking (Austria, Germany, Switzerland) 23 48%
France and BENELUX (France, The Netherlands, Belgium, Luxembourg)
39 41%
Central Europe (Czech Republic, Slovak Republic, Hungary, Slovenia, Croatia, FYR of Macedonia, Serbia, Montenegro, Bosnia-Herzegovina, Kosovo)
38 37%
South-Eastern Europe (Albania, Azerbaijan, Bulgaria, Moldova, Romania, Turkey)
37 32%
North-Eastern Europe (Armenia, Belarus, Estonia, Georgia, Latvia, Lithuania, Poland, Ukraine)
20 45%
Mediterranean (Cyprus, Greece, Israel, Italy, Malta, Portugal, Spain)
33 36%
Russia and Central Asia (Russia, Kazakhstan, Kyrgyzstan, Tajikistan)
14 50%
Overview of Speakers and Speaking Requests (number of women) Number of women Speaking requests: 42, actually speaking: 41 Movers of resolutions and speakers on podium: 18 EPSU + 2 others = 20 Total: 61 Number of men: Speaking requests: 46, actually speaking: 43 Movers of resolutions and speakers on podium: 13 EPSU + 7 others = 20 Total: 63

Page14
Women heads delegations
Country Women Heads of Delegation out of total
for each country Albania 1/2 Armenia 2/2 Austria 0/5 Azerbaijan ¼ Belarus 0/1 Belgium 1/8 Bosnia-Herzegovina 0/4 Bulgaria 4/7 Croatia 1/2 Cyprus 0/4 Czech Republic 5/10 Denmark 5/13 Estonia 1/2 Finland 3/5 France 4/9 FYR of Macedonia 1/4 Georgia 1/3 Germany 1/1 Hungary 1/3 Iceland 0/1 Ireland 0/4 Israel 0/2 Italy 1/2 Kazakhstan 1/1 Kosovo 0/1 Kyrgyzstan 0/1 Latvia 1/2 Lithuania 1/2 Moldova 1/3 Montenegro 0/3 Netherlands 2/3 Norway 2/10 Poland 1/1 Portugal 0/2 Romania 2/9 Russia 0/3 Serbia 0/6 Slovakia 1/4 Slovenia 0/1 Spain 2/5 Sweden 5/6 Switzerland 1/1 Tajikistan 1/2 Turkey 0/6 Ukraine 2/6 United Kingdom 4/8 TOTAL 60/186
Page15
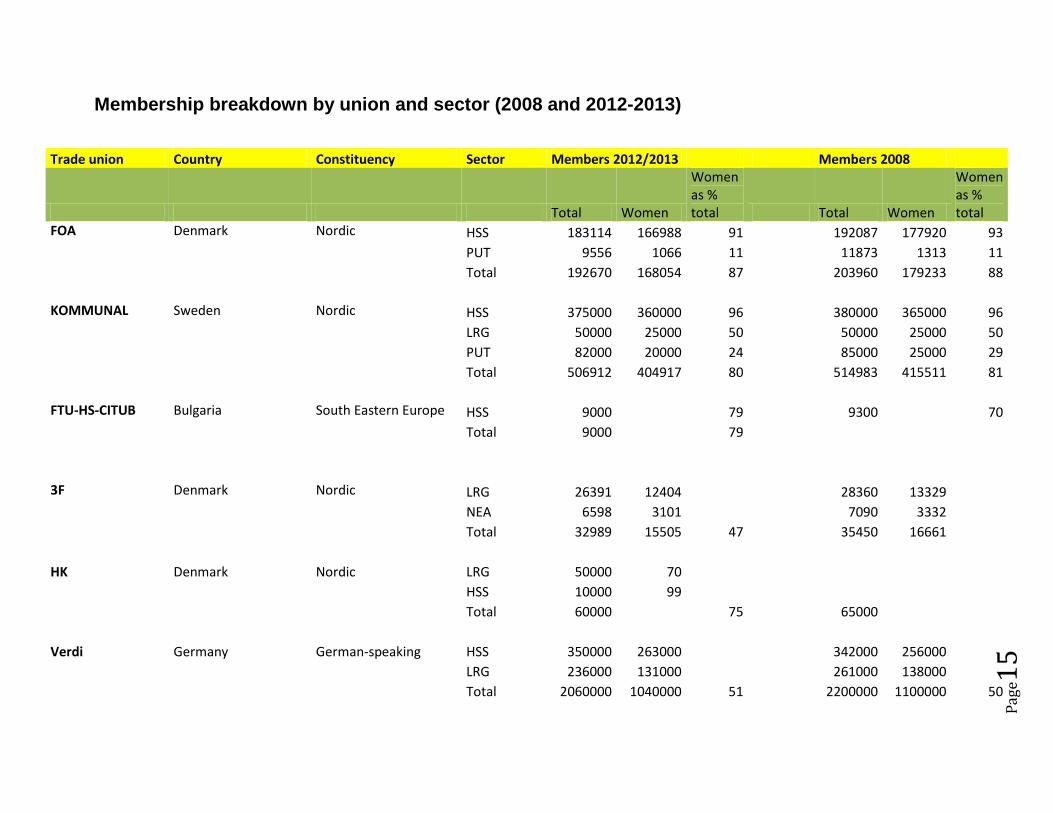
Membership breakdown by union and sector (2008 and 2012-2013)
Trade union Country Constituency Sector Members 2012/2013 Members 2008
Total Women
Women as % total Total Women
Women as % total
FOA Denmark Nordic HSS 183114 166988 91
192087 177920 93 PUT 9556 1066 11
11873 1313 11
Total 192670 168054 87
203960 179233 88
KOMMUNAL Sweden Nordic HSS 375000 360000 96
380000 365000 96 LRG 50000 25000 50
50000 25000 50
PUT 82000 20000 24
85000 25000 29 Total 506912 404917 80
514983 415511 81
FTU-HS-CITUB Bulgaria South Eastern Europe HSS 9000
79
9300
70 Total 9000
79
3F Denmark Nordic LRG 26391 12404
28360 13329 NEA 6598 3101
7090 3332
Total 32989 15505 47
35450 16661
HK Denmark Nordic LRG 50000 70
HSS 10000 99
Total 60000
75
65000
Verdi Germany German-speaking HSS 350000 263000
342000 256000
LRG 236000 131000
261000 138000
Total 2060000 1040000 51
2200000 1100000 50

Page16
Transgas OSTG Czech Republic Central Europe PUT 652 193
700 157
Total 652 193 24
700 157
TUHSS Czech Republic Central Europe HSS 32000 26000 80
38000 33000 87
Total 32000
38000
ROTAL Estonia North Eastern Europe HSS 300 300
600 600
LRG 300 200
200 200
NEA 1800 500
1600 800
Total 2400 1000 42
2400 1600 72
LVSADA Latvia North Eastern Europe HSS 11977 10439
16442 14370
Total 11977
87
16442
Abvakabo Netherlands Benelux France HSS 142417 115454
145424 108696
LRG 49124 19117
52858 18155
NEA 21116 7715
21903 7337
PUT 9525 1365
10474 1373
Total 349105 190965 55
348615 179628 51
AVYO Norway Nordic NEA 22000
60
23000
60
Total 22000
60
23000
60
Vision Sweden Nordic HSS
LRG
PUT
Total 122077 88481 75
118761 87233
UNISON UK Ireland UK HSS 457116 370000
461000 368800
LRG 726184 558000
779500 585000
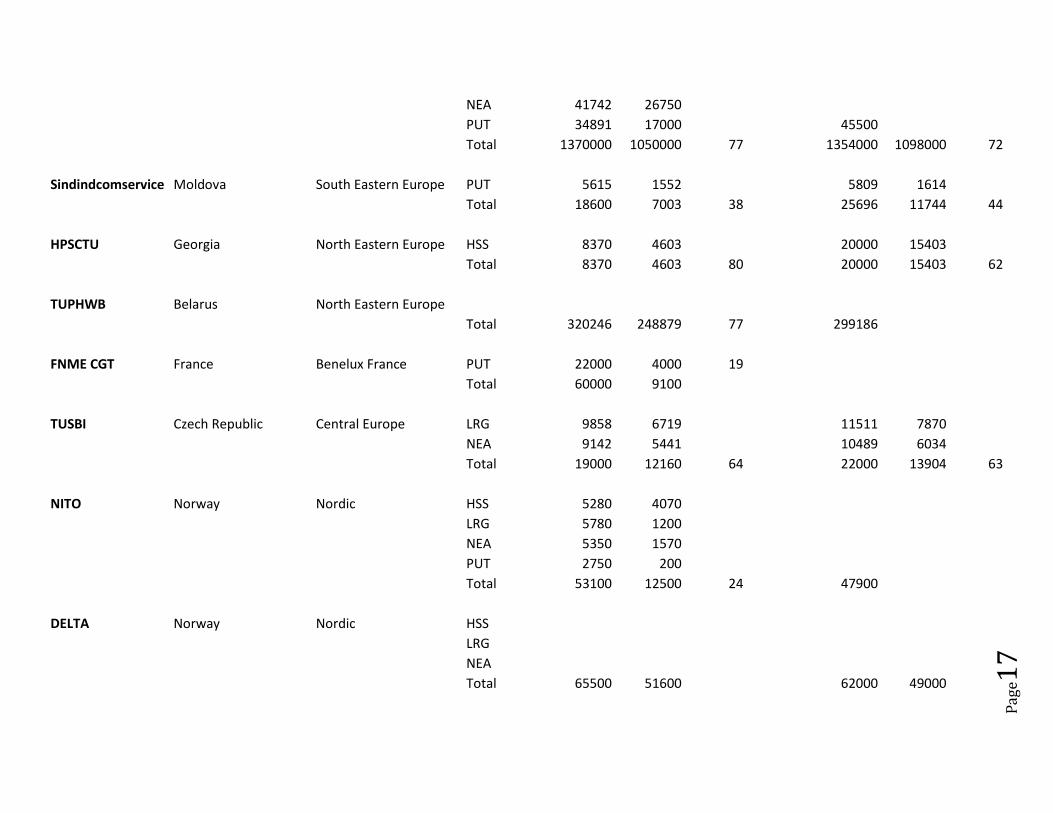
Page17
NEA 41742 26750
PUT 34891 17000
45500
Total 1370000 1050000 77
1354000 1098000 72
Sindindcomservice Moldova South Eastern Europe PUT 5615 1552
5809 1614
Total 18600 7003 38
25696 11744 44
HPSCTU Georgia North Eastern Europe HSS 8370 4603
20000 15403
Total 8370 4603 80
20000 15403 62
TUPHWB Belarus North Eastern Europe
Total 320246 248879 77
299186
FNME CGT France Benelux France PUT 22000 4000 19
Total 60000 9100
TUSBI Czech Republic Central Europe LRG 9858 6719
11511 7870
NEA 9142 5441
10489 6034
Total 19000 12160 64
22000 13904 63
NITO Norway Nordic HSS 5280 4070
LRG 5780 1200
NEA 5350 1570
PUT 2750 200
Total 53100 12500 24
47900
DELTA Norway Nordic HSS
LRG
NEA
Total 65500 51600
62000 49000

Page18
PARDIA Finland Nordic NEA 37436 23176
55000 32800
PUT 12587 8474
5000 2000
Total 50023 31650 63
60000 34800 57
HWURF Russia Russia and Central Asia HSS 2327328 1944642
2605090 2117893
Total 2327328 1944642 84
2605090 2117893
Health Union Montenegro South Eastern Europe HSS 2350 1570 67
2430 1620 67
Total 2350
2430
PSEU Ireland Ireland UK NEA 8700 5356
9250 5365
PUT 800 488
1250 725
Total 9500 5795 61
10500 6090 53
PASYDY Cyprus Mediterranean HSS 4719 3436
3990 2928
NEA 16099 8363
14777 7210
PUT 5565 1354
1195 397
Total 26383 13153 50
19962 10535 46
CFDT Interco France Benelux France LRG 50440
41551
NEA 5506
5591
PUT 3762
3213
Total 60506 39460 59
53078 31109 54
THEY Finland Nordic HSS
100
Total 157000 144148 92
NTL Norway Nordic
Total 50239 30619 61
47396 28574 58
NNO Norway Nordic HSS 73210 61834
66020 56715

Page19
NEA 1494 1360
1347 1256
Total 74704 68400 92
67367 61865
SANITAS Romania South Eastern Europe HSS 10200 8200 85
10200 8200 85
Total 10200 8200 85
10200 8200 85
VPOD Switzerland German-speaking HSS 14824 11310
7511 5809
LRG 3149 1779
3110 1622
PUT 3363
3523
Total 36000 18800 53
35500 16100 43
THWU Tajikistan Russia and Central Asia HSS 3000 2100 72
2500 2250 82
Total 3000 2100
3000 2250
KHWU Kirghistan Russia and Central Asia HSS 2500 2100
2300 1930
Total 2500 2100 84
2300 1930 84
FEP USO Spain Mediterranean
Total 12820 7150 56
15460 8503 55
CCOO Spain Mediterranean LRG-PUT 28189 15578
32044 17970
LRG 52959 20151
59972 20916
NEA 13504 5574
17434 7566
Total 230270 82034 36
260363 91954 33
ALSWU Russia Russia and Central Asia PUT
852049
Total 897942 461542 51
1078183 542326 50
GdG-KMSfB Austria German-speaking LRG 80000 40000
90000 40000
PUT 30000 10000
30000 10000
HSS 35000 23000
35000 23000

Page20
Total 155000 77000 49
146000 73000 49
SOZZaSS Slovakia Central Europe HSS 5250 3712
7320 5344
Total 5250 3712 71
7320 5344 73
PSSAWTUG Georgia North Eastern Europe NEA 4934 1837
6516 2014
Total 5289 2112 40
6516 2014 47
TULIPSW Azerbaijan South Eastern Europe PUT 20850 6570
20300 6500
Total 22430 6740 31
22500 6270 30
HSSMS-MT Croatia Central Europe HSS 10500
12000
Total 10500 8400 80
12000 9600 80
BSRB Iceland Nordic Total 20998 15201 69
20877 14856 70
ACOD-CGSP Belgium Benelux France NEA
Total 15943 7896 50
10244 5025 49
FBU UK Ireland UK LRG
Total 41016 2759 7
45410 2470 5
TUHWK Kazakhstan Russia and central Asia HSS
Total 290131 223902 79
244842 192114 78
HKKF Denmark Nordic NEA 4458
5003
Total 4558 260 6
5003 301 6
FSP UGT Spain Mediterranean HSS 12562
10000 5100
LRG 32000
29100 14841
NEA 9500
9000 3610

Page21
PUT 1938
7900 3318
Total 56000 31920 57
56000 27542 51
HWUA Armenia North eastern Europe HSS 7652
7500
Total 7652 6152 82
7500 6000 80
NUMGE Norway Nordic HSS 154684 138656
LRG 51277 39779
PUT 130404 89558
Total 336355 267993 80
ST Sweden Nordic NEA
PUT
Total 64308 40994 64
66809 43859 67
JHL Finland Nordic
Total 230264 160388 70
216868 156323
Prospect U.K. Ireland UK Total 115636 27146 24
21
SEKO Sweden Nordic NEA 14378 4667
16965 5073
PUT 4171 279
Total 81609 21623 26
91473 25513 30
Vårdförbundet Sweden Nordic HSS 110015
91
110453
92
Total 110015
91
110453
92
Recommended