Water supply from the Iber-Lepenc hydro system for the proposed Kosovo C power plant 1
European Agency for Reconstruction
WATER SUPPLY FROM THE IBER-LEPENC HYDRO SYSTEM FOR THE PROPOSED KOSOVO C POWER PLANT Beneficiary Framework Contract
Lot No. 4: Energy and Nuclear Safety
Letter of Contract No: 04KOS03/01/04
Final Report
February 1st, 2008
Prepared by the COWI Consortium
Water supply from the Iber-Lepenc hydro system for the proposed Kosovo C power plant 2
WWWAAATTTEEERRR SSSUUUPPPPPPLLLYYY FFFRRROOOMMM TTTHHHEEE IIIBBBEEERRR---LLLEEEPPPEEENNNCCC HHHYYYDDDRRROOO SSSYYYSSSTTTEEEMMM
FFFOOORRR TTTHHHEEE PPPRRROOOPPPOOOSSSEEEDDD KKKOOOSSSOOOVVVOOO CCC PPPOOOWWWEEERRR PPPLLLAAANNNTTT
Kosovo, February 1st, 2008

Water supply from the Iber-Lepenc hydro system for the proposed Kosovo C power plant 3
Table of contents
1 Methodology
2 Data availability and adequacy
3 Assessment of water supplies and estimation of investment needs
3.1 Can the system supply sufficient water to the Kosovo C power plant?
3.2 Are investments needed for repairs or rehabilitation or system extension?
3.3 What is the approximate scale of these investments?
4 Water pricing
4.1 Assessment of appropriate tariff levels and the impact of possible investments for repairs or system extension?
4.2 What are the priorities between all customer groups?
4.3 Can these priorities be reflected only through a pricing mechanism or is continuing cross-subsidy justified and/or practical?
5 Annexes
Annex 1 – Financial Forecasts of Iber-Lepenc Enterprise
Annex 2 – Sensitivity Analysis
Annex 3 – Canal Status Forms
Annex 4 – Proposed Terms of Reference for urgent canal repairs
Annex 5 – Proposed Terms of Reference for buffer basin detailed design
6 Consulted Sources
Water supply from the Iber-Lepenc hydro system for the proposed Kosovo C power plant 4
LIST of ABBREVIATIONS EAR European Agency for Reconstruction ESTAP Energy Sector Technical Assistance Projects GWh Gigawatthour ha Hectare HEPS Hydroelectric Power Station ILE Iber-Lepenc Enterprise KIRP Kosovo Irrigation Rehabilitation LPTAP Lignite Power TA Project MBFIR Minimum Biological Flow in Iber River ML Main lake (Gazivoda)
MMPH
Ministria e Mjedisit Dhe Planifikimit Hapësinor (Ministry for Environment and Spatial Planning, Kosova)
MWh Megawatthour SR Secondary Reservoir (Pridvorice) TA Technical Assistance WB World Bank

Water supply from the Iber-Lepenc hydro system for the proposed Kosovo C power plant 5
1 Methodology The assessment of water availability for the future Kosovo C power plant has been developed in several steps with respect to water demand and flows: demand by category of users, natural water inflows, water balance in the main sections of the hydro system. The first calculated values are the net demand for each user, using historical data (records supplied by Iber-Lepenc Enterprise), the design water flow needed for the Kosovo C power plant and several assumptions regarding domestic and irrigation demands. Two hypotheses have been taken into account for the irrigated area: 5,000 and 10,000 ha. The current losses from the main canal have been estimated on the basis of a thorough inspection of the canal and of calculations related to different sources of leakages (estimated current losses: 50%). For the future, the Consultant assumes that it is possible (and desirable) to reduce these losses to 25% of the total water volume entering the main canal. To have a more realistic assessment of the water flow and the water balance in the two lakes (including a possible compensation in time), the calculation uses monthly demand and rainfall. Since the available data regarding natural inflow to the Gazivoda lake date back many years (1948 – 1972), the Consultant developed two approaches: the first one considering multi-annual average monthly rainfall as a basis for the water balance; the second using the monthly rainfall during the worst year of that period. In both cases, the system is able to provide enough water for all users (both now and in the future). A sensitivity analysis has been developed for three variables: natural inflow to the main lake (single source of water); water losses from the main canal (real, physical losses); and water used for irrigation (the initial purpose of the canal).
All the calculations made have been included in the spreadsheets named Flow and Balance.xls (for multi-annual average rainfall and 5,000 ha of irrigated land) and Flow and Balance Worst.xls (for worst year rainfall and 10,000 ha of irrigated land). The volume and specifications of the repairs needed have been assessed on the basis of the thorough inspection of the canal. The Consultant has also identified the need to have a buffer basin at the end of the canal, because of the specificities of the hydro system and of the characteristics of the Kosovo C power plant. A detailed calculation of the required capacity and of the investment amount will be provided by an additional feasibility study, but some indication is already given in this report. The Consultant has also envisaged other possible solutions that could replace this buffer basin. The appropriate tariffs calculation comes from the operational and financial models developed by Iber-Lepenc Enterprise (Excel files named Model ILE.xls and Model ILE Without Investments.xls). The models calculate the main financial statements in different hypotheses and develop more advanced sensitivity analyses. The priority between the five customer groups has been established using eight analysis criteria.
Water supply from the Iber-Lepenc hydro system for the proposed Kosovo C power plant 6
An additional water availability assessment, based on the simulation of three scenarios using a mathematical model, is described in Water Availability.doc. This document also contains the development of the re-pumping solution for the hydroelectric power plant.
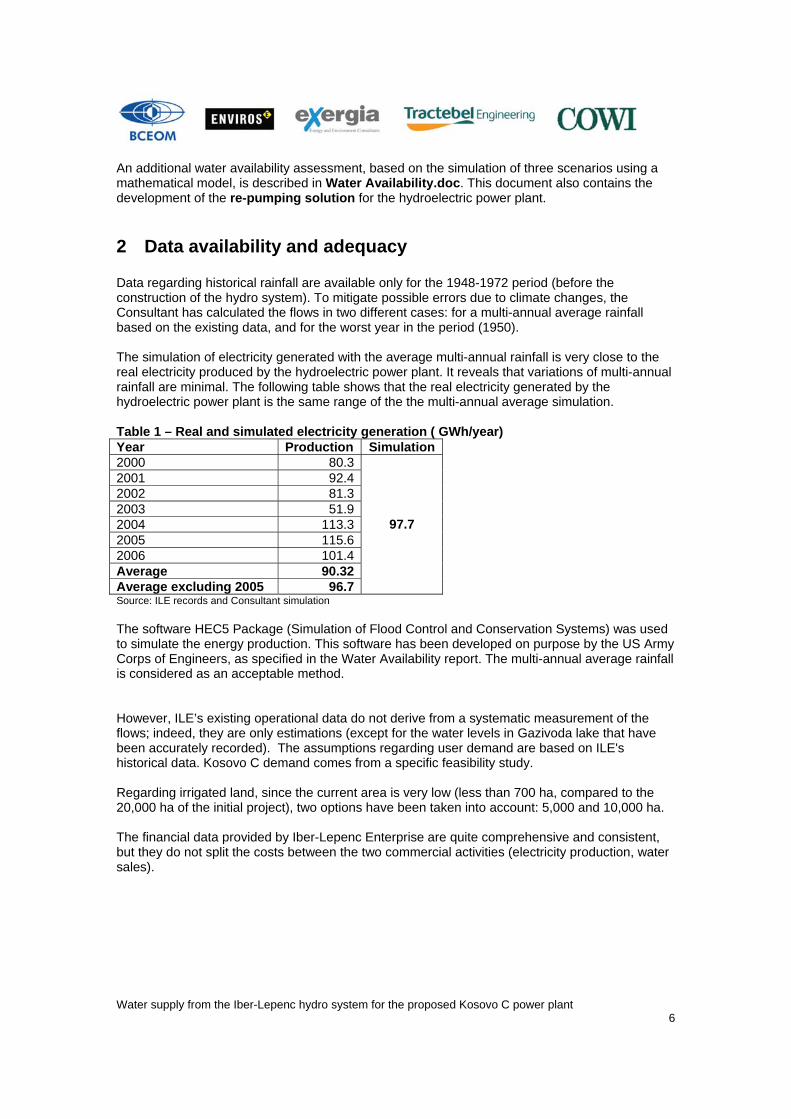
2 Data availability and adequacy Data regarding historical rainfall are available only for the 1948-1972 period (before the construction of the hydro system). To mitigate possible errors due to climate changes, the Consultant has calculated the flows in two different cases: for a multi-annual average rainfall based on the existing data, and for the worst year in the period (1950). The simulation of electricity generated with the average multi-annual rainfall is very close to the real electricity produced by the hydroelectric power plant. It reveals that variations of multi-annual rainfall are minimal. The following table shows that the real electricity generated by the hydroelectric power plant is the same range of the the multi-annual average simulation. Table 1 – Real and simulated electricity generation ( GWh/year) Year Production Simulation 2000 80.32001 92.42002 81.32003 51.92004 113.32005 115.62006 101.4Average 90.32Average excluding 2005 96.7
97.7
Source: ILE records and Consultant simulation The software HEC5 Package (Simulation of Flood Control and Conservation Systems) was used to simulate the energy production. This software has been developed on purpose by the US Army Corps of Engineers, as specified in the Water Availability report. The multi-annual average rainfall is considered as an acceptable method. However, ILE’s existing operational data do not derive from a systematic measurement of the flows; indeed, they are only estimations (except for the water levels in Gazivoda lake that have been accurately recorded). The assumptions regarding user demand are based on ILE's historical data. Kosovo C demand comes from a specific feasibility study. Regarding irrigated land, since the current area is very low (less than 700 ha, compared to the 20,000 ha of the initial project), two options have been taken into account: 5,000 and 10,000 ha. The financial data provided by Iber-Lepenc Enterprise are quite comprehensive and consistent, but they do not split the costs between the two commercial activities (electricity production, water sales).

Water supply from the Iber-Lepenc hydro system for the proposed Kosovo C power plant 7
3 Assessment of water supplies and estimation of investment needs
3.1 Can the system supply sufficient water to the Kosovo C power plant?
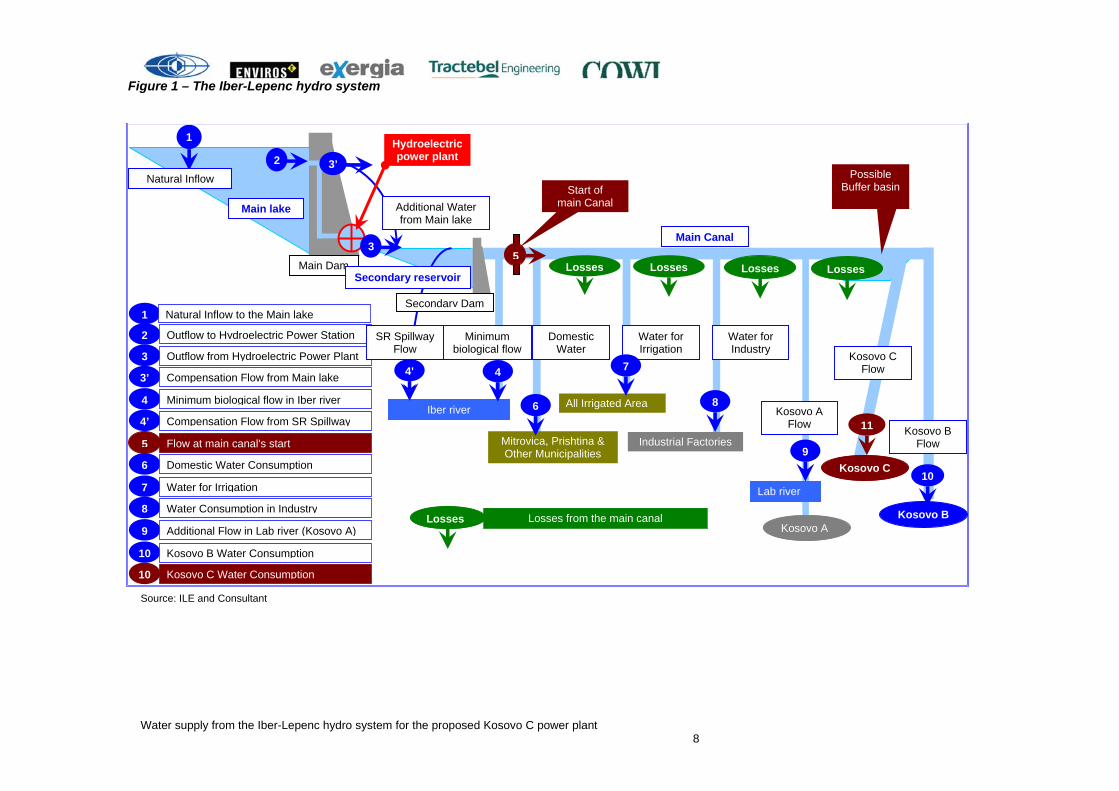
3.1.1 Description of the hydro system The Iber-Lepenc hydro system has been designed to serve four main categories of water users: • Households in Mitrovica, in Prishtina and in other small municipalities; • Irrigated land upstream of Sitnica river and in the Drenica urban area (approx. 20,000 ha); • Several industrial sites (metallurgical factories, manufacturing plants and other sites); • Major group of thermoelectric power plants (Kosovo A, B and C), producing energy from
lignite. At the same time, the Hydroelectric Power Station, using water from Gazivoda lake, was due to produce some 100 GWh per year. However, the system has never worked at full capacity: the Kosovo C power plant has not been built yet (it will be erected in the near future), and the irrigation plan, like some of the industrial plants, have not been fully developed. Right now, the system works at a low level, due to war destruction and to the changes that have taken place in the economic structure after this period. Only the Hydroelectric Power Station is working close to its design capacity, and in 2006, it was able to account for 68% of the revenue of Iber-Lepenc Enterprise, the administrator of the entire system. In 2004 –2005, the weight of electricity sales in the revenue was 79%. The hydro system is still functional in most of its components, but some elements need to be repaired or renewed. The simplified physical and operational structure of the Iber-Lepenc hydro system is illustrated in Figure 1. It reproduces more or less the real system:
Kosovo B (plus partly A, and possibly C in the future) are supplied with water at the end of the canal;
Most of the water used for domestic consumption goes to Mitrovica, at the start of the canal;
Most of the irrigated area lies between these two points. A more detailed description is not strictly required for the present approach.
Water supply from the Iber-Lepenc hydro system for the proposed Kosovo C power plant 8
Source: ILE and Consultant
3 Outflow from Hydroelectric Power Plant
5 Flow at main canal's start
4’ Compensation Flow from SR Spillway
4 Minimum biological flow in Iber river
3’ Compensation Flow from Main lake
2 Outflow to Hydroelectric Power Station
10 Kosovo B Water Consumption
1 Natural Inflow to the Main lake
6 Domestic Water Consumption
7 Water for Irrigation
8 Water Consumption in Industry
9 Additional Flow in Lab river (Kosovo A)
10 Kosovo C Water Consumption
Kosovo B
Minimum biological flow
Iber river
Start of main Canal
Possible Buffer basin
Domestic Water
Water for Irrigation
Water for Industry
Kosovo C Flow
Mitrovica, Prishtina & Other Municipalities
All Irrigated Area
Industrial Factories
Kosovo C
Additional Water from Main lake
Main lake
Main Dam
Hydroelectric power plant
Lab river
Kosovo A Flow
Main Canal
1
2
5Losses Losses Losses Losses
Losses Losses from the main canal
Secondary reservoir
4'
Secondary Dam
3
3’
4
6
7
8
9
11
Kosovo A
SR Spillway Flow
Natural Inflow
10
Kosovo B Flow
Figure 1 – The Iber-Lepenc hydro system
Water Supply from the Iber-Lepenc hydro system for the proposed Kosovo C Power Plant 9
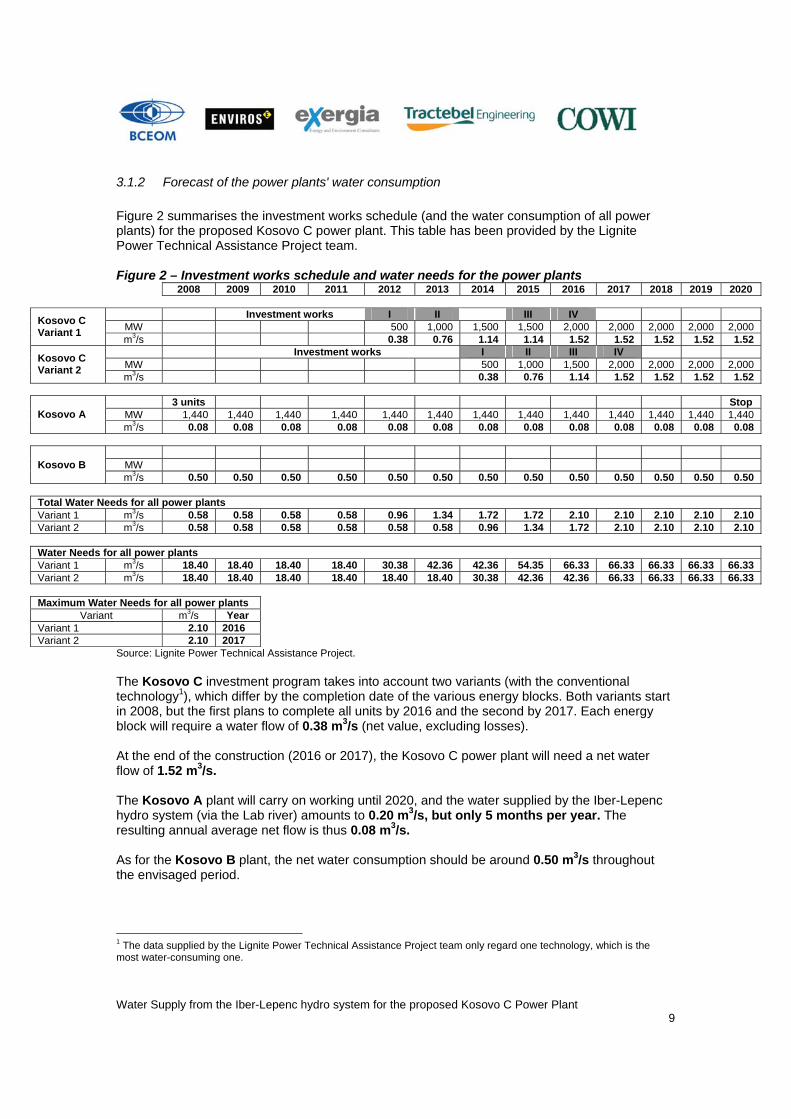
3.1.2 Forecast of the power plants' water consumption Figure 2 summarises the investment works schedule (and the water consumption of all power plants) for the proposed Kosovo C power plant. This table has been provided by the Lignite Power Technical Assistance Project team. Figure 2 – Investment works schedule and water needs for the power plants
2008 2009 2010 2011 2012 2013 2014 2015 2016 2017 2018 2019 2020
Investment works I II III IV MW 500 1,000 1,500 1,500 2,000 2,000 2,000 2,000 2,000 Kosovo C
Variant 1 m3/s 0.38 0.76 1.14 1.14 1.52 1.52 1.52 1.52 1.52
Investment works I II III IV MW 500 1,000 1,500 2,000 2,000 2,000 2,000 Kosovo C
Variant 2 m3/s 0.38 0.76 1.14 1.52 1.52 1.52 1.52
3 units Stop
MW 1,440 1,440 1,440 1,440 1,440 1,440 1,440 1,440 1,440 1,440 1,440 1,440 1,440 Kosovo A m3/s 0.08 0.08 0.08 0.08 0.08 0.08 0.08 0.08 0.08 0.08 0.08 0.08 0.08
MW Kosovo B m3/s 0.50 0.50 0.50 0.50 0.50 0.50 0.50 0.50 0.50 0.50 0.50 0.50 0.50 Total Water Needs for all power plants Variant 1 m3/s 0.58 0.58 0.58 0.58 0.96 1.34 1.72 1.72 2.10 2.10 2.10 2.10 2.10 Variant 2 m3/s 0.58 0.58 0.58 0.58 0.58 0.58 0.96 1.34 1.72 2.10 2.10 2.10 2.10 Water Needs for all power plants Variant 1 m3/s 18.40 18.40 18.40 18.40 30.38 42.36 42.36 54.35 66.33 66.33 66.33 66.33 66.33 Variant 2 m3/s 18.40 18.40 18.40 18.40 18.40 18.40 30.38 42.36 42.36 66.33 66.33 66.33 66.33 Maximum Water Needs for all power plants
Variant m3/s Year Variant 1 2.10 2016 Variant 2 2.10 2017
Source: Lignite Power Technical Assistance Project. The Kosovo C investment program takes into account two variants (with the conventional technology1), which differ by the completion date of the various energy blocks. Both variants start in 2008, but the first plans to complete all units by 2016 and the second by 2017. Each energy block will require a water flow of 0.38 m3/s (net value, excluding losses). At the end of the construction (2016 or 2017), the Kosovo C power plant will need a net water flow of 1.52 m3/s. The Kosovo A plant will carry on working until 2020, and the water supplied by the Iber-Lepenc hydro system (via the Lab river) amounts to 0.20 m3/s, but only 5 months per year. The resulting annual average net flow is thus 0.08 m3/s. As for the Kosovo B plant, the net water consumption should be around 0.50 m3/s throughout the envisaged period.
1 The data supplied by the Lignite Power Technical Assistance Project team only regard one technology, which is the most water-consuming one.
Water Supply from the Iber-Lepenc hydro system for the proposed Kosovo C Power Plant 10
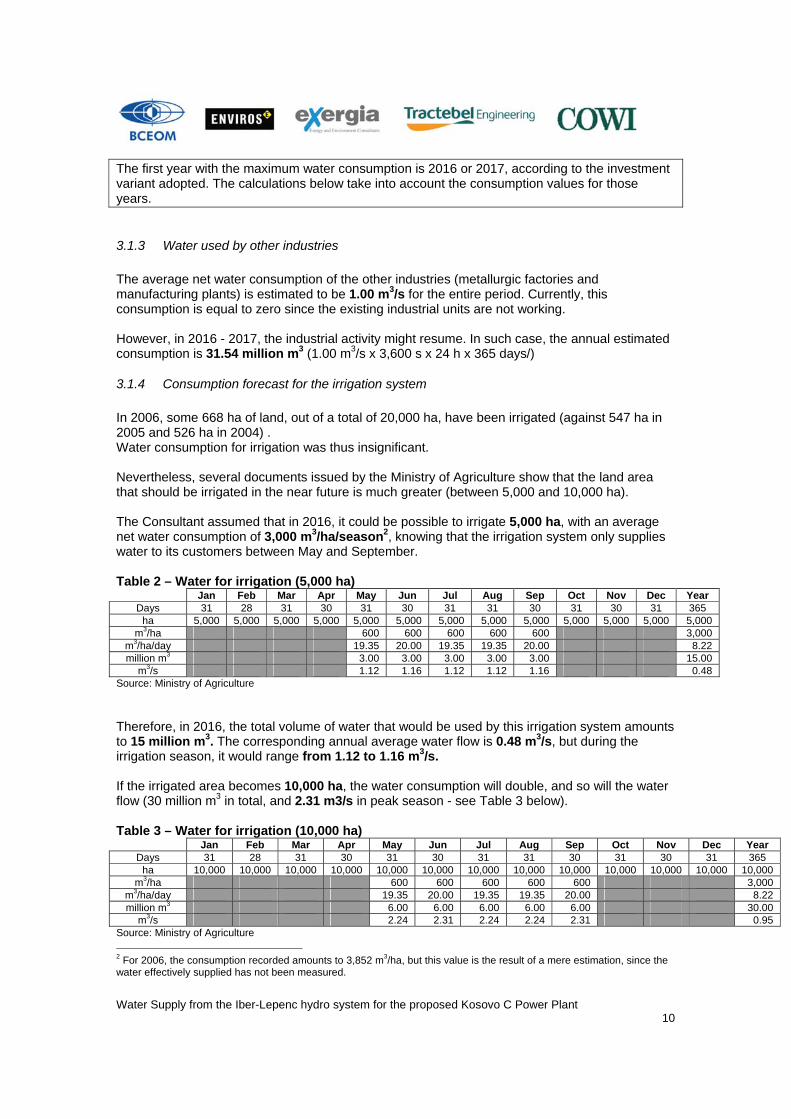
The first year with the maximum water consumption is 2016 or 2017, according to the investment variant adopted. The calculations below take into account the consumption values for those years.
3.1.3 Water used by other industries The average net water consumption of the other industries (metallurgic factories and manufacturing plants) is estimated to be 1.00 m3/s for the entire period. Currently, this consumption is equal to zero since the existing industrial units are not working. However, in 2016 - 2017, the industrial activity might resume. In such case, the annual estimated consumption is 31.54 million m3 (1.00 m3/s x 3,600 s x 24 h x 365 days/)
3.1.4 Consumption forecast for the irrigation system In 2006, some 668 ha of land, out of a total of 20,000 ha, have been irrigated (against 547 ha in 2005 and 526 ha in 2004) . Water consumption for irrigation was thus insignificant. Nevertheless, several documents issued by the Ministry of Agriculture show that the land area that should be irrigated in the near future is much greater (between 5,000 and 10,000 ha). The Consultant assumed that in 2016, it could be possible to irrigate 5,000 ha, with an average net water consumption of 3,000 m3/ha/season2, knowing that the irrigation system only supplies water to its customers between May and September. Table 2 – Water for irrigation (5,000 ha) Jan Feb Mar Apr May Jun Jul Aug Sep Oct Nov Dec Year
Days 31 28 31 30 31 30 31 31 30 31 30 31 365 ha 5,000 5,000 5,000 5,000 5,000 5,000 5,000 5,000 5,000 5,000 5,000 5,000 5,000
m3/ha 600 600 600 600 600 3,000 m3/ha/day 19.35 20.00 19.35 19.35 20.00 8.22 million m3 3.00 3.00 3.00 3.00 3.00 15.00
m3/s 1.12 1.16 1.12 1.12 1.16 0.48 Source: Ministry of Agriculture Therefore, in 2016, the total volume of water that would be used by this irrigation system amounts to 15 million m3. The corresponding annual average water flow is 0.48 m3/s, but during the irrigation season, it would range from 1.12 to 1.16 m3/s. If the irrigated area becomes 10,000 ha, the water consumption will double, and so will the water flow (30 million m3 in total, and 2.31 m3/s in peak season - see Table 3 below). Table 3 – Water for irrigation (10,000 ha) Jan Feb Mar Apr May Jun Jul Aug Sep Oct Nov Dec Year
Days 31 28 31 30 31 30 31 31 30 31 30 31 365 ha 10,000 10,000 10,000 10,000 10,000 10,000 10,000 10,000 10,000 10,000 10,000 10,000 10,000
m3/ha 600 600 600 600 600 3,000 m3/ha/day 19.35 20.00 19.35 19.35 20.00 8.22 million m3 6.00 6.00 6.00 6.00 6.00 30.00
m3/s 2.24 2.31 2.24 2.24 2.31 0.95 Source: Ministry of Agriculture 2 For 2006, the consumption recorded amounts to 3,852 m3/ha, but this value is the result of a mere estimation, since the water effectively supplied has not been measured.
Water Supply from the Iber-Lepenc hydro system for the proposed Kosovo C Power Plant 11
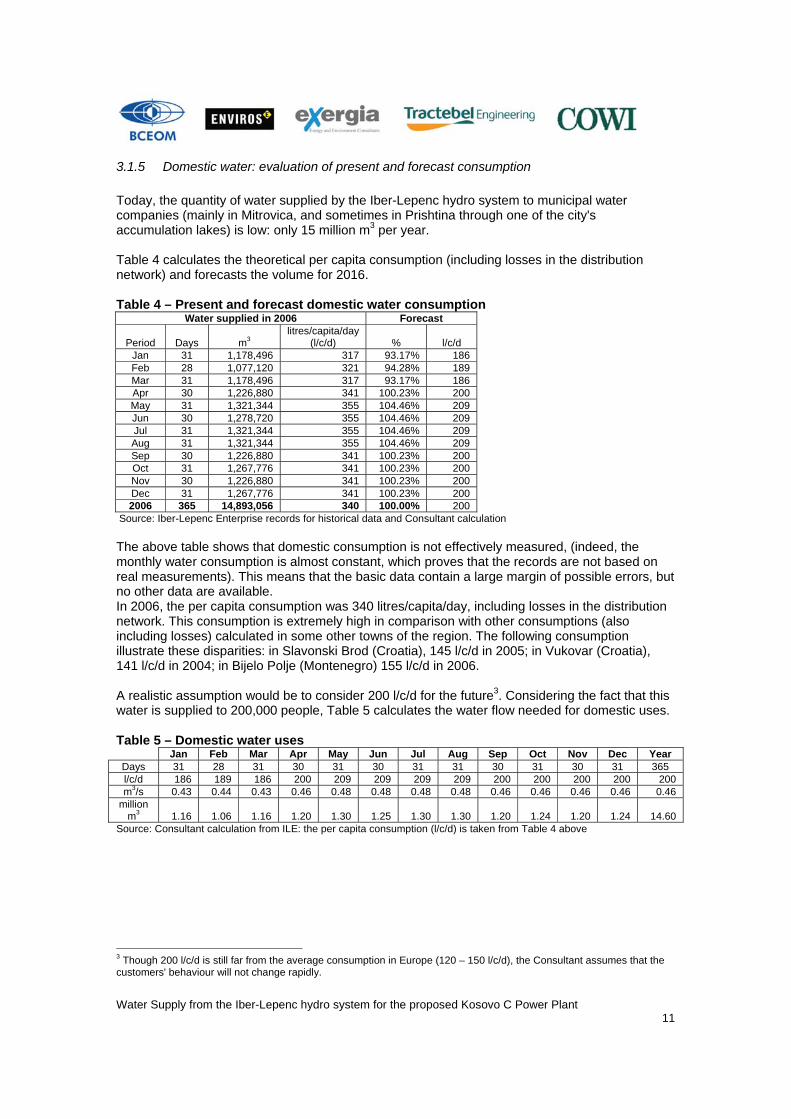
3.1.5 Domestic water: evaluation of present and forecast consumption Today, the quantity of water supplied by the Iber-Lepenc hydro system to municipal water companies (mainly in Mitrovica, and sometimes in Prishtina through one of the city's accumulation lakes) is low: only 15 million m3 per year. Table 4 calculates the theoretical per capita consumption (including losses in the distribution network) and forecasts the volume for 2016. Table 4 – Present and forecast domestic water consumption
Water supplied in 2006 Forecast
Period Days m3 litres/capita/day
(l/c/d) % l/c/d Jan 31 1,178,496 317 93.17% 186 Feb 28 1,077,120 321 94.28% 189 Mar 31 1,178,496 317 93.17% 186 Apr 30 1,226,880 341 100.23% 200 May 31 1,321,344 355 104.46% 209 Jun 30 1,278,720 355 104.46% 209 Jul 31 1,321,344 355 104.46% 209 Aug 31 1,321,344 355 104.46% 209 Sep 30 1,226,880 341 100.23% 200 Oct 31 1,267,776 341 100.23% 200 Nov 30 1,226,880 341 100.23% 200 Dec 31 1,267,776 341 100.23% 200 2006 365 14,893,056 340 100.00% 200
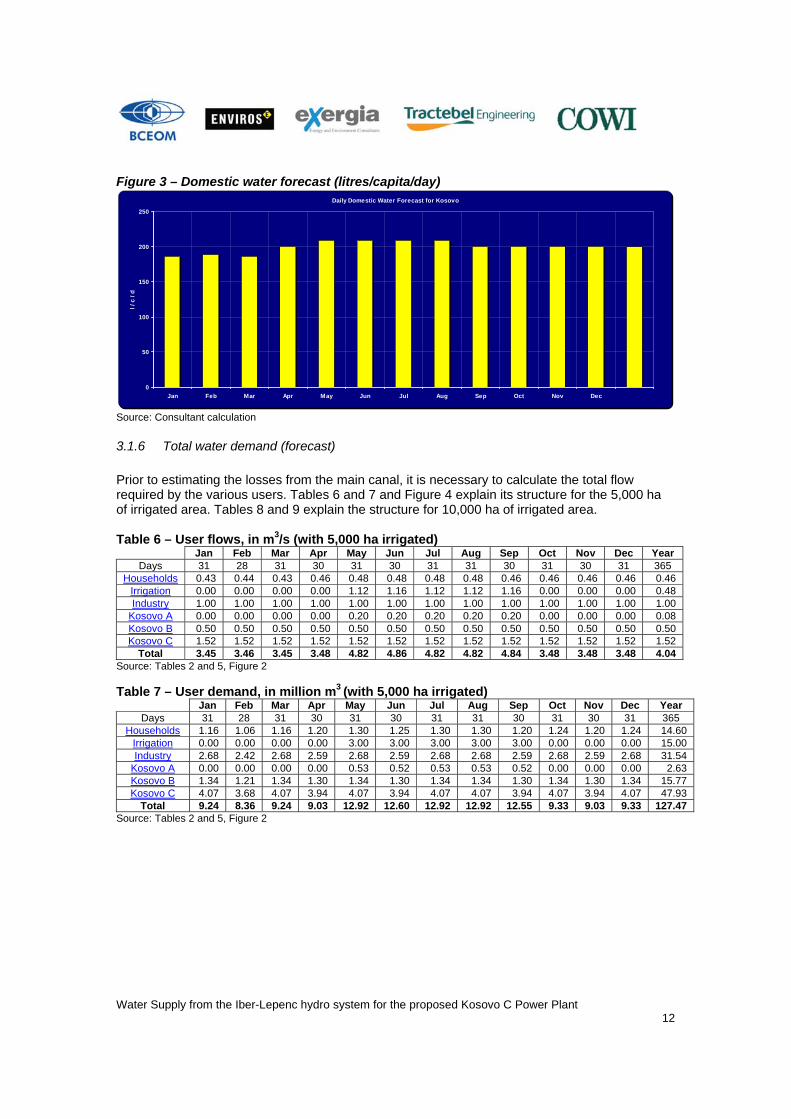
Source: Iber-Lepenc Enterprise records for historical data and Consultant calculation The above table shows that domestic consumption is not effectively measured, (indeed, the monthly water consumption is almost constant, which proves that the records are not based on real measurements). This means that the basic data contain a large margin of possible errors, but no other data are available. In 2006, the per capita consumption was 340 litres/capita/day, including losses in the distribution network. This consumption is extremely high in comparison with other consumptions (also including losses) calculated in some other towns of the region. The following consumption illustrate these disparities: in Slavonski Brod (Croatia), 145 l/c/d in 2005; in Vukovar (Croatia), 141 l/c/d in 2004; in Bijelo Polje (Montenegro) 155 l/c/d in 2006. A realistic assumption would be to consider 200 l/c/d for the future3. Considering the fact that this water is supplied to 200,000 people, Table 5 calculates the water flow needed for domestic uses. Table 5 – Domestic water uses Jan Feb Mar Apr May Jun Jul Aug Sep Oct Nov Dec Year
Days 31 28 31 30 31 30 31 31 30 31 30 31 365 l/c/d 186 189 186 200 209 209 209 209 200 200 200 200 200 m3/s 0.43 0.44 0.43 0.46 0.48 0.48 0.48 0.48 0.46 0.46 0.46 0.46 0.46
million m3 1.16 1.06 1.16 1.20 1.30 1.25 1.30 1.30 1.20 1.24 1.20 1.24 14.60
Source: Consultant calculation from ILE: the per capita consumption (l/c/d) is taken from Table 4 above
3 Though 200 l/c/d is still far from the average consumption in Europe (120 – 150 l/c/d), the Consultant assumes that the customers' behaviour will not change rapidly.
Water Supply from the Iber-Lepenc hydro system for the proposed Kosovo C Power Plant 12
Figure 3 – Domestic water forecast (litres/capita/day)
Daily Domestic Water Forecast for Kosovo
0
50
100
150
200
250
Jan Feb Mar Apr May Jun Jul Aug Sep Oct Nov Dec
l / c
/ d
Source: Consultant calculation
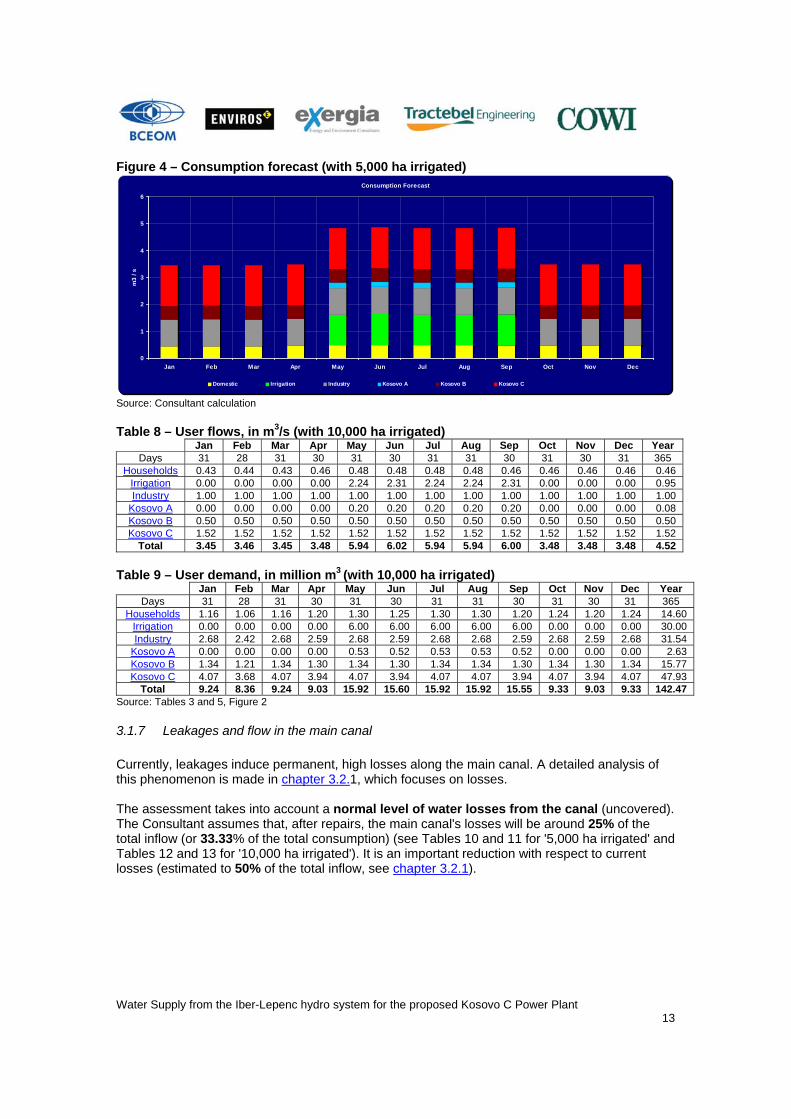
3.1.6 Total water demand (forecast) Prior to estimating the losses from the main canal, it is necessary to calculate the total flow required by the various users. Tables 6 and 7 and Figure 4 explain its structure for the 5,000 ha of irrigated area. Tables 8 and 9 explain the structure for 10,000 ha of irrigated area. Table 6 – User flows, in m3/s (with 5,000 ha irrigated)
Jan Feb Mar Apr May Jun Jul Aug Sep Oct Nov Dec Year Days 31 28 31 30 31 30 31 31 30 31 30 31 365
Households 0.43 0.44 0.43 0.46 0.48 0.48 0.48 0.48 0.46 0.46 0.46 0.46 0.46 Irrigation 0.00 0.00 0.00 0.00 1.12 1.16 1.12 1.12 1.16 0.00 0.00 0.00 0.48 Industry 1.00 1.00 1.00 1.00 1.00 1.00 1.00 1.00 1.00 1.00 1.00 1.00 1.00
Kosovo A 0.00 0.00 0.00 0.00 0.20 0.20 0.20 0.20 0.20 0.00 0.00 0.00 0.08 Kosovo B 0.50 0.50 0.50 0.50 0.50 0.50 0.50 0.50 0.50 0.50 0.50 0.50 0.50 Kosovo C 1.52 1.52 1.52 1.52 1.52 1.52 1.52 1.52 1.52 1.52 1.52 1.52 1.52
Total 3.45 3.46 3.45 3.48 4.82 4.86 4.82 4.82 4.84 3.48 3.48 3.48 4.04 Source: Tables 2 and 5, Figure 2 Table 7 – User demand, in million m3 (with 5,000 ha irrigated)
Jan Feb Mar Apr May Jun Jul Aug Sep Oct Nov Dec Year Days 31 28 31 30 31 30 31 31 30 31 30 31 365
Households 1.16 1.06 1.16 1.20 1.30 1.25 1.30 1.30 1.20 1.24 1.20 1.24 14.60 Irrigation 0.00 0.00 0.00 0.00 3.00 3.00 3.00 3.00 3.00 0.00 0.00 0.00 15.00 Industry 2.68 2.42 2.68 2.59 2.68 2.59 2.68 2.68 2.59 2.68 2.59 2.68 31.54
Kosovo A 0.00 0.00 0.00 0.00 0.53 0.52 0.53 0.53 0.52 0.00 0.00 0.00 2.63 Kosovo B 1.34 1.21 1.34 1.30 1.34 1.30 1.34 1.34 1.30 1.34 1.30 1.34 15.77 Kosovo C 4.07 3.68 4.07 3.94 4.07 3.94 4.07 4.07 3.94 4.07 3.94 4.07 47.93
Total 9.24 8.36 9.24 9.03 12.92 12.60 12.92 12.92 12.55 9.33 9.03 9.33 127.47 Source: Tables 2 and 5, Figure 2
Water Supply from the Iber-Lepenc hydro system for the proposed Kosovo C Power Plant 13
Figure 4 – Consumption forecast (with 5,000 ha irrigated) Consumption Forecast
0
1
2
3
4
5
6
Jan Feb Mar Apr May Jun Jul Aug Sep Oct Nov Dec
m3
/ s
Domestic Irrigation Industry Kosovo A Kosovo B Kosovo C
Source: Consultant calculation Table 8 – User flows, in m3/s (with 10,000 ha irrigated)
Jan Feb Mar Apr May Jun Jul Aug Sep Oct Nov Dec Year Days 31 28 31 30 31 30 31 31 30 31 30 31 365
Households 0.43 0.44 0.43 0.46 0.48 0.48 0.48 0.48 0.46 0.46 0.46 0.46 0.46 Irrigation 0.00 0.00 0.00 0.00 2.24 2.31 2.24 2.24 2.31 0.00 0.00 0.00 0.95 Industry 1.00 1.00 1.00 1.00 1.00 1.00 1.00 1.00 1.00 1.00 1.00 1.00 1.00
Kosovo A 0.00 0.00 0.00 0.00 0.20 0.20 0.20 0.20 0.20 0.00 0.00 0.00 0.08 Kosovo B 0.50 0.50 0.50 0.50 0.50 0.50 0.50 0.50 0.50 0.50 0.50 0.50 0.50 Kosovo C 1.52 1.52 1.52 1.52 1.52 1.52 1.52 1.52 1.52 1.52 1.52 1.52 1.52
Total 3.45 3.46 3.45 3.48 5.94 6.02 5.94 5.94 6.00 3.48 3.48 3.48 4.52 Table 9 – User demand, in million m3 (with 10,000 ha irrigated)
Jan Feb Mar Apr May Jun Jul Aug Sep Oct Nov Dec Year Days 31 28 31 30 31 30 31 31 30 31 30 31 365
Households 1.16 1.06 1.16 1.20 1.30 1.25 1.30 1.30 1.20 1.24 1.20 1.24 14.60 Irrigation 0.00 0.00 0.00 0.00 6.00 6.00 6.00 6.00 6.00 0.00 0.00 0.00 30.00 Industry 2.68 2.42 2.68 2.59 2.68 2.59 2.68 2.68 2.59 2.68 2.59 2.68 31.54
Kosovo A 0.00 0.00 0.00 0.00 0.53 0.52 0.53 0.53 0.52 0.00 0.00 0.00 2.63 Kosovo B 1.34 1.21 1.34 1.30 1.34 1.30 1.34 1.34 1.30 1.34 1.30 1.34 15.77 Kosovo C 4.07 3.68 4.07 3.94 4.07 3.94 4.07 4.07 3.94 4.07 3.94 4.07 47.93
Total 9.24 8.36 9.24 9.03 15.92 15.60 15.92 15.92 15.55 9.33 9.03 9.33 142.47 Source: Tables 3 and 5, Figure 2
3.1.7 Leakages and flow in the main canal Currently, leakages induce permanent, high losses along the main canal. A detailed analysis of this phenomenon is made in chapter 3.2.1, which focuses on losses. The assessment takes into account a normal level of water losses from the canal (uncovered). The Consultant assumes that, after repairs, the main canal's losses will be around 25% of the total inflow (or 33.33% of the total consumption) (see Tables 10 and 11 for '5,000 ha irrigated' and Tables 12 and 13 for '10,000 ha irrigated'). It is an important reduction with respect to current losses (estimated to 50% of the total inflow, see chapter 3.2.1).
Water Supply from the Iber-Lepenc hydro system for the proposed Kosovo C Power Plant 14
Table 10 – Losses from main canal - in m3/s (with 5,000 ha irrigated)
Jan Feb Mar Apr May Jun Jul Aug Sep Oct Nov Dec Year Days 31 28 31 30 31 30 31 31 30 31 30 31 365
Losses 1.15 1.15 1.15 1.16 1.61 1.62 1.61 1.61 1.61 1.16 1.16 1.16 1.35 Table 11 – Losses from main canal, in million m3 (with 5,000 ha irrigated)
Jan Feb Mar Apr May Jun Jul Aug Sep Oct Nov Dec Year Days 31 28 31 30 31 30 31 31 30 31 30 31 365
Losses 3.08 2.79 3.08 3.01 4.31 4.20 4.31 4.31 4.18 3.11 3.01 3.11 42.49 Source: Table 6 and calculation Table 12 – Losses from main canal - in m3/s (with 10,000 ha irrigated)
Jan Feb Mar Apr May Jun Jul Aug Sep Oct Nov Dec Year Days 31 28 31 30 31 30 31 31 30 31 30 31 365
Losses 1.15 1.15 1.15 1.16 1.98 2.01 1.98 1.98 2.00 1.16 1.16 1.16 1.51 Table 13 – Losses from main canal, in million m3 (with 10,000 ha irrigated)
Jan Feb Mar Apr May Jun Jul Aug Sep Oct Nov Dec Year Days 31 28 31 30 31 30 31 31 30 31 30 31 365
Losses 3.08 2.79 3.08 3.01 5.31 5.20 5.31 5.31 5.18 3.11 3.01 3.11 47.49 Source: Table8 and calculation It may be noted that annual losses are almost equal to the consumption of Kosovo C.
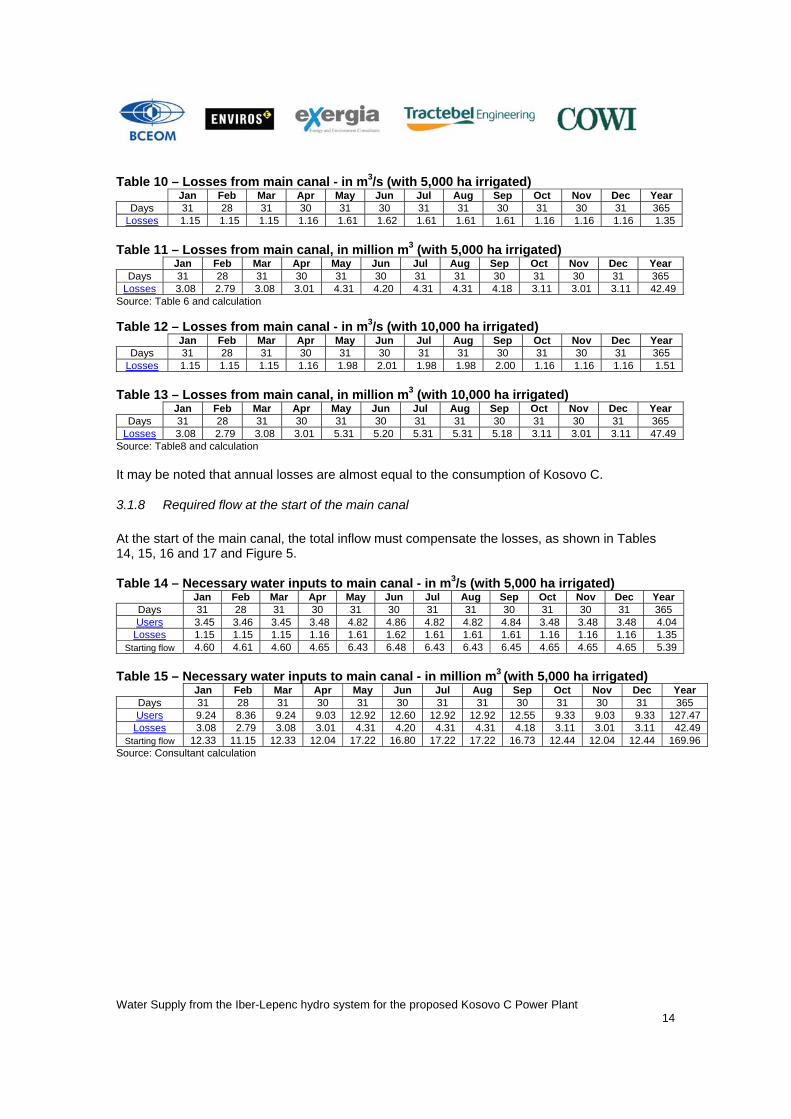
3.1.8 Required flow at the start of the main canal At the start of the main canal, the total inflow must compensate the losses, as shown in Tables 14, 15, 16 and 17 and Figure 5. Table 14 – Necessary water inputs to main canal - in m3/s (with 5,000 ha irrigated)
Jan Feb Mar Apr May Jun Jul Aug Sep Oct Nov Dec Year Days 31 28 31 30 31 30 31 31 30 31 30 31 365 Users 3.45 3.46 3.45 3.48 4.82 4.86 4.82 4.82 4.84 3.48 3.48 3.48 4.04
Losses 1.15 1.15 1.15 1.16 1.61 1.62 1.61 1.61 1.61 1.16 1.16 1.16 1.35 Starting flow 4.60 4.61 4.60 4.65 6.43 6.48 6.43 6.43 6.45 4.65 4.65 4.65 5.39
Table 15 – Necessary water inputs to main canal - in million m3 (with 5,000 ha irrigated)
Jan Feb Mar Apr May Jun Jul Aug Sep Oct Nov Dec Year Days 31 28 31 30 31 30 31 31 30 31 30 31 365 Users 9.24 8.36 9.24 9.03 12.92 12.60 12.92 12.92 12.55 9.33 9.03 9.33 127.47
Losses 3.08 2.79 3.08 3.01 4.31 4.20 4.31 4.31 4.18 3.11 3.01 3.11 42.49 Starting flow 12.33 11.15 12.33 12.04 17.22 16.80 17.22 17.22 16.73 12.44 12.04 12.44 169.96
Source: Consultant calculation
Water Supply from the Iber-Lepenc hydro system for the proposed Kosovo C Power Plant 15
Figure 5 – Necessary inflow at the start of the main canal, in m3/s
Flow at the Main Canal Start Gate
0
1
2
3
4
5
6
7
Jan Feb Mar Apr May Jun Jul Aug Sep Oct Nov Dec
m3
/ s
Total Consumers Losses
Source: Consultant calculation Table 16 – Necessary water inputs to main canal - in m3/s (with 10,000 ha irrigated)
Jan Feb Mar Apr May Jun Jul Aug Sep Oct Nov Dec Year Days 31 28 31 30 31 30 31 31 30 31 30 31 365 Users 3.45 3.46 3.45 3.48 5.94 6.02 5.94 5.94 6.00 3.48 3.48 3.48 4.52
Losses 1.15 1.15 1.15 1.16 1.98 2.01 1.98 1.98 2.00 1.16 1.16 1.16 1.51 Starting flow 4.60 4.61 4.60 4.65 7.92 8.02 7.92 7.92 8.00 4.65 4.65 4.65 6.02
Table 17 – Necessary water inputs to main canal - in million m3 (with 10,000 ha irrigated)
Jan Feb Mar Apr May Jun Jul Aug Sep Oct Nov Dec Year Days 31 28 31 30 31 30 31 31 30 31 30 31 365 Users 9.24 8.36 9.24 9.03 15.92 15.60 15.92 15.92 15.55 9.33 9.03 9.33 142.47
Losses 3.08 2.79 3.08 3.01 5.31 5.20 5.31 5.31 5.18 3.11 3.01 3.11 47.49 Starting flow 12.33 11.15 12.33 12.04 21.22 20.80 21.22 21.22 20.73 12.44 12.04 12.44 189.96
Source: Consultant calculation The main canal's design capacity is 22.2 m³/s, so in order to cover the forecast user needs and losses (for 5,000 ha irrigated), it would be necessary to use 21% to 29% of its capacity as calculated below: Table 18 – Use of main canal capacity (with 5,000 ha irrigated)
m3/s Jan Feb Mar Apr May Jun Jul Aug Sep Oct Nov Dec Year Days 31 28 31 30 31 30 31 31 30 31 30 31 365
Start Flow 4.60 4.61 4.60 4.65 6.43 6.48 6.43 6.43 6.45 4.65 4.65 4.65 5.39 Nominal flow 22.20 22.20 22.20 22.20 22.20 22.20 22.20 22.20 22.20 22.20 22.20 22.20 22.20
% 21% 21% 21% 21% 29% 29% 29% 29% 29% 21% 21% 21% 24% Source: Consultant calculation In the case of 5,000 hectares irrigated, the average annual use of the canal's capacity is 24%, but during the peak month (July), it will reach 29%. This situation is due to the fact that the current area of irrigated land is only 668 ha, instead of the 20,000 ha foreseen.
Water Supply from the Iber-Lepenc hydro system for the proposed Kosovo C Power Plant 16
Table 19 – Use of main canal capacity (with 10,000 ha irrigated)
m3/s Jan Feb Mar Apr May Jun Jul Aug Sep Oct Nov Dec Year Days 31 28 31 30 31 30 31 31 30 31 30 31 365
Start Flow 4.60 4.61 4.60 4.65 7.92 8.02 7.92 7.92 8.00 4.65 4.65 4.65 6.02 Nominal flow 22.20 22.20 22.20 22.20 22.20 22.20 22.20 22.20 22.20 22.20 22.20 22.20 22.20
% 21% 21% 21% 21% 36% 36% 36% 36% 36% 21% 21% 21% 27% Source: Consultant calculation The reserve in the main canal's capacity can be useful if the overall consumption increases, for instance if a re-pumping solution is used for the hydroelectric power station or during the repairs.
3.1.9 Minimum biological flow in Iber river Downstream of Gazivoda lake, the Iber river must have a minimum biological flow to preserve the environment. The minimum flow is 0.50 m3/s and is guaranteed by the outflow from the secondary lake. Table 20 – Minimum biological flow in Iber river (after the dam)
Jan Feb Mar Apr May Jun Jul Aug Sep Oct Nov Dec Year Days 31 28 31 30 31 30 31 31 30 31 30 31 365
million m3 1.34 1.21 1.34 1.30 1.34 1.30 1.34 1.34 1.30 1.34 1.30 1.34 15.77
m3/s 0.50 0.50 0.50 0.50 0.50 0.50 0.50 0.50 0.50 0.50 0.50 0.50 0.50 Source: ILE
3.1.10 Water flow in the hydroelectric power plant The power plant's inflow and outflow of main lake water are equal. The Consultant assumes that internal water losses during energy production will be negligible. The optimisation of the water used and the optimised balance between costs and revenue in the hydroelectric power plant can only be taken into account if Iber-Lepenc Enterprise is able to decide the level and the periods of electricity production according to commercial criteria. In 2004 – 2006, the production (and sales) of electricity totalled 109 GWh (see Table 22). Table 21 – Water consumption and flows in 2004 - 2006
Average working hours per day 8.10 h Average water consumption 12.55 m3/s Average daily water consumption 365,958 m3/day Average daily water flow 4.24 m3/s
Annual water consumption 133.575 million
m3 Source: ILE
Water Supply from the Iber-Lepenc hydro system for the proposed Kosovo C Power Plant 17
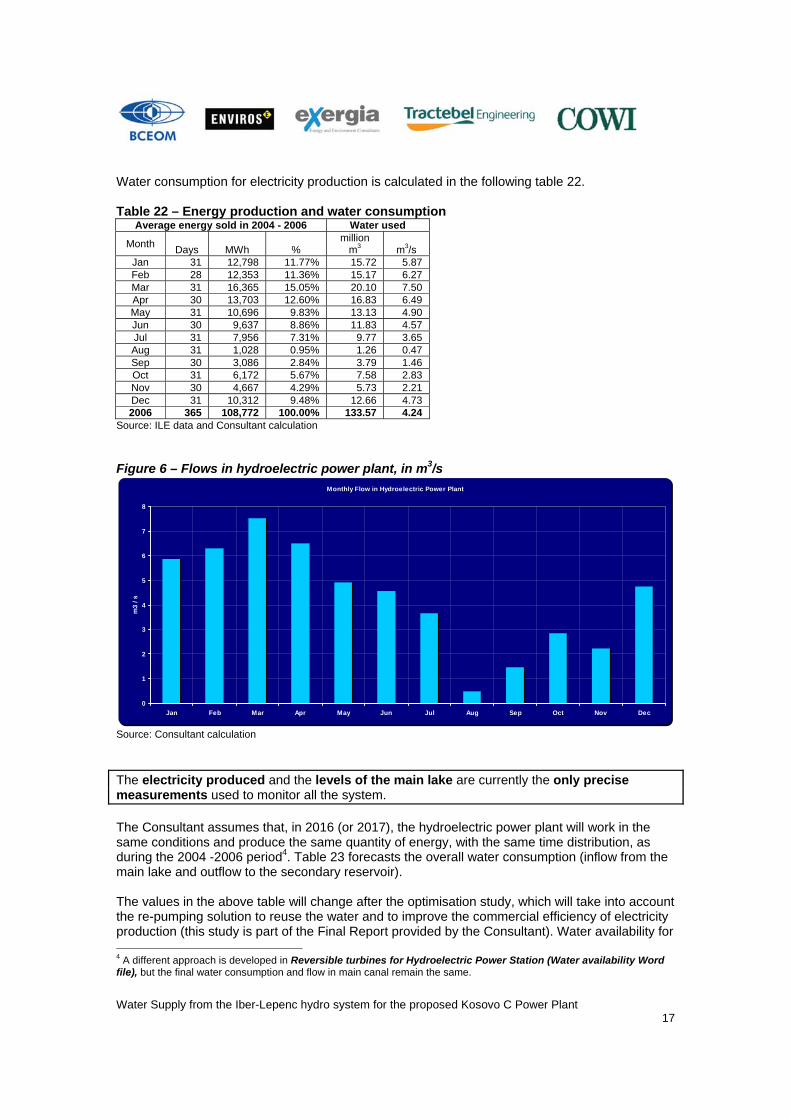
Water consumption for electricity production is calculated in the following table 22. Table 22 – Energy production and water consumption
Average energy sold in 2004 - 2006 Water used
Month Days MWh % million
m3 m3/s Jan 31 12,798 11.77% 15.72 5.87 Feb 28 12,353 11.36% 15.17 6.27 Mar 31 16,365 15.05% 20.10 7.50 Apr 30 13,703 12.60% 16.83 6.49 May 31 10,696 9.83% 13.13 4.90 Jun 30 9,637 8.86% 11.83 4.57 Jul 31 7,956 7.31% 9.77 3.65 Aug 31 1,028 0.95% 1.26 0.47 Sep 30 3,086 2.84% 3.79 1.46 Oct 31 6,172 5.67% 7.58 2.83 Nov 30 4,667 4.29% 5.73 2.21 Dec 31 10,312 9.48% 12.66 4.73 2006 365 108,772 100.00% 133.57 4.24
Source: ILE data and Consultant calculation Figure 6 – Flows in hydroelectric power plant, in m3/s
Monthly Flow in Hydroelectric Power Plant
0
1
2
3
4
5
6
7
8
Jan Feb Mar Apr May Jun Jul Aug Sep Oct Nov Dec
m3
/ s
Source: Consultant calculation The electricity produced and the levels of the main lake are currently the only precise measurements used to monitor all the system. The Consultant assumes that, in 2016 (or 2017), the hydroelectric power plant will work in the same conditions and produce the same quantity of energy, with the same time distribution, as during the 2004 -2006 period4. Table 23 forecasts the overall water consumption (inflow from the main lake and outflow to the secondary reservoir). The values in the above table will change after the optimisation study, which will take into account the re-pumping solution to reuse the water and to improve the commercial efficiency of electricity production (this study is part of the Final Report provided by the Consultant). Water availability for 4 A different approach is developed in Reversible turbines for Hydroelectric Power Station (Water availability Word file), but the final water consumption and flow in main canal remain the same.

Water Supply from the Iber-Lepenc hydro system for the proposed Kosovo C Power Plant 18
Kosovo C is not affected by these changes because the inflow to the main canal does not depend on the flows through the turbines (indeed, the secondary reservoir is able to regulate the flows).
3.1.11 Water balance in the secondary reservoir The outflow from the secondary reservoir must cover at least the compulsory minimum inflow to the main canal (useful water consumption plus losses from the canal) and the minimum biological flow for the Iber River. The main inflow to the secondary reservoir is the hydroelectric power plant's outflow. If necessary, an additional flow by-passing the turbines can be taken from the main lake. If the main lake's level exceeds the maximum permissible level, the excess water will flow through the spillways. This additional flow will then use the secondary reservoir spillways to reach the Iber river and add up to the minimum biological flow. This flow represents the available water (natural inflow to the main lake) that has not used been by the system (for water consumption or for electricity production). The re-pumping solution makes use of this reserve. Table 23 – Minimum inflow to secondary reservoir - in m3/s (with 5,000 ha irrigated)
Jan Feb Mar Apr May Jun Jul Aug Sep Oct Nov Dec Year Days 31 28 31 30 31 30 31 31 30 31 30 31 365
Flow in MC 4.60 4.61 4.60 4.65 6.43 6.48 6.43 6.43 6.45 4.65 4.65 4.65 5.39 M.B.F.I.R 0.50 0.50 0.50 0.50 0.50 0.50 0.50 0.50 0.50 0.50 0.50 0.50 0.50 Min. inflow 5.10 5.11 5.10 5.15 6.93 6.98 6.93 6.93 6.95 5.15 5.15 5.15 5.89
Source: Consultant calculation Table 24 – Minimum inflow to secondary reservoir - in million m3 (with 5,000 ha irrigated)
Jan Feb Mar Apr May Jun Jul Aug Sep Oct Nov Dec Year Days 31 28 31 30 31 30 31 31 30 31 30 31 365
Flow in MC 12.33 11.15 12.33 12.04 17.22 16.80 17.22 17.22 16.73 12.44 12.04 12.44 169.96 M.B.F.I.R 1.34 1.21 1.34 1.30 1.34 1.30 1.34 1.34 1.30 1.34 1.30 1.34 15.77 Min. inflow 13.66 12.36 13.66 13.34 18.56 18.09 18.56 18.56 18.02 13.78 13.34 13.78 185.72
Flow in MC: flow in main canal (consumption and losses) M.B.F.I.R: minimum biological flow in Iber River Source: Consultant calculation Table 25 – Minimum inflow to secondary reservoir - in m3/s (with 10,000 ha irrigated)
Jan Feb Mar Apr May Jun Jul Aug Sep Oct Nov Dec Year Days 31 28 31 30 31 30 31 31 30 31 30 31 365
Flow in MC 4.60 4.61 4.60 4.65 7.92 8.02 7.92 7.92 8.00 4.65 4.65 4.65 6.02 M.B.F.I.R 0.50 0.50 0.50 0.50 0.50 0.50 0.50 0.50 0.50 0.50 0.50 0.50 0.50 Min. inflow 5.10 5.11 5.10 5.15 8.42 8.52 8.42 8.42 8.50 5.15 5.15 5.15 6.52
Source: Consultant calculation Table 26 – Minimum inflow to secondary reservoir - in million m3 (with 10,000 ha irrigated)
Jan Feb Mar Apr May Jun Jul Aug Sep Oct Nov Dec Year Days 31 28 31 30 31 30 31 31 30 31 30 31 365
Flow in MC 12.33 11.15 12.33 12.04 21.22 20.80 21.22 21.22 20.73 12.44 12.04 12.44 189.96 M.B.F.I.R 1.34 1.21 1.34 1.30 1.34 1.30 1.34 1.34 1.30 1.34 1.30 1.34 15.77 Min. inflow 13.66 12.36 13.66 13.34 22.56 22.09 22.56 22.56 22.02 13.78 13.34 13.78 205.72
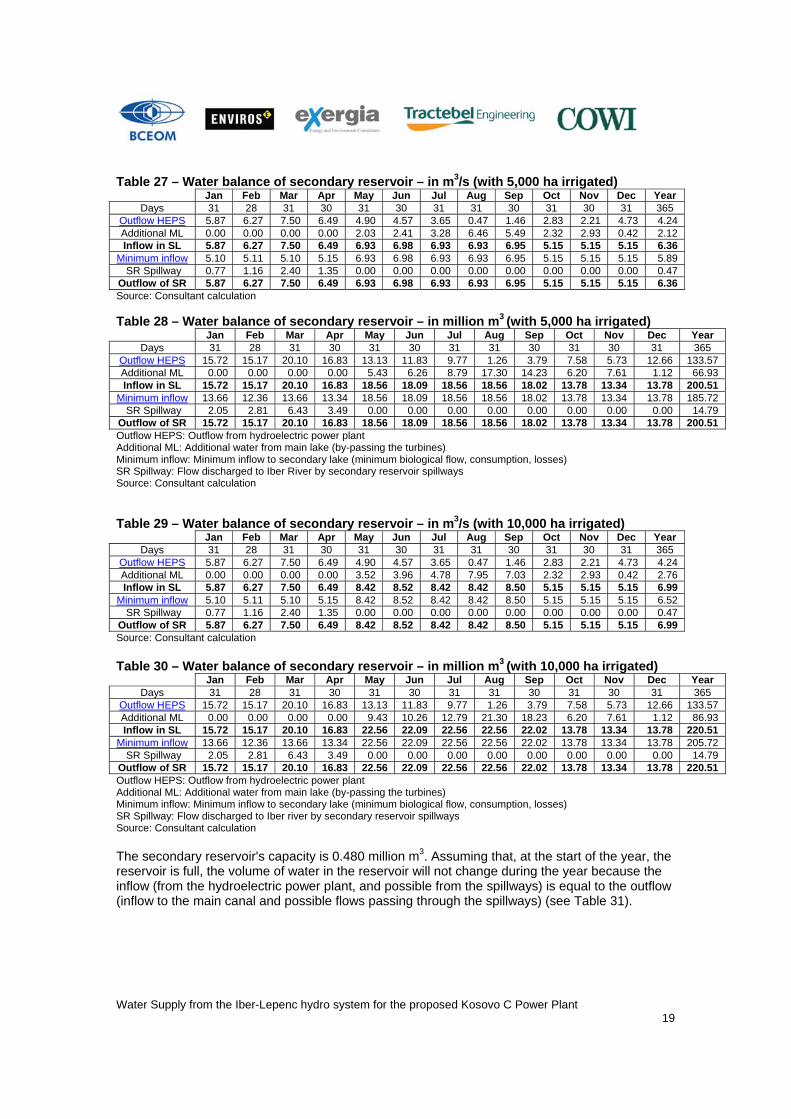
Flow in MC: flow in main canal (consumption and losses) M.B.F.I.R: minimum biological flow in Iber River Source: Consultant calculation Tables 27, 28, 29 and 30 detail the water balance of secondary reservoir, adding the possible additional water from Main lake (below the hydroelectric power plant outflow) and possible additional discharges to Iber river.
Water Supply from the Iber-Lepenc hydro system for the proposed Kosovo C Power Plant 19
Table 27 – Water balance of secondary reservoir – in m3/s (with 5,000 ha irrigated)
Jan Feb Mar Apr May Jun Jul Aug Sep Oct Nov Dec Year Days 31 28 31 30 31 30 31 31 30 31 30 31 365
Outflow HEPS 5.87 6.27 7.50 6.49 4.90 4.57 3.65 0.47 1.46 2.83 2.21 4.73 4.24 Additional ML 0.00 0.00 0.00 0.00 2.03 2.41 3.28 6.46 5.49 2.32 2.93 0.42 2.12 Inflow in SL 5.87 6.27 7.50 6.49 6.93 6.98 6.93 6.93 6.95 5.15 5.15 5.15 6.36
Minimum inflow 5.10 5.11 5.10 5.15 6.93 6.98 6.93 6.93 6.95 5.15 5.15 5.15 5.89 SR Spillway 0.77 1.16 2.40 1.35 0.00 0.00 0.00 0.00 0.00 0.00 0.00 0.00 0.47
Outflow of SR 5.87 6.27 7.50 6.49 6.93 6.98 6.93 6.93 6.95 5.15 5.15 5.15 6.36 Source: Consultant calculation Table 28 – Water balance of secondary reservoir – in million m3 (with 5,000 ha irrigated)
Jan Feb Mar Apr May Jun Jul Aug Sep Oct Nov Dec Year Days 31 28 31 30 31 30 31 31 30 31 30 31 365
Outflow HEPS 15.72 15.17 20.10 16.83 13.13 11.83 9.77 1.26 3.79 7.58 5.73 12.66 133.57 Additional ML 0.00 0.00 0.00 0.00 5.43 6.26 8.79 17.30 14.23 6.20 7.61 1.12 66.93 Inflow in SL 15.72 15.17 20.10 16.83 18.56 18.09 18.56 18.56 18.02 13.78 13.34 13.78 200.51
Minimum inflow 13.66 12.36 13.66 13.34 18.56 18.09 18.56 18.56 18.02 13.78 13.34 13.78 185.72 SR Spillway 2.05 2.81 6.43 3.49 0.00 0.00 0.00 0.00 0.00 0.00 0.00 0.00 14.79
Outflow of SR 15.72 15.17 20.10 16.83 18.56 18.09 18.56 18.56 18.02 13.78 13.34 13.78 200.51 Outflow HEPS: Outflow from hydroelectric power plant Additional ML: Additional water from main lake (by-passing the turbines) Minimum inflow: Minimum inflow to secondary lake (minimum biological flow, consumption, losses) SR Spillway: Flow discharged to Iber River by secondary reservoir spillways Source: Consultant calculation Table 29 – Water balance of secondary reservoir – in m3/s (with 10,000 ha irrigated)
Jan Feb Mar Apr May Jun Jul Aug Sep Oct Nov Dec Year Days 31 28 31 30 31 30 31 31 30 31 30 31 365
Outflow HEPS 5.87 6.27 7.50 6.49 4.90 4.57 3.65 0.47 1.46 2.83 2.21 4.73 4.24 Additional ML 0.00 0.00 0.00 0.00 3.52 3.96 4.78 7.95 7.03 2.32 2.93 0.42 2.76 Inflow in SL 5.87 6.27 7.50 6.49 8.42 8.52 8.42 8.42 8.50 5.15 5.15 5.15 6.99
Minimum inflow 5.10 5.11 5.10 5.15 8.42 8.52 8.42 8.42 8.50 5.15 5.15 5.15 6.52 SR Spillway 0.77 1.16 2.40 1.35 0.00 0.00 0.00 0.00 0.00 0.00 0.00 0.00 0.47
Outflow of SR 5.87 6.27 7.50 6.49 8.42 8.52 8.42 8.42 8.50 5.15 5.15 5.15 6.99 Source: Consultant calculation Table 30 – Water balance of secondary reservoir – in million m3 (with 10,000 ha irrigated)
Jan Feb Mar Apr May Jun Jul Aug Sep Oct Nov Dec Year Days 31 28 31 30 31 30 31 31 30 31 30 31 365
Outflow HEPS 15.72 15.17 20.10 16.83 13.13 11.83 9.77 1.26 3.79 7.58 5.73 12.66 133.57 Additional ML 0.00 0.00 0.00 0.00 9.43 10.26 12.79 21.30 18.23 6.20 7.61 1.12 86.93 Inflow in SL 15.72 15.17 20.10 16.83 22.56 22.09 22.56 22.56 22.02 13.78 13.34 13.78 220.51
Minimum inflow 13.66 12.36 13.66 13.34 22.56 22.09 22.56 22.56 22.02 13.78 13.34 13.78 205.72 SR Spillway 2.05 2.81 6.43 3.49 0.00 0.00 0.00 0.00 0.00 0.00 0.00 0.00 14.79
Outflow of SR 15.72 15.17 20.10 16.83 22.56 22.09 22.56 22.56 22.02 13.78 13.34 13.78 220.51 Outflow HEPS: Outflow from hydroelectric power plant Additional ML: Additional water from main lake (by-passing the turbines) Minimum inflow: Minimum inflow to secondary lake (minimum biological flow, consumption, losses) SR Spillway: Flow discharged to Iber river by secondary reservoir spillways Source: Consultant calculation The secondary reservoir's capacity is 0.480 million m3. Assuming that, at the start of the year, the reservoir is full, the volume of water in the reservoir will not change during the year because the inflow (from the hydroelectric power plant, and possible from the spillways) is equal to the outflow (inflow to the main canal and possible flows passing through the spillways) (see Table 31).
Water Supply from the Iber-Lepenc hydro system for the proposed Kosovo C Power Plant 20
Table 31 – Secondary reservoir water content – in million m3
Jan Feb Mar Apr May Jun Jul Aug Sep Oct Nov Dec Days 31 28 31 30 31 30 31 31 30 31 30 31 Start 0.48 0.48 0.48 0.48 0.48 0.48 0.48 0.48 0.48 0.48 0.48 0.48 End 0.48 0.48 0.48 0.48 0.48 0.48 0.48 0.48 0.48 0.48 0.48 0.48
Source: Consultant calculation The secondary reservoir is only a buffer basin (passive) and faces no issues, thanks to the spillway system and to the additional water received from the main lake.
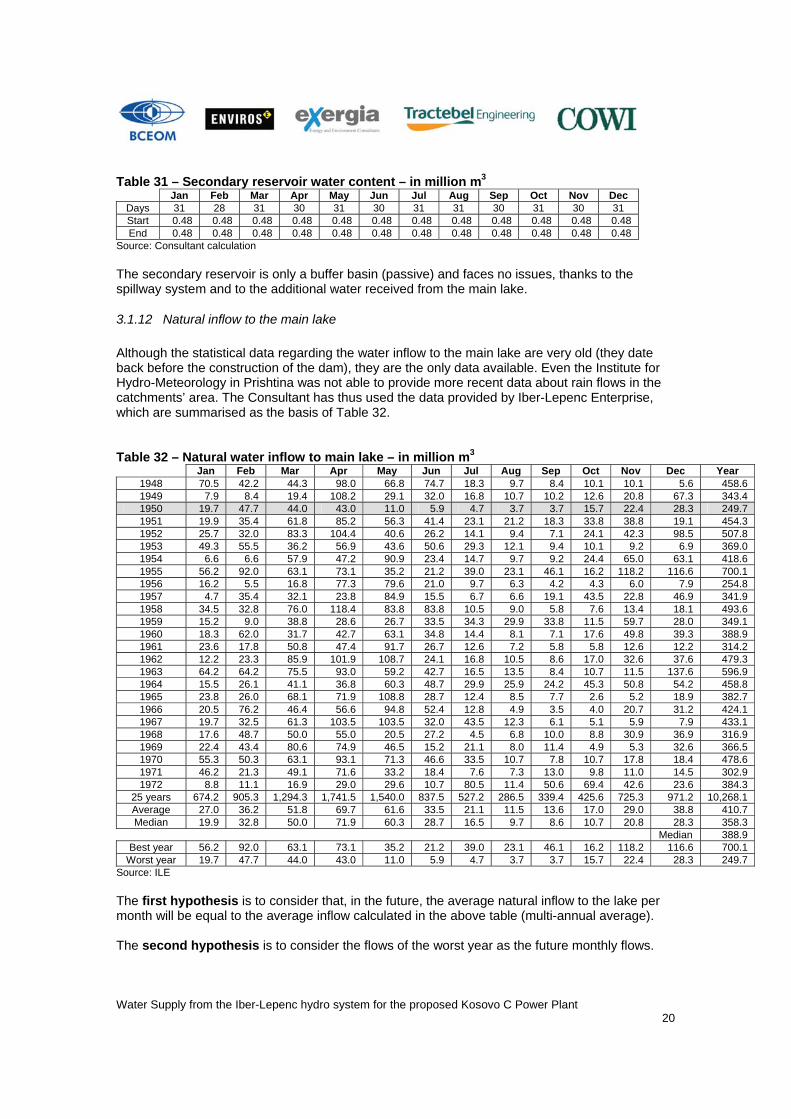
3.1.12 Natural inflow to the main lake Although the statistical data regarding the water inflow to the main lake are very old (they date back before the construction of the dam), they are the only data available. Even the Institute for Hydro-Meteorology in Prishtina was not able to provide more recent data about rain flows in the catchments’ area. The Consultant has thus used the data provided by Iber-Lepenc Enterprise, which are summarised as the basis of Table 32. Table 32 – Natural water inflow to main lake – in million m3
Jan Feb Mar Apr May Jun Jul Aug Sep Oct Nov Dec Year 1948 70.5 42.2 44.3 98.0 66.8 74.7 18.3 9.7 8.4 10.1 10.1 5.6 458.6 1949 7.9 8.4 19.4 108.2 29.1 32.0 16.8 10.7 10.2 12.6 20.8 67.3 343.4 1950 19.7 47.7 44.0 43.0 11.0 5.9 4.7 3.7 3.7 15.7 22.4 28.3 249.7 1951 19.9 35.4 61.8 85.2 56.3 41.4 23.1 21.2 18.3 33.8 38.8 19.1 454.3 1952 25.7 32.0 83.3 104.4 40.6 26.2 14.1 9.4 7.1 24.1 42.3 98.5 507.8 1953 49.3 55.5 36.2 56.9 43.6 50.6 29.3 12.1 9.4 10.1 9.2 6.9 369.0 1954 6.6 6.6 57.9 47.2 90.9 23.4 14.7 9.7 9.2 24.4 65.0 63.1 418.6 1955 56.2 92.0 63.1 73.1 35.2 21.2 39.0 23.1 46.1 16.2 118.2 116.6 700.1 1956 16.2 5.5 16.8 77.3 79.6 21.0 9.7 6.3 4.2 4.3 6.0 7.9 254.8 1957 4.7 35.4 32.1 23.8 84.9 15.5 6.7 6.6 19.1 43.5 22.8 46.9 341.9 1958 34.5 32.8 76.0 118.4 83.8 83.8 10.5 9.0 5.8 7.6 13.4 18.1 493.6 1959 15.2 9.0 38.8 28.6 26.7 33.5 34.3 29.9 33.8 11.5 59.7 28.0 349.1 1960 18.3 62.0 31.7 42.7 63.1 34.8 14.4 8.1 7.1 17.6 49.8 39.3 388.9 1961 23.6 17.8 50.8 47.4 91.7 26.7 12.6 7.2 5.8 5.8 12.6 12.2 314.2 1962 12.2 23.3 85.9 101.9 108.7 24.1 16.8 10.5 8.6 17.0 32.6 37.6 479.3 1963 64.2 64.2 75.5 93.0 59.2 42.7 16.5 13.5 8.4 10.7 11.5 137.6 596.9 1964 15.5 26.1 41.1 36.8 60.3 48.7 29.9 25.9 24.2 45.3 50.8 54.2 458.8 1965 23.8 26.0 68.1 71.9 108.8 28.7 12.4 8.5 7.7 2.6 5.2 18.9 382.7 1966 20.5 76.2 46.4 56.6 94.8 52.4 12.8 4.9 3.5 4.0 20.7 31.2 424.1 1967 19.7 32.5 61.3 103.5 103.5 32.0 43.5 12.3 6.1 5.1 5.9 7.9 433.1 1968 17.6 48.7 50.0 55.0 20.5 27.2 4.5 6.8 10.0 8.8 30.9 36.9 316.9 1969 22.4 43.4 80.6 74.9 46.5 15.2 21.1 8.0 11.4 4.9 5.3 32.6 366.5 1970 55.3 50.3 63.1 93.1 71.3 46.6 33.5 10.7 7.8 10.7 17.8 18.4 478.6 1971 46.2 21.3 49.1 71.6 33.2 18.4 7.6 7.3 13.0 9.8 11.0 14.5 302.9 1972 8.8 11.1 16.9 29.0 29.6 10.7 80.5 11.4 50.6 69.4 42.6 23.6 384.3
25 years 674.2 905.3 1,294.3 1,741.5 1,540.0 837.5 527.2 286.5 339.4 425.6 725.3 971.2 10,268.1 Average 27.0 36.2 51.8 69.7 61.6 33.5 21.1 11.5 13.6 17.0 29.0 38.8 410.7 Median 19.9 32.8 50.0 71.9 60.3 28.7 16.5 9.7 8.6 10.7 20.8 28.3 358.3
Median 388.9 Best year 56.2 92.0 63.1 73.1 35.2 21.2 39.0 23.1 46.1 16.2 118.2 116.6 700.1
Worst year 19.7 47.7 44.0 43.0 11.0 5.9 4.7 3.7 3.7 15.7 22.4 28.3 249.7 Source: ILE The first hypothesis is to consider that, in the future, the average natural inflow to the lake per month will be equal to the average inflow calculated in the above table (multi-annual average). The second hypothesis is to consider the flows of the worst year as the future monthly flows.
Water Supply from the Iber-Lepenc hydro system for the proposed Kosovo C Power Plant 21
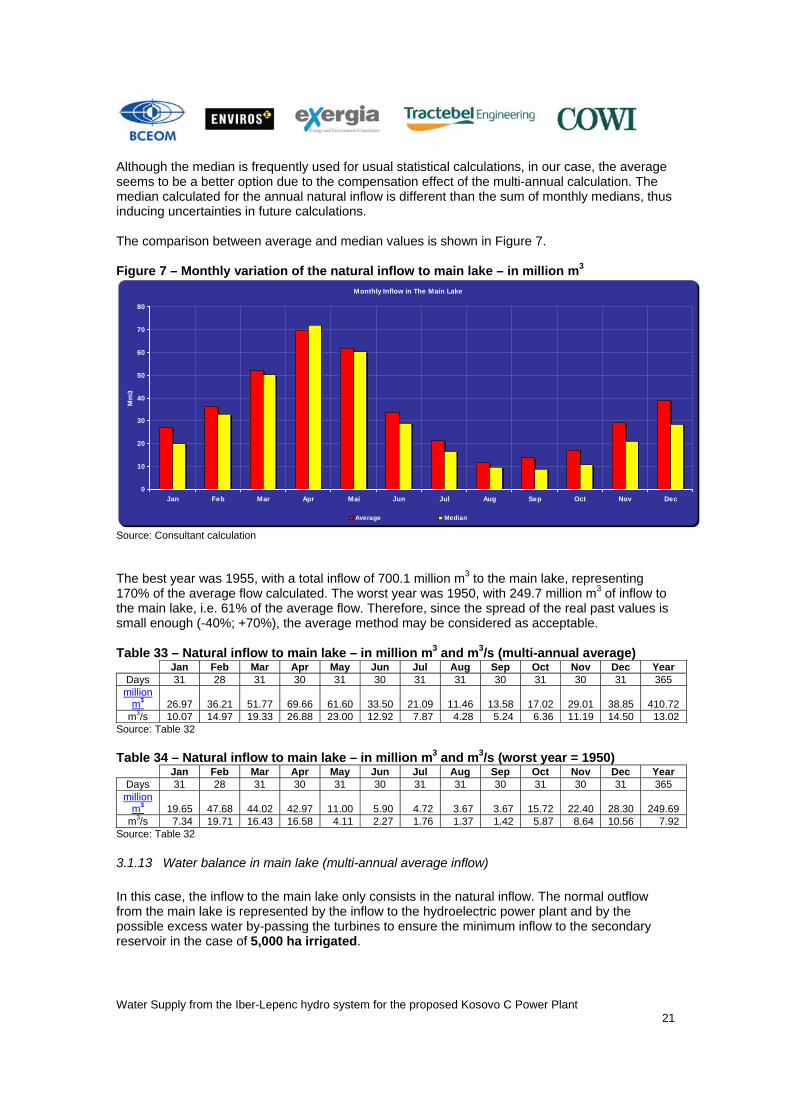
Although the median is frequently used for usual statistical calculations, in our case, the average seems to be a better option due to the compensation effect of the multi-annual calculation. The median calculated for the annual natural inflow is different than the sum of monthly medians, thus inducing uncertainties in future calculations. The comparison between average and median values is shown in Figure 7. Figure 7 – Monthly variation of the natural inflow to main lake – in million m3
Monthly Inflow in The Main Lake
0
10
20
30
40
50
60
70
80
Jan Feb Mar Apr Mai Jun Jul Aug Sep Oct Nov Dec
Mm
3
Average Median
Source: Consultant calculation The best year was 1955, with a total inflow of 700.1 million m3 to the main lake, representing 170% of the average flow calculated. The worst year was 1950, with 249.7 million m3 of inflow to the main lake, i.e. 61% of the average flow. Therefore, since the spread of the real past values is small enough (-40%; +70%), the average method may be considered as acceptable. Table 33 – Natural inflow to main lake – in million m3 and m3/s (multi-annual average)
Jan Feb Mar Apr May Jun Jul Aug Sep Oct Nov Dec Year Days 31 28 31 30 31 30 31 31 30 31 30 31 365
million m3 26.97 36.21 51.77 69.66 61.60 33.50 21.09 11.46 13.58 17.02 29.01 38.85 410.72
m3/s 10.07 14.97 19.33 26.88 23.00 12.92 7.87 4.28 5.24 6.36 11.19 14.50 13.02 Source: Table 32 Table 34 – Natural inflow to main lake – in million m3 and m3/s (worst year = 1950)
Jan Feb Mar Apr May Jun Jul Aug Sep Oct Nov Dec Year Days 31 28 31 30 31 30 31 31 30 31 30 31 365
million m3 19.65 47.68 44.02 42.97 11.00 5.90 4.72 3.67 3.67 15.72 22.40 28.30 249.69
m3/s 7.34 19.71 16.43 16.58 4.11 2.27 1.76 1.37 1.42 5.87 8.64 10.56 7.92 Source: Table 32
3.1.13 Water balance in main lake (multi-annual average inflow) In this case, the inflow to the main lake only consists in the natural inflow. The normal outflow from the main lake is represented by the inflow to the hydroelectric power plant and by the possible excess water by-passing the turbines to ensure the minimum inflow to the secondary reservoir in the case of 5,000 ha irrigated.
Water Supply from the Iber-Lepenc hydro system for the proposed Kosovo C Power Plant 22
Table 35 – Water balance in main lake – in m3/s (multi-annual average)
Jan Feb Mar Apr May Jun Jul Aug Sep Oct Nov Dec Year Days 31 28 31 30 31 30 31 31 30 31 30 31 365 Inflow 10.07 14.97 19.33 26.88 23.00 12.92 7.87 4.28 5.24 6.36 11.19 14.50 13.02
Outflow 5.87 6.27 7.50 6.49 6.93 6.98 6.93 6.93 6.95 5.15 5.15 5.15 6.36 Balance 4.20 8.70 11.83 20.38 16.07 5.94 0.94 -2.65 -1.72 1.21 6.05 9.36 6.67
Source: Consultant calculation Table 36 – Water balance in main lake – in million m3 (multi-annual average)
Jan Feb Mar Apr May Jun Jul Aug Sep Oct Nov Dec Year Days 31 28 31 30 31 30 31 31 30 31 30 31 365 Inflow 26.97 36.21 51.77 69.66 61.60 33.50 21.09 11.46 13.58 17.02 29.01 38.85 410.72
Outflow 15.72 15.17 20.10 16.83 18.56 18.09 18.56 18.56 18.02 13.78 13.34 13.78 200.51 Balance 11.25 21.04 31.68 52.83 43.04 15.41 2.53 -7.10 -4.45 3.24 15.68 25.07 210.22
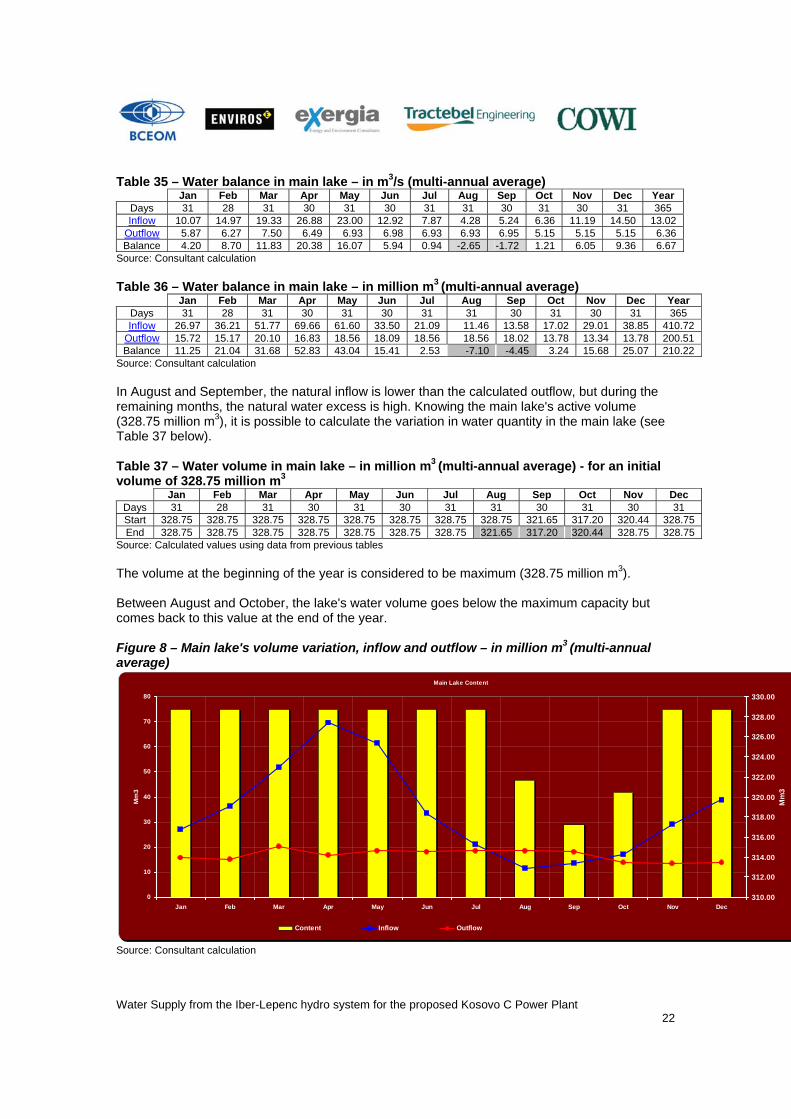
Source: Consultant calculation In August and September, the natural inflow is lower than the calculated outflow, but during the remaining months, the natural water excess is high. Knowing the main lake's active volume (328.75 million m3), it is possible to calculate the variation in water quantity in the main lake (see Table 37 below). Table 37 – Water volume in main lake – in million m3 (multi-annual average) - for an initial volume of 328.75 million m3
Jan Feb Mar Apr May Jun Jul Aug Sep Oct Nov Dec Days 31 28 31 30 31 30 31 31 30 31 30 31 Start 328.75 328.75 328.75 328.75 328.75 328.75 328.75 328.75 321.65 317.20 320.44 328.75 End 328.75 328.75 328.75 328.75 328.75 328.75 328.75 321.65 317.20 320.44 328.75 328.75
Source: Calculated values using data from previous tables The volume at the beginning of the year is considered to be maximum (328.75 million m3). Between August and October, the lake's water volume goes below the maximum capacity but comes back to this value at the end of the year. Figure 8 – Main lake's volume variation, inflow and outflow – in million m3 (multi-annual average)
Main Lake Content
0
10
20
30
40
50
60
70
80
Jan Feb Mar Apr May Jun Jul Aug Sep Oct Nov Dec
Mm
3
310.00
312.00
314.00
316.00
318.00
320.00
322.00
324.00
326.00
328.00
330.00
Mm
3
Content Inflow Outflow
Source: Consultant calculation
Water Supply from the Iber-Lepenc hydro system for the proposed Kosovo C Power Plant 23
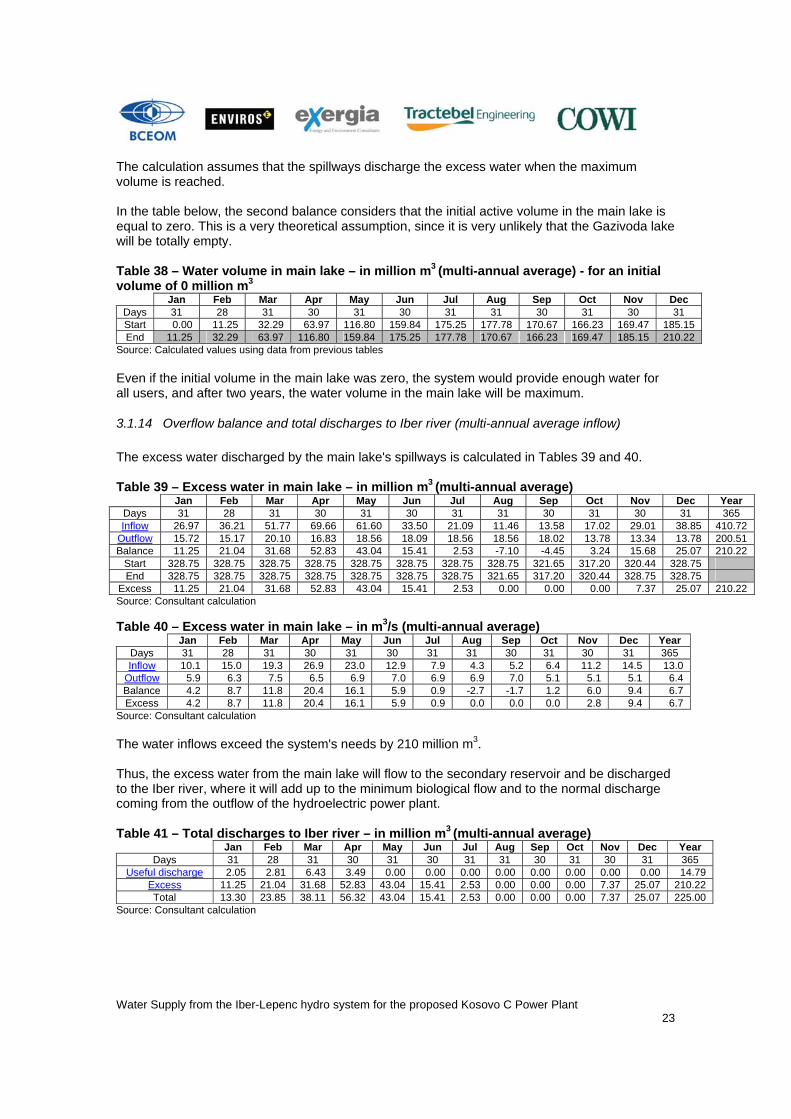
The calculation assumes that the spillways discharge the excess water when the maximum volume is reached. In the table below, the second balance considers that the initial active volume in the main lake is equal to zero. This is a very theoretical assumption, since it is very unlikely that the Gazivoda lake will be totally empty. Table 38 – Water volume in main lake – in million m3 (multi-annual average) - for an initial volume of 0 million m3
Jan Feb Mar Apr May Jun Jul Aug Sep Oct Nov Dec Days 31 28 31 30 31 30 31 31 30 31 30 31 Start 0.00 11.25 32.29 63.97 116.80 159.84 175.25 177.78 170.67 166.23 169.47 185.15 End 11.25 32.29 63.97 116.80 159.84 175.25 177.78 170.67 166.23 169.47 185.15 210.22
Source: Calculated values using data from previous tables Even if the initial volume in the main lake was zero, the system would provide enough water for all users, and after two years, the water volume in the main lake will be maximum.
3.1.14 Overflow balance and total discharges to Iber river (multi-annual average inflow) The excess water discharged by the main lake's spillways is calculated in Tables 39 and 40. Table 39 – Excess water in main lake – in million m3 (multi-annual average)
Jan Feb Mar Apr May Jun Jul Aug Sep Oct Nov Dec Year Days 31 28 31 30 31 30 31 31 30 31 30 31 365 Inflow 26.97 36.21 51.77 69.66 61.60 33.50 21.09 11.46 13.58 17.02 29.01 38.85 410.72
Outflow 15.72 15.17 20.10 16.83 18.56 18.09 18.56 18.56 18.02 13.78 13.34 13.78 200.51 Balance 11.25 21.04 31.68 52.83 43.04 15.41 2.53 -7.10 -4.45 3.24 15.68 25.07 210.22
Start 328.75 328.75 328.75 328.75 328.75 328.75 328.75 328.75 321.65 317.20 320.44 328.75 End 328.75 328.75 328.75 328.75 328.75 328.75 328.75 321.65 317.20 320.44 328.75 328.75
Excess 11.25 21.04 31.68 52.83 43.04 15.41 2.53 0.00 0.00 0.00 7.37 25.07 210.22 Source: Consultant calculation Table 40 – Excess water in main lake – in m3/s (multi-annual average)
Jan Feb Mar Apr May Jun Jul Aug Sep Oct Nov Dec Year Days 31 28 31 30 31 30 31 31 30 31 30 31 365 Inflow 10.1 15.0 19.3 26.9 23.0 12.9 7.9 4.3 5.2 6.4 11.2 14.5 13.0
Outflow 5.9 6.3 7.5 6.5 6.9 7.0 6.9 6.9 7.0 5.1 5.1 5.1 6.4 Balance 4.2 8.7 11.8 20.4 16.1 5.9 0.9 -2.7 -1.7 1.2 6.0 9.4 6.7 Excess 4.2 8.7 11.8 20.4 16.1 5.9 0.9 0.0 0.0 0.0 2.8 9.4 6.7
Source: Consultant calculation The water inflows exceed the system's needs by 210 million m3. Thus, the excess water from the main lake will flow to the secondary reservoir and be discharged to the Iber river, where it will add up to the minimum biological flow and to the normal discharge coming from the outflow of the hydroelectric power plant. Table 41 – Total discharges to Iber river – in million m3 (multi-annual average)
Jan Feb Mar Apr May Jun Jul Aug Sep Oct Nov Dec Year Days 31 28 31 30 31 30 31 31 30 31 30 31 365
Useful discharge 2.05 2.81 6.43 3.49 0.00 0.00 0.00 0.00 0.00 0.00 0.00 0.00 14.79 Excess 11.25 21.04 31.68 52.83 43.04 15.41 2.53 0.00 0.00 0.00 7.37 25.07 210.22 Total 13.30 23.85 38.11 56.32 43.04 15.41 2.53 0.00 0.00 0.00 7.37 25.07 225.00
Source: Consultant calculation
Water Supply from the Iber-Lepenc hydro system for the proposed Kosovo C Power Plant 24
Table 42 – Total discharges to Iber river – in m3/s (multi-annual average) Jan Feb Mar Apr May Jun Jul Aug Sep Oct Nov Dec Year
Days 31 28 31 30 31 30 31 31 30 31 30 31 365 Useful discharge 0.77 1.16 2.40 1.35 0.00 0.00 0.00 0.00 0.00 0.00 0.00 0.00 0.47
Excess 4.20 8.70 11.83 20.38 16.07 5.94 0.94 0.00 0.00 0.00 2.84 9.36 6.67 Total 4.97 9.86 14.23 21.73 16.07 5.94 0.94 0.00 0.00 0.00 2.84 9.36 7.13
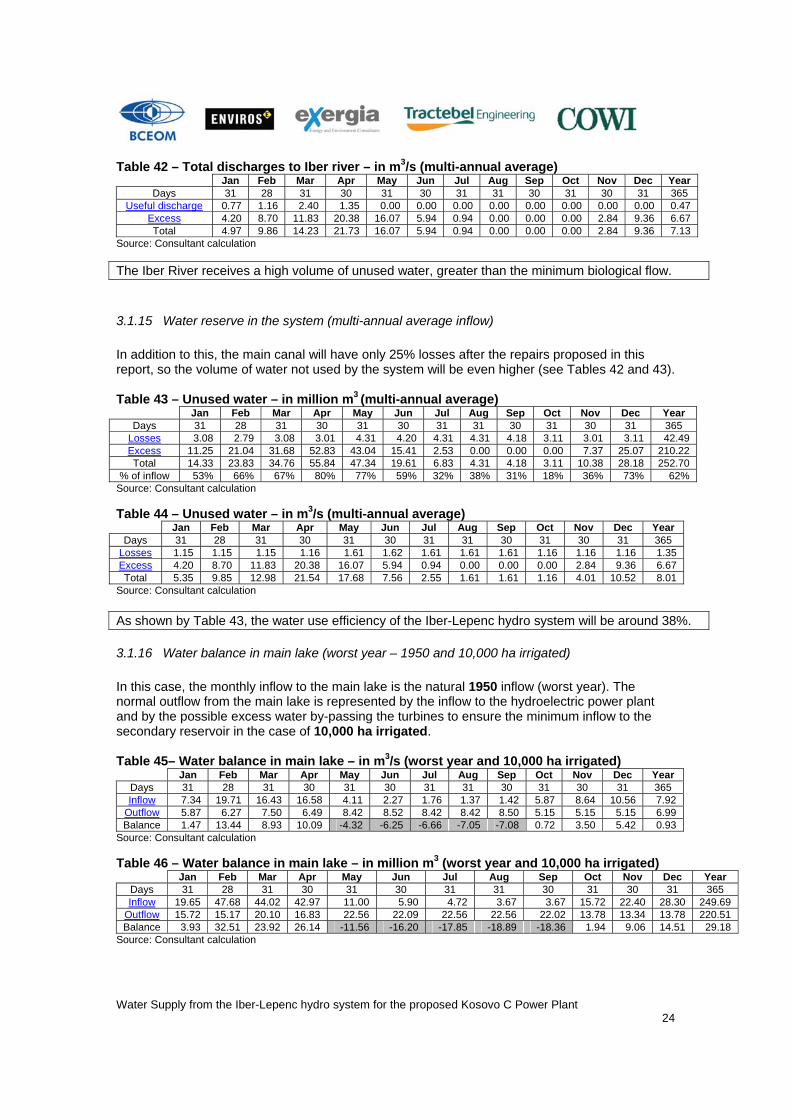
Source: Consultant calculation The Iber River receives a high volume of unused water, greater than the minimum biological flow.
3.1.15 Water reserve in the system (multi-annual average inflow) In addition to this, the main canal will have only 25% losses after the repairs proposed in this report, so the volume of water not used by the system will be even higher (see Tables 42 and 43). Table 43 – Unused water – in million m3 (multi-annual average)
Jan Feb Mar Apr May Jun Jul Aug Sep Oct Nov Dec Year Days 31 28 31 30 31 30 31 31 30 31 30 31 365
Losses 3.08 2.79 3.08 3.01 4.31 4.20 4.31 4.31 4.18 3.11 3.01 3.11 42.49 Excess 11.25 21.04 31.68 52.83 43.04 15.41 2.53 0.00 0.00 0.00 7.37 25.07 210.22 Total 14.33 23.83 34.76 55.84 47.34 19.61 6.83 4.31 4.18 3.11 10.38 28.18 252.70
% of inflow 53% 66% 67% 80% 77% 59% 32% 38% 31% 18% 36% 73% 62% Source: Consultant calculation Table 44 – Unused water – in m3/s (multi-annual average)
Jan Feb Mar Apr May Jun Jul Aug Sep Oct Nov Dec Year Days 31 28 31 30 31 30 31 31 30 31 30 31 365
Losses 1.15 1.15 1.15 1.16 1.61 1.62 1.61 1.61 1.61 1.16 1.16 1.16 1.35 Excess 4.20 8.70 11.83 20.38 16.07 5.94 0.94 0.00 0.00 0.00 2.84 9.36 6.67 Total 5.35 9.85 12.98 21.54 17.68 7.56 2.55 1.61 1.61 1.16 4.01 10.52 8.01
Source: Consultant calculation As shown by Table 43, the water use efficiency of the Iber-Lepenc hydro system will be around 38%.
3.1.16 Water balance in main lake (worst year – 1950 and 10,000 ha irrigated) In this case, the monthly inflow to the main lake is the natural 1950 inflow (worst year). The normal outflow from the main lake is represented by the inflow to the hydroelectric power plant and by the possible excess water by-passing the turbines to ensure the minimum inflow to the secondary reservoir in the case of 10,000 ha irrigated. Table 45– Water balance in main lake – in m3/s (worst year and 10,000 ha irrigated)
Jan Feb Mar Apr May Jun Jul Aug Sep Oct Nov Dec Year Days 31 28 31 30 31 30 31 31 30 31 30 31 365 Inflow 7.34 19.71 16.43 16.58 4.11 2.27 1.76 1.37 1.42 5.87 8.64 10.56 7.92
Outflow 5.87 6.27 7.50 6.49 8.42 8.52 8.42 8.42 8.50 5.15 5.15 5.15 6.99 Balance 1.47 13.44 8.93 10.09 -4.32 -6.25 -6.66 -7.05 -7.08 0.72 3.50 5.42 0.93
Source: Consultant calculation Table 46 – Water balance in main lake – in million m3 (worst year and 10,000 ha irrigated)
Jan Feb Mar Apr May Jun Jul Aug Sep Oct Nov Dec Year Days 31 28 31 30 31 30 31 31 30 31 30 31 365 Inflow 19.65 47.68 44.02 42.97 11.00 5.90 4.72 3.67 3.67 15.72 22.40 28.30 249.69
Outflow 15.72 15.17 20.10 16.83 22.56 22.09 22.56 22.56 22.02 13.78 13.34 13.78 220.51 Balance 3.93 32.51 23.92 26.14 -11.56 -16.20 -17.85 -18.89 -18.36 1.94 9.06 14.51 29.18
Source: Consultant calculation
Water Supply from the Iber-Lepenc hydro system for the proposed Kosovo C Power Plant 25
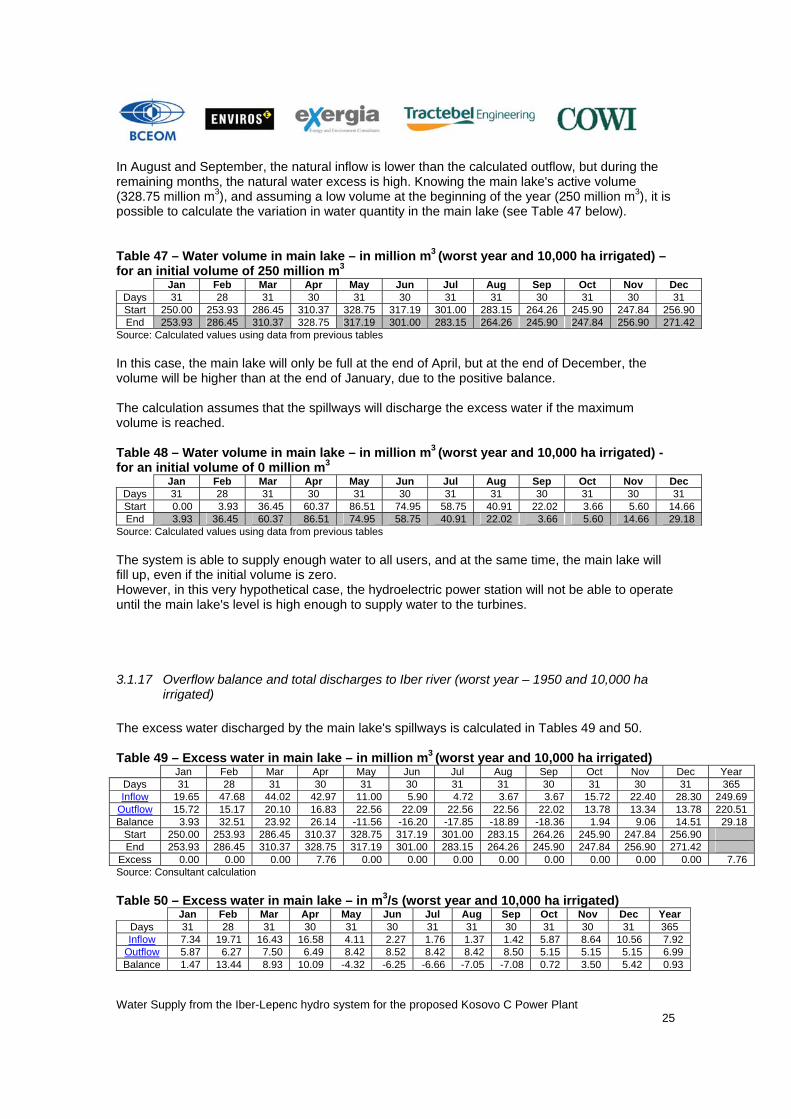
In August and September, the natural inflow is lower than the calculated outflow, but during the remaining months, the natural water excess is high. Knowing the main lake's active volume (328.75 million m3), and assuming a low volume at the beginning of the year (250 million m3), it is possible to calculate the variation in water quantity in the main lake (see Table 47 below). Table 47 – Water volume in main lake – in million m3 (worst year and 10,000 ha irrigated) – for an initial volume of 250 million m3
Jan Feb Mar Apr May Jun Jul Aug Sep Oct Nov Dec Days 31 28 31 30 31 30 31 31 30 31 30 31 Start 250.00 253.93 286.45 310.37 328.75 317.19 301.00 283.15 264.26 245.90 247.84 256.90 End 253.93 286.45 310.37 328.75 317.19 301.00 283.15 264.26 245.90 247.84 256.90 271.42
Source: Calculated values using data from previous tables In this case, the main lake will only be full at the end of April, but at the end of December, the volume will be higher than at the end of January, due to the positive balance. The calculation assumes that the spillways will discharge the excess water if the maximum volume is reached. Table 48 – Water volume in main lake – in million m3 (worst year and 10,000 ha irrigated) - for an initial volume of 0 million m3
Jan Feb Mar Apr May Jun Jul Aug Sep Oct Nov Dec Days 31 28 31 30 31 30 31 31 30 31 30 31 Start 0.00 3.93 36.45 60.37 86.51 74.95 58.75 40.91 22.02 3.66 5.60 14.66 End 3.93 36.45 60.37 86.51 74.95 58.75 40.91 22.02 3.66 5.60 14.66 29.18
Source: Calculated values using data from previous tables The system is able to supply enough water to all users, and at the same time, the main lake will fill up, even if the initial volume is zero. However, in this very hypothetical case, the hydroelectric power station will not be able to operate until the main lake's level is high enough to supply water to the turbines.
3.1.17 Overflow balance and total discharges to Iber river (worst year – 1950 and 10,000 ha irrigated)
The excess water discharged by the main lake's spillways is calculated in Tables 49 and 50. Table 49 – Excess water in main lake – in million m3 (worst year and 10,000 ha irrigated)
Jan Feb Mar Apr May Jun Jul Aug Sep Oct Nov Dec Year Days 31 28 31 30 31 30 31 31 30 31 30 31 365 Inflow 19.65 47.68 44.02 42.97 11.00 5.90 4.72 3.67 3.67 15.72 22.40 28.30 249.69
Outflow 15.72 15.17 20.10 16.83 22.56 22.09 22.56 22.56 22.02 13.78 13.34 13.78 220.51 Balance 3.93 32.51 23.92 26.14 -11.56 -16.20 -17.85 -18.89 -18.36 1.94 9.06 14.51 29.18
Start 250.00 253.93 286.45 310.37 328.75 317.19 301.00 283.15 264.26 245.90 247.84 256.90 End 253.93 286.45 310.37 328.75 317.19 301.00 283.15 264.26 245.90 247.84 256.90 271.42
Excess 0.00 0.00 0.00 7.76 0.00 0.00 0.00 0.00 0.00 0.00 0.00 0.00 7.76 Source: Consultant calculation Table 50 – Excess water in main lake – in m3/s (worst year and 10,000 ha irrigated)
Jan Feb Mar Apr May Jun Jul Aug Sep Oct Nov Dec Year Days 31 28 31 30 31 30 31 31 30 31 30 31 365 Inflow 7.34 19.71 16.43 16.58 4.11 2.27 1.76 1.37 1.42 5.87 8.64 10.56 7.92
Outflow 5.87 6.27 7.50 6.49 8.42 8.52 8.42 8.42 8.50 5.15 5.15 5.15 6.99 Balance 1.47 13.44 8.93 10.09 -4.32 -6.25 -6.66 -7.05 -7.08 0.72 3.50 5.42 0.93
Water Supply from the Iber-Lepenc hydro system for the proposed Kosovo C Power Plant 26
Excess 0.00 0.00 0.00 2.99 0.00 0.00 0.00 0.00 0.00 0.00 0.00 0.00 0.25 Source: Consultant calculation These two tables show that, even in the worst case scenario, the excess water in the system will reach 8 million m3. Thus, the excess water from the main lake will flow to the secondary reservoir and be discharged to the Iber river, where it will add up to the minimum biological flow and to the normal discharge coming from the outflow of the hydroelectric power plant. Table 51– Total discharges to Iber River – in million m3 (worst year and 10,000 ha irrigated)
Jan Feb Mar Apr May Jun Jul Aug Sep Oct Nov Dec Year Days 31 28 31 30 31 30 31 31 30 31 30 31 365
Useful discharge 2.05 2.81 6.43 3.49 0.00 0.00 0.00 0.00 0.00 0.00 0.00 0.00 14.79 Excess 0.00 0.00 0.00 7.76 0.00 0.00 0.00 0.00 0.00 0.00 0.00 0.00 7.76 Total 2.05 2.81 6.43 11.25 0.00 0.00 0.00 0.00 0.00 0.00 0.00 0.00 22.54
Source: Consultant calculation Table 52 – Total discharges to Iber River – in m3/s (worst year and 10,000 ha irrigated)
Jan Feb Mar Apr May Jun Jul Aug Sep Oct Nov Dec Year Days 31 28 31 30 31 30 31 31 30 31 30 31 365
Useful discharge 0.77 1.16 2.40 1.35 0.00 0.00 0.00 0.00 0.00 0.00 0.00 0.00 0.47 Excess 0.00 0.00 0.00 2.99 0.00 0.00 0.00 0.00 0.00 0.00 0.00 0.00 0.25 Total 0.77 1.16 2.40 4.34 0.00 0.00 0.00 0.00 0.00 0.00 0.00 0.00 0.71
3.1.18 Water reserve in the system (worst year - 1950) In addition to this, the main canal will only have 25% losses after the repairs proposed in this report, so the value of the unused water in the system will be higher (see Tables 53 and 54). Table 53 – Unused water – in million m3 (worst year and 10,000 ha irrigated)
Jan Feb Mar Apr May Jun Jul Aug Sep Oct Nov Dec Year Days 31 28 31 30 31 30 31 31 30 31 30 31 365
Losses 3.08 2.79 3.08 3.01 5.31 5.20 5.31 5.31 5.18 3.11 3.01 3.11 47.49 Excess 0.00 0.00 0.00 7.76 0.00 0.00 0.00 0.00 0.00 0.00 0.00 0.00 7.76 Total 3.08 2.79 3.08 10.77 5.31 5.20 5.31 5.31 5.18 3.11 3.01 3.11 55.25
% of inflow 16% 6% 7% 25% 48% 88% 113% 145% 141% 20% 13% 11% 22% Source: Consultant calculation Table 54 – Unused water – in m3/s (worst year and 10,000 ha irrigated)
Jan Feb Mar Apr May Jun Jul Aug Sep Oct Nov Dec Year Days 31 28 31 30 31 30 31 31 30 31 30 31 365
Losses 1.15 1.15 1.15 1.16 1.98 2.01 1.98 1.98 2.00 1.16 1.16 1.16 1.51 Excess 0.00 0.00 0.00 2.99 0.00 0.00 0.00 0.00 0.00 0.00 0.00 0.00 0.25 Total 1.15 1.15 1.15 4.15 1.98 2.01 1.98 1.98 2.00 1.16 1.16 1.16 1.75
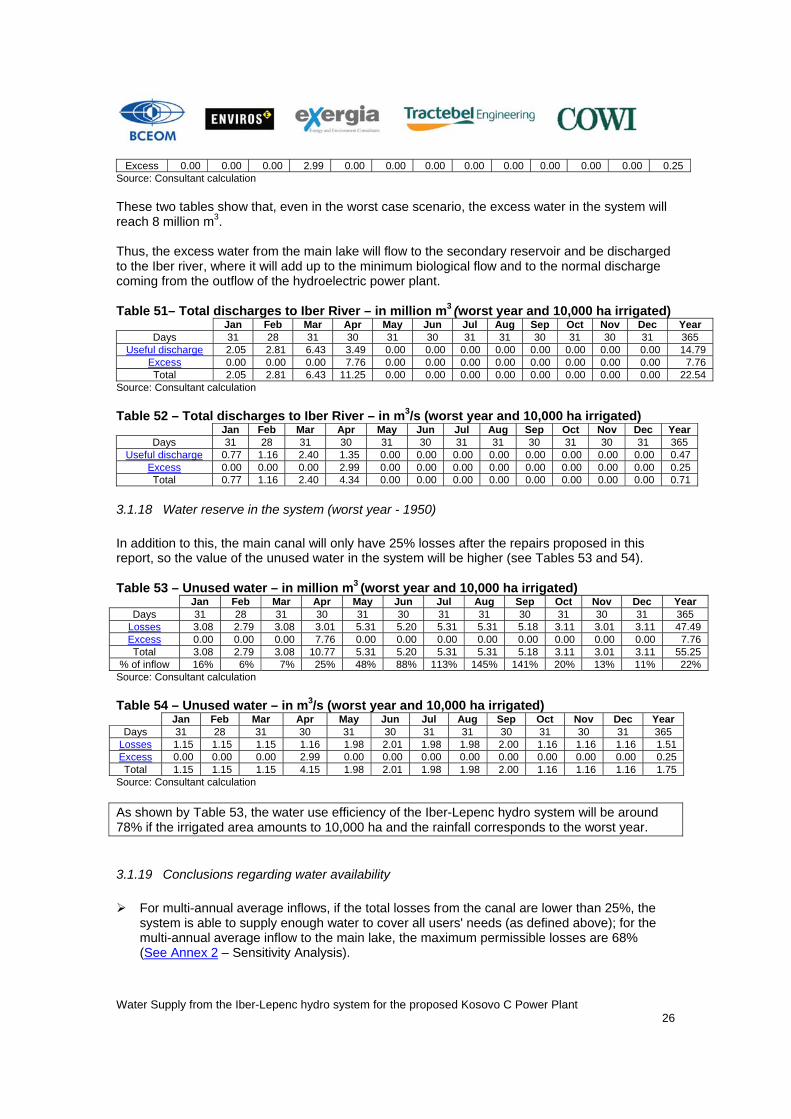
Source: Consultant calculation As shown by Table 53, the water use efficiency of the Iber-Lepenc hydro system will be around 78% if the irrigated area amounts to 10,000 ha and the rainfall corresponds to the worst year.
3.1.19 Conclusions regarding water availability
For multi-annual average inflows, if the total losses from the canal are lower than 25%, the system is able to supply enough water to cover all users' needs (as defined above); for the multi-annual average inflow to the main lake, the maximum permissible losses are 68% (See Annex 2 – Sensitivity Analysis).
Water Supply from the Iber-Lepenc hydro system for the proposed Kosovo C Power Plant 27
Even if the inflows to the main lake are equal to the worst year values (1950), the system is able to supply enough water to all users, including to the 10,000 ha of irrigated area; for the worst year inflows to the main lake, the maximum permissible losses are 38%.
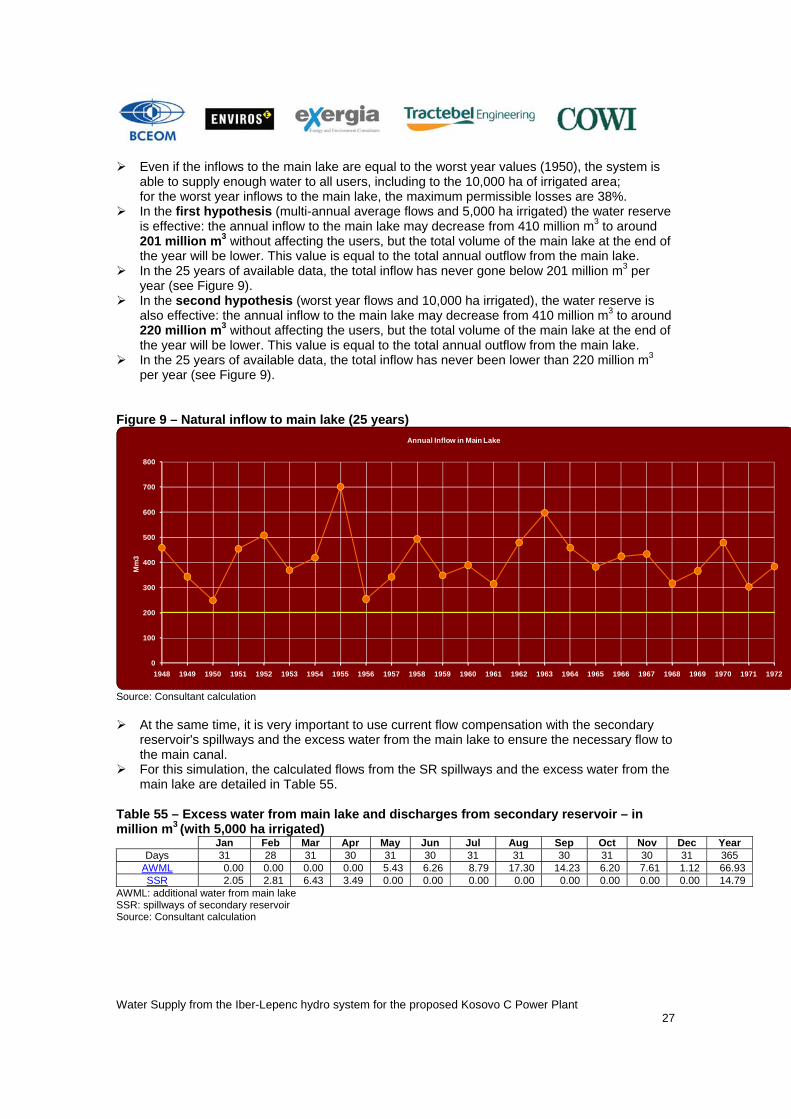
In the first hypothesis (multi-annual average flows and 5,000 ha irrigated) the water reserve is effective: the annual inflow to the main lake may decrease from 410 million m3 to around 201 million m3 without affecting the users, but the total volume of the main lake at the end of the year will be lower. This value is equal to the total annual outflow from the main lake.
In the 25 years of available data, the total inflow has never gone below 201 million m3 per year (see Figure 9).
In the second hypothesis (worst year flows and 10,000 ha irrigated), the water reserve is also effective: the annual inflow to the main lake may decrease from 410 million m3 to around 220 million m3 without affecting the users, but the total volume of the main lake at the end of the year will be lower. This value is equal to the total annual outflow from the main lake.
In the 25 years of available data, the total inflow has never been lower than 220 million m3 per year (see Figure 9).
Figure 9 – Natural inflow to main lake (25 years)
0
100
200
300
400
500
600
700
800
1948 1949 1950 1951 1952 1953 1954 1955 1956 1957 1958 1959 1960 1961 1962 1963 1964 1965 1966 1967 1968 1969 1970 1971 1972
Mm
3
Annual Inflow in Main Lake
Source: Consultant calculation
At the same time, it is very important to use current flow compensation with the secondary reservoir's spillways and the excess water from the main lake to ensure the necessary flow to the main canal.
For this simulation, the calculated flows from the SR spillways and the excess water from the main lake are detailed in Table 55.
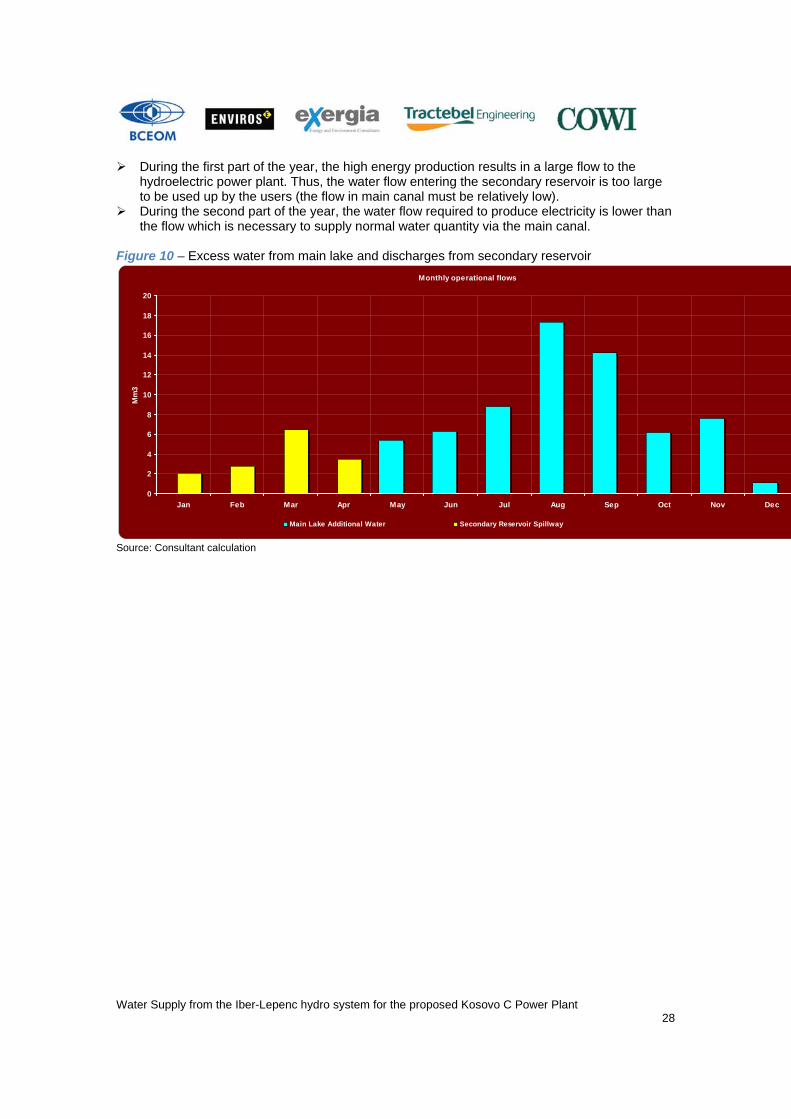
Table 55 – Excess water from main lake and discharges from secondary reservoir – in million m3 (with 5,000 ha irrigated)
Jan Feb Mar Apr May Jun Jul Aug Sep Oct Nov Dec Year Days 31 28 31 30 31 30 31 31 30 31 30 31 365
AWML 0.00 0.00 0.00 0.00 5.43 6.26 8.79 17.30 14.23 6.20 7.61 1.12 66.93 SSR 2.05 2.81 6.43 3.49 0.00 0.00 0.00 0.00 0.00 0.00 0.00 0.00 14.79
AWML: additional water from main lake SSR: spillways of secondary reservoir Source: Consultant calculation
Water Supply from the Iber-Lepenc hydro system for the proposed Kosovo C Power Plant 28
During the first part of the year, the high energy production results in a large flow to the hydroelectric power plant. Thus, the water flow entering the secondary reservoir is too large to be used up by the users (the flow in main canal must be relatively low).
During the second part of the year, the water flow required to produce electricity is lower than the flow which is necessary to supply normal water quantity via the main canal.
Figure 10 – Excess water from main lake and discharges from secondary reservoir
Monthly operational flows
0
2
4
6
8
10
12
14
16
18
20
Jan Feb Mar Apr May Jun Jul Aug Sep Oct Nov Dec
Mm
3
Main Lake Additional Water Secondary Reservoir Spillway
Source: Consultant calculation

Water Supply from the Iber-Lepenc hydro system for the proposed Kosovo C Power Plant 29
The Iber-Lepenc hydro system will be able to supply water to the Kosovo C power plant in 2016 provided that: ⇒ the main canal is repaired, so as to reduce its losses to 25%. If current estimated losses
(50%) remain unchanged, the system will be able to supply enough water to all users, but the annual inflow to the main lake will have to be greater than 271 million m3, otherwise the lake will empty. During the 1948-1972 period, the annual rainfall has been lower than this value twice, in 1950 and 1956;
⇒ a buffer basin is built at the end of the main canal, with a capacity corresponding to 10 days of Kosovo C and B's average consumption (approximately 1,750,000 m3)) in order to ensure a regular and permanent supply, even in emergency cases, and to enable to make the necessary repairs to the main canal.
⇒ the water compensation in the secondary reservoir is made with accuracy; ⇒ the weather does not change drastically and the average rainfall does not decrease
dramatically (below the worst year – 1950) Other issues: ⇒ Re-pumping water from the Pridvorice reservoir to the main lake is a solution to increase
the commercial efficiency of the energy production, but it depends on the market conditions;
⇒ The overall water use efficiency is still low (40%) and the system is able to supply more water to the various users (first priority: irrigation, domestic uses).
NOTE: The detailed calculations of the values mentioned above are given in the attached Flows and Balance Excel files.
3.2 Are investments needed for repairs or rehabilitation or system extension?
Two categories of investments need to be made in order to ensure that the Kosovo C power plant (as well as all other users) will benefit from a continuous water supply: • Repairs to the main canal (because of the very high current losses); • Construction of a buffer basin at the end of the main canal (to ensure continuity of
operations even in case of emergency and to enable short-time works in the canal). The safety of the Kosovo C production is not guaranteed without a buffer basin, unless another solution is adopted (see section 3.3.2).
3.2.1 Estimation of current losses from main canal The loss estimation is based both on extensive site visits made by the Consultant during the two first missions and on usual flow calculations. The leakage flows have been estimated on the basis of measurements made during these technical visits which included the data collection of structure dimensions, water velocity, and water depth. These measurements have been correlated with the inflow and outflow of the main canal, taking also into consideration other known sources of leakages which could not be properly assessed, such as unauthorised pipes or leakage through joints. Regarding these illegal abstractions, a provision of 25% of the identified and estimated leakage flows has been added in order to account for such losses. Illegal abstractions are unaccounted
Water Supply from the Iber-Lepenc hydro system for the proposed Kosovo C Power Plant 30
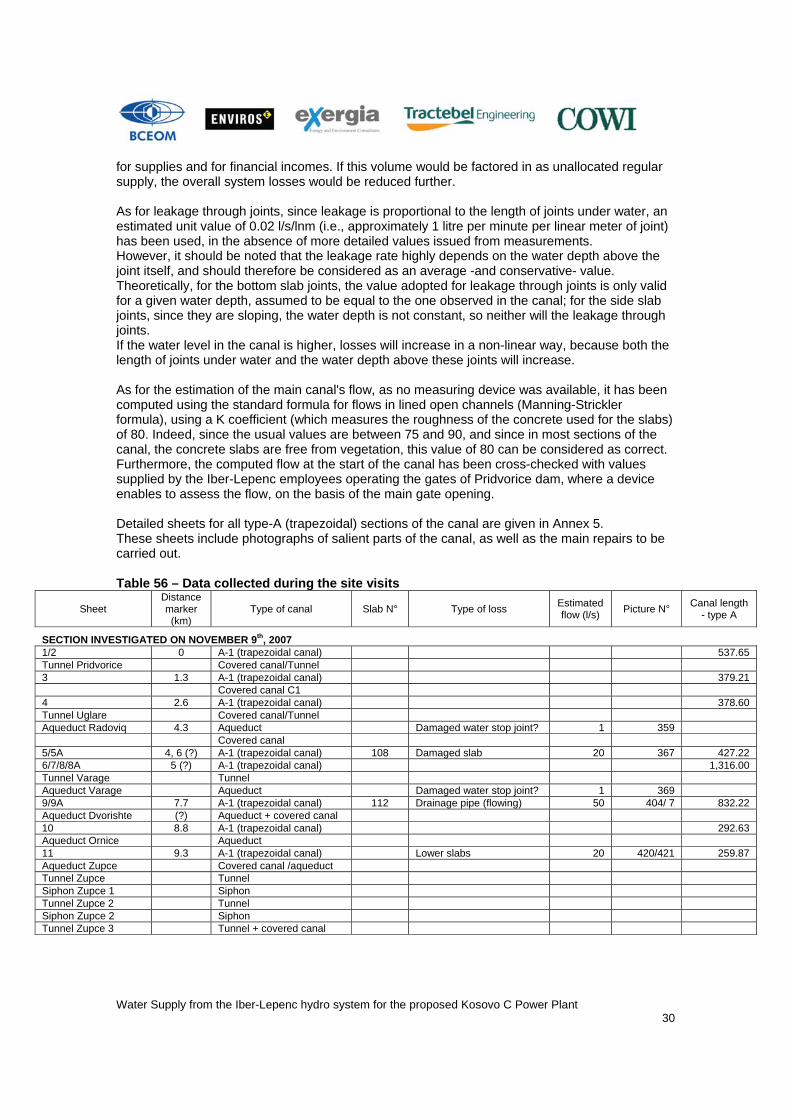
for supplies and for financial incomes. If this volume would be factored in as unallocated regular supply, the overall system losses would be reduced further. As for leakage through joints, since leakage is proportional to the length of joints under water, an estimated unit value of 0.02 l/s/lnm (i.e., approximately 1 litre per minute per linear meter of joint) has been used, in the absence of more detailed values issued from measurements. However, it should be noted that the leakage rate highly depends on the water depth above the joint itself, and should therefore be considered as an average -and conservative- value. Theoretically, for the bottom slab joints, the value adopted for leakage through joints is only valid for a given water depth, assumed to be equal to the one observed in the canal; for the side slab joints, since they are sloping, the water depth is not constant, so neither will the leakage through joints. If the water level in the canal is higher, losses will increase in a non-linear way, because both the length of joints under water and the water depth above these joints will increase. As for the estimation of the main canal's flow, as no measuring device was available, it has been computed using the standard formula for flows in lined open channels (Manning-Strickler formula), using a K coefficient (which measures the roughness of the concrete used for the slabs) of 80. Indeed, since the usual values are between 75 and 90, and since in most sections of the canal, the concrete slabs are free from vegetation, this value of 80 can be considered as correct. Furthermore, the computed flow at the start of the canal has been cross-checked with values supplied by the Iber-Lepenc employees operating the gates of Pridvorice dam, where a device enables to assess the flow, on the basis of the main gate opening. Detailed sheets for all type-A (trapezoidal) sections of the canal are given in Annex 5. These sheets include photographs of salient parts of the canal, as well as the main repairs to be carried out. Table 56 – Data collected during the site visits
Sheet Distance marker (km)
Type of canal Slab N° Type of loss Estimated flow (l/s) Picture N° Canal length
- type A
SECTION INVESTIGATED ON NOVEMBER 9th, 2007 1/2 0 A-1 (trapezoidal canal) 537.65 Tunnel Pridvorice Covered canal/Tunnel 3 1.3 A-1 (trapezoidal canal) 379.21 Covered canal C1 4 2.6 A-1 (trapezoidal canal) 378.60 Tunnel Uglare Covered canal/Tunnel Aqueduct Radoviq 4.3 Aqueduct Damaged water stop joint? 1 359 Covered canal 5/5A 4, 6 (?) A-1 (trapezoidal canal) 108 Damaged slab 20 367 427.22 6/7/8/8A 5 (?) A-1 (trapezoidal canal) 1,316.00 Tunnel Varage Tunnel Aqueduct Varage Aqueduct Damaged water stop joint? 1 369 9/9A 7.7 A-1 (trapezoidal canal) 112 Drainage pipe (flowing) 50 404/ 7 832.22 Aqueduct Dvorishte (?) Aqueduct + covered canal 10 8.8 A-1 (trapezoidal canal) 292.63 Aqueduct Ornice Aqueduct 11 9.3 A-1 (trapezoidal canal) Lower slabs 20 420/421 259.87 Aqueduct Zupce Covered canal /aqueduct Tunnel Zupce Tunnel Siphon Zupce 1 Siphon Tunnel Zupce 2 Tunnel Siphon Zupce 2 Siphon Tunnel Zupce 3 Tunnel + covered canal
Water Supply from the Iber-Lepenc hydro system for the proposed Kosovo C Power Plant 31
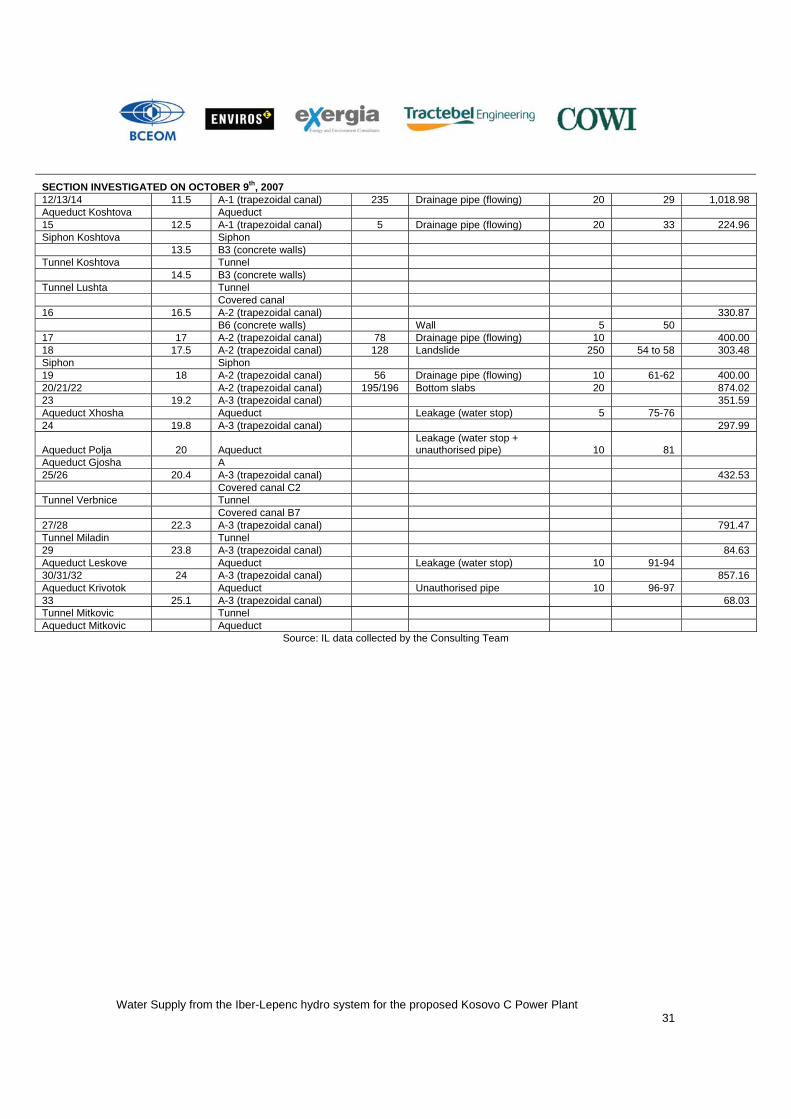
SECTION INVESTIGATED ON OCTOBER 9th, 2007 12/13/14 11.5 A-1 (trapezoidal canal) 235 Drainage pipe (flowing) 20 29 1,018.98 Aqueduct Koshtova Aqueduct 15 12.5 A-1 (trapezoidal canal) 5 Drainage pipe (flowing) 20 33 224.96 Siphon Koshtova Siphon 13.5 B3 (concrete walls) Tunnel Koshtova Tunnel 14.5 B3 (concrete walls) Tunnel Lushta Tunnel Covered canal 16 16.5 A-2 (trapezoidal canal) 330.87 B6 (concrete walls) Wall 5 50 17 17 A-2 (trapezoidal canal) 78 Drainage pipe (flowing) 10 400.00 18 17.5 A-2 (trapezoidal canal) 128 Landslide 250 54 to 58 303.48 Siphon Siphon 19 18 A-2 (trapezoidal canal) 56 Drainage pipe (flowing) 10 61-62 400.00 20/21/22 A-2 (trapezoidal canal) 195/196 Bottom slabs 20 874.02 23 19.2 A-3 (trapezoidal canal) 351.59 Aqueduct Xhosha Aqueduct Leakage (water stop) 5 75-76 24 19.8 A-3 (trapezoidal canal) 297.99
Aqueduct Polja 20 Aqueduct Leakage (water stop + unauthorised pipe) 10 81
Aqueduct Gjosha A 25/26 20.4 A-3 (trapezoidal canal) 432.53 Covered canal C2 Tunnel Verbnice Tunnel Covered canal B7 27/28 22.3 A-3 (trapezoidal canal) 791.47 Tunnel Miladin Tunnel 29 23.8 A-3 (trapezoidal canal) 84.63 Aqueduct Leskove Aqueduct Leakage (water stop) 10 91-94 30/31/32 24 A-3 (trapezoidal canal) 857.16 Aqueduct Krivotok Aqueduct Unauthorised pipe 10 96-97 33 25.1 A-3 (trapezoidal canal) 68.03 Tunnel Mitkovic Tunnel Aqueduct Mitkovic Aqueduct
Source: IL data collected by the Consulting Team
Water Supply from the Iber-Lepenc hydro system for the proposed Kosovo C Power Plant 32
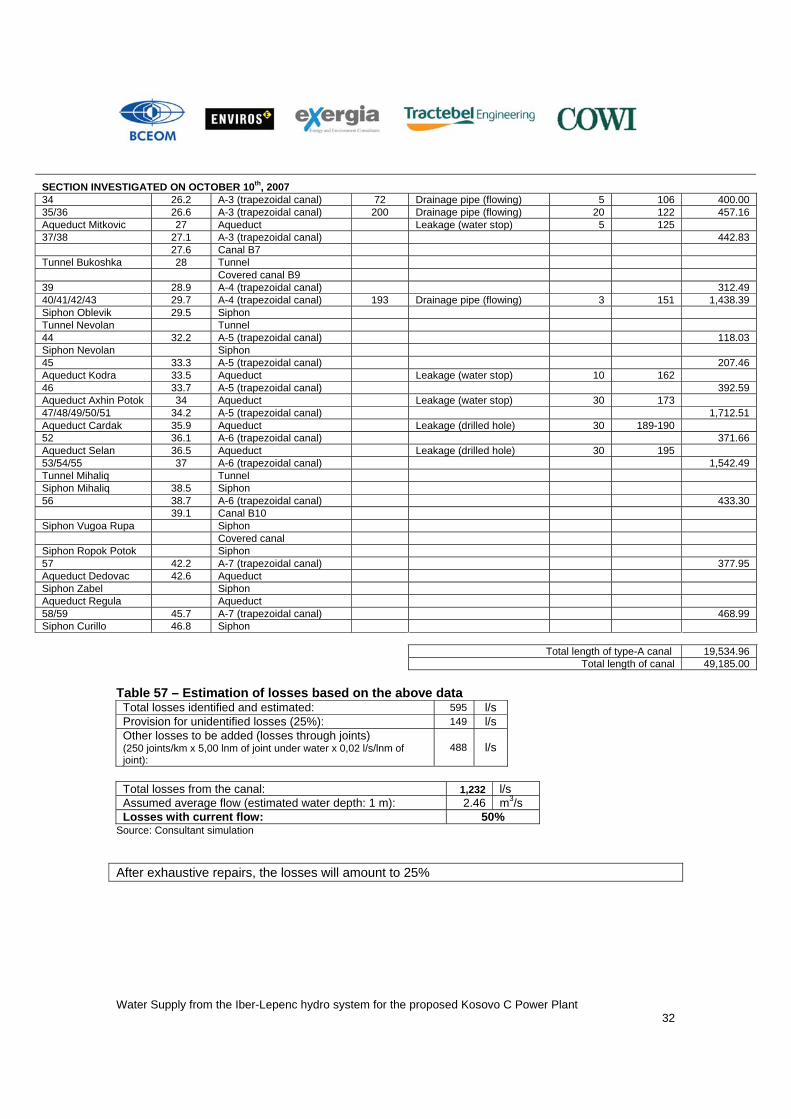
SECTION INVESTIGATED ON OCTOBER 10th, 2007 34 26.2 A-3 (trapezoidal canal) 72 Drainage pipe (flowing) 5 106 400.00 35/36 26.6 A-3 (trapezoidal canal) 200 Drainage pipe (flowing) 20 122 457.16 Aqueduct Mitkovic 27 Aqueduct Leakage (water stop) 5 125 37/38 27.1 A-3 (trapezoidal canal) 442.83 27.6 Canal B7 Tunnel Bukoshka 28 Tunnel Covered canal B9 39 28.9 A-4 (trapezoidal canal) 312.49 40/41/42/43 29.7 A-4 (trapezoidal canal) 193 Drainage pipe (flowing) 3 151 1,438.39 Siphon Oblevik 29.5 Siphon Tunnel Nevolan Tunnel 44 32.2 A-5 (trapezoidal canal) 118.03 Siphon Nevolan Siphon 45 33.3 A-5 (trapezoidal canal) 207.46 Aqueduct Kodra 33.5 Aqueduct Leakage (water stop) 10 162 46 33.7 A-5 (trapezoidal canal) 392.59 Aqueduct Axhin Potok 34 Aqueduct Leakage (water stop) 30 173 47/48/49/50/51 34.2 A-5 (trapezoidal canal) 1,712.51 Aqueduct Cardak 35.9 Aqueduct Leakage (drilled hole) 30 189-190 52 36.1 A-6 (trapezoidal canal) 371.66 Aqueduct Selan 36.5 Aqueduct Leakage (drilled hole) 30 195 53/54/55 37 A-6 (trapezoidal canal) 1,542.49 Tunnel Mihaliq Tunnel Siphon Mihaliq 38.5 Siphon 56 38.7 A-6 (trapezoidal canal) 433.30 39.1 Canal B10 Siphon Vugoa Rupa Siphon Covered canal Siphon Ropok Potok Siphon 57 42.2 A-7 (trapezoidal canal) 377.95 Aqueduct Dedovac 42.6 Aqueduct Siphon Zabel Siphon Aqueduct Regula Aqueduct 58/59 45.7 A-7 (trapezoidal canal) 468.99 Siphon Curillo 46.8 Siphon Total length of type-A canal 19,534.96 Total length of canal 49,185.00
Table 57 – Estimation of losses based on the above data
Total losses identified and estimated: 595 l/s Provision for unidentified losses (25%): 149 l/s Other losses to be added (losses through joints) (250 joints/km x 5,00 lnm of joint under water x 0,02 l/s/lnm of joint):
488 l/s
Total losses from the canal: 1,232 l/s Assumed average flow (estimated water depth: 1 m): 2.46 m3/s Losses with current flow: 50%
Source: Consultant simulation
After exhaustive repairs, the losses will amount to 25%
Water Supply from the Iber-Lepenc hydro system for the proposed Kosovo C Power Plant 33
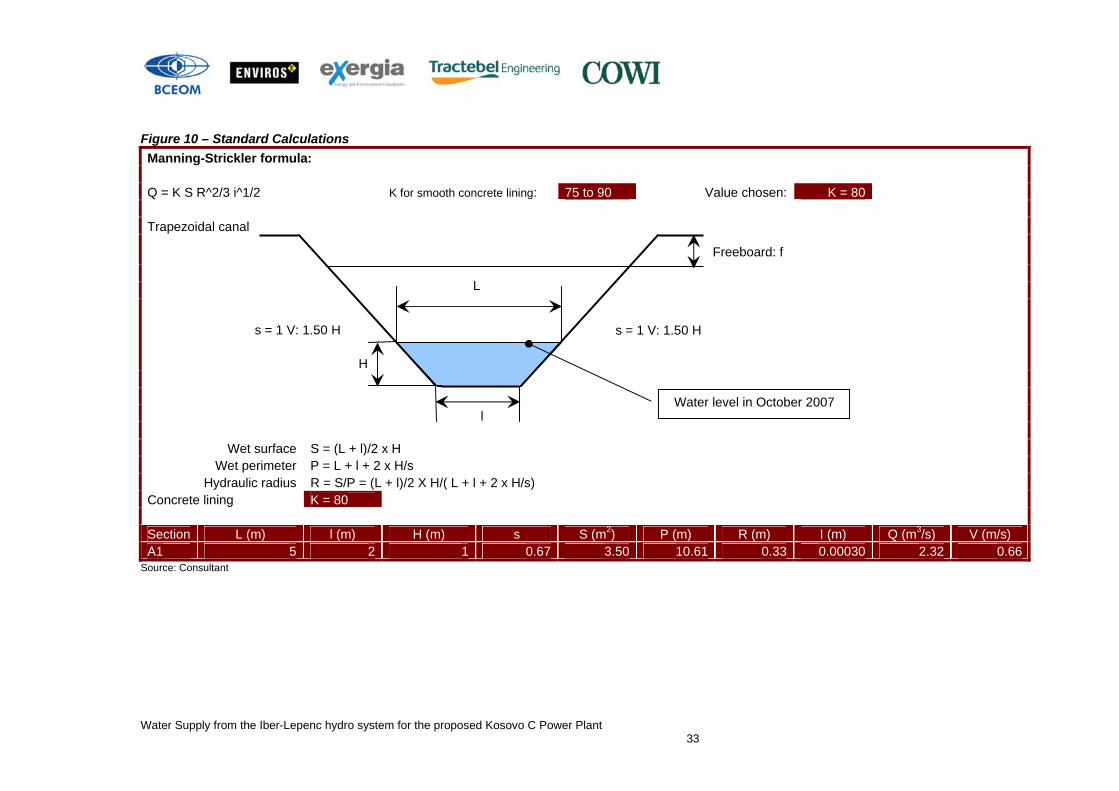
Figure 10 – Standard Calculations Manning-Strickler formula: Q = K S R^2/3 i^1/2 K for smooth concrete lining: 75 to 90 Value chosen: K = 80 Trapezoidal canal
Wet surface S = (L + l)/2 x H Wet perimeter P = L + l + 2 x H/s
Hydraulic radius R = S/P = (L + l)/2 X H/( L + l + 2 x H/s) Concrete lining K = 80 Section L (m) l (m) H (m) s S (m2) P (m) R (m) I (m) Q (m3/s) V (m/s) A1 5 2 1 0.67 3.50 10.61 0.33 0.00030 2.32 0.66
Source: Consultant
L
Freeboard: f
H
s = 1 V: 1.50 H s = 1 V: 1.50 H
l Water level in October 2007
Water Supply from the Iber-Lepenc hydro system for the proposed Kosovo C Power Plant 34
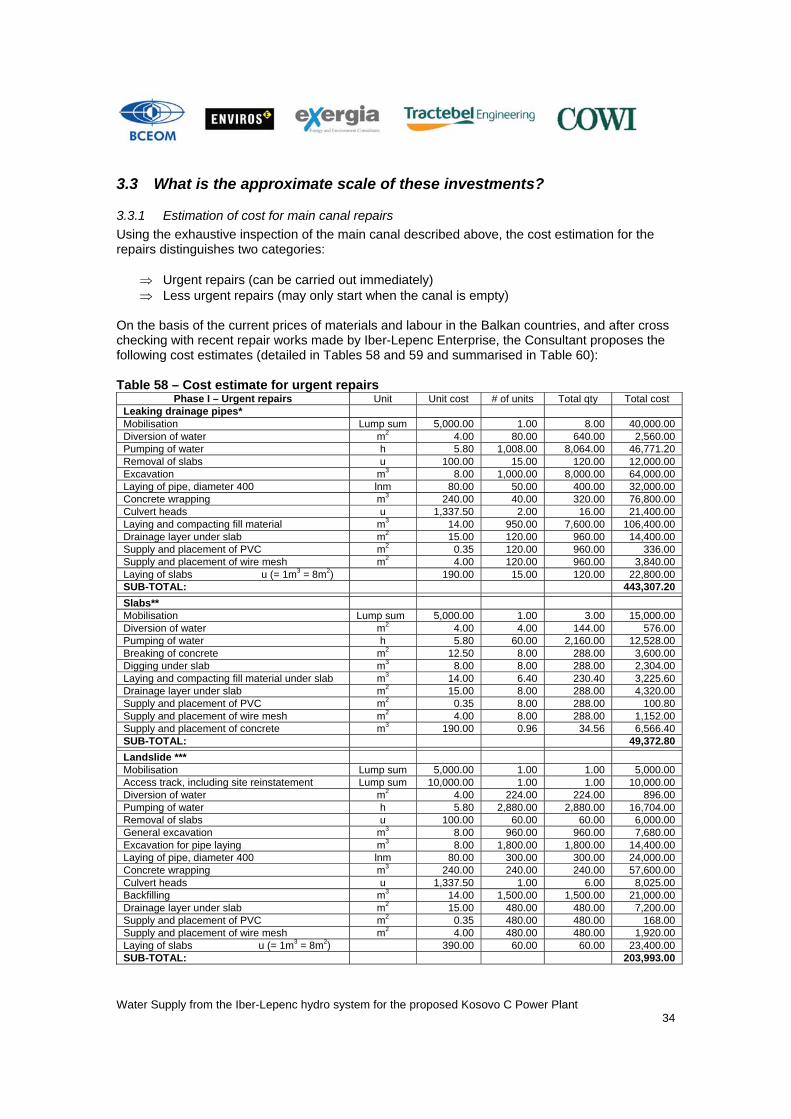
3.3 What is the approximate scale of these investments?
3.3.1 Estimation of cost for main canal repairs Using the exhaustive inspection of the main canal described above, the cost estimation for the repairs distinguishes two categories:
⇒ Urgent repairs (can be carried out immediately) ⇒ Less urgent repairs (may only start when the canal is empty)
On the basis of the current prices of materials and labour in the Balkan countries, and after cross checking with recent repair works made by Iber-Lepenc Enterprise, the Consultant proposes the following cost estimates (detailed in Tables 58 and 59 and summarised in Table 60): Table 58 – Cost estimate for urgent repairs
Phase I – Urgent repairs Unit Unit cost # of units Total qty Total cost Leaking drainage pipes* Mobilisation Lump sum 5,000.00 1.00 8.00 40,000.00 Diversion of water m2 4.00 80.00 640.00 2,560.00 Pumping of water h 5.80 1,008.00 8,064.00 46,771.20 Removal of slabs u 100.00 15.00 120.00 12,000.00 Excavation m3 8.00 1,000.00 8,000.00 64,000.00 Laying of pipe, diameter 400 lnm 80.00 50.00 400.00 32,000.00 Concrete wrapping m3 240.00 40.00 320.00 76,800.00 Culvert heads u 1,337.50 2.00 16.00 21,400.00 Laying and compacting fill material m3 14.00 950.00 7,600.00 106,400.00 Drainage layer under slab m2 15.00 120.00 960.00 14,400.00 Supply and placement of PVC m2 0.35 120.00 960.00 336.00 Supply and placement of wire mesh m2 4.00 120.00 960.00 3,840.00 Laying of slabs u (= 1m3 = 8m2) 190.00 15.00 120.00 22,800.00 SUB-TOTAL: 443,307.20
Slabs** Mobilisation Lump sum 5,000.00 1.00 3.00 15,000.00 Diversion of water m2 4.00 4.00 144.00 576.00 Pumping of water h 5.80 60.00 2,160.00 12,528.00 Breaking of concrete m2 12.50 8.00 288.00 3,600.00 Digging under slab m3 8.00 8.00 288.00 2,304.00 Laying and compacting fill material under slab m3 14.00 6.40 230.40 3,225.60 Drainage layer under slab m2 15.00 8.00 288.00 4,320.00 Supply and placement of PVC m2 0.35 8.00 288.00 100.80 Supply and placement of wire mesh m2 4.00 8.00 288.00 1,152.00 Supply and placement of concrete m3 190.00 0.96 34.56 6,566.40 SUB-TOTAL: 49,372.80
Landslide *** Mobilisation Lump sum 5,000.00 1.00 1.00 5,000.00 Access track, including site reinstatement Lump sum 10,000.00 1.00 1.00 10,000.00 Diversion of water m2 4.00 224.00 224.00 896.00 Pumping of water h 5.80 2,880.00 2,880.00 16,704.00 Removal of slabs u 100.00 60.00 60.00 6,000.00 General excavation m3 8.00 960.00 960.00 7,680.00 Excavation for pipe laying m3 8.00 1,800.00 1,800.00 14,400.00 Laying of pipe, diameter 400 lnm 80.00 300.00 300.00 24,000.00 Concrete wrapping m3 240.00 240.00 240.00 57,600.00 Culvert heads u 1,337.50 1.00 6.00 8,025.00 Backfilling m3 14.00 1,500.00 1,500.00 21,000.00 Drainage layer under slab m2 15.00 480.00 480.00 7,200.00 Supply and placement of PVC m2 0.35 480.00 480.00 168.00 Supply and placement of wire mesh m2 4.00 480.00 480.00 1,920.00 Laying of slabs u (= 1m3 = 8m2) 390.00 60.00 60.00 23,400.00 SUB-TOTAL: 203,993.00
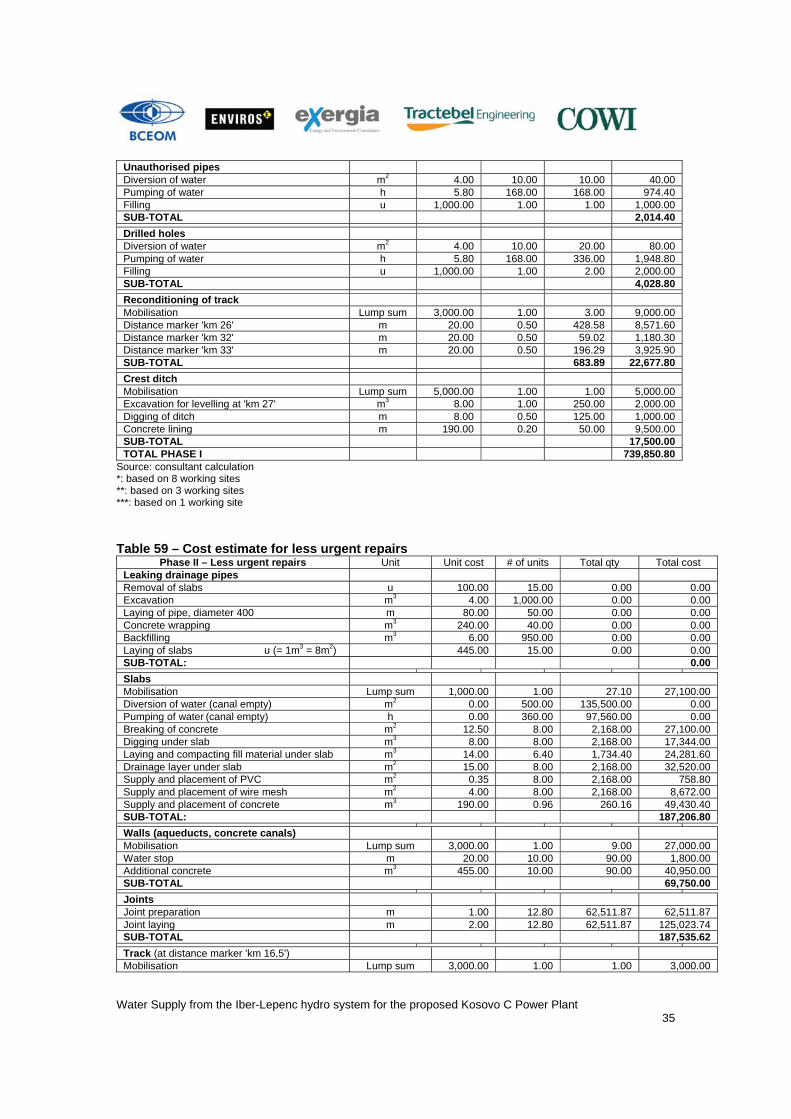
Water Supply from the Iber-Lepenc hydro system for the proposed Kosovo C Power Plant 35
Unauthorised pipes Diversion of water m2 4.00 10.00 10.00 40.00 Pumping of water h 5.80 168.00 168.00 974.40 Filling u 1,000.00 1.00 1.00 1,000.00 SUB-TOTAL 2,014.40
Drilled holes Diversion of water m2 4.00 10.00 20.00 80.00 Pumping of water h 5.80 168.00 336.00 1,948.80 Filling u 1,000.00 1.00 2.00 2,000.00 SUB-TOTAL 4,028.80
Reconditioning of track Mobilisation Lump sum 3,000.00 1.00 3.00 9,000.00 Distance marker 'km 26' m 20.00 0.50 428.58 8,571.60 Distance marker 'km 32' m 20.00 0.50 59.02 1,180.30 Distance marker 'km 33' m 20.00 0.50 196.29 3,925.90 SUB-TOTAL 683.89 22,677.80
Crest ditch Mobilisation Lump sum 5,000.00 1.00 1.00 5,000.00 Excavation for levelling at 'km 27' m3 8.00 1.00 250.00 2,000.00 Digging of ditch m 8.00 0.50 125.00 1,000.00 Concrete lining m 190.00 0.20 50.00 9,500.00 SUB-TOTAL 17,500.00 TOTAL PHASE I 739,850.80
Source: consultant calculation *: based on 8 working sites **: based on 3 working sites ***: based on 1 working site Table 59 – Cost estimate for less urgent repairs
Phase II – Less urgent repairs Unit Unit cost # of units Total qty Total cost Leaking drainage pipes Removal of slabs u 100.00 15.00 0.00 0.00 Excavation m3 4.00 1,000.00 0.00 0.00 Laying of pipe, diameter 400 m 80.00 50.00 0.00 0.00 Concrete wrapping m3 240.00 40.00 0.00 0.00 Backfilling m3 6.00 950.00 0.00 0.00 Laying of slabs u (= 1m3 = 8m2) 445.00 15.00 0.00 0.00 SUB-TOTAL: 0.00
Slabs Mobilisation Lump sum 1,000.00 1.00 27.10 27,100.00 Diversion of water (canal empty) m2 0.00 500.00 135,500.00 0.00 Pumping of water (canal empty) h 0.00 360.00 97,560.00 0.00 Breaking of concrete m2 12.50 8.00 2,168.00 27,100.00 Digging under slab m3 8.00 8.00 2,168.00 17,344.00 Laying and compacting fill material under slab m3 14.00 6.40 1,734.40 24,281.60 Drainage layer under slab m2 15.00 8.00 2,168.00 32,520.00 Supply and placement of PVC m2 0.35 8.00 2,168.00 758.80 Supply and placement of wire mesh m2 4.00 8.00 2,168.00 8,672.00 Supply and placement of concrete m3 190.00 0.96 260.16 49,430.40 SUB-TOTAL: 187,206.80
Walls (aqueducts, concrete canals) Mobilisation Lump sum 3,000.00 1.00 9.00 27,000.00 Water stop m 20.00 10.00 90.00 1,800.00 Additional concrete m3 455.00 10.00 90.00 40,950.00 SUB-TOTAL 69,750.00
Joints Joint preparation m 1.00 12.80 62,511.87 62,511.87 Joint laying m 2.00 12.80 62,511.87 125,023.74 SUB-TOTAL 187,535.62
Track (at distance marker 'km 16,5') Mobilisation Lump sum 3,000.00 1.00 1.00 3,000.00
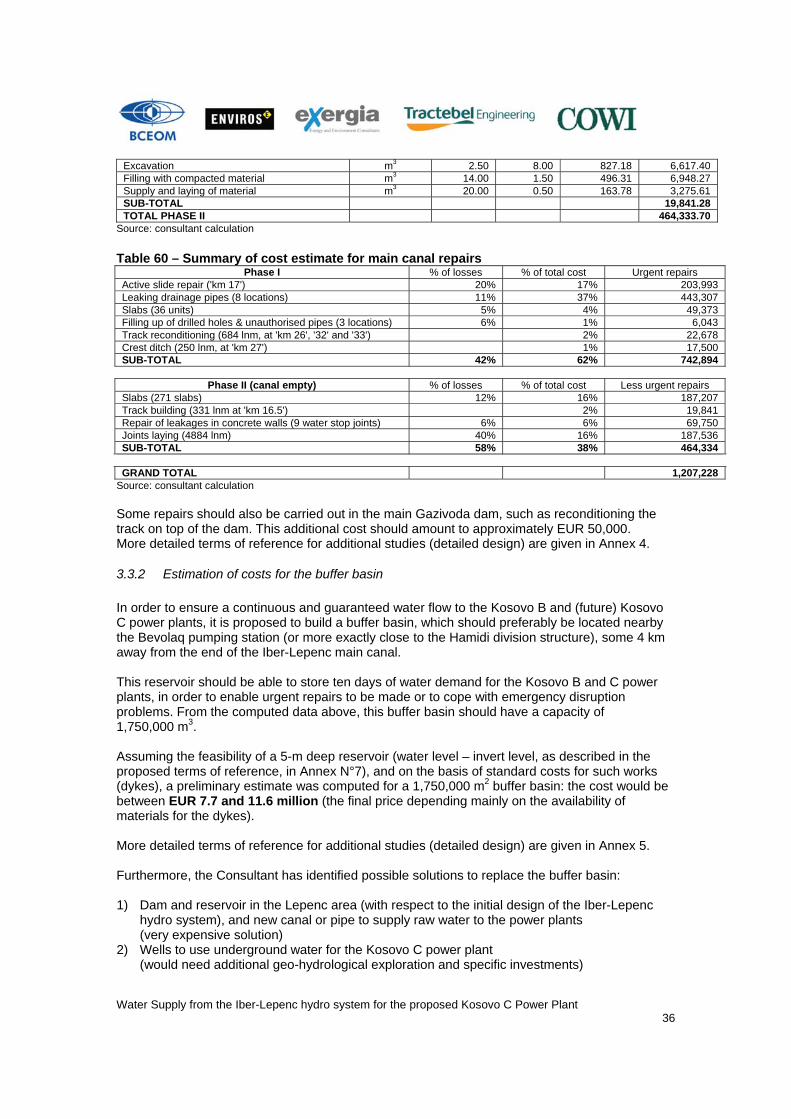
Water Supply from the Iber-Lepenc hydro system for the proposed Kosovo C Power Plant 36
Excavation m3 2.50 8.00 827.18 6,617.40 Filling with compacted material m3 14.00 1.50 496.31 6,948.27 Supply and laying of material m3 20.00 0.50 163.78 3,275.61 SUB-TOTAL 19,841.28 TOTAL PHASE II 464,333.70
Source: consultant calculation Table 60 – Summary of cost estimate for main canal repairs
Phase I % of losses % of total cost Urgent repairs Active slide repair ('km 17') 20% 17% 203,993 Leaking drainage pipes (8 locations) 11% 37% 443,307 Slabs (36 units) 5% 4% 49,373 Filling up of drilled holes & unauthorised pipes (3 locations) 6% 1% 6,043 Track reconditioning (684 lnm, at 'km 26', '32' and '33') 2% 22,678 Crest ditch (250 lnm, at 'km 27') 1% 17,500 SUB-TOTAL 42% 62% 742,894
Phase II (canal empty) % of losses % of total cost Less urgent repairs Slabs (271 slabs) 12% 16% 187,207 Track building (331 lnm at 'km 16.5') 2% 19,841 Repair of leakages in concrete walls (9 water stop joints) 6% 6% 69,750 Joints laying (4884 lnm) 40% 16% 187,536 SUB-TOTAL 58% 38% 464,334 GRAND TOTAL 1,207,228
Source: consultant calculation Some repairs should also be carried out in the main Gazivoda dam, such as reconditioning the track on top of the dam. This additional cost should amount to approximately EUR 50,000. More detailed terms of reference for additional studies (detailed design) are given in Annex 4.
3.3.2 Estimation of costs for the buffer basin In order to ensure a continuous and guaranteed water flow to the Kosovo B and (future) Kosovo C power plants, it is proposed to build a buffer basin, which should preferably be located nearby the Bevolaq pumping station (or more exactly close to the Hamidi division structure), some 4 km away from the end of the Iber-Lepenc main canal. This reservoir should be able to store ten days of water demand for the Kosovo B and C power plants, in order to enable urgent repairs to be made or to cope with emergency disruption problems. From the computed data above, this buffer basin should have a capacity of 1,750,000 m3. Assuming the feasibility of a 5-m deep reservoir (water level – invert level, as described in the proposed terms of reference, in Annex N°7), and on the basis of standard costs for such works (dykes), a preliminary estimate was computed for a 1,750,000 m2 buffer basin: the cost would be between EUR 7.7 and 11.6 million (the final price depending mainly on the availability of materials for the dykes). More detailed terms of reference for additional studies (detailed design) are given in Annex 5. Furthermore, the Consultant has identified possible solutions to replace the buffer basin: 1) Dam and reservoir in the Lepenc area (with respect to the initial design of the Iber-Lepenc
hydro system), and new canal or pipe to supply raw water to the power plants (very expensive solution)
2) Wells to use underground water for the Kosovo C power plant (would need additional geo-hydrological exploration and specific investments)

Water Supply from the Iber-Lepenc hydro system for the proposed Kosovo C Power Plant 37
3) Alternative technology (dry) for Kosovo C (this would dramatically reduces the water needs, but it depends on technical and financial solutions for the power plant).
· Finally it should be noted that the buffer basin could mitigate the consequences of several risks:
Destruction of main canal due to natural causes (e.g.: landslides); · Sabotage of main canal; · Interruption of water coming from Gazivoda Lake because of political problems; · Dramatic increase of water losses from main canal if the urgent repairs are not
completed.
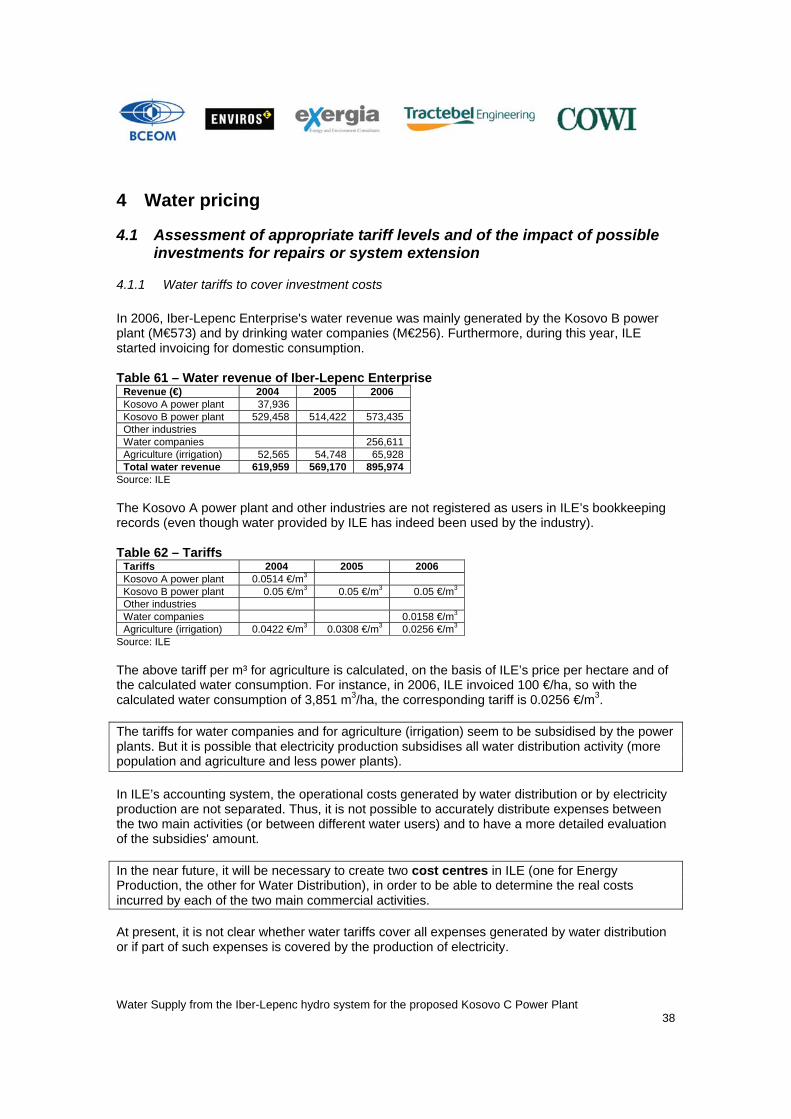
Water Supply from the Iber-Lepenc hydro system for the proposed Kosovo C Power Plant 38
4 Water pricing
4.1 Assessment of appropriate tariff levels and of the impact of possible investments for repairs or system extension
4.1.1 Water tariffs to cover investment costs In 2006, Iber-Lepenc Enterprise's water revenue was mainly generated by the Kosovo B power plant (M€573) and by drinking water companies (M€256). Furthermore, during this year, ILE started invoicing for domestic consumption. Table 61 – Water revenue of Iber-Lepenc Enterprise
Revenue (€) 2004 2005 2006 Kosovo A power plant 37,936 Kosovo B power plant 529,458 514,422 573,435 Other industries Water companies 256,611 Agriculture (irrigation) 52,565 54,748 65,928 Total water revenue 619,959 569,170 895,974
Source: ILE The Kosovo A power plant and other industries are not registered as users in ILE’s bookkeeping records (even though water provided by ILE has indeed been used by the industry). Table 62 – Tariffs
Tariffs 2004 2005 2006 Kosovo A power plant 0.0514 €/m3 Kosovo B power plant 0.05 €/m3 0.05 €/m3 0.05 €/m3 Other industries Water companies 0.0158 €/m3 Agriculture (irrigation) 0.0422 €/m3 0.0308 €/m3 0.0256 €/m3
Source: ILE The above tariff per m³ for agriculture is calculated, on the basis of ILE’s price per hectare and of the calculated water consumption. For instance, in 2006, ILE invoiced 100 €/ha, so with the calculated water consumption of 3,851 m3/ha, the corresponding tariff is 0.0256 €/m3. The tariffs for water companies and for agriculture (irrigation) seem to be subsidised by the power plants. But it is possible that electricity production subsidises all water distribution activity (more population and agriculture and less power plants). In ILE’s accounting system, the operational costs generated by water distribution or by electricity production are not separated. Thus, it is not possible to accurately distribute expenses between the two main activities (or between different water users) and to have a more detailed evaluation of the subsidies' amount. In the near future, it will be necessary to create two cost centres in ILE (one for Energy Production, the other for Water Distribution), in order to be able to determine the real costs incurred by each of the two main commercial activities. At present, it is not clear whether water tariffs cover all expenses generated by water distribution or if part of such expenses is covered by the production of electricity.
Water Supply from the Iber-Lepenc hydro system for the proposed Kosovo C Power Plant 39
The inadequate cost registration by ILE’s accounting system is even more obvious when taking into account depreciation (non-cash cost). For the three years analysed (2004 – 2006), the company has had a comfortable gross margin (1 to 1.8 million € per year), which proves that the sales revenue covered all operational costs. Even though the gross financial result was strongly negative (between 3 and 5 million €), due to the non-cash expenses (depreciation), the cash in hand was consistent (0.6 to 2.8 million €), and in the last two years, it was mainly allocated to investments and repairs. Without investments on the main canal repairs and on the buffer basin, the Kosovo C power plant could difficultly be supplied with water, and the losses from main canal would certainly increase ( With these (highly probable) assumptions, if ILE wants to have a minimum net profit, the tariffs should be as follows:
⇒ if water tariff remains at 0.05 €/m3: 74.85 €/MWh for electricity; ⇒ if electricity tariff remains at 21.51 €/MWh: 0.27 €/m3 for water; ⇒ if both tariffs change: 0.13 €/m3 for water and 54.75 €/MWh for electricity.
None of the above tariff changes would be acceptable for industrial users or for the energy market (assuming the water tariffs for population and agriculture remain unchanged). If the calculated and non-distributed depreciation of fixed assets is included in the tariffs, the resulting tariffs increase. The proposed cost centres should separate not only operational expenses, but also non-cash costs like depreciation. The current level of depreciation, based on a bookkeeping revaluation, seems to be fictional. (For a more detailed description of the situation in this possible case, see attached Excel file named 'Model ILE without investments') To avoid worsening this situation, the investment costs should be allocated only to the activity affected by the investment. The additional costs, induced by the investments in the main canal and in the buffer basin (if the owner is ILE5), will affect only the tariff for non-domestic users (power plants and other industries). These users are directly involved in the investment, as they will benefit from it. The tariffs for domestic users and farmers are assumed to remain unchanged.
4.1.2 Tariff increases due to the main canal repairs Overall repair works to the main canal are split in two phases: Phase I – cost: 742,894 € (could be completed in 2008) Phase II – cost: 464,334 € (could be finished in 2010).
5 The proposed buffer basin can be owned by Iber-Lepenc Enterprise or by the Kosovo C power plant. The second solution, which does not use ILE’s capital (the Kosovo C investment may include the cost of the reservoir), will not affect water tariffs. But in this case, the reservoir must only be used for Kosovo C. The first solution involves capital expenditure for ILE, which in turn imposes a cost coverage by tariff increases, but it would enable to use the reservoir for several other purposes (industry, agriculture).
Water Supply from the Iber-Lepenc hydro system for the proposed Kosovo C Power Plant 40
To start Phase II, it is necessary to be able to stop water distribution for several days. This is why the buffer basin has to be finished by the end of 2009. The additional revenue (obtained from the tariff increases) must cover the total cost of repairs in 25 years. ⇒ If Phase I is financed by a grant, the total investment cost is equal to the depreciation of the
new fixed assets over 25 years. The tariff increase needed in this case is 0.00052 €/m3. ⇒ If Phase I is financed by ILE's own capital, the total investment cost is equal to the
depreciation of the new fixed assets plus the company’s expenses for the repairs. The tariff increase needed here is 0.00114 €/m3.
⇒ If Phase II is financed by a grant, the total investment cost is equal to the depreciation of the
new fixed assets over 25 years. The tariff increase needed in this case is 0.00070 €/m3. ⇒ If Phase II is financed by ILE's own capital, the total investment cost is equal to the
depreciation of the new fixed assets plus the company’s expenses for the repairs. The tariff increase needed here is 0.00109 €/m3.
In conclusion, to cover all the costs related to the main canal repairs, the tariff of water delivered to the industry (including power plants) must increase by a value comprised between 0.00112 €/m3 (if the investment is financed by a grant) and 0.00223 €/m3 (if ILE self-finances the repairs). The price increase is not high, and the final tariff for industrial water users would be close to 0.051 €/m3 (against 0.050 €/m3 in 2006).
4.1.3 Tariff increases due to the construction of the buffer basin If the buffer basin is owned by ILE, the tariff increases must cover the total investment costs (own capital use, loan cost and depreciation). Assuming the reservoir is constructed in two years (2008 - 2009) and the capital expenditure amounts to some 10 million €, the increases in water tariffs for industrial clients must be as follows: ⇒ If the investment is financed by ILE's own capital: The tariff increase required to cover the total cost of the investment is 0.02039 €/m3. But this increase is not enough to guarantee positive cash in hand in 2008 and 2009. To restore ILE’s capacity to generate cash for investment, the tariffs would have to increase by 0.1735 €/m3. This case is not acceptable since it leads to a too high tariff increase. ⇒ If the investment is financed for 50% by a loan and for 50 % by ILE's own capital: The tariff increase required to cover the total cost of the investment is 0.02399 €/m3. This increase would enable ILE to guarantee positive cash in hand over the next 25 years. The loan conditions taken into account are the following: loan duration of 15 years, grace period of 3 years, 7% interest, commitment fee of 1%, front-end fee of 1%.
Water Supply from the Iber-Lepenc hydro system for the proposed Kosovo C Power Plant 41
The final tariff for industrial clients would be around 0.08 €/m3, while the tariff for domestic users and irrigation would remain unchanged (100 €/ha and 0,033 €/m3). The difference between Variants I and II of the Kosovo C construction schedule is insignificant as regards tariffs increases induced by the investments for the main canal repairs or the buffer basin. ILE is able to finance the investment for the buffer basin, using a loan to cover the gap in cash for 2008 and 2009 generated by this capital expenditure. A possible optimal investment scenario is thus: Repairs to the main canal – Phase I – 2008: financed by a grant Repairs to the main canal – Phase II – 2010: financed by ILE’s own capital Construction of a buffer basin: financed for 50% by a loan and for 50% by ILE’s own capital. The financial forecasts for Iber-Lepenc Enterprise in this scenario are shown in Annex 1.
4.2 What are the priorities between all customer groups? The Iber-Lepenc hydro system has four main types of customers:
Households; Irrigated farms; Industries (other than electric power production); Hydroelectric power plants.
A simplified prioritisation of the customers is based several criteria: 1. Impact of water on the normal activity (or life) of the user; 2. Relative weight of the main canal's water flow used by the various customers; 3. Availability of water sources other than the Iber-Lepenc hydro system for the customer; 4. Impact of water shortages on the overall Kosovo community; 5. Foreseen evolution of consumption; 6. Environmental consequences of water shortages; 7. Strictness of water quality standards imposed by the user; 8. Foreseen problems regarding the payment of invoices. The most important criteria are seen to be the environmental consequences (6) and the impact on the overall Kosovo community (4) of water shortages, because of general implications and of possible chain reactions. They receive a weight of 10. The impact on the user's normal activity (1) is also given a 10 weight because the customer's decision to buy water is precisely to be able to have a normal activity. The fact that other sources than the Iber-Lepenc hydro system, are able to supply water to the customer (3) can be abandoned (weight: 8). Problems in the payment of invoices (8) are a criterion which has an impact only on the financial equilibrium of Iber-Lepenc Enterprise and not other entities (weight: 7). The foreseen evolution of consumption (5) is not a critical issue because of the water reserve in the system (weight: 6).
Water Supply from the Iber-Lepenc hydro system for the proposed Kosovo C Power Plant 42
Finally, the less important criteria are the strictness of water quality standards imposed by the customers (7), because the Iber-Lepenc hydro system delivers industrial water which does not have to meet special specifications, and the relative weight of consumption (2), because all users have equal rights (weight: 5). The multi-criteria prioritisation is detailed in the table below. Table 63 – Multi-criteria prioritisation of the water users Grades (see explanation below)
Criterion Weight Households Irrigation Industries Kosovo B Kosovo C 1 10 10 6 5 10 10 2 5 5 7 8 7 10 3 8 10 8 4 9 10 4 10 10 6 4 8 10 5 6 10 10 6 3 3 6 10 10 3 3 3 8 7 5 10 10 8 5 3 8 7 3 4 6 10 10
Grade x Weight Criterion Weight Households Irrigation Industries Kosovo B Kosovo C
1 10 100 60 50 100 100 2 5 25 35 40 35 50 3 8 80 64 32 72 80 4 10 100 60 40 80 100 5 6 60 60 36 18 18 6 10 100 30 30 30 80 7 5 50 50 40 25 15 8 7 21 28 42 70 70
Total 536 387 310 430 513 Rank I IV V III II
Source: consulting team Explanations of grades:
Criterion 1: Impact of water on the normal activity (or life) of the user The main negative impact of water shortages is for the population (living without water in a block of flats is impossible) and for the power plants (a cooling device designed to work with water will not work without water) – the grade is thus 10 for these three users. Industries may sometimes operate with a low water consumption => grade 5. Agriculture without irrigation is possible, though not easy => grade 6. Criterion 2: Relative weight of the main canal's water flow used by the various customers The main user foreseen will be the Kosovo C power plant => grade 10. The lowest consumption will be made by the households => grade 5. The other users are rated according to their consumption. Criterion 3: Availability of water sources other than the Iber-Lepenc hydro system for the customer Some users will have opportunities to find other water sources to meet their needs, but not Kosovo C and the urban households => grade 10. Industries may drill their own wells to pump underground water => grade 4. Farmers may use rivers or wells (that can be built) => grade 8. Even Kosovo B, which has a relatively low water consumption, could take part of its water from the Stinica river (this would need additional investments) => grade 9. Criterion 4: Impact of water shortages on the overall Kosovo community If part of the population has no water, the social and political consequences will be serious and cannot be overestimated => grade 10.
Water Supply from the Iber-Lepenc hydro system for the proposed Kosovo C Power Plant 43
If Kosovo C is not built due to a lack of water, this will have an impact on the country as a whole because of problems related to energy supply => grade 10. All population is affected if Kosovo B reduces its production all population is affected => grade 8. Water shortages in agriculture and in the industry are not so important for overall community => grades 6 and 4, respectively. Criterion 5: Foreseen evolution of consumption The water consumption of households and irrigated land is expected to increase steadily => grade 10. A less marked trend is foreseen for the industry => grade 6. As for the power plants, their consumption should remain constant => grade 3. Criterion 6: Environmental consequences of water shortages The lack of water would have important environmental consequences in the case of households (quite obvious) => grade 10. If Kosovo C does not produce enough energy, the other more polluting power plants will increase their production => grade 8. Regarding the other users (agriculture, industry, other power plants), a shortage in the water supplied by the Iber-Lepenc hydro system would not have huge environmental consequences related to the users => grade 3. Criterion 7: Strictness of water quality standards imposed by the user Stricter water specifications are required for Kosovo C => grade 3. Water characteristics are less critical if the drinking water network has a treatment facility and for irrigation => grade 10. Criterion 8: Foreseen problems regarding the payment of invoices. Historically, Kosovo B has always been a good bill payer, and Kosovo C should be the same => grade 10. The worst customers are the Municipal Water Companies, and no changes are foreseen in the near or medium future => grade 3. The above table, which ranks the users according to the results of our multi-criteria prioritisation, shows that the most important thing is to supply enough water to the Kosovo C power plant and to the households. The Kosovo B power plant, the irrigation system and the other industries would rank second in importance. Because the ranking of Kosovo C (but also B) is high in the prioritisation, it is essential to have a large water reserve for these users. Therefore, the Consultant suggests building, at the end of the main canal, a buffer basin containing enough water to cover approximately 10 days of Kosovo C demand. Such a buffer basin would be used to ensure necessary water supply in the event of a total interruption of the canal's flow, due either to scheduled repairs or to contingent events (natural or human-produced). The main canal, located south of the Mitrovica secondary canal, could be repaired without causing problems to most households served, since they are located to the north. The northern part of the main canal may be also closed for a few days, thanks to the reserves in the drinking water network. And Prishtina has its own accumulation lakes which work as buffer basins.

Water Supply from the Iber-Lepenc hydro system for the proposed Kosovo C Power Plant 44
This prioritisation may seem strange for a hydro system which has been designed mainly for irrigation. But over time, the situation has changed, the system has deteriorated, and the social and economic priorities are no longer the same. However, the modification of the hydro system's purpose must be approved by the competent Kosovo authorities.
4.3 Can these priorities be reflected only through a pricing mechanism or is continuing cross-subsidy justified and/or practical?
As long as the Iber-Lepenc Enterprise accounting system does not dissociate the costs related to both water distribution and energy production, it will not be possible to have a clear picture regarding cross-subsidy. A first and urgent task would thus be to create two cost centres (water distribution and energy production), allocating the operational expenses and the depreciation that are specific to each activity. Even so, it will not be easy to calculate the costs associated with every user, because of common assets and works. Furthermore, all operational costs for water distribution may be divided by the individual consumption of each customer in order to determine a tariff base. But the costs for the users located at the end of the canal should normally be higher than for those at the start of the canal. Electricity used in pumping stations generates costs, mainly for irrigation, but also for the water used by households in Prishtina. As described above, the Consultant suggests increasing the current tariffs only for the power plants and for the industry in order to take into account the costs related to the proposed investments. The Kosovo C and Kosovo B power plants will be the main beneficiaries of these investments – indeed, as discussed above, water supply to these plants would not be reliable without the works described). And on the other hand, increasing the tariffs for households or for irrigation could create social problems. The financial forecasts for Iber-Lepenc Enterprise for this scenario are shown in Annex 1. As an additional measure, the Consultant also suggests to review the contracts between the supplier (ILE) and the users (mostly the power plants) so as to include additional legal clauses, and in particular:
• A minimum guaranteed daily (or hourly?) water supply (value and measurement method to be defined);
• Penalties in case of water supply interruption (during a given period).

Water Supply from the Iber-Lepenc hydro system for the proposed Kosovo C Power Plant 45
5 ANNEXES
Annex 1 – Financial Forecasts of Iber-Lepenc Enterprise
Annex 2 – Sensitivity Analysis
Annex 3 – Canal status forms
Annex 4 – Proposed Terms of Reference for urgent canal repairs.
Annex 5 – Proposed Terms of Reference for buffer basin detailed design.

Water Supply from the Iber-Lepenc hydro system for the proposed Kosovo C Power Plant 46
5.1 Annex I – Financial Forecasts – Variant I of Kosovo C construction Profit & loss account (€) 2007 2008 2009 2010 2011 2012 2013 2014 2015 2016 Kosovo A power plant 119,837 179,201 181,068 182,935 184,801 186,668 186,668 186,668 186,668 186,668 Kosovo B power plant 579,536 1,120,007 1,131,674 1,143,341 1,155,008 1,166,674 1,166,674 1,166,674 1,166,674 1,166,674 Other industries 448,003 905,339 1,372,009 1,848,012 2,333,349 2,333,349 2,333,349 2,333,349 2,333,349 Water companies 217,601 219,891 222,182 224,473 226,763 229,054 229,054 229,054 229,054 229,054 Agriculture (irrigation) 65,000 220,833 220,833 220,833 220,833 220,833 220,833 220,833 220,833 220,833 Kosovo C power plant 886,672 1,773,345 1,773,345 2,660,017 3,546,690 Revenue from Water Distribution 981,974 2,187,936 2,661,097 3,143,590 3,635,417 5,023,250 5,909,923 5,909,923 6,796,595 7,683,268 Hydro power plant 2,003,469 2,003,469 2,003,469 2,003,469 2,003,469 2,003,469 2,003,469 2,003,469 2,003,469 2,003,469 Revenue from Core Business 2,985,443 4,191,405 4,664,565 5,147,059 5,638,886 7,026,719 7,913,391 7,913,391 8,800,064 9,686,736 Other revenue 173,010 173,010 173,010 173,010 173,010 173,010 173,010 173,010 173,010 173,010 Total Revenue 3,158,453 4,364,415 4,837,575 5,320,069 5,811,896 7,199,729 8,086,401 8,086,401 8,973,074 9,859,746 Labour 1,635,612 1,635,612 1,635,612 1,635,612 1,635,612 1,635,612 1,635,612 1,635,612 1,635,612 1,635,612 Maintenance & Repairs 86,230 86,230 462,231 478,483 478,483 478,483 478,483 478,483 478,483 478,483 Electricity 80,502 113,394 136,486 158,827 180,417 231,656 262,057 262,057 292,457 322,858 Materials 32,382 45,613 54,902 63,889 72,573 93,184 105,413 105,413 117,642 129,870 Bad Debts Expenses 419,140 466,457 514,706 563,889 702,672 791,339 791,339 880,006 968,674 Other Operational Expenses 232,056 232,056 232,056 232,056 232,056 232,056 232,056 232,056 232,056 232,056 Total Operational Expenses 2,066,782 2,532,046 2,987,744 3,083,573 3,163,030 3,373,663 3,504,960 3,504,960 3,636,257 3,767,553 Gross Margin 1,091,671 1,832,369 1,849,831 2,236,496 2,648,866 3,826,065 4,581,441 4,581,441 5,336,817 6,092,193 Depreciation 6,090,230 6,090,230 6,627,375 6,650,591 6,650,591 6,650,591 6,650,591 6,650,591 6,601,520 6,482,483 Grant Amortisation 34,173 34,173 34,173 34,173 34,173 34,173 34,173 34,173 EBIT -4,998,559 -4,257,861 -4,743,371 -4,379,922 -3,967,552 -2,790,353 -2,034,977 -2,034,977 -1,230,530 -356,117 Interest 186,875 301,875 402,500 385,729 352,188 318,646 285,104 251,563 218,021 EBT -4,998,559 -4,444,736 -5,045,246 -4,782,422 -4,353,281 -3,142,540 -2,353,623 -2,320,081 -1,482,092 -574,138 Income Tax Net Profit/Loss -4,998,559 -4,444,736 -5,045,246 -4,782,422 -4,353,281 -3,142,540 -2,353,623 -2,320,081 -1,482,092 -574,138
Source: Consultant model (Model ILE xls) Iber-Lepenc Enterprise will have financial losses until 2016, when the Kosovo C power plant will start working at full capacity. The historical depreciation of fixed assets (6,090,230 €) strongly affects the bottom line (indeed, the positive gross margin, year after year, demonstrates that ILE operations are efficient). At the same time, this depreciation generates important cash in hand.
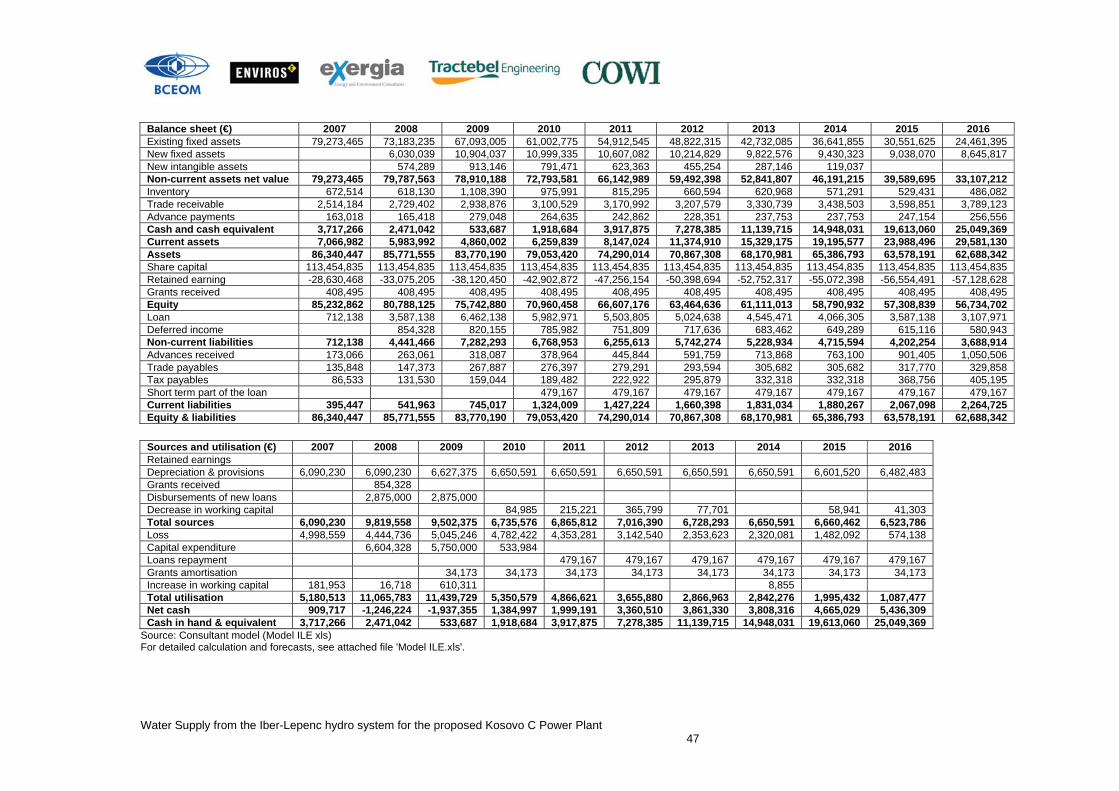
Water Supply from the Iber-Lepenc hydro system for the proposed Kosovo C Power Plant 47
Balance sheet (€) 2007 2008 2009 2010 2011 2012 2013 2014 2015 2016 Existing fixed assets 79,273,465 73,183,235 67,093,005 61,002,775 54,912,545 48,822,315 42,732,085 36,641,855 30,551,625 24,461,395 New fixed assets 6,030,039 10,904,037 10,999,335 10,607,082 10,214,829 9,822,576 9,430,323 9,038,070 8,645,817 New intangible assets 574,289 913,146 791,471 623,363 455,254 287,146 119,037 Non-current assets net value 79,273,465 79,787,563 78,910,188 72,793,581 66,142,989 59,492,398 52,841,807 46,191,215 39,589,695 33,107,212 Inventory 672,514 618,130 1,108,390 975,991 815,295 660,594 620,968 571,291 529,431 486,082 Trade receivable 2,514,184 2,729,402 2,938,876 3,100,529 3,170,992 3,207,579 3,330,739 3,438,503 3,598,851 3,789,123 Advance payments 163,018 165,418 279,048 264,635 242,862 228,351 237,753 237,753 247,154 256,556 Cash and cash equivalent 3,717,266 2,471,042 533,687 1,918,684 3,917,875 7,278,385 11,139,715 14,948,031 19,613,060 25,049,369 Current assets 7,066,982 5,983,992 4,860,002 6,259,839 8,147,024 11,374,910 15,329,175 19,195,577 23,988,496 29,581,130 Assets 86,340,447 85,771,555 83,770,190 79,053,420 74,290,014 70,867,308 68,170,981 65,386,793 63,578,191 62,688,342 Share capital 113,454,835 113,454,835 113,454,835 113,454,835 113,454,835 113,454,835 113,454,835 113,454,835 113,454,835 113,454,835 Retained earning -28,630,468 -33,075,205 -38,120,450 -42,902,872 -47,256,154 -50,398,694 -52,752,317 -55,072,398 -56,554,491 -57,128,628 Grants received 408,495 408,495 408,495 408,495 408,495 408,495 408,495 408,495 408,495 408,495 Equity 85,232,862 80,788,125 75,742,880 70,960,458 66,607,176 63,464,636 61,111,013 58,790,932 57,308,839 56,734,702 Loan 712,138 3,587,138 6,462,138 5,982,971 5,503,805 5,024,638 4,545,471 4,066,305 3,587,138 3,107,971 Deferred income 854,328 820,155 785,982 751,809 717,636 683,462 649,289 615,116 580,943 Non-current liabilities 712,138 4,441,466 7,282,293 6,768,953 6,255,613 5,742,274 5,228,934 4,715,594 4,202,254 3,688,914 Advances received 173,066 263,061 318,087 378,964 445,844 591,759 713,868 763,100 901,405 1,050,506 Trade payables 135,848 147,373 267,887 276,397 279,291 293,594 305,682 305,682 317,770 329,858 Tax payables 86,533 131,530 159,044 189,482 222,922 295,879 332,318 332,318 368,756 405,195 Short term part of the loan 479,167 479,167 479,167 479,167 479,167 479,167 479,167 Current liabilities 395,447 541,963 745,017 1,324,009 1,427,224 1,660,398 1,831,034 1,880,267 2,067,098 2,264,725 Equity & liabilities 86,340,447 85,771,555 83,770,190 79,053,420 74,290,014 70,867,308 68,170,981 65,386,793 63,578,191 62,688,342
Sources and utilisation (€) 2007 2008 2009 2010 2011 2012 2013 2014 2015 2016 Retained earnings Depreciation & provisions 6,090,230 6,090,230 6,627,375 6,650,591 6,650,591 6,650,591 6,650,591 6,650,591 6,601,520 6,482,483 Grants received 854,328 Disbursements of new loans 2,875,000 2,875,000 Decrease in working capital 84,985 215,221 365,799 77,701 58,941 41,303 Total sources 6,090,230 9,819,558 9,502,375 6,735,576 6,865,812 7,016,390 6,728,293 6,650,591 6,660,462 6,523,786 Loss 4,998,559 4,444,736 5,045,246 4,782,422 4,353,281 3,142,540 2,353,623 2,320,081 1,482,092 574,138 Capital expenditure 6,604,328 5,750,000 533,984 Loans repayment 479,167 479,167 479,167 479,167 479,167 479,167 Grants amortisation 34,173 34,173 34,173 34,173 34,173 34,173 34,173 34,173 Increase in working capital 181,953 16,718 610,311 8,855 Total utilisation 5,180,513 11,065,783 11,439,729 5,350,579 4,866,621 3,655,880 2,866,963 2,842,276 1,995,432 1,087,477 Net cash 909,717 -1,246,224 -1,937,355 1,384,997 1,999,191 3,360,510 3,861,330 3,808,316 4,665,029 5,436,309 Cash in hand & equivalent 3,717,266 2,471,042 533,687 1,918,684 3,917,875 7,278,385 11,139,715 14,948,031 19,613,060 25,049,369
Source: Consultant model (Model ILE xls) For detailed calculation and forecasts, see attached file 'Model ILE.xls'.
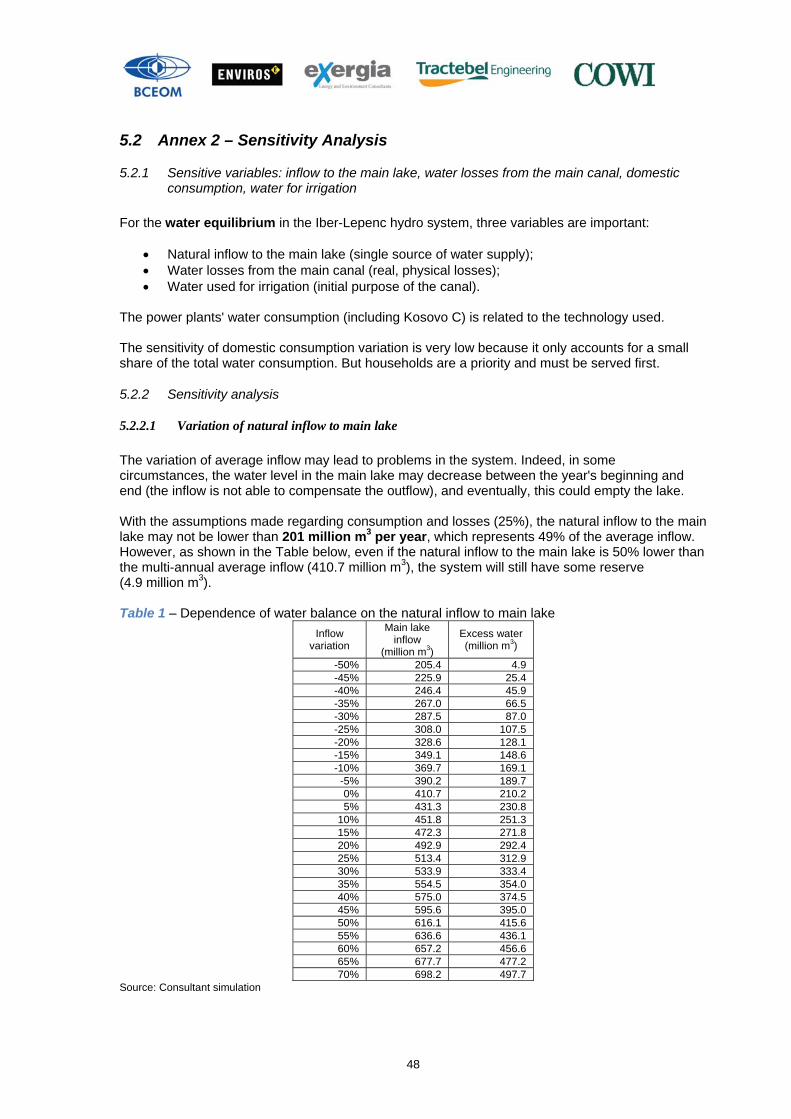
48
5.2 Annex 2 – Sensitivity Analysis
5.2.1 Sensitive variables: inflow to the main lake, water losses from the main canal, domestic consumption, water for irrigation
For the water equilibrium in the Iber-Lepenc hydro system, three variables are important:
• Natural inflow to the main lake (single source of water supply); • Water losses from the main canal (real, physical losses); • Water used for irrigation (initial purpose of the canal).
The power plants' water consumption (including Kosovo C) is related to the technology used. The sensitivity of domestic consumption variation is very low because it only accounts for a small share of the total water consumption. But households are a priority and must be served first.
5.2.2 Sensitivity analysis
5.2.2.1 Variation of natural inflow to main lake The variation of average inflow may lead to problems in the system. Indeed, in some circumstances, the water level in the main lake may decrease between the year's beginning and end (the inflow is not able to compensate the outflow), and eventually, this could empty the lake. With the assumptions made regarding consumption and losses (25%), the natural inflow to the main lake may not be lower than 201 million m3 per year, which represents 49% of the average inflow. However, as shown in the Table below, even if the natural inflow to the main lake is 50% lower than the multi-annual average inflow (410.7 million m3), the system will still have some reserve (4.9 million m3). Table 1 – Dependence of water balance on the natural inflow to main lake
Inflow variation
Main lake inflow
(million m3)
Excess water (million m3)
-50% 205.4 4.9 -45% 225.9 25.4 -40% 246.4 45.9 -35% 267.0 66.5 -30% 287.5 87.0 -25% 308.0 107.5 -20% 328.6 128.1 -15% 349.1 148.6 -10% 369.7 169.1
-5% 390.2 189.7 0% 410.7 210.2 5% 431.3 230.8
10% 451.8 251.3 15% 472.3 271.8 20% 492.9 292.4 25% 513.4 312.9 30% 533.9 333.4 35% 554.5 354.0 40% 575.0 374.5 45% 595.6 395.0 50% 616.1 415.6 55% 636.6 436.1 60% 657.2 456.6 65% 677.7 477.2 70% 698.2 497.7
Source: Consultant simulation
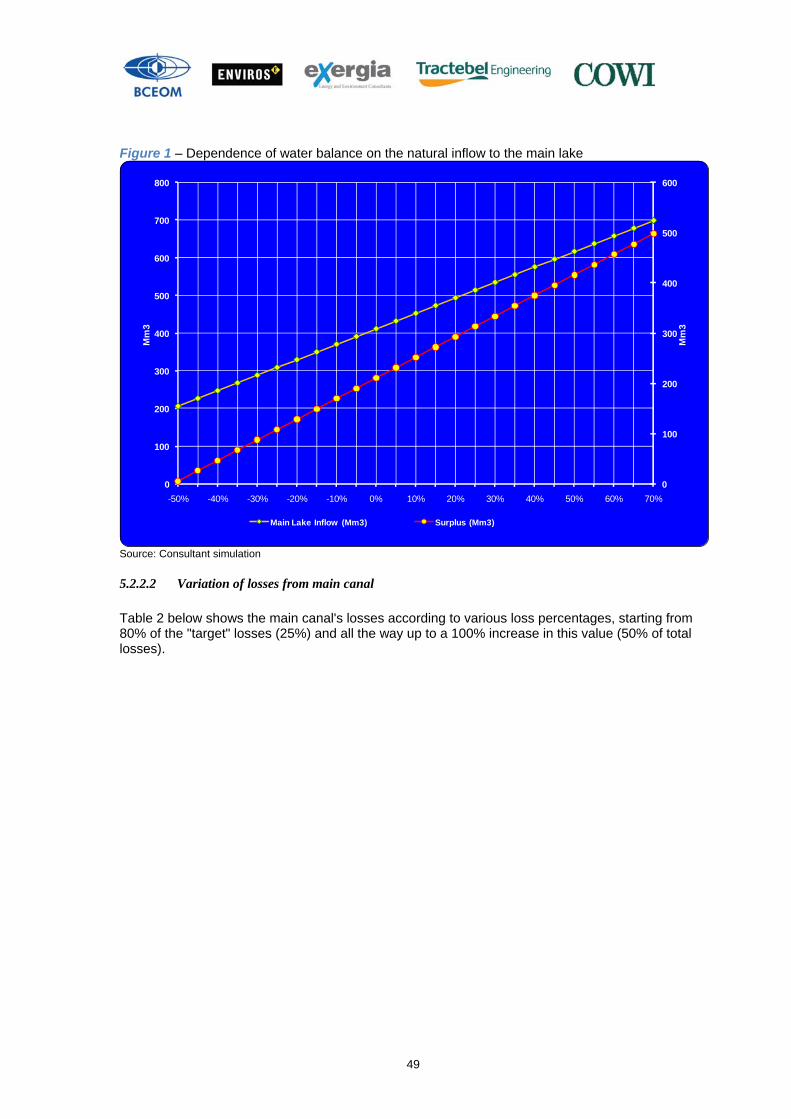
49
Figure 1 – Dependence of water balance on the natural inflow to the main lake
0
100
200
300
400
500
600
0
100
200
300
400
500
600
700
800
-50% -40% -30% -20% -10% 0% 10% 20% 30% 40% 50% 60% 70%
Mm
3
Mm
3
Main Lake Inflow (Mm3) Surplus (Mm3)
Source: Consultant simulation
5.2.2.2 Variation of losses from main canal Table 2 below shows the main canal's losses according to various loss percentages, starting from 80% of the "target" losses (25%) and all the way up to a 100% increase in this value (50% of total losses).
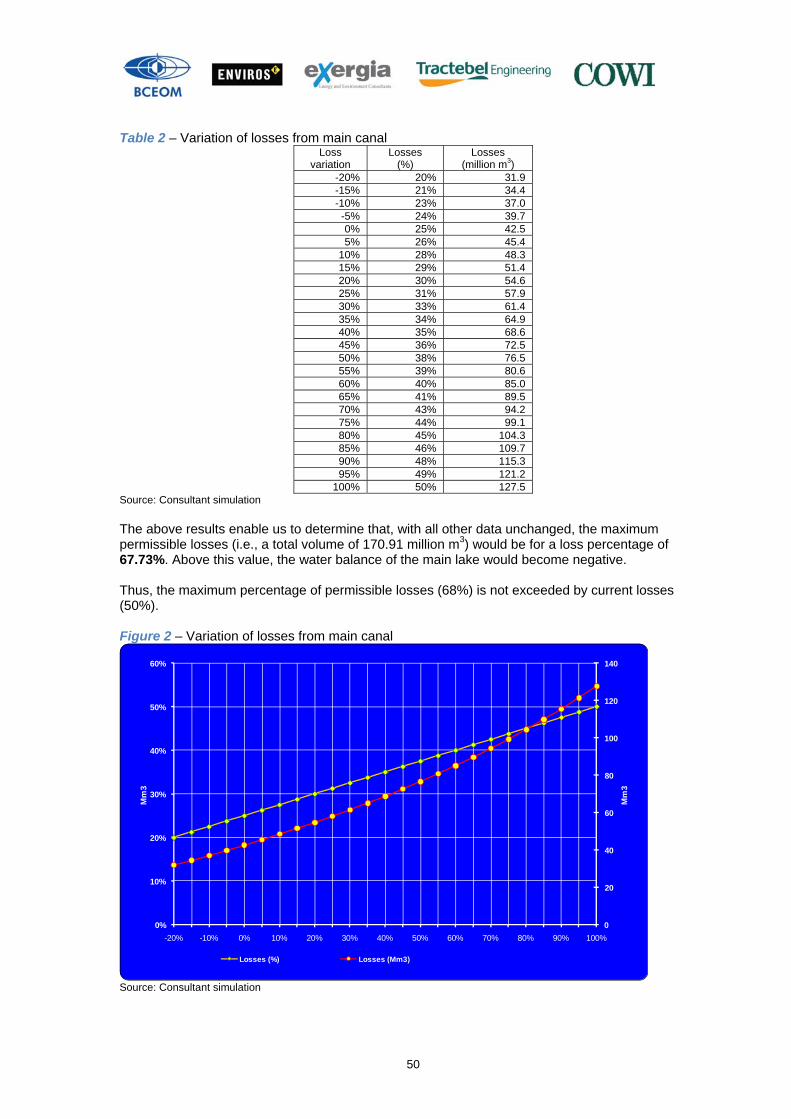
50
Table 2 – Variation of losses from main canal
Loss variation
Losses (%)
Losses (million m3)
-20% 20% 31.9 -15% 21% 34.4 -10% 23% 37.0
-5% 24% 39.7 0% 25% 42.5 5% 26% 45.4
10% 28% 48.3 15% 29% 51.4 20% 30% 54.6 25% 31% 57.9 30% 33% 61.4 35% 34% 64.9 40% 35% 68.6 45% 36% 72.5 50% 38% 76.5 55% 39% 80.6 60% 40% 85.0 65% 41% 89.5 70% 43% 94.2 75% 44% 99.1 80% 45% 104.3 85% 46% 109.7 90% 48% 115.3 95% 49% 121.2
100% 50% 127.5 Source: Consultant simulation The above results enable us to determine that, with all other data unchanged, the maximum permissible losses (i.e., a total volume of 170.91 million m3) would be for a loss percentage of 67.73%. Above this value, the water balance of the main lake would become negative. Thus, the maximum percentage of permissible losses (68%) is not exceeded by current losses (50%). Figure 2 – Variation of losses from main canal
0
20
40
60
80
100
120
140
0%
10%
20%
30%
40%
50%
60%
-20% -10% 0% 10% 20% 30% 40% 50% 60% 70% 80% 90% 100%
Mm
3
Mm
3
Losses (%) Losses (Mm3)
Source: Consultant simulation
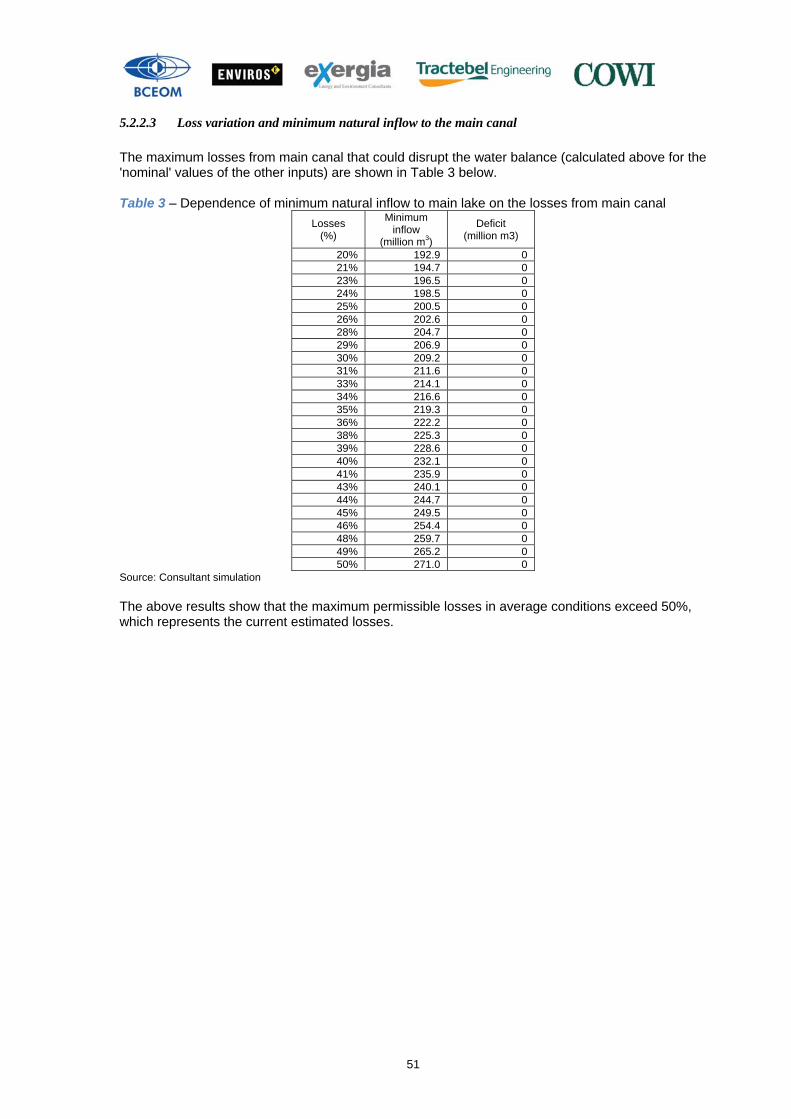
51
5.2.2.3 Loss variation and minimum natural inflow to the main canal The maximum losses from main canal that could disrupt the water balance (calculated above for the 'nominal' values of the other inputs) are shown in Table 3 below. Table 3 – Dependence of minimum natural inflow to main lake on the losses from main canal
Losses (%)
Minimum inflow
(million m3)
Deficit (million m3)
20% 192.9 0 21% 194.7 0 23% 196.5 0 24% 198.5 0 25% 200.5 0 26% 202.6 0 28% 204.7 0 29% 206.9 0 30% 209.2 0 31% 211.6 0 33% 214.1 0 34% 216.6 0 35% 219.3 0 36% 222.2 0 38% 225.3 0 39% 228.6 0 40% 232.1 0 41% 235.9 0 43% 240.1 0 44% 244.7 0 45% 249.5 0 46% 254.4 0 48% 259.7 0 49% 265.2 0 50% 271.0 0
Source: Consultant simulation The above results show that the maximum permissible losses in average conditions exceed 50%, which represents the current estimated losses.
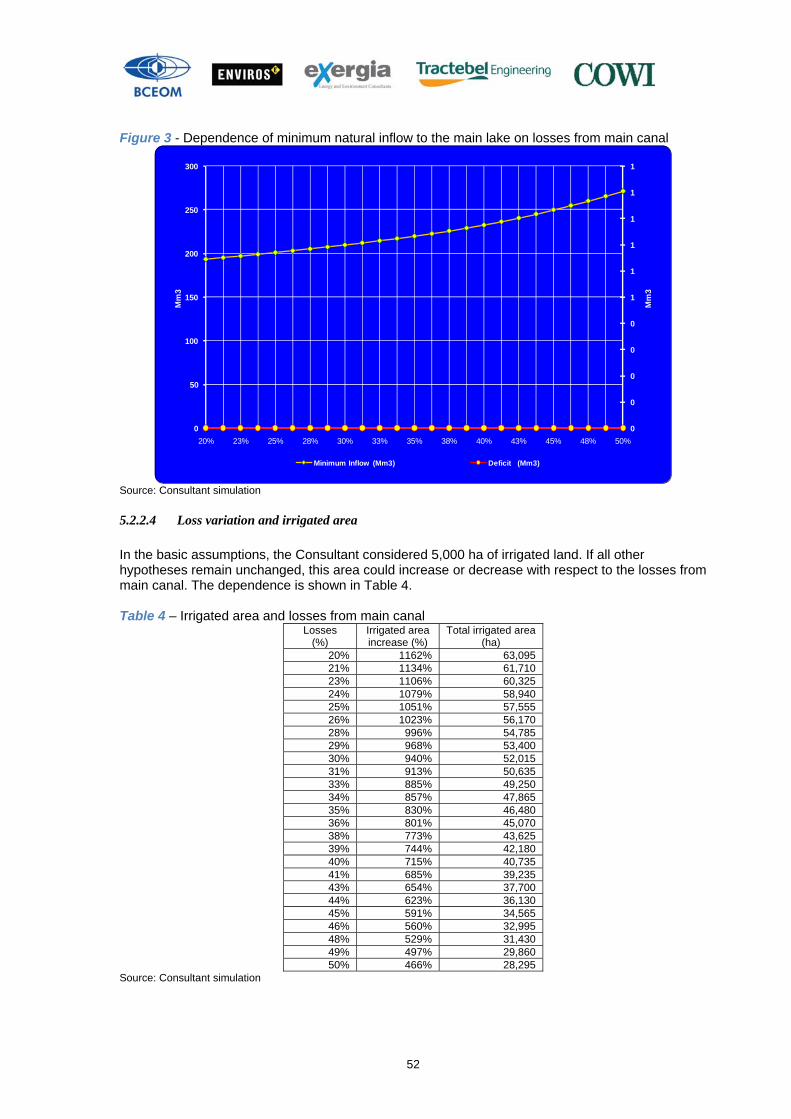
52
Figure 3 - Dependence of minimum natural inflow to the main lake on losses from main canal
0
0
0
0
0
1
1
1
1
1
1
0
50
100
150
200
250
300
20% 23% 25% 28% 30% 33% 35% 38% 40% 43% 45% 48% 50%
Mm
3
Mm
3
Minimum Inflow (Mm3) Deficit (Mm3)
Source: Consultant simulation
5.2.2.4 Loss variation and irrigated area In the basic assumptions, the Consultant considered 5,000 ha of irrigated land. If all other hypotheses remain unchanged, this area could increase or decrease with respect to the losses from main canal. The dependence is shown in Table 4. Table 4 – Irrigated area and losses from main canal
Losses (%)
Irrigated area increase (%)
Total irrigated area (ha)
20% 1162% 63,095 21% 1134% 61,710 23% 1106% 60,325 24% 1079% 58,940 25% 1051% 57,555 26% 1023% 56,170 28% 996% 54,785 29% 968% 53,400 30% 940% 52,015 31% 913% 50,635 33% 885% 49,250 34% 857% 47,865 35% 830% 46,480 36% 801% 45,070 38% 773% 43,625 39% 744% 42,180 40% 715% 40,735 41% 685% 39,235 43% 654% 37,700 44% 623% 36,130 45% 591% 34,565 46% 560% 32,995 48% 529% 31,430 49% 497% 29,860 50% 466% 28,295
Source: Consultant simulation

53
Even if the losses amount to 50%, the irrigated area could increase to 28,295 ha, and the main canal would still use 62% of its design capacity.
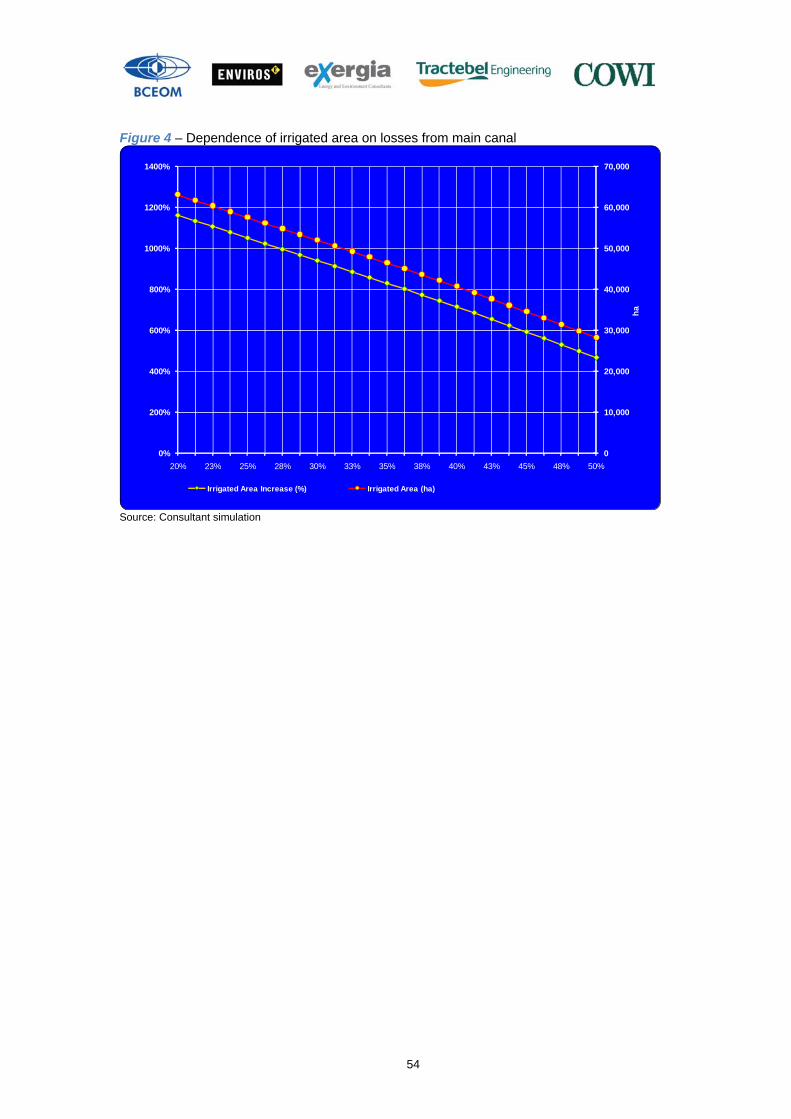
54
Figure 4 – Dependence of irrigated area on losses from main canal
0
10,000
20,000
30,000
40,000
50,000
60,000
70,000
0%
200%
400%
600%
800%
1000%
1200%
1400%
20% 23% 25% 28% 30% 33% 35% 38% 40% 43% 45% 48% 50%
ha
Irrigated Area Increase (%) Irrigated Area (ha)
Source: Consultant simulation

55
5.3 Annex 3 – Canal status forms This annex is included in the attached CD: Annex 3 – Canal status forms folder
56
5.4 Annex 4 – Proposed Terms of Reference for urgent canal repairs (The pictures related to the urgent repairs are included in the attached CD, as Annex 4 – Pictures specific terms of reference repairs)
5.4.1 BACKGROUND The Iber-Lepenc hydro system is one of three hydro systems in Kosovo:
- the Iber section was completed in 1985 as part of multi-purpose project intended to provide water for hydro-electric, domestic, industrial and irrigation uses;
- the Lepenc section has not yet been constructed. The system is administered by Iber-Lepenc Enterprise (ILE), a publicly owned enterprise (PoE) as defined by the Kosovo Trust Agency (KTA), its temporary administrator. KTA is in the process of transforming ILE into an incorporated water management company, anticipating Kosovo’s likely autonomy and membership of the EU. In November 2007, a specific study has been undertaken for the European Agency for Reconstruction under request N° 04KOS 03/01/04. Its objective was to evaluate the hydro system, and the Water Availability Assessment concluded, inter alia, that in order to guarantee a continuous and minimum water flow for the canal's users, the following should be carried out:
• Urgent repairs to reduce the high rate of losses (50%) from the main canal (connecting Pridvoricë and Obiliq) to an acceptable level and to prevent further major damage to the hydro system;
• Construction of a buffer basin which would both guarantee a continuous flow right to the end of the canal and enable ILE to carry out major repairs to the canal by emptying it (entirely or by stretches);
• Additional repairs ('Phase II') requiring the canal to be emptied (after construction of the buffer basin).
5.4.2 DESCRIPTION OF THE ASSIGNMENT
Overall objective The overall objective is to reduce the losses from this 22 year old canal to an acceptable standard by carrying out repair works without emptying the canal.
Specific objectives Following a detailed investigation of the canal, urgent repairs have been identified and defined in the Final Report of the aforementioned study. A detailed design of such repairs is now needed, and so is the drafting of tender dossiers enabling the works to be carried out under a tendering process. Furthermore, an Environmental Impact Assessment of these repairs works needs to be carried out and should include proposals of mitigation measures. According to the financing of these works, their supervision could form part of the assignment, under an addendum.
Requested services
Task 1: Detailed design Based on a preliminary design, a detailed design will be carried out for Phase 1 repair works (urgent repairs that do not require emptying the canal completely). These repairs will be as follows:
• Active landslide repair at distance marker 'km 17'; • Removal and replacement of drainage pipes along the canal, in 8 locations; • Removal and replacement of 36 units of concrete slabs; • Filling up of 2 drilled holes in aqueducts and plugging of unauthorised pipes. • Track reconditioning (684 lnm near distance markers 'km 26', '32' and '33') • Digging of a crest ditch (250 lnm at 'km 27').
57
Task 2: Environmental Impact Assessment An Environmental Impact Assessment of these repair works will be carried out simultaneously, and mitigation measures will be proposed.
Task 3: Tender dossiers Tender dossiers including specifications (in line with local requirements), bill of quantities and confidential estimate, will be prepared.
Required outputs
Task 1: Detailed design A preliminary survey of the canal will be carried out so as to precisely identify the location of these repair works. Prior to this survey, a formal identification of the structures will be carried out with ILE (by means of boards, pegs or, preferably, painting marks along the canal, every 100 m). Detailed working drawings of the repair works to be carried out will be issued for each identified location requiring urgent repairs (scale: 1:500). Each drawing will include a works phasing schedule and the dewatering operations required to carry out some of these works.
Task 2: Environmental Impact Assessment A comprehensive report, including mitigation measures and their cost, will be issued.
Task 3: Tender dossiers A tender dossier will be prepared so as to launch a tendering process. This dossier will include:
• All detailed drawings, including works phasing schedules • Technical specifications • Bill of quantities • Programme of works • Administrative clauses.
A confidential estimate will be prepared and submitted separately.
5.4.3 EXPERTS PROFILE
Number of requested experts per category and number of working days per expert
Expert Category Working days per expert Team Leader I 40 Environmentalist II 20 CADD Technician II 40 Surveyor II 20
Required profile (education, experience, references and category as appropriate)
Team Leader/Civil Engineer Qualifications and skills: Education to Masters Degree (i.e. university degree awarded on completion of four years of study in a university or an equivalent institution), with 10 years in Civil Engineering
General professional experience: At least 10 years of experience in the aforementioned field
58
Specific professional experience: Specific experience in open canal construction.
Environmentalist Qualifications and skills: Education to Masters Degree (i.e. university degree awarded on completion of four years of study in a university or an equivalent institution), with 10 years in Civil Engineering
General professional experience: At least 10 years of experience in the aforementioned field Specific professional experience: Specific experience in the Balkan area and in water supply projects.
CADD Technician Qualifications and skills:
General professional experience: At least 10 years of experience in the aforementioned field Specific professional experience: Specific experience in the Balkan area and in water supply projects.
Surveyor Qualifications and skills:
General professional experience: At least 10 years of experience in the aforementioned field Specific professional experience: Specific experience in the Balkan area and in water supply projects.
Working language Working language is English. Nevertheless, as all working documents will have to be available in Albanian, a translation has to be foreseen.
5.4.4 LOCATION AND DURATION Starting period: April 2008 Foreseen duration: 2 months Location of assignment: Kosovo
5.4.5 REPORTING
Content In addition to the specific reports set out in Section 2.4, the Consultants should submit a draft Final Report including an Executive summary.
This report will be submitted to: Programme Manager for Rural Development Mr Pierre GERARD - [email protected] 1 Kosovo Street, P.O. Box 200, Prishtina, Kosovo Phone: + 381 38 51 31 204 Fax: + 381 38 51 31 302

59
Language
All documents should be both in English and in Albanian.
Timing for submission and comments and, when relevant, for approval The Consultant should submit the tender documents and the Final Report in three hard copies, together with an electronic version.
5.4.6 ADMINISTRATIVE INFORMATION
Other authorised items to foresee under “Reimbursable” The reimbursable cost will cover per diems for the experts requiring overnight stay in Kosovo, international travel, translation and local travel.
Tax and VAT arrangements On the ground of the specific Council Regulations governing the concerned EC external aid programme, VAT and other local taxes and duties are excluded from the Community financing.
Interim payment(s) modalities, if any As defined with the EC Framework Contracts procedures.
Others Office-related costs which may include office rental, communications (fax, telecommunications, mail, courier, etc.……) and secretarial services are considered to be included within the fee rates of the Experts. No cost of this nature may be charged in addition.

60
List of Reference Material for the Study
The following reference material will be made available prior to the study: Evaluation of the hydro system and Water Availability Assessment (Final Report, December 2007) Details about Pridvorice-Obiliq canal (in Albanian): “KANALI KRYESORË PRIDVORICË –OBILIQ ME KRAHUN PËR MITROVICË
Detailed “Canal status forms” made after full investigation of the canal carried out in October and November 2007.
61
5.5 Annex 5 – Proposed Terms of Reference for buffer basin detailed design (The pictures related to buffer basin are included in attached CD – Pictures buffer basin 5.5.1 BACKGROUND
The Iber-Lepenc hydro system is one of three hydro systems in Kosovo: - the Iber section was completed in 1985 as part of multi-purpose project intended to
provide water for hydro-electric, domestic, industrial and irrigation uses; - the Lepenc section has not yet been constructed.
The system is administered by Iber-Lepenc Enterprise (ILE), a publicly owned enterprise (PoE) as defined by the Kosovo Trust Agency (KTA), its temporary administrator. KTA is in the process of transforming ILE into an incorporated water management company, anticipating Kosovo’s likely autonomy and membership of the EU. In November 2007, a specific study has been undertaken for the European Agency for Reconstruction under request N° 04KOS 03/01/04. Its objective was to evaluate the hydro system, and the Water Availability Assessment concluded, inter alia, that in order to guarantee a continuous and minimum water flow for the canal's users, the following should be carried out:
• Urgent repairs to reduce the high rate of losses (50%) from the main canal (connecting Pridvoricë and Obiliq) to an acceptable level and to prevent further major damage to the hydro system;
• Construction of a buffer basin which would both guarantee a continuous flow right to the end of the canal and enable ILE to carry out major repairs to the canal by emptying it (entirely or by stretches);
• Additional repairs ('Phase II') requiring the canal to be emptied (after construction of the buffer basin, so as to avoid disrupting water supply to the users).
5.5.2 DESCRIPTION OF THE ASSIGNMENT
Overall objective The overall objective is to build a buffer basin having a capacity of about 1.8 million cubic metres, which corresponds to approximately ten days of raw water needs for the Kosovo C and Kosovo B power plants. This buffer basin would regulate the water flow and ensure continuous water supply from the main canal (“Pridvoricë – Obiliq”) owned by Iber-Lepenc Enterprise.
Specific objectives Preliminary locations for this buffer basin have been identified: two sites have been identified as suitable at that stage, taking into account the various constraints (namely: storage without pumping reserved flow for the ferronickel plant in the Drenica area, existing buildings…):
• Several suitable areas close to the 'Hamidi' division structure, along the main canal (at distance marker 'km 45')
• An additional suitable area near siphon 'Qurille' (at 'km 47').
A detailed comparative technical-economical study of these two sets of proposed locations will first be carried out so as to determine the final location or locations. Indeed, it might be more cost effective to build two buffer basins (one for the Kosovo C power plant and one for the ferronickel plant) instead of one, if we take into account the necessary pipes and pumping stations. As a conclusion of this study, one or several final location(s) will be proposed.

62
A detailed design of this buffer basin will then be needed, as well as a draft of tender dossiers enabling these works to be carried out under a tendering process. A detailed cost estimate is also required under this assignment, as well as an Environmental Impact Assessment. According to the financing of these works, their supervision could form part of the assignment, under an addendum.
Requested services
Task 1: Selecting the final location(s) This study should consider in particular:
• The possible use of materials from the mines and power plant (namely overburden and ashes) as fill material (either raw or mixed with cement or other materials);
• The water tightness of the foundation of the proposed areas (a geotechnical survey will be required, including pits and soil analysis: see § 6.1 below);
• The downstream structures (pipes or canal, pumping station) needed to supply water to the Kosovo C power plant and to the ferronickel plant in the Drenica area (through Bevolaq pumping station);
• A preliminary survey of the proposed areas, to enable the drafting of a preliminary design;
• An Environmental Impact Assessment.
A report will be submitted for approval at that stage.
Task 2: Detailed design Once the final location will have been approved, the detailed design will include the following:
• Detailed topographic survey maps (scale: 1:1000) of the current situation • Plan view of the proposed buffer basin (scale: 1:1000) • Cross sections of the proposed buffer basin (every 25 m) • Stability study for the dykes • Details of intake and outlet structures (scale: 1:50) • Details of water tightness devices (if any) • Detailed location of proposed borrow pits • Access tracks, including detailed access tracks from proposed borrow pits • Bill of quantities.
Task 3: Environmental Impact Assessment An Environmental Impact Assessment of these works will be carried out simultaneously, and mitigation measures will be proposed.
Task 4: Tender dossiers Tender dossiers including specifications (in line with local requirements), bill of quantities and confidential estimate, will be prepared.
Required outputs
Task 1: Selecting the final location(s) A report will be submitted for approval at that stage, before the end of the third month following the start of the assignment (end of field work). This report will include an Executive Summary in English, Serbian and Albanian.

63
The EAR will then have 10 working days to send his observations and comments to the Consultant.
Task 2: Detailed design A detailed design report will be issued before the end of the fifth month following the start of the assignment. This report will be issued in both English and Albanian.
Task 3: Environmental Impact Assessment A comprehensive report, including mitigation measures and their cost, will be issued before the end of the fifth month following the start of the assignment. This report will be issued in both English and Albanian and will have an Executive Summary in English, Serbian and Albanian.
Task 3: Tender dossiers A tender dossier will be prepared so as to launch a tendering process. This dossier, to be issued before the end of the sixth month following the start of the assignment, will include:
• All detailed drawings, including works phasing schedules • Technical specifications • Bill of quantities • Programme of works • Administrative clauses.
A confidential estimate will be prepared and submitted separately. This dossier will be issued in both English and Albanian and will have an Executive Summary in English, Serbian and Albanian
5.5.3 EXPERTS PROFILE
Number of requested experts per category and number of working days per expert
Expert Category Working days per expert Team Leader I 120 Environmentalist II 40 CADD Technician II 120 Geological Engineer II 20 Surveyor II 40
Profile required (education, experience, references and category as appropriate)
Team Leader/Civil Engineer Qualifications and skills: Education to Masters Degree (i.e. university degree awarded on completion of four years of study in a university or an equivalent institution), with 10 years in Civil Engineering
General professional experience: At least 10 years of experience in the aforementioned field
Specific professional experience: Specific experience in dam construction

64
Environmentalist Qualifications and skills: Education to Masters Degree (i.e. university degree awarded on completion of four years of study in a university or an equivalent institution), with 10 years in Civil Engineering
General professional experience: At least 10 years of experience in the aforementioned field Specific professional experience Specific experience in the Balkan area and in water supply projects
CADD Technician Qualifications and skills
General professional experience: At least 10 years of experience in the aforementioned field Specific professional experience Specific experience in the Balkan area and in water supply projects
Geotechnical Engineer Qualifications and skills
General professional experience: At least 10 years of experience in the aforementioned field
Specific professional experience: Specific experience in dam construction
Surveyor Qualifications and skills:
General professional experience: Specific professional experience:
Working language Working language is English. Nevertheless, as all working documents will have to be prepared in English an Albanian, a translation has to be foreseen.
5.5.4 LOCATION AND DURATION Starting period: Foreseen duration: 6 months Location of assignment: Kosovo
5.5.5 REPORTING
Content In addition to the specific reports set out in Section 2.4, the Consultants should submit a draft Final Report including an Executive Summary.
This report will be submitted to: Programme Manager for Rural Development Mr Pierre GERARD [email protected]

65
1 Kosovo Street, P.O. Box 200, Prishtina, Kosovo Phone: + 381 38 51 31 204 Fax: + 381 38 51 31 302
Language All documents should be both in English and in Albanian.
Timing for submission and comments and, when relevant, for approval The Consultant should submit the tender documents and the Final Report in three hard copies, together with an electronic version.
5.5.6 ADMINISTRATIVE INFORMATION
Other authorised items to foresee under “Reimbursable” The reimbursable cost will cover per diems for the experts requiring overnight stay in Kosovo, international travel, translation and local travel. Geotechnical investigation costs (excluding supervision) will be reimbursed upon submission of invoices, after approval of quotations (minimum 2 quotations should be given).
Tax and VAT arrangements On the ground of the specific Council Regulations governing the concerned EC external aid programme, VAT and other local taxes and duties are excluded from the Community financing.
Interim payment(s) modalities, if any As defined with the EC Framework Contracts procedures.
Others Office-related costs which may include office rental, communications (fax, telecommunications, mail, courier, etc.……) and secretarial services are considered to be included within the fee rates of the Experts. No cost of this nature may be charged in addition.

66
List of Reference Material for the Study
The following reference material will be made available prior to the study: Evaluation of the hydro system and Water Availability Assessment (Final Report, December 2007) Details about Pridvorice-Obiliq canal (in Albanian): “KANALI KRYESORË PRIDVORICË –OBILIQ ME KRAHUN PËR MITROVICË Pictures of proposed locations In addition, documents regarding the characteristics of overburden and ashes from power plants should be available from KEK or INCO.

67
6 Consulted Sources
1. Iber-Lepenc Enterprise Business Plan, 2007 2. Iber-Lepenc Enterprise Financial Statements 3. Iber-Lepenc Enterprise Operational Records regarding water level in Gazivoda
lake 4. EAR Pre-feasibility studies for a new lignite -fired power plant at Kosovo B,
60R05429.01-Q70-003, Feb ’03 5. Terms of reference for studies to support the development of new generation
capacities and related transmission, EAR, Apr ’06; 6. WB Energy Sector Technical Assistance Projects (ESTAP 1, 2 & 3); 7. WB Lignite Power TA Project (LPTAP) 8. Kosovo Irrigation Rehabilitation Plan, KIRP I and KIRP II reports 9. Power generation records on a daily release basis, for the last 10 years,
ILE records. 10. Reservoir capacity curve data (original) 11. Topographical maps at various scales 12. Design study for Gazivoda and Pridvorice reservoirs, and Pridvorice – Obeliq
canal and associated structures 13. Hydrological maps and profiles 14. General topographical maps of irrigation command areas 15. Kosovo Water Master Plan of 1985
The water balance document compiled from MMPH in 2004 was not found.
Recommended