UNICREDIT CORPORATE DIVISION: GROWTH OPPORTUNITIES AND RISK CONTROL FRAMEWORK
Verona, July 15th, 2004
2
Pietro Modiano – Head of Corporate Division
UCI Corporate Division identity card
UBI’s highlights
Corporate lending scenario
UBI’s strategy and its ‘pact for growth’
Francesco Giordano – Head of UBI Planning, Research and Strategy
Focus on Credit Quality
Ferdinando Samaria – UBM Chief Financial Officer
Focus on Revenue Diversification and Financial Risk Management
AGENDA
3
UCI Corporate Division identity card
UBI’s highlights
Corporate lending scenario
UBI’s strategy and its ‘pact for growth’
AGENDA
4
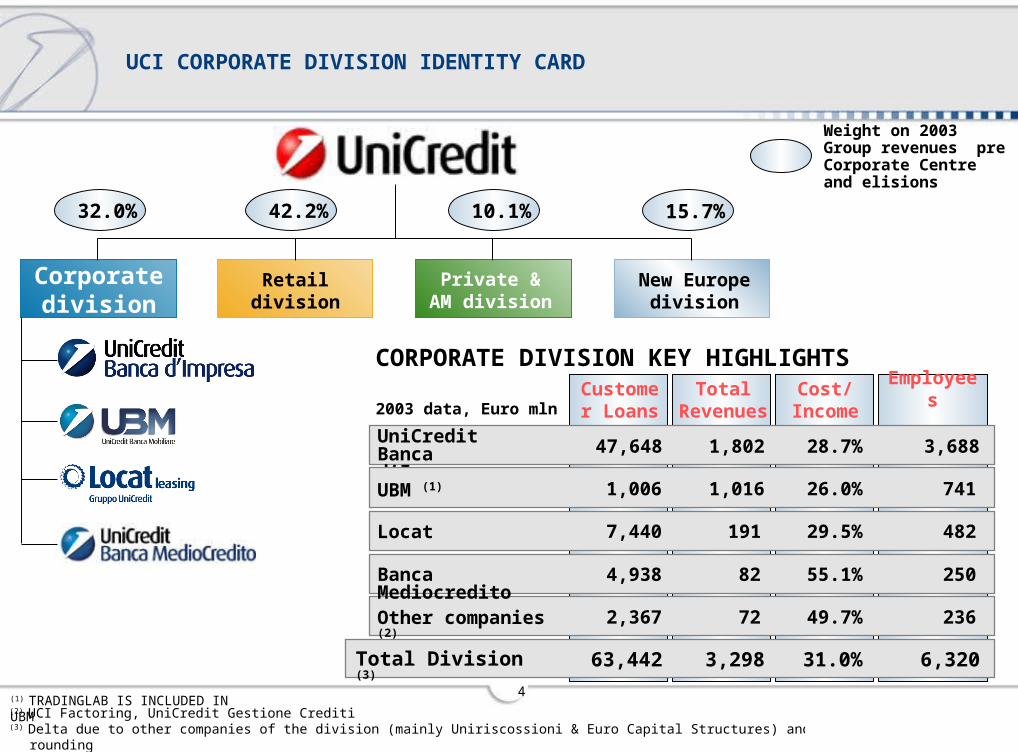
UCI CORPORATE DIVISION IDENTITY CARD
New Europe division
Private & AM division
Retail division
Corporate division
32.0% 42.2% 10.1% 15.7%
Weight on 2003 Group revenues pre Corporate Centre and elisions
(2) UCI Factoring, UniCredit Gestione Crediti(3) Delta due to other companies of the division (mainly Uniriscossioni & Euro Capital Structures) and rounding
2003 data, Euro mln
UniCredit Banca d’Impresa
Customer Loans
47,648
UBM (1) 1,006
Total Division (3) 63,442
Total Revenues
1,802
1,016
3,298
28.7%
26.0%
31.0%
Cost/ Income
Locat 7,440
Other companies (2) 2,367
191
72
29.5%
49.7%
3,688
741
6,320
Employees
482
236
CORPORATE DIVISION KEY HIGHLIGHTS
Banca Mediocredito 4,938 82 55.1% 250
(1) TRADINGLAB IS INCLUDED IN UBM

5
UCI Corporate Division identity card
UBI’s highlights
Corporate lending scenario
UBI’s strategy and its ‘pact for growth’
AGENDA

6
UBI has combined the competencies in the corporate sector of a major national bank with those of six banks with a strong local presence
UBI’s core clients are companies with revenues of over 1.5 mln euro. This client segment covers around 120,000 companies that account for a total of 350 bln euros bank loans
Of Italy’s 120,000 SMEs around 56,500 are UBI’s clients of which 41,000 (72%) have an open lending relationship with UBI
UBI: THE FOCAL POINT OF THE CORPORATE DIVISION
Source: Source: UBI calculations on internal data, using Italian Credit Bureau definitions
(*) Client coverage refers to the number of UBI clients with outstanding loans, according to Italian Credit Bureau, relative to an estimate of the total number of corporate enterprises.
% UBI clientswith
outstanding loans on
core clients
Total Market
Total corporate enterprises 72%
Largest groups
Other corporate and SMEs
43%
72%
119,682
56,527
512
56,015
47%
UBI CoreClients
Client Coverage
(*)
7
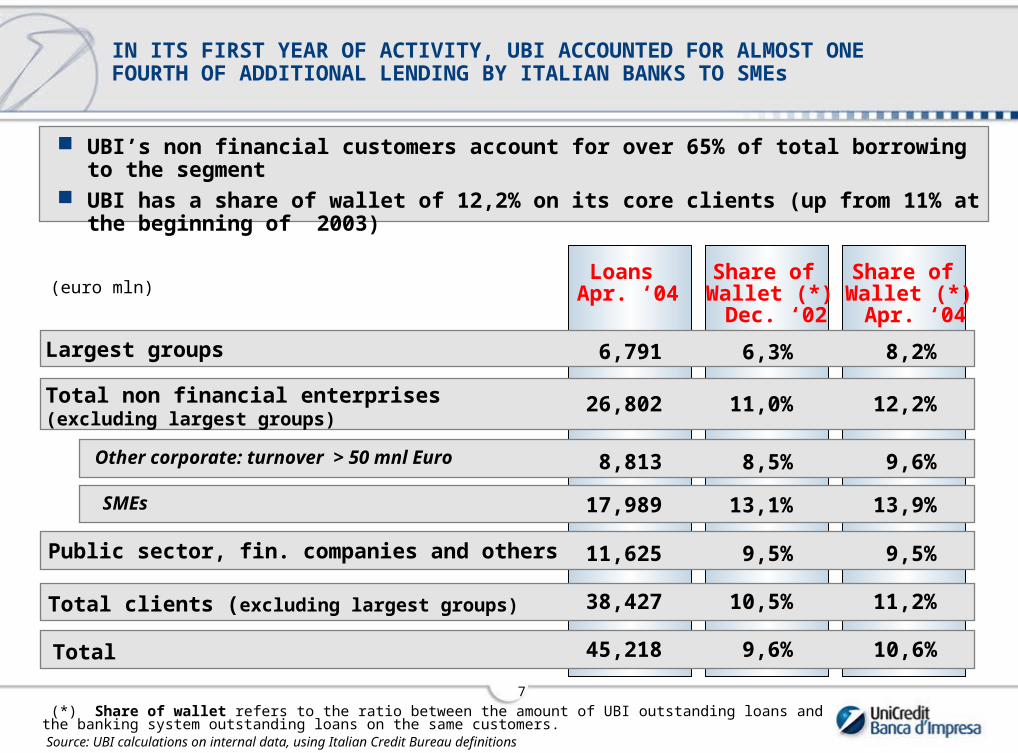
IN ITS FIRST YEAR OF ACTIVITY, UBI ACCOUNTED FOR ALMOST ONE FOURTH OF ADDITIONAL LENDING BY ITALIAN BANKS TO SMEs
UBI’s non financial customers account for over 65% of total borrowing to the segment UBI has a share of wallet of 12,2% on its core clients (up from 11% at the beginning of
2003)
Source: UBI calculations on internal data, using Italian Credit Bureau definitions
(*) Share of wallet refers to the ratio between the amount of UBI outstanding loans and the banking system outstanding loans on the same customers.
Share of Wallet (*) Dec. ‘02
6,3%
11,0%
13,1%
9,5%
10,5%
8,5%
9,6%
Loans Apr. ‘04
Share of Wallet (*) Apr. ‘04
(euro mln)
Largest groups
Public sector, fin. companies and others
Total clients (excluding largest groups)
Total non financial enterprises (excluding largest groups)
Total
SMEs
Other corporate: turnover > 50 mnl Euro
6,791
11,625
38,427
26,802
45,218
17,989
8,813
8,2%
9,5%
11,2%
10,6%
13,9%
9,6%
12,2%

8
A CORPORATE BANK, WITH A WELL BALANCED REVENUE BASE IN TERMS OF CLIENT SEGMENTATION AND OF INTEREST vs FEE INCOME
Total (excluding largest groups) 396 92% 62% 34%
Total 430 100% 61% 35%
Total Revenues
Total Revenues
Breakdown
Weight of Interest
Income on revenues
Weight of Fee Income on revenues(euro mln)
Quarterly data as March 2004
94 22% 65% 30%Public sector, fin. companies and others
34 8% 59% 36%Largest groups
Other corporates and SMEs 302 70% 61% 36%
79 18% 68% 29%SMEs: turnover 1,5 - 5 mnl Euro
Other corp: turnover > 50 mnl Euro 59 14% 52% 43%
SMEs: turnover 5- 50 mnl Euro 164 38% 60% 37%
Source: UBI calculations on internal data
9
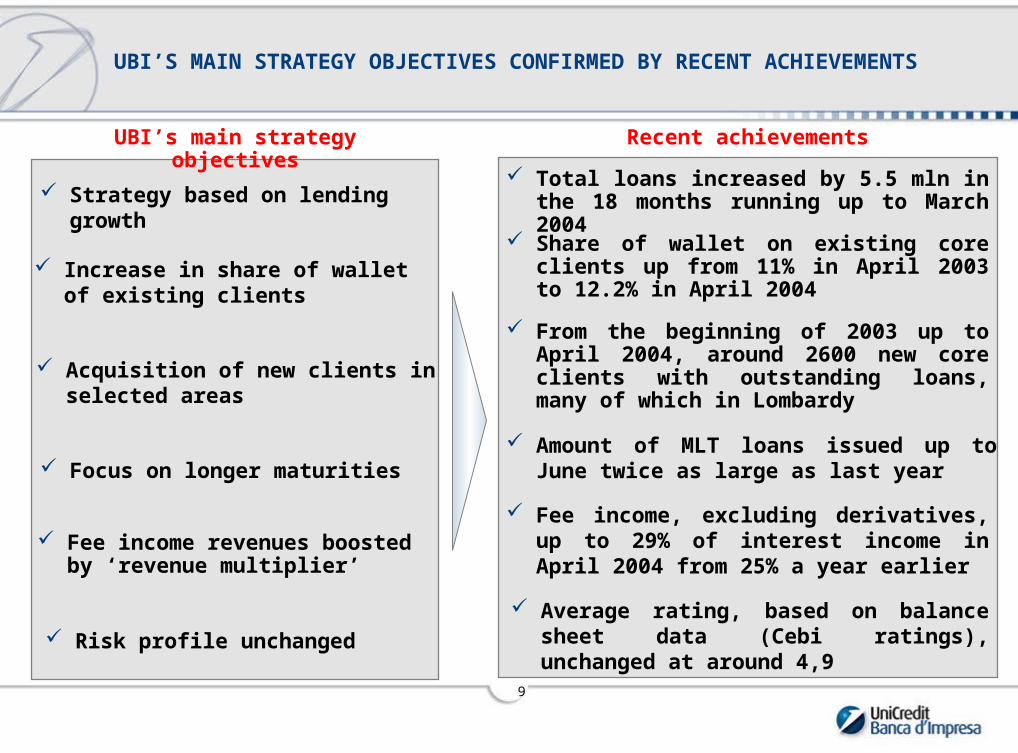
UBI’S MAIN STRATEGY OBJECTIVES CONFIRMED BY RECENT ACHIEVEMENTS
Strategy based on lending growth
Increase in share of wallet of existing clients
Acquisition of new clients in selected areas
UBI’s main strategy objectives Recent achievements
Focus on longer maturities
Total loans increased by 5.5 mln in the 18 months running up to March 2004
Share of wallet on existing core clients up from 11% in April 2003 to 12.2% in April 2004
From the beginning of 2003 up to April 2004, around 2600 new core clients with outstanding loans, many of which in Lombardy
Amount of MLT loans issued up to June twice as large as last year
Fee income, excluding derivatives, up to 29% of interest income in April 2004 from 25% a year earlier
Fee income revenues boosted by ‘revenue multiplier’
Average rating, based on balance sheet data (Cebi ratings), unchanged at around 4,9 Risk profile unchanged
10
UCI Corporate Division identity card
UBI’s highlights
Corporate lending scenario
UBI’s strategy and its ‘pact for growth’
AGENDA

11
90
92
94
96
98
100
102
104
106
108
Apr-01 Oct-01 Apr-02 Oct-02 Apr-03 Oct-03 Apr-0490
92
94
96
98
100
102
104
106
108
110
Turnover 3mma
Turnover
Orders 3mma sc. dx
Orders sc. dx.
Italy’s industrial production recovery considerably slower than in previous downturns…
… but recent data (e.g. orders and business turnover) highlight that the global recovery is finally reaching Italy
Source: UBI on ISTAT
ITALY’S MANUFACTURING SLOWDOWN HAS LASTED LONGER THAN IN PAST CYCLES, BUT THERE ARE CLEAR SIGNS OF RECOVERY AHEAD
Note: The cyclical low is set at 100. X axis shows the number of months from the cyclical low
98
100
102
104
106
108
110
112
114
-12 -10 -8 -6 -4 -2 0 2 4 6 8 10 12 14 16 18 20 22 24 26
92-94 95-97
98-00 01-?
Industrial production index

12
DESPITE PROLONGED PRODUCTION WEAKNESS, COMPANIES’ PROFITABILITY SHOWS CONSIDERABLE RESILIENCE
2000 2001 2002
EBITDA/ turnover
Gross financial charges / op. income
ROE
Equity/ Total assets
1993
11.1 9.7 9.59.6
142.5 50.6 53.348.3
-6.3 5.0 2.66.5
23.9 26.9 28.426.7
Italian companies key ratios (%)
’92-’93 ’02-’03
Food, beverages and tobacco
Textile and clothes production
Chemical products, rubber and plastics
Leather
’90-’03
10.4 10.811.4
11.9 11.011.9
12.7 12.211.3
8.6 6.210.4
Italian manufacturing sectors:EBITDA/ production (%)
Machinery and mechanical products 9.9 7.911.0
Source: UBI on BACH and ISTAT
13
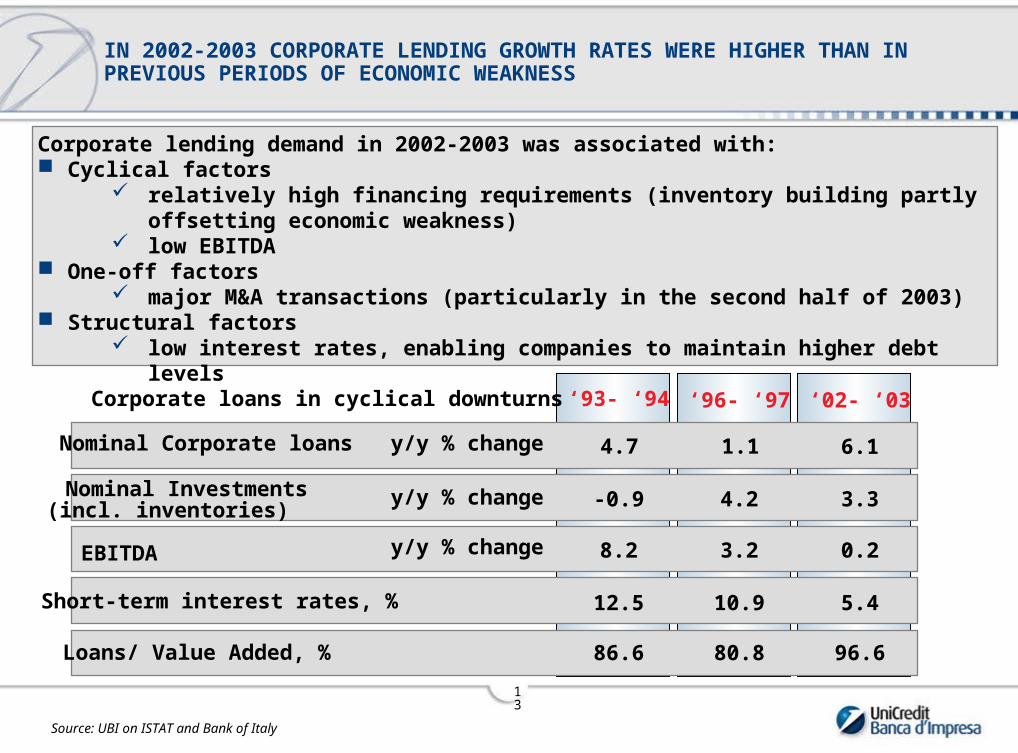
‘93- ‘94 ‘96- ‘97 ‘02- ‘03Corporate loans in cyclical downturns
Loans/ Value Added, % 86.6 80.8 96.6
Nominal Corporate loans 4.7 1.1 6.1
EBITDA 8.2 3.2 0.2y/y % change
Short-term interest rates, % 12.5 10.9 5.4
y/y % change
(incl. inventories)Nominal Investments -0.9 4.2 3.3y/y % change
IN 2002-2003 CORPORATE LENDING GROWTH RATES WERE HIGHER THAN IN PREVIOUS PERIODS OF ECONOMIC WEAKNESS
Corporate lending demand in 2002-2003 was associated with: Cyclical factors
relatively high financing requirements (inventory building partly offsetting economic weakness)
low EBITDA One-off factors
major M&A transactions (particularly in the second half of 2003) Structural factors
low interest rates, enabling companies to maintain higher debt levels
Source: UBI on ISTAT and Bank of Italy

14
0
2
4
6
8
10
12
14
Mar-98
Sep-98
Mar-99
Sep-99
Mar-00
Sep-00
Mar-01
Sep-01
Mar-02
Sep-02
Mar-03
Sep-03
Mar-04
Sep-04
Mar-05
Sep-05
Mar-06
Sep-06
Mar-07
Sep-07
Annual average
End ofperiod
IN COMING YEARS, CORPORATE LENDING SHOULD RETURN TO GROWTH RATES CONSISTENT WITH THE CYCLE…
2004 5.4 5.7
2005 7.0 6.4
2006 6.2 5.7
2007 5.1 4.8
The moderate economic recovery should keep corporate lending growth rates relatively low (around 5.9% on average in 2004-2007)
The influence of low interest rates on Italian companies’ debt levels should gradually lessen
The loans/value added ratio is higher than in the early 1990s and should remain at current levels
Corporate loans, y/y % change
Source: UBI on ISTAT and Bank of Italy

15
45.0
47.0
49.0
51.0
53.0
55.0
57.0
59.0
61.0
63.0
Mar-95
Sep-95
Mar-96
Sep-96
Mar-97
Sep-97
Mar-98
Sep-98
Mar-99
Sep-99
Mar-00
Sep-00
Mar-01
Sep-01
Mar-02
Sep-02
Mar-03
Sep-03
… WHILE GROWTH IN MEDIUM/LONG-TERM LOANS SHOULD CONTINUE TO OUTDO SHORT-TERM LOAN GROWTH AS OCCURRED IN THE PAST TWO YEARS…
Short-term corporate bank debt overtotal corporate bank debt
Shortterm
M/Lterm
2000 12.1 9.4
2001 12.2 7.2
2002 -0.8 12.4
2003 0.1 12.9
Different trends in short-term and medium/long-term loans reflect: Cyclical factors
cyclical weakness and low interest rates One-off factors
debt restructuring undertaken by a number of large industrial groups Structural factors
the propensity for companies to hold a higher proportion of medium/long-term debt in a trend towards convergence with the rest of Europe
Corporate Loans, y/y % change
Source: Bank of Italy
16
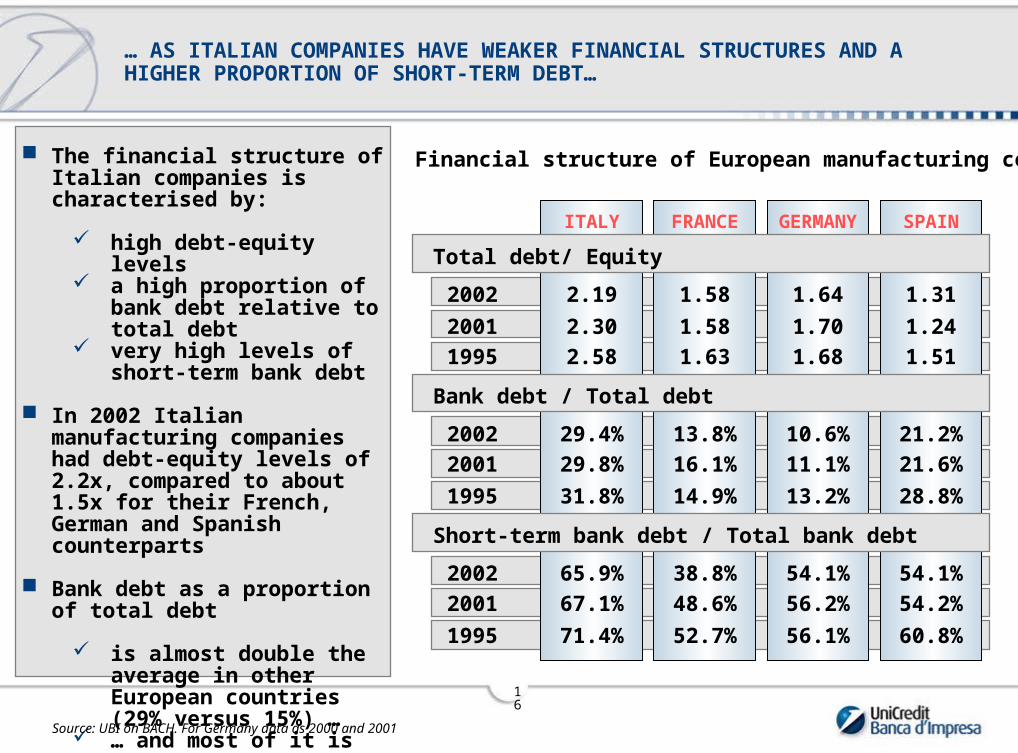
… AS ITALIAN COMPANIES HAVE WEAKER FINANCIAL STRUCTURES AND A HIGHER PROPORTION OF SHORT-TERM DEBT…
The financial structure of Italian companies is characterised by:
high debt-equity levels a high proportion of bank
debt relative to total debt very high levels of short-
term bank debt
In 2002 Italian manufacturing companies had debt-equity levels of 2.2x, compared to about 1.5x for their French, German and Spanish counterparts
Bank debt as a proportion of total debt
is almost double the average in other European countries (29% versus 15%) …
… and most of it is short-term debt
FRANCE GERMANY SPAINITALY
1.58 1.64 1.31
1.58 1.70 1.24
1.63 1.68 1.51
13.8% 10.6% 21.2%
16.1% 11.1% 21.6%
14.9% 13.2% 28.8%
38.8% 54.1% 54.1%
48.6% 56.2% 54.2%
2.19
2.30
2.58
29.4%
29.8%
31.8%
65.9%
67.1%
71.4% 52.7% 56.1% 60.8%
2002
2001
2001
2002
1995
1995
2002
2001
1995
Bank debt / Total debt
Total debt/ Equity
Short-term bank debt / Total bank debt
Source: UBI on BACH. For Germany data as 2000 and 2001
Financial structure of European manufacturing companies
17
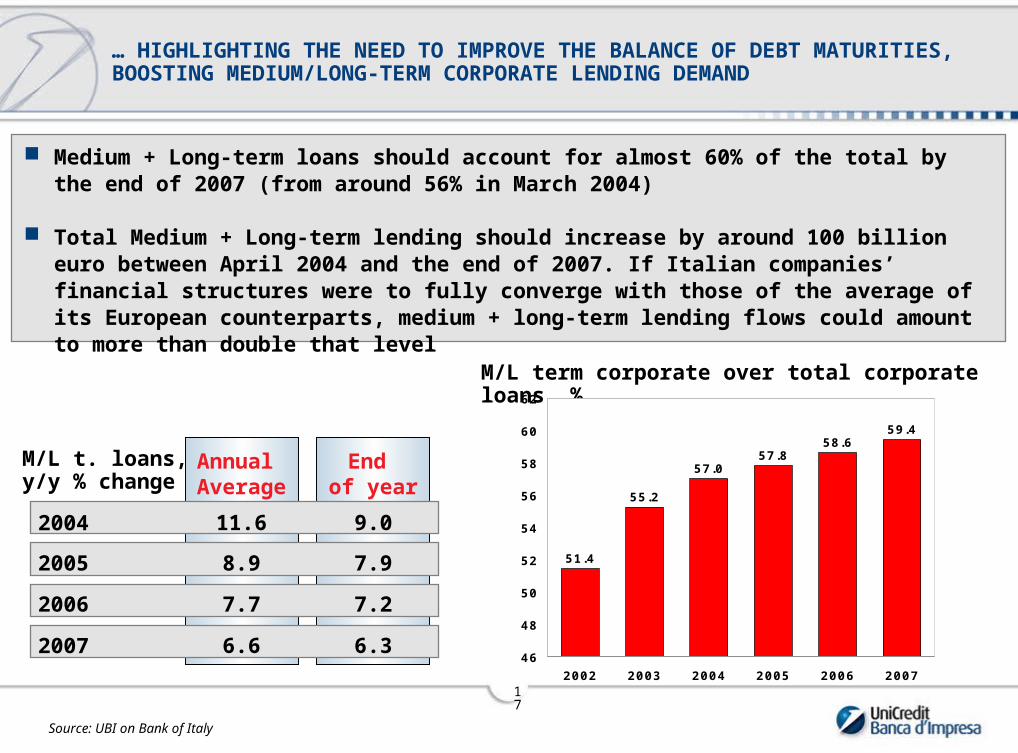
… HIGHLIGHTING THE NEED TO IMPROVE THE BALANCE OF DEBT MATURITIES, BOOSTING MEDIUM/LONG-TERM CORPORATE LENDING DEMAND
Medium + Long-term loans should account for almost 60% of the total by the end of 2007 (from around 56% in March 2004)
Total Medium + Long-term lending should increase by around 100 billion euro between April 2004 and the end of 2007. If Italian companies’ financial structures were to fully converge with those of the average of its European counterparts, medium + long-term lending flows could amount to more than double that level
Source: UBI on Bank of Italy
M/L term corporate over total corporate loans, %
Annual Average
End of year
11.6 9.0
8.9 7.9
7.7 7.2
6.6 6.3
2004
2005
2006
2007
M/L t. loans,y/y % change
51.4
55.2
57.057.8
58.659.4
46
48
50
52
54
56
58
60
62
2002 2003 2004 2005 2006 2007
18
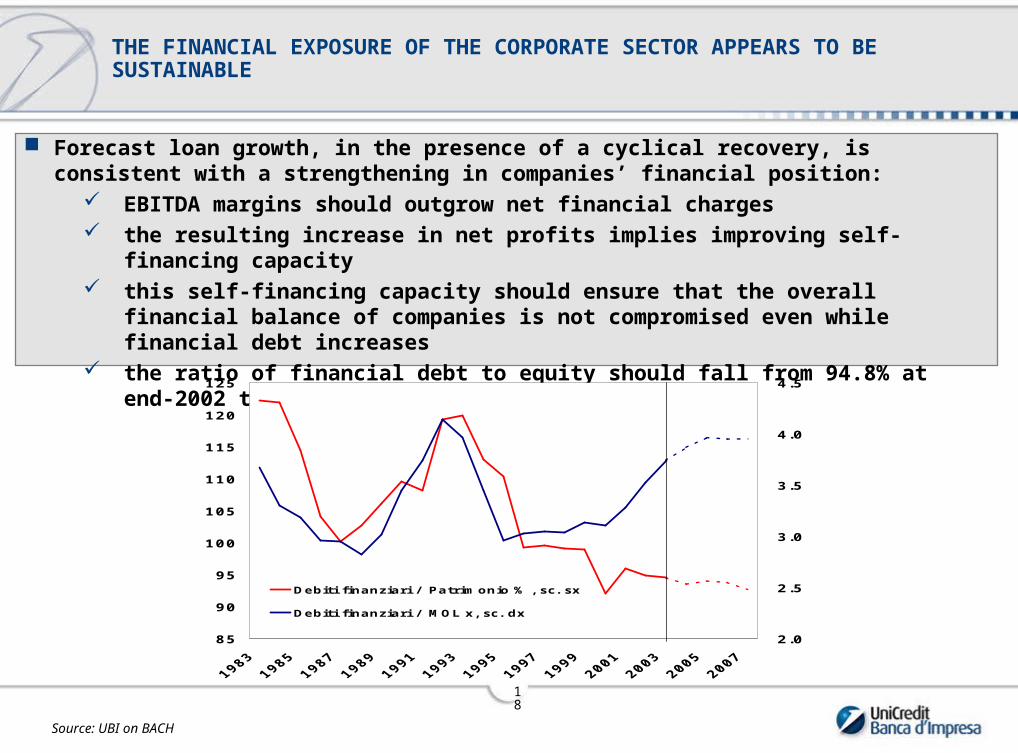
Forecast loan growth, in the presence of a cyclical recovery, is consistent with a strengthening in companies’ financial position:
EBITDA margins should outgrow net financial charges the resulting increase in net profits implies improving self-financing capacity this self-financing capacity should ensure that the overall financial balance of
companies is not compromised even while financial debt increases the ratio of financial debt to equity should fall from 94.8% at end-2002 to 92.6% at
end- 2007
THE FINANCIAL EXPOSURE OF THE CORPORATE SECTOR APPEARS TO BE SUSTAINABLE
Source: UBI on BACH
85
90
95
100
105
110
115
120
125
2.0
2.5
3.0
3.5
4.0
4.5
Debiti finanziari / Patrimonio % , sc. sx
Debiti finanziari / MOL x, sc. dx
19
UCI Corporate Division identity card
UBI’s highlights
Corporate lending scenario
UBI’s strategy and its ‘pact for growth’
AGENDA
20
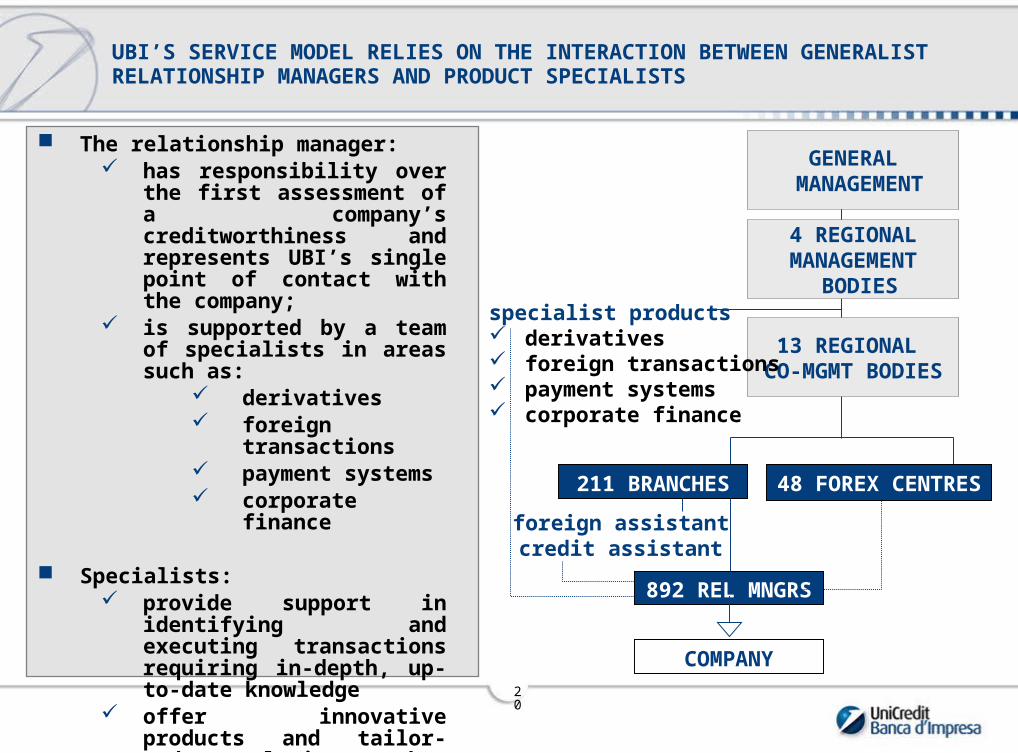
UBI’S SERVICE MODEL RELIES ON THE INTERACTION BETWEEN GENERALIST RELATIONSHIP MANAGERS AND PRODUCT SPECIALISTS
The relationship manager: has responsibility over the
first assessment of a company’s creditworthiness and represents UBI’s single point of contact with the company;
is supported by a team of specialists in areas such as:
derivatives foreign transactions payment systems corporate finance
Specialists: provide support in identifying
and executing transactions requiring in-depth, up-to-date knowledge
offer innovative products and tailor-made solutions that meet companies’ needs
foreign assistantcredit assistant
GENERAL MANAGEMENT
4 REGIONALMANAGEMENT
BODIES
13 REGIONAL CO-MGMT BODIES
211 BRANCHES 48 FOREX CENTRES
COMPANY
892 REL MNGRS
specialist products derivatives foreign transactions payment systems corporate finance
21
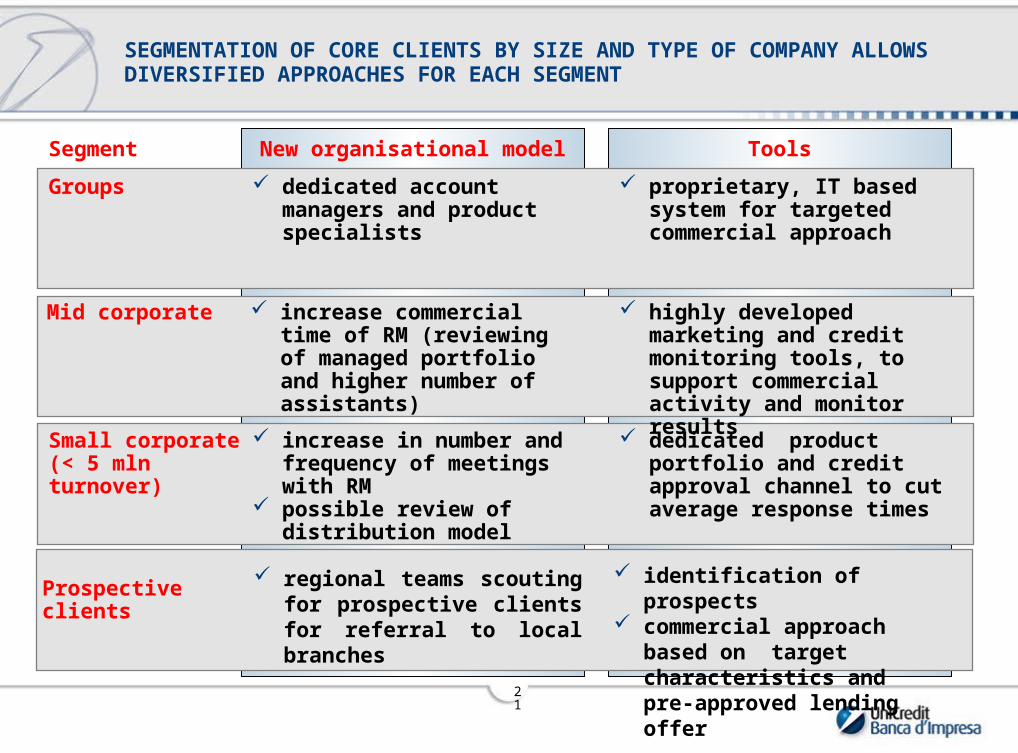
SEGMENTATION OF CORE CLIENTS BY SIZE AND TYPE OF COMPANY ALLOWS DIVERSIFIED APPROACHES FOR EACH SEGMENT
dedicated account managers and product specialists
Groups proprietary, IT based system for targeted commercial approach
increase commercial time of RM (reviewing of managed portfolio and higher number of assistants)
Mid corporate highly developed marketing and credit monitoring tools, to support commercial activity and monitor results
increase in number and frequency of meetings with RM
possible review of distribution model
Small corporate(< 5 mln turnover)
dedicated product portfolio and credit approval channel to cut average response times
New organisational modelSegment Tools
regional teams scouting for prospective clients for referral to local branches
Prospectiveclients
identification of prospects commercial approach based
on target characteristics and pre-approved lending offer
22
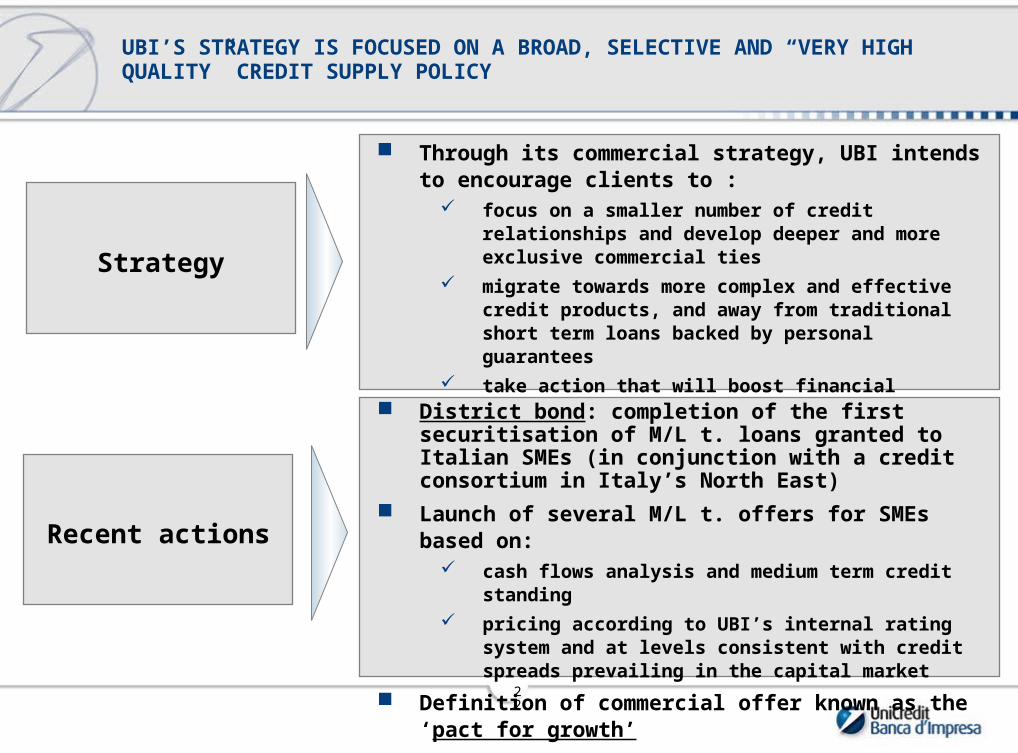
Strategy
Through its commercial strategy, UBI intends to encourage clients to :
focus on a smaller number of credit relationships and develop deeper and more exclusive commercial ties
migrate towards more complex and effective credit products, and away from traditional short term loans backed by personal guarantees
take action that will boost financial strength while offering specialised support for that purpose
District bond: completion of the first securitisation of M/L t. loans granted to Italian SMEs (in conjunction with a credit consortium in Italy’s North East)
Launch of several M/L t. offers for SMEs based on: cash flows analysis and medium term credit standing
pricing according to UBI’s internal rating system and at levels consistent with credit spreads prevailing in the capital market
Definition of commercial offer known as the ‘pact for growth’
UBI’S STRATEGY IS FOCUSED ON A BROAD, SELECTIVE AND “VERY HIGH QUALITY” CREDIT SUPPLY POLICY
Recent actions
23
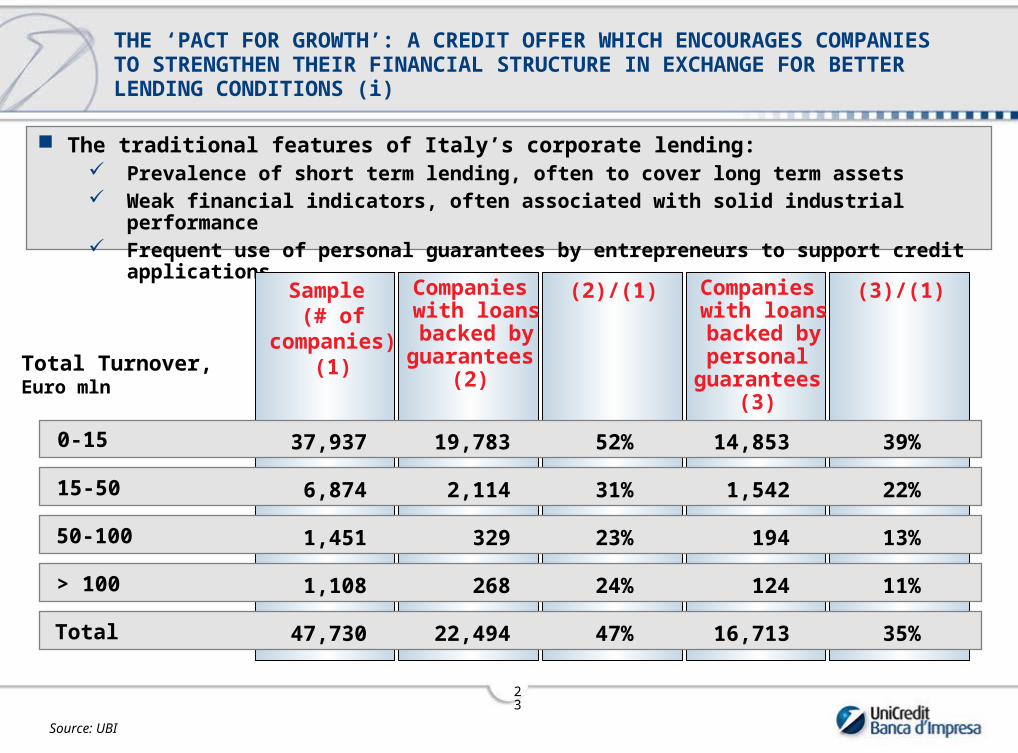
The traditional features of Italy’s corporate lending: Prevalence of short term lending, often to cover long term assets Weak financial indicators, often associated with solid industrial performance Frequent use of personal guarantees by entrepreneurs to support credit applications
THE ‘PACT FOR GROWTH’: A CREDIT OFFER WHICH ENCOURAGES COMPANIES TO STRENGTHEN THEIR FINANCIAL STRUCTURE IN EXCHANGE FOR BETTER LENDING CONDITIONS (i)
Companies with loans backed byguarantees
(2)
(2)/(1) Companies with loans backed by personal
guarantees(3)
(3)/(1)
0-15
15-50
50-100
> 100
Total
Sample (# of
companies) (1)
37,937 52% 14,853 39%19,783
6,874 31% 1,542 22%2,114
1,451 23% 194 13%329
1,108 24% 124 11%268
47,730 47% 16,713 35%22,494
Source: UBI
Total Turnover,Euro mln

24
UBI is now marketing a credit offer – known as the ‘pact for growth’ – based on the following features:
Offer of medium-/long-term financing of an amount that will improve the financial structure of the company
Require companies to increase equity by a level that will improve the company’s rating
Set covenants to be monitored every six months
If a satisfactory level of creditworthiness is reached, UBI is prepared to give up personal guarantees
THE ‘PACT FOR GROWTH’ (ii)
Such ample use of personal guarantees implies that:
the availability of bank lending is often based on the creditworthiness of the entrepreneur rather than on the company’s true capacity to generate income
our estimates indicate that the banking system tends to overestimate the reduction in LGD* granted by personal guarantees
(*) LGD: Loss Given Default

25
UBI strategy has been confirmed by recent results: UBI has increased its share of wallet, boosted fee revenues (ex. derivatives), while keeping an unchanged risk profile
To achieve further, significant growth UBI also needs to update its supply policy: the flow of Italian corporate lending should focus on medium to long term maturities
Both the economic and the lending scenarios should ensure that lending growth is achieved without a deterioration in creditworthiness
At the same time companies should migrate towards more complex and effective credit products, and away from traditional short term loans backed by personal guarantees. A reduction in Italy’s multibanking tradition is also likely
UBI’s service model, client segmentation and risk management capabilities put us in an ideal position to capture a more than proportional share of the new lending flows
SUMMING UP
26
Francesco Giordano – Head of UBI Planning, Research and Strategy
Focus on Credit Quality
AGENDA
27
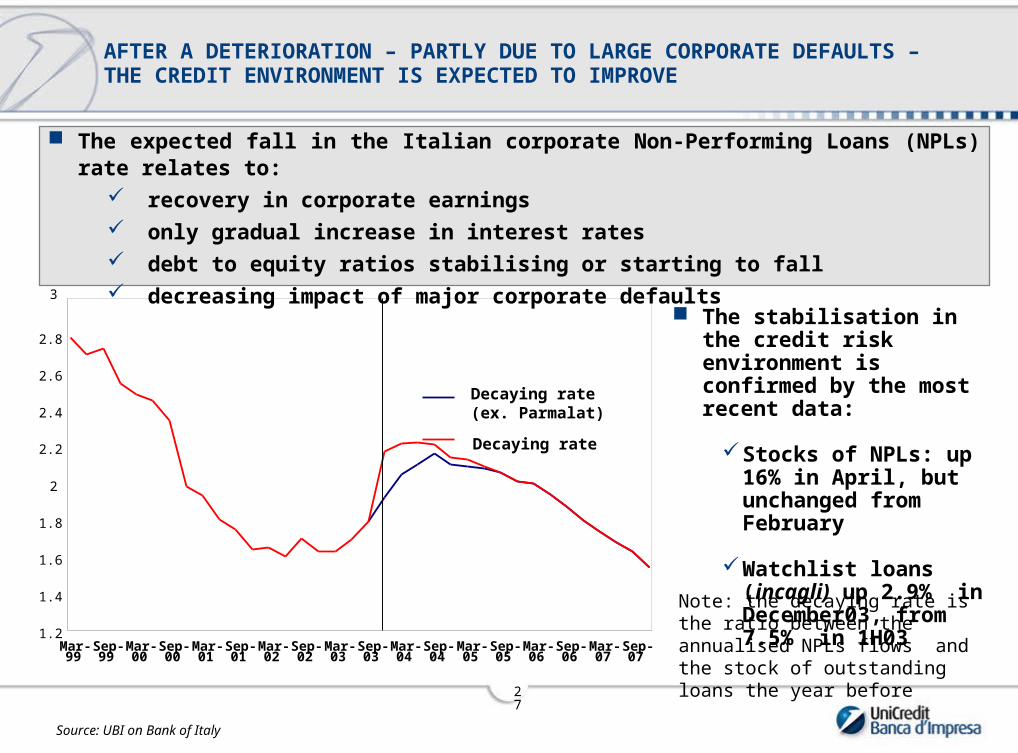
The expected fall in the Italian corporate Non-Performing Loans (NPLs) rate relates to: recovery in corporate earnings only gradual increase in interest rates debt to equity ratios stabilising or starting to fall decreasing impact of major corporate defaults
AFTER A DETERIORATION – PARTLY DUE TO LARGE CORPORATE DEFAULTS – THE CREDIT ENVIRONMENT IS EXPECTED TO IMPROVE
Note: the decaying rate is the ratio between the annualised NPLs flows and the stock of outstanding loans the year before
1.2
1.4
1.6
1.8
2
2.2
2.4
2.6
2.8
3
Mar-99
Sep-99
Mar-00
Sep-00
Mar-01
Sep-01
Mar-02
Sep-02
Mar-03
Sep-03
Mar-04
Sep-04
Mar-05
Sep-05
Mar-06
Sep-06
Mar-07
Sep-07
Source: UBI on Bank of Italy
Decaying rate(ex. Parmalat)
Decaying rate
The stabilisation in the credit risk environment is confirmed by the most recent data:
Stocks of NPLs: up 16%
in April, but unchanged from February
Watchlist loans (incagli) up 2.9% in December03, from 7.5% in 1H03
28
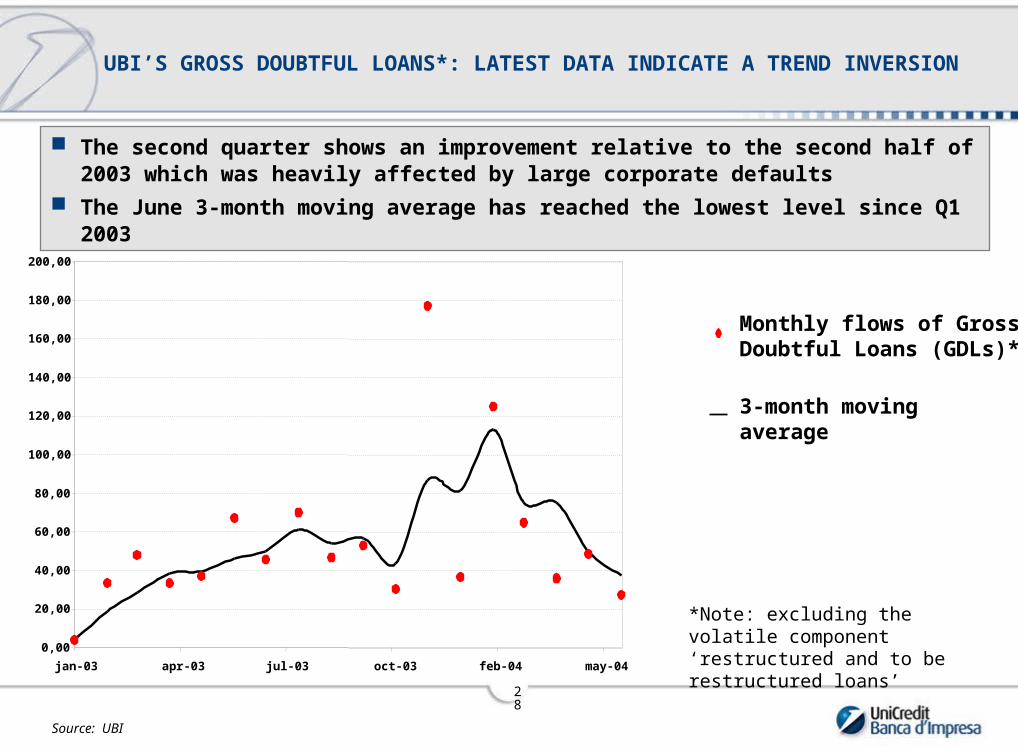
The second quarter shows an improvement relative to the second half of 2003 which was heavily affected by large corporate defaults
The June 3-month moving average has reached the lowest level since Q1 2003
Monthly flows of Gross Doubtful Loans (GDLs)*
3-month moving average
UBI’S GROSS DOUBTFUL LOANS*: LATEST DATA INDICATE A TREND INVERSION
0,00
20,00
40,00
60,00
80,00
100,00
120,00
140,00
160,00
180,00
200,00
jan-03 apr-03 jul-03 oct-03 feb-04 may-04
Source: UBI
*Note: excluding the volatile component ‘restructured and to be restructured loans’

29
EXCLUDING THE TWO LARGEST POSITIONS, THE TREND INVERSION APPEARS TO BE CONFIRMED
Excluding the two single largest positions (each month), GDLs show early signs of a trend inversion
Current June levels, if confirmed by subsequent observations, would be below expectations based on economic forecasts
Monthly flows of Gross Doubtful Loans (GDLs)* ex. 2 largest positions
3-month moving average
0,00
10,00
20,00
30,00
40,00
50,00
60,00
70,00
80,00
jan-03 apr-03 jul-03 oct-03 feb-04 may-04
Source: UBI
*Note: excluding the volatile component ‘restructured and to be restructured loans’
30
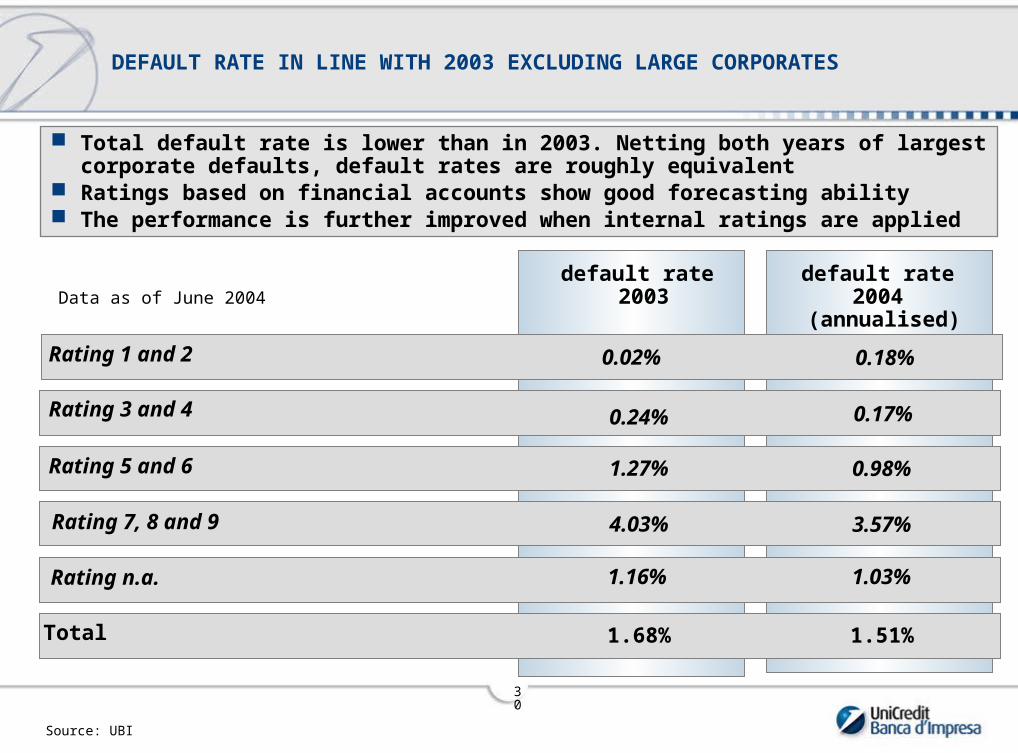
DEFAULT RATE IN LINE WITH 2003 EXCLUDING LARGE CORPORATES
Source: UBI
Rating 1 and 2 0.02% 0.18%
Rating 3 and 4 0.24% 0.17%
Rating 5 and 6 1.27% 0.98%
Rating 7, 8 and 9 4.03% 3.57%
Rating n.a. 1.16% 1.03%
Total 1.68% 1.51%
default rate 2003
default rate 2004
(annualised) Data as of June 2004
Total default rate is lower than in 2003. Netting both years of largest corporate defaults, default rates are roughly equivalent
Ratings based on financial accounts show good forecasting ability The performance is further improved when internal ratings are applied
31
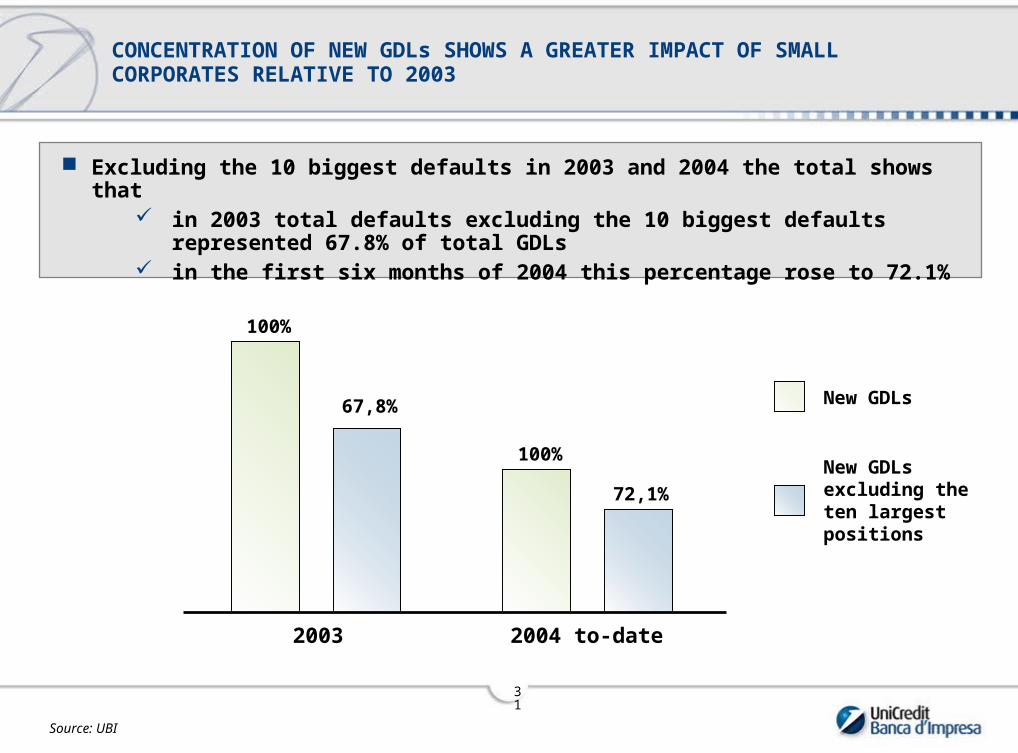
Excluding the 10 biggest defaults in 2003 and 2004 the total shows that in 2003 total defaults excluding the 10 biggest defaults represented 67.8% of
total GDLs in the first six months of 2004 this percentage rose to 72.1%
CONCENTRATION OF NEW GDLs SHOWS A GREATER IMPACT OF SMALL CORPORATES RELATIVE TO 2003
Source: UBI
New GDLs excluding the ten largest positions
New GDLs
100%
2004 to-date2003
67,8%
100%
72,1%

32
DEFAULT RATES ARE OVER-REPRESENTED IN CYCLICAL SECTORS
Branch of economic activity
Strongly cyclical activitiesTEXTILE / LEATHER / FOOTWEAR / AND CLOTHES PRODUCTIONAGRICULTURAL AND INDUSTRIAL MACHINERY PRODUCTIONMETAL PRODUCTS EXCLUDING MACHINERY / TRANSPORTELECTRICAL MATERIAL AND SUPPLIESOTHER INDUSTRIAL PRODUCTS TRANSPORT PRODUCTS CHEMICAL PRODUCTSRUBBER AND PLASTIC
OFFICE MACHINERY FOR DATA ELABORATION / AND PRECISION MACHINERY
BUILDING AND PUBLIC WORKS AGRICULTURE/ SILVICOLTURE / AND FISH
SERVICES CONNECTED TO TRANSPORTSCOMMERCE / RECOVERIES / REPAIRS SERVICES OTHER SALE ORIENTED SERVICESSERVICES OF INNER TRANSPORTATIONSHOTEL SERVICES / OTHER PUBLICS EXERCISESTRANSPORT MARINE AND AERIAL SERVICES
COMMUNICATIONS SERVICES
VolumeShare
DefaultShare
4.7% 7.9%3.8% 7.3%3.5% 5.3%3.3% 3.8%3.3% 4.4%1.3% 3.7%2.0% 2.6%1.5% 2.0%1.2% 0.9%
7.7% 9.6%1.3% 0.7%
2.6% 12.9%12.6% 13.3%14.4% 13.9%0.8% 1.1%1.2% 0.6%0.6% 0.4%1.1% 0.0%
FOOD / BEVERAGES / AND TOBACCO PRODUCTS PAPER / PRESS AND EDITORIAL PRODUCTS
MINERAL AND NOT FERROUS MINERAL PRODUCTS MINERALS AND FERROUS METALS AND NON FERROUS ONES
3.8% 3.0%1.4% 2.3%
2.7% 2.0%2.2% 0.5%
Cyclical activities
Anti-cyclical activities
Other activities
Services
Source: UBI
ENERGY PRODUCTS 3.7% 0.1%
33
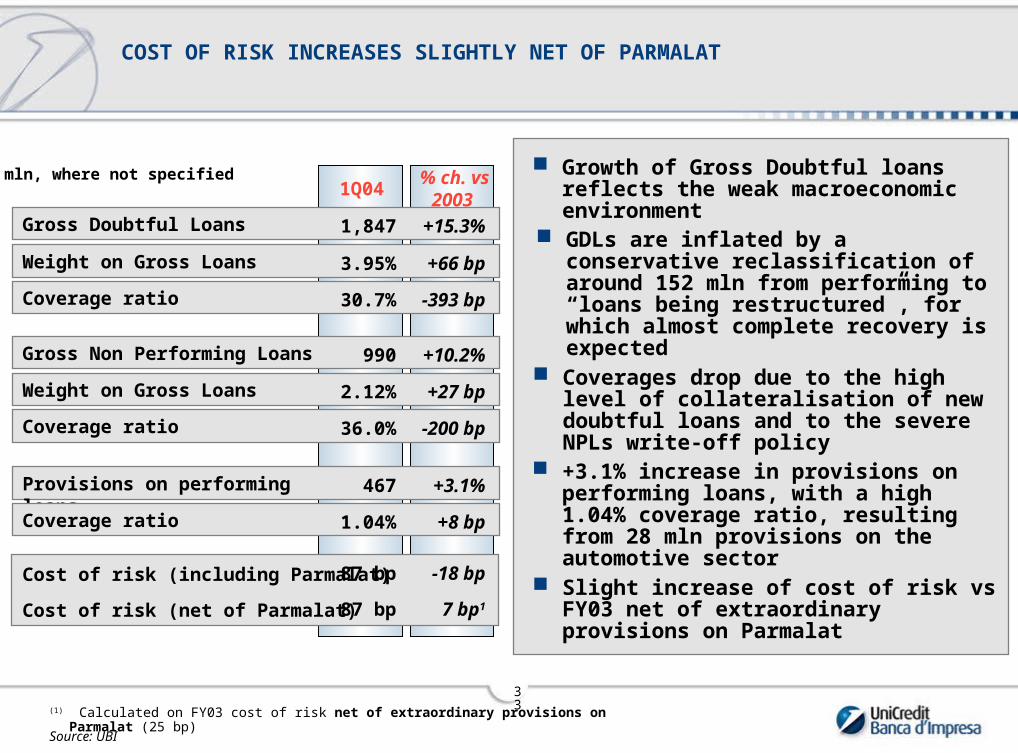
COST OF RISK INCREASES SLIGHTLY NET OF PARMALAT
Coverage ratio 36.0% -200 bp
1Q04% ch. vs
2003
Provisions on performing loans 467 +3.1%
Coverage ratio 1.04% +8 bp
Gross Doubtful Loans 1,847 +15.3%
Coverage ratio 30.7% -393 bp
Cost of risk (including Parmalat) 87 bp -18 bp
Weight on Gross Loans 3.95% +66 bp
mln, where not specified
Gross Non Performing Loans 990 +10.2%
Weight on Gross Loans 2.12% +27 bp
(1) Calculated on FY03 cost of risk net of extraordinary provisions on Parmalat (25 bp)
Cost of risk (net of Parmalat) 87 bp 7 bp1
Growth of Gross Doubtful loans reflects the weak macroeconomic environment
+3.1% increase in provisions on performing loans, with a high 1.04% coverage ratio, resulting from 28 mln provisions on the automotive sector
Slight increase of cost of risk vs FY03 net of extraordinary provisions on Parmalat
GDLs are inflated by a conservative reclassification of around 152 mln from performing to “loans being restructured”, for which almost complete recovery is expected
Coverages drop due to the high level of collateralisation of new doubtful loans and to the severe NPLs write-off policy
Source: UBI

34
1Q04(including write-offs)
COVERAGE LEVELS EXPLAINED BY CONSERVATIVE RECLASSIFICATION AND WRITE-OFFS
Coverage ratio 73.9%
1Q04Net of new
restructured loans
Gross Doubtful Loans 1,847 1,695
Coverage ratio 30.7% 33.2%
mln, where not specified
Gross Non Performing Loans 2,418
Conservative “loans being restructured” reclassification of around 152 mln in 1Q04 weighed on the GDLs coverage ratio
Net of this effect, the ratio improved by around 250 bp
Write-offs of highly covered positions have a negative impact on coverage figures
Summing up write-offs both to NPLs stock and provisions, NPLs coverage gross of write-offs shows a very conservative provision policy
75.9%
2,226
1Q03(including write-offs)
mln, where not specified
Source: UBI

35
Ferdinando Samaria – UBM Chief Financial Officer
Focus on Revenue Diversification and Financial Risk Management
AGENDA

36
Conceived in 1998, formally spun off in 2000 569 employees, average age 35 S&P Rating: AA- Gross Revenues: EUR 770m Net income: EUR 340m Average daily VaR: EUR 4.4m ROE: 61% Net income/employee: EUR 598k
Derivatives portfolio’s outstanding notional > €1000b Outstanding trades > 200,000 Total risk factors > 40,000 Total web transactions on capital guaranteed products > 500,000 Number of daily trade revaluations > 15m
KEY FACTS – UBM AS OF 31 DEC 2003
COMPANY PROFILE
SOME TRADING BOOK STATISTICS
Regulatory Capital Requirements
-
200
400
600
800
1,000
1,200
Mar-03 Jun-03 Sep-03 Dec-03
EU
R/m
37
UBM has completed the merger with TradingLab, the bank dedicated to providing UniCredito retail customers with financial products and services
The merged trading book, particularly in equity derivatives, becomes one of Europe’s largest
Synergies in terms of pricing capability and risk management
Some savings in infrastructure costs
Negotiating with regulators extension of internal model to TradingLab books
Increased overall ability to generate diversified revenues
UBM AFTER MERGER WITH TRADINGLAB
38
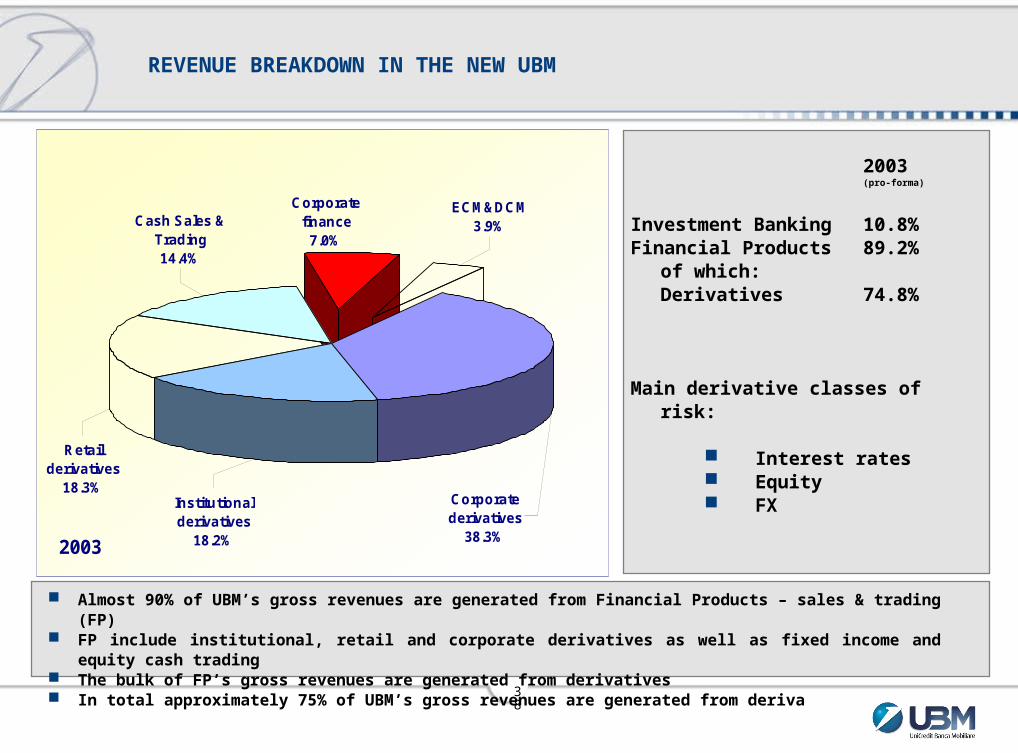
2003
ECM&DCM3.9%
Corporate finance
7.0%Cash Sales &
Trading14.4%
Retail derivatives
18.3%Institutional derivatives
18.2%
Corporate derivatives
38.3%
Almost 90% of UBM’s gross revenues are generated from Financial Products – sales & trading (FP) FP include institutional, retail and corporate derivatives as well as fixed income and equity cash trading The bulk of FP’s gross revenues are generated from derivatives In total approximately 75% of UBM’s gross revenues are generated from derivatives
REVENUE BREAKDOWN IN THE NEW UBM
2003(pro-forma)
Investment Banking 10.8%Financial Products 89.2%
of which:Derivatives74.8%
Main derivative classes of risk:
Interest rates Equity FX

39
FOCUS ON FINANCIAL PRODUCTS
UBM has completed the merger with TradingLab, the bank dedicated to providing UniCredito retail
From the beginning of operations, market risk management has been a distinctive element in UBM
Derivative products are traded on all asset classes
Ability to address a broad segment of corporate and institutional customers with innovative financial products
Core skills in pricing, hedging and trading
Products are unbundled into elementary risk components by proprietary pricing models and hedged through wholesale markets
Limited back-to-back trading
Industrial approach: large volumes, high throughput, efficient time-to-market
UBM transforms derivatives risks into market, model, counterparty and operational risks

40
UBM
CLIENT1
CLIENT2
CLIENTn
CTPY1
CTPY2
CTPY3
CTPYm
DERIVATIVE PRODUCT
SALES TRADINGRISK
MANAGEMENT
OPERATIONAL
RISK
MARKET
RISK
MODEL
RISK
COUNTERPARTY
RISK
THE RISK MANAGEMENT STAGES

41
Daily VaR vs P&L
-7
-5
-3
-1
1
3
5
7
Date
P&
L (
EU
R/m
)
PL
VaR
MARKET RISK
UBM’s portfolio affected by more than 40,000 risk factors VaR calculated daily through a proprietary VaR engine via historical simulation VaR parameters: 99% double-tail confidence level, 1-day holding period, daily update
of time series VaR model has been validated by Italian regulators for capital requirement purposes
UBM daily VaR limit is €7m, against a one-year average of €4.4m (max €6.6m)
Daily back-testing against “clean” P&L series as well as crash/stress tests
42
Market Surface
1
3
5
7
9
12
3.0
%3
.5%
4.0
%4
.5%
4.8
%5
.0%
5.5
%6
.0%
7.0
%8
.0%
9.0
%
10%11%12%13%14%15%16%17%18%19%20%21%22%23%24%25%
Maturity
Strike
10.
0%
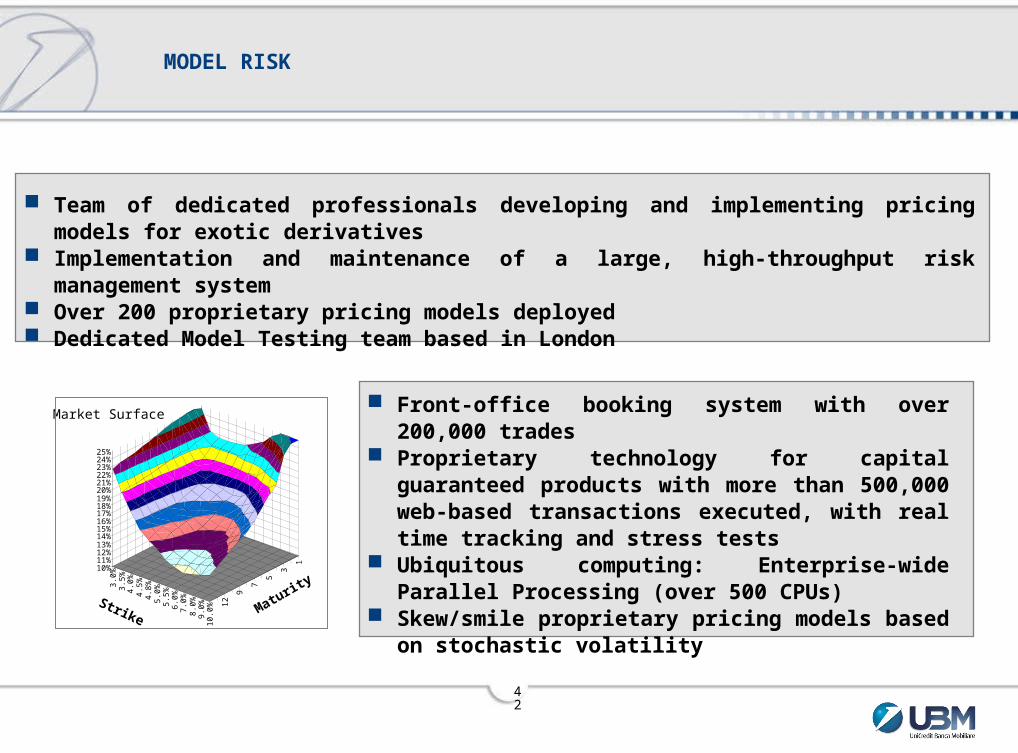
Team of dedicated professionals developing and implementing pricing models for exotic derivatives
Implementation and maintenance of a large, high-throughput risk management system Over 200 proprietary pricing models deployed Dedicated Model Testing team based in London
Front-office booking system with over 200,000 trades Proprietary technology for capital guaranteed
products with more than 500,000 web-based transactions executed, with real time tracking and stress tests
Ubiquitous computing: Enterprise-wide Parallel Processing (over 500 CPUs)
Skew/smile proprietary pricing models based on stochastic volatility
MODEL RISK

43
MEASURING COUNTERPARTY RISK
Derivative portfolio size > €1,000b Market risks are hedged through OTC trades with other market counterparties Traditionally counterparty risk has been monitored using fixed coefficients Need to quantify the effective cost of substitution The cost of substitution is the value of each trade increased by the potential variation that
may occur Estimate the cost of substitution as the marked-to-market valuation plus a simple add-on
METHOD’S ADVANTAGES
Quantifies more accurately the real counterparty risk Uses standard product control techniques Can be used with risk mitigation tools such as close-out netting and collateral agreements When using netting, portfolio diversification is captured Dynamic methodology in line with market variations More in line with market practice and central bank models Can bring in market risk techniques (substitution of the simple add-on with VaR)
COUNTERPARTY RISK

44
ASSESSING AND CONTROLLING OPERATIONAL RISK
Operational risk is defined as the risk of losses resulting from inadequate or failed internal processes, people and systems or from external events. This definition includes legal risk, but excludes strategic and reputational risk (Basel, September 2001)
Risk control is achieved through process mapping, risk assessment and business process reengineering
The “Operational risk control” project is an on-going activity that advances by gradual improvements
Main steps: Definition of roles and responsibility Implementation of techniques of process analysis and representation Application development to support historical loss data collection Study of risk assessment methodology to influence business process and
control reengineering
OPERATIONAL RISK
Recommended