Trends in Biodiversity Indicators

Significant Technical Help:
• Keith Olsen• Etsuko Nonaka• Rob Pabst• Rebecca Kennedy• Jonathan Brooks• Mike McGrath• Matt Gregory

Northern Spotted Owl1996

Northern Spotted OwlBase Policy - 2046
Northern Spotted OwlBase Policy - 2096
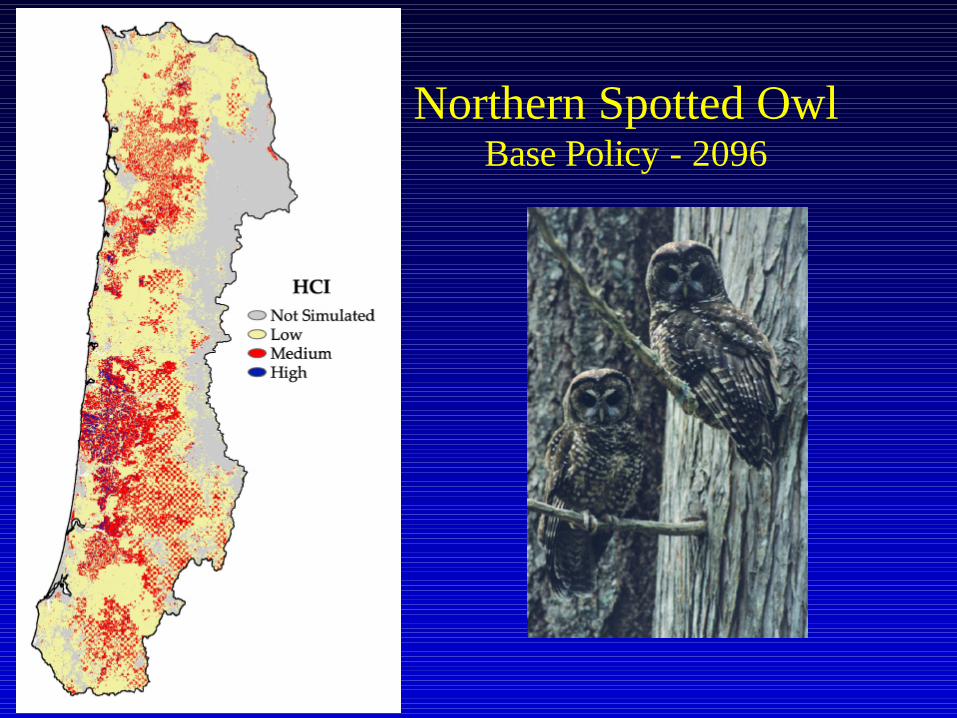
Western Bluebird1996

Western BluebirdBase Policy - 2046

Western BluebirdBase Policy - 2096

Olive-Sided Flycatcher1996

Olive-Sided FlycatcherBase Policy - 2046
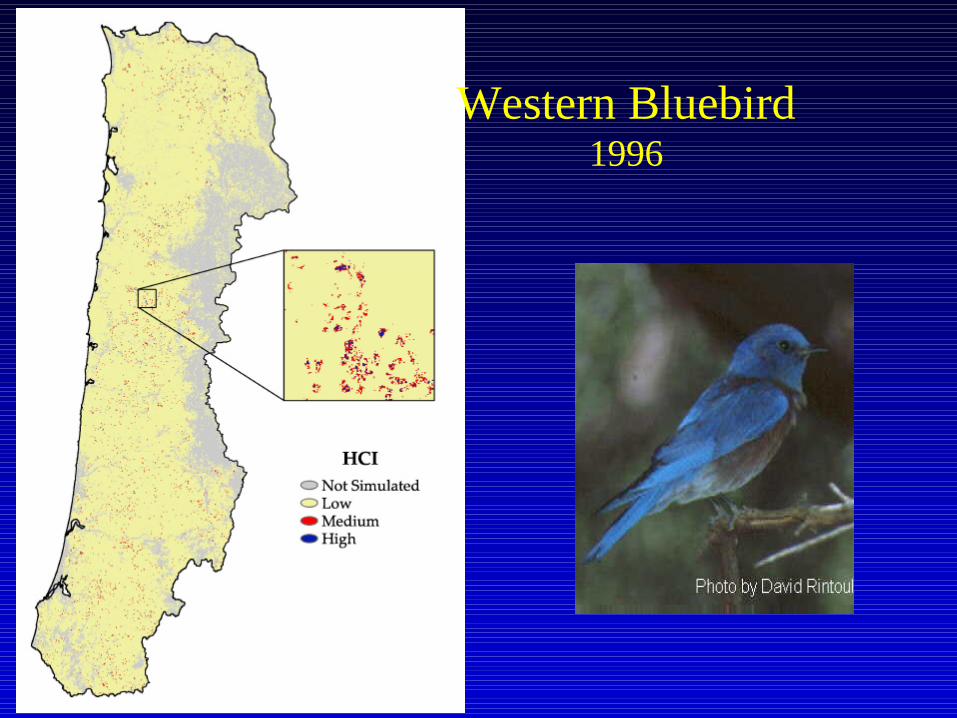
Olive-Sided FlycatcherBase Policy - 2096

Old-Growth Habitat1996
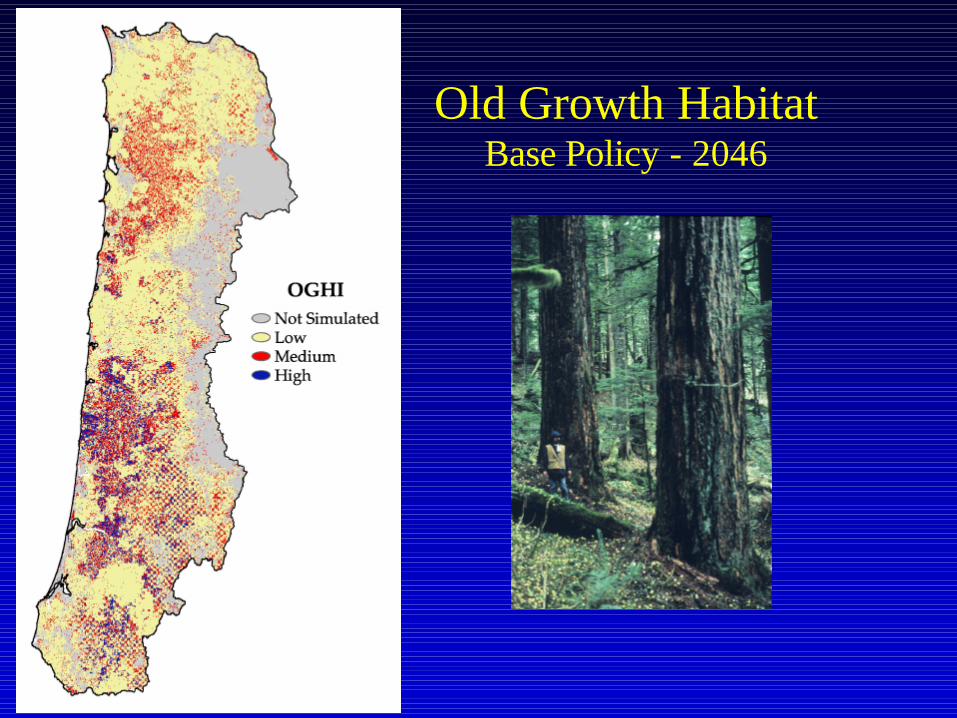
Old Growth HabitatBase Policy - 2046
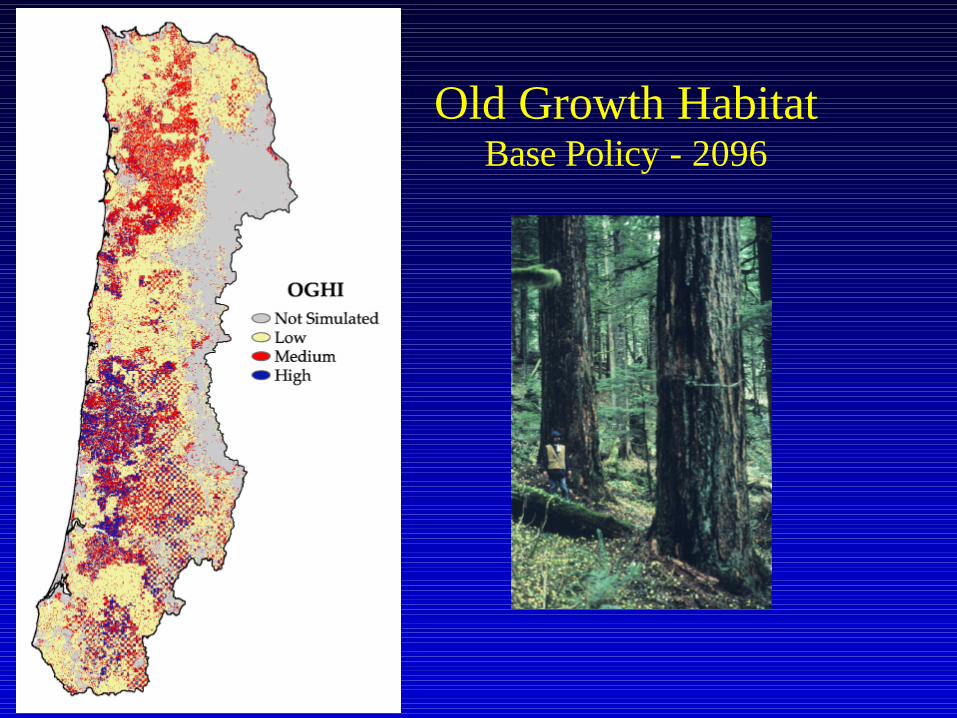
Old Growth HabitatBase Policy - 2096
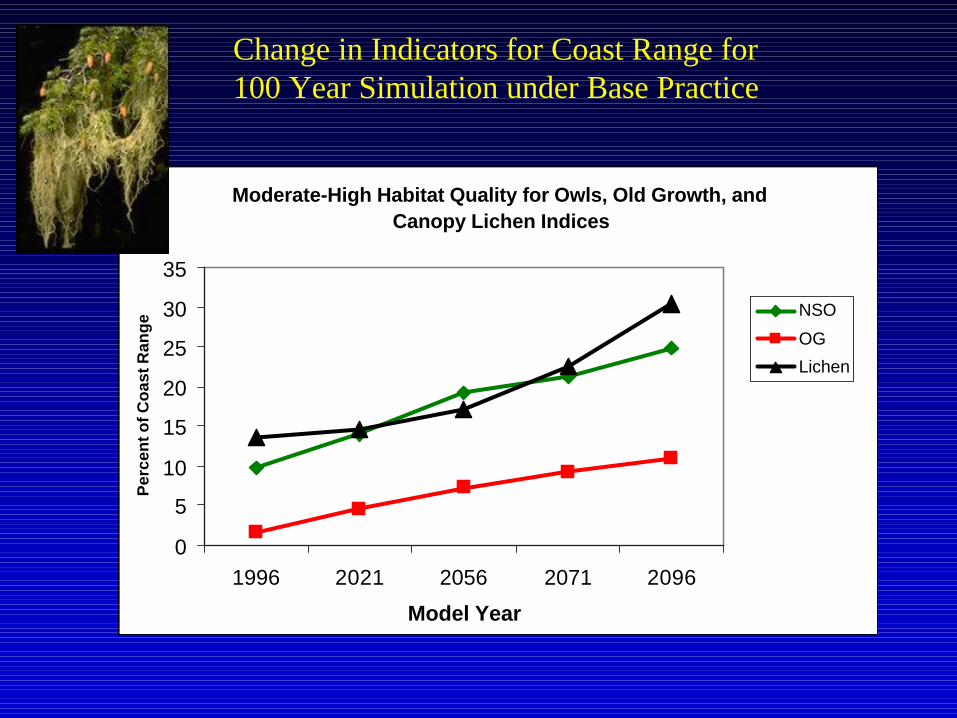
Moderate-High Habitat Quality for Owls, Old Growth, and Canopy Lichen Indices
0
5
10
15
20
25
30
35
1996 2021 2056 2071 2096
Model Year
Per
cen
t of C
oas
t Ran
ge NSO
OG
Lichen
Change in Indicators for Coast Range for 100 Year Simulation under Base Practice

Low-Moderate Habitat Quality for Western Bluebird and Olive-sided Flycatcher Indices
0
5
10
15
20
25
30
1996 2021 2056 2071 2096
Model Year
Per
cen
t of C
oas
t Ran
ge
WBB
OSFC
Change in Percent of Habitat for Coast Range for 100 Year Simulation under Base Practice

Thinning effects at Landscape Scales
Simulate Federal LandsWith and without Thinning

Area of Stands with Mean Diameter > 75 cm (30 in)
050000
100000150000200000250000300000350000400000
initial 25 50 75 100
Simulation Age
Hec
tare
s
Base
NFT
Comparison of Federal Thin and No-Thin AlternativesEntire Coast Range
58,000 ha
143,000 ac}

Wildlife Tree Retention Effects
Simulate Increased Rentention on Private Lands
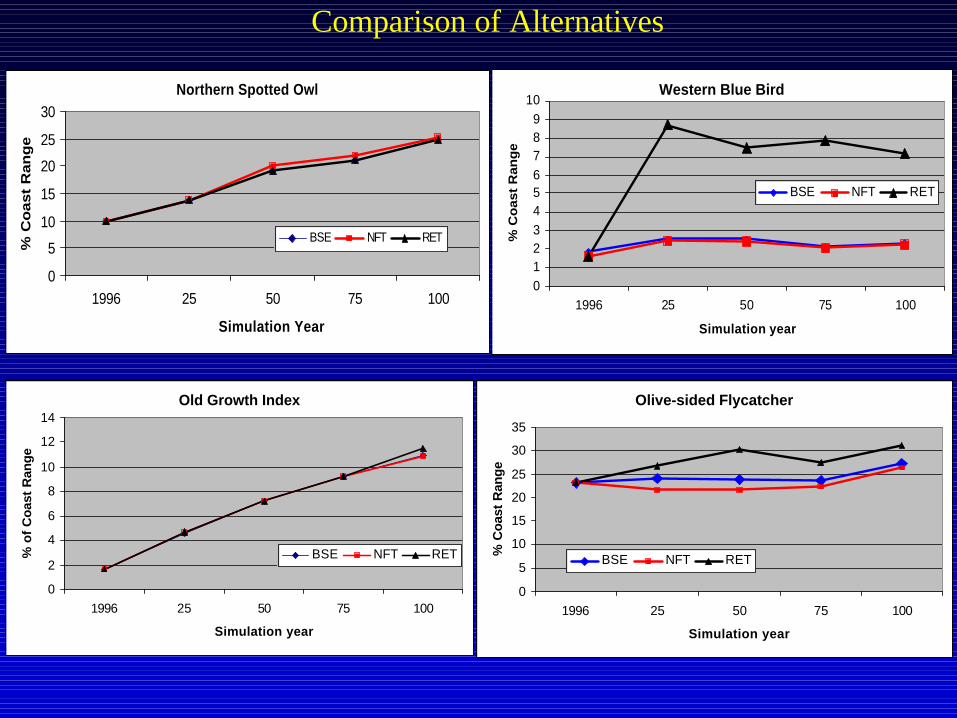
Western Blue Bird
0123456789
10
1996 25 50 75 100
Simulation year
% C
oas
t R
ang
e
BSE NFT RET
Northern Spotted Owl
0
5
10
15
20
25
30
1996 25 50 75 100
Simulation Year
% C
oast
Ran
ge
BSE NFT RET
Old Growth Index
0
2
4
6
8
10
12
14
1996 25 50 75 100
Simulation year
% o
f C
oas
t R
ang
e
BSE NFT RET
Olive-sided Flycatcher
0
5
10
15
20
25
30
35
1996 25 50 75 100
Simulation year
% C
oas
t R
ang
e
BSE NFT RET
Comparison of Alternatives

Ownership Patterns

0
200000
400000
600000
800000
1000000
Fed PI PNI+other State
Ownership
Are
a (h
a) high
moderate
low
Area of Habitat by Ownership and Quality at 100 years for Base Practice

0
200000
400000
600000
800000
1000000
Fed PI PNI+other State
Ownership
Are
a (h
a) high
moderate
low
Area of Bluebird Habitat by Ownership and Quality at 100 years for Base Practice
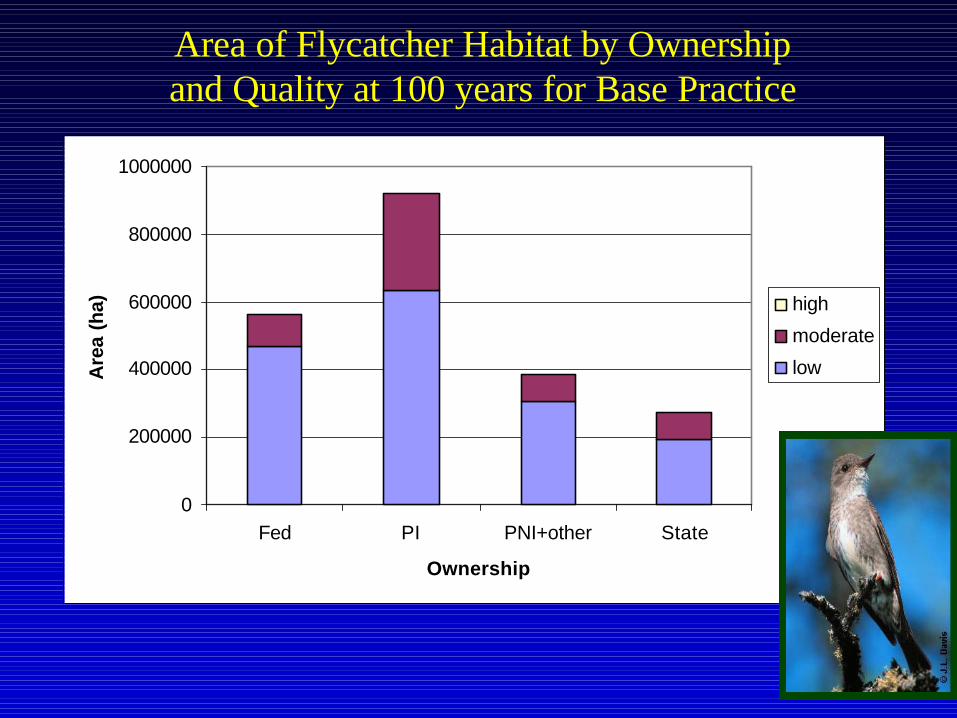
0
200000
400000
600000
800000
1000000
Fed PI PNI+other State
Ownership
Are
a (h
a) high
moderate
low
Area of Flycatcher Habitat by Ownership and Quality at 100 years for Base Practice

Canopy Lichen Potential
0
200000
400000
600000
800000
1000000
Fed PI PNI+other State
Ownership
Are
a (h
a) high
moderate
low
Area of Habitat by Ownership and Quality at 100 years for Base Practice

0
200000
400000
600000
800000
1000000
Fed PI PNI+other State
Ownership
Are
a (h
a)
high
midhigh
midlow
low
Area of Old Growth Habitat by Ownership and Quality at 100 years for Base Practice

1996
0
10
20
30
40
50
60
70
80
0-50 50-100 100-150 150-200 200-250 250-300 300+
Age Class
Per
cent
Lan
dsca
pe100 years
0
10
20
30
40
50
60
0-50 50-100 100-150 150-200 200-250 250-300 300+
Age Class
Per
cen
t la
nd
scap
e
Age Class DistributionCurrent and After
100 years--Base Practice

0
20000
40000
60000
80000
100000
120000
140000
1 6 11 16 21 26 31 36 41 46 51 56 61 66 71 76 81 86 91
HCI
Hec
tare
s
Distribution of Old-Growth Index in 1996 for Coast Range
0
20000
40000
60000
80000
100000
120000
140000
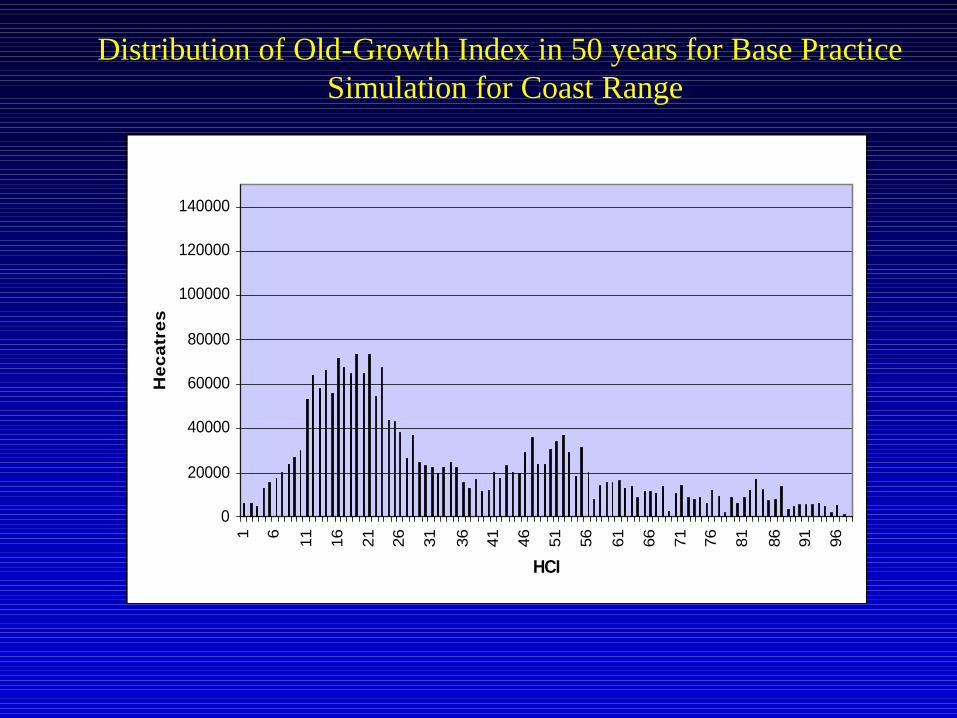
1 6 11 16 21 26 31 36 41 46 51 56 61 66 71 76 81 86 91 96
HCI
He
ca
tre
s
Distribution of Old-Growth Index in 50 years for Base Practice Simulation for Coast Range

0
20000
40000
60000
80000
100000
120000
1400001 6 11 16 21 26 31 36 41 46 51 56 61 66 71 76 81 86 91 96
HCI
Hec
tare
s
Distribution of Old-Growth Index in 100 years for Base PracticeSimulation for Coast Range

LandscapePatterns

Vegetation Classes2096 – Projected
Base Policy
Not SimulatedOpen ForestBroadleafMixed SmallMixed MediumMixed LargeMixed Very LargeConifer SmallConifer MediumConifer Large Conifer Very LargeMixed Very SmallConifer Very SmallRemnants

Vegetation Classes2096 – Projected
Base Policy
Not SimulatedOpen ForestBroadleafMixed SmallMixed MediumMixed LargeMixed Very LargeConifer SmallConifer MediumConifer Large Conifer Very LargeMixed Very SmallConifer Very SmallRemnants

Vegetation Classes2096 – Projected
Base Policy
Not SimulatedOpen ForestBroadleafMixed SmallMixed MediumMixed LargeMixed Very LargeConifer SmallConifer MediumConifer Large Conifer Very LargeMixed Very SmallConifer Very SmallRemnants

Conclusions
Area of mature and old-growth forest and habitat for associated Species is expected to increase strongly over the next 100 years
Low amounts of habitat for species requiring open structurallyDiverse forests—trends are flat
Despite 100 years amounts of older forest and structural conditions still probably below historical range of variation
Species diversity associated with hardwoods is projected to strongly decline

Conclusions
New landscape patterns developing that haveparticular ecological characteristics
Alternative policies may alter condition ofbiological diversity but further analysis is needed
Recommended