THERMAL TOLERANCE OF JUVENILE PACIFIC SALMON AND
STEELHEAD TROUT IN RELATION TO SUPERSATURATION OF
NITROGEN GAS
WESLEY J. EBEL, EARL M. DAWLEY, AND BRUCE H. MONK'
ABSTRAcr
Thermal tolerance of juvenile chinook salmon (Oncorhynchus tshawytscha) , coho salmon (0. kisutch) , and steelhead trout (Salmo gairdneri) that had been held at various acclimation temperatures was lowered when test water was supersaturated (125-130% of saturation) with nitrogen gas. Increasing the depth of the test tank allowed the fish to compensate somewhat for the supersaturation by sounding, but substantial mortalities still occurred. A comparison of tolerance among the species tested revealed that coho salmon were the most tolerant, chinook salmon next, and steelhead trout the least tolerant to temperature increases in the presence of supersaturation of nitrogen.
During the past several decades, a number of investigators have examined temperature as a lethal factor by use of the classic pharmacological assay method. Fry, Hart, and Walker (1946) recognized the importance of acclimation temperature in determining the tolerance of a fish to high and low temperatures and established upper and lower levels of tolerance at various acclimation temperatures. Brett (1952) listed maximum temperatures for survival of young Pacific salmon (Oncorhynchus spp.) between 23.8 and 25.1 0 C. In later work (Brett, 1958), he emphasized temperatures below those at which a fish dies and constructed hypothetical temperature polygons which described lower levels of temperature tolerance where activity, growth, and spawning would be affected.
More recently, investigators have emphasized the response of fish to temperature changes under multivariate conditions. Many factors such as dissolved oxygen deficits, carbon dioxide increases, and increases in toxic substances all affect an aquatic organism's tolerance to temperature increases. Mihursky and Kennedy (1967) stressed the importance of multivariate experiments for establishing more realistic standards for temperature regulation.
, National Marine Fisheries Service, Biological Laboratory, Seattle, Wash. 98102.
Manuscript accepted June t97 I. FISHERY BULLETIN: VOL. 69, NO.4, 1971.
Several nuclear power plants have been proposed for the Columbia River. The National Marine Fisheries Service (NMFS) is particularly concerned about the effect that heated effluents from these plants might have on juvenile Pacific salmon and steelhead trout (Salmo gairdneri) migrating downstream, particularly while they are stressed by supersaturated nitrogen gas. High levels of nitrogen gas (over 125% saturation) occur within large areas of the Columbia from about early May until mid-August (Ebel, 1969). This period coincides with the downstream migration of most juvenile salmon and trout. Although the effect of supersaturation of gas on juvenile salmon and trout has not been examined in great detail, preliminary studies by Ebel (1969) clearly show that Columbia River juvenile salmon have considerably lower tolerance to temperature increases when stressed by supersaturation of nitrogen than the tolerance indicated by Brett (1952).
The Federal Water Quality Administration (FWQA) recognized that supersaturation of dissolved nitrogen could be a significant factor in establishing water quality criteria for the Columbia River. It therefore contracted the Bureau of Commercial Fisheries (BCF; presently designated as NMFS) to determine the changes in tolerance of juvenile salmon and trout to temperature increases at different levels
833

of temperature acclimation and supersaturation of nitrogen. In the experiments described in this report, BCF personnel sought to determine the change in tolerance of juvenile salmon and trout to temperature increases when stressed by supersaturation of nitrogen and to determine possible changes in tolerance if they had the option to sound to different depths. Ebel (1969) reported that the depth at which fish migrate influences the effect of supersaturation of nitrogen because the gas remains in solution at a much higher concentration when under pressure; we therefore considered depth as well as temperature increase and supersaturation of nitrogen to be important.
Our first series of experiments describe the effect of supersaturation of nitrogen and temperature increases at surface pressures. Later experiments show how depth changes the above effect.
METHODS
The general approach used to determine the effect of nitrogen supersaturation on the tolerance of juvenile salmon and trout to increased temperature was similar to that used by Brett (1952). Stocks were acclimated to temperatures identical to those used by Brett; test temperatures encompassed the ranges Brett used in his lethal temperature determinations. These test and acclimation temperatures were purposely selected so that changes in tolerance caused by the stress of supersaturated nitrogen could be compared with Brett's well-established levels of temperature tolerance.
Groups of 20 test fish, each acclimated to a given temperature, were placed simultaneously in control and test situations involving identical test temperatures at treatments of high (125130%) and normal (100%) nitrogen saturation. Two acclimation groups were used in each set of tests--one that had a normal acclimation history and one that had been exposed to supersaturated nitrogen for 720 min. Observations of behavior and mortality were made continuously for the first 6 hr, then every hour for the remainder of an 18-hr period. Events recorded were times to first indication of stress, to loss
FISHERY BULLET!N: VOL. 69, NO.4
of equilibrium, and to death. The numbers of live and dead fish with obvious external symptoms of gas bubble disease were recorded at the termination of tests. All tests were then repeated (most tests were duplicated, some were done three times); the data given in this report are derived from the average value of the duplicated tests.
Hatchery and wild stocks of fish were tested. Hatchery fish were from the following stocks: coho salmon (0. kisutch) reared at Leavenworth National Fish Hatchery, Leavenworth, Wash.; spring chinook salmon (0. tshawytscha) reared at Little White Salmon National Fish Hatchery, White Salmon, Wash.; and steelhead trout reared at the Washington State Fish Hatchery at Green River, Cumberland, Wash. The wild fish (spring chinook salmon) were collected from the turbine intake gatewells at McNary Dam on the Columbia River. Because of time limitations and lack of sufficient populations of fish, only the coho were tested through the entire range of acclimation temperatures (5, 10, 15, and 20° C). Hatchery-reared steel head trout and hatchery and wild spring chinook were tested only after exposure at selected acclimation temperatures-steelhead at acclimation temperatures of 10° and 15° C and wild chinook at 10° C.
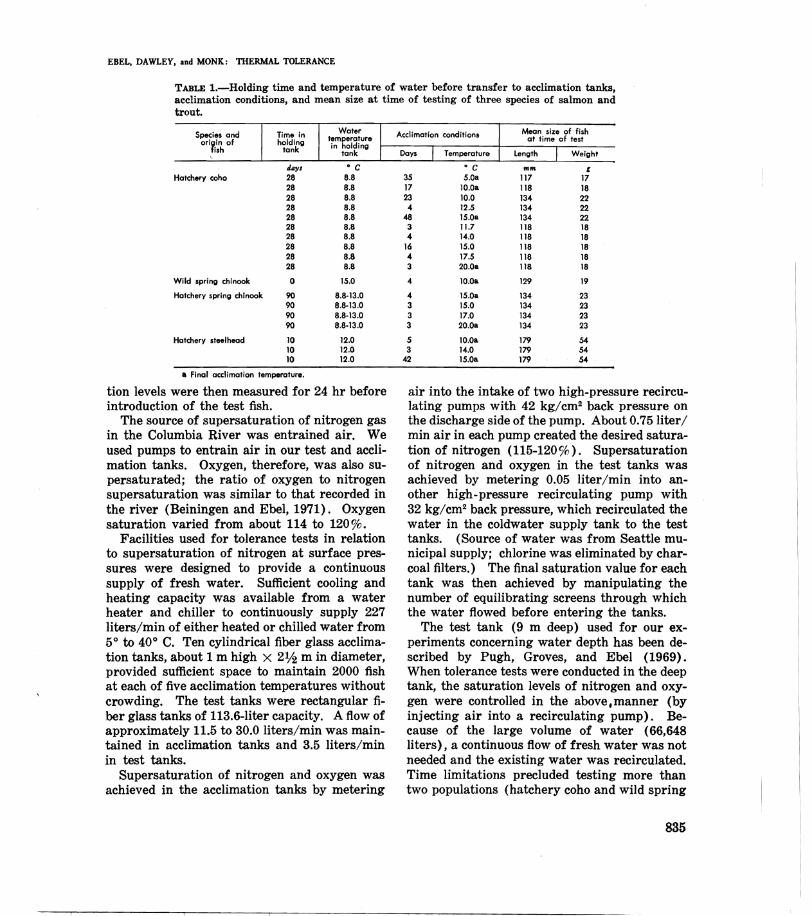
The experimental temperatures (test and acclimation), lengths of time that the various groups of fish were in holding and acclimation tanks, and size of fish at time of testing are summarized in Table 1. Water in test tanks was adjusted to the appropriate test temperatures established for each acclimation temperature. Temperatures were maintained within ±0.2° C in both test and acclimation tanks. When the test series required stressing of the acclimated fish with supersaturated nitrogen, an acclimation tank at the appropriate temperature was saturated at 115 to 120% nitrogen and about 114 to 120% oxygen. The fish were then transferred from the normally saturated tank (100%) to the supersaturated tank and stressed for 720 min. When supersaturated water was needed in the test tanks, the supersaturating equipment was activated, and each tank was adjusted to maintain between 125 and 130% nitrogen. To ensure stability, the temperatures and satura
834
EBEL. DAWLEY. and MONK: TIlERMAL TOLERANCE
TABLE 1.-Holding time and temperature of water before transfer to acclimation tanks, acclimation conditions, and mean size at time of testing of three species of salmon and trout.
Mean size of fish at time of test
Temperature Length Weight
daYI • C • C 10m , Hatchery coho 28 8.8 35 5.0a 117 17
28 8.8 17 10.0a 118 18 28 8.8 23 10.0 134 22 28 8.8 4 12.5 134 22 28 8.8 48 15.0a 134 22 28 8.8 3 11.7 118 18 28 8.8 4 14.0 118 18 28 8.8 16 15.0 118 18 28 8.8 4 17.5 118 18 28 8.8 3 20.0a 118 18
Wild spring chinook 0 15.0 4 10.0a 129 19
Hatchery spring chinook 90 8.8·13.0 4 15.0a 134 23 90 8.8·13.0 3 15.0 134 23 90 8.8-13.0 3 17.0 134 23 90 8.8·13.0 3 20.0a 134 23
Hatchery steel head 10 12.0 5 10.0a 179 54 10 12.0 3 14.0 179 54 10 12.0 42 15.0a 179 54
a Final acclimation temperature.
tion levels were then measured for 24 hr before introduction of the. test fish.
The source of supersaturation of nitrogen gas in the Columbia River was entrained air. We used pumps to entrain air in our test and acclimation tanks. Oxygen, therefore, was also supersaturated; the ratio of oxygen to nitrogen supersaturation was similar to that recorded in the river (Beiningen and Ebel, 1971). Oxygen saturation varied from about 114 to 120%.
Facilities used for tolerance tests in relation to supersaturation of nitrogen at surface pressures were designed to provide a continuous supply of fresh water. Sufficient cooling and heating capacity was available from a water heater and chiller to continuously supply 227 liters/min of either heated or chilled water from 50 to 40 0 C. Ten cylindrical fiber glass acclimation tanks, about 1 m high X 2lf2 m in diameter, provided sufficient space to maintain 2000 fish at each of five acclimation temperatures without crowding. The test tanks were rectangular fiber glass tanks of 113.6-liter capacity. A flow of approximately 11.5 to 30.0 liters/min was maintained in acclimation tanks and 3.5 liters/min in test tanks.
Supersaturation of nitrogen and oxygen was achieved in the acclimation tanks by metering
air into the intake of two high-pressure recirculating pumps with 42 kg/cm2 back pressure on the discharge side of the pump. About 0.75 liter/ min air in each pump created the desired saturation of nitrogen (115-120%). Supersaturation of nitrogen and oxygen in the test tanks was achieved by metering 0.05 liter/min into another high-pressure recirculating pump with 32 kg/cm2 back pressure, which recirculated the water in the coldwater supply tank to the test tanks. (Source of water was from Seattle municipal supply; chlorine was eliminated by charcoal filters.) The final saturation value for each tank was then achieved by manipulating the number of equilibrating screens through which the water flowed before entering the tanks.
The test tank (9 m deep) used for our experiments concerning water depth has been described by Pugh, Groves, and Ebel (1969). When tolerance tests were conducted in the deep tank, the saturation levels of nitrogen and oxygen were controlled in the above. manner (by injecting air into a recirculating pump). Because of the large volume of water (66,648 liters), a continuous flow of fresh water was not needed and the existing water was recirculated. Time limitations precluded testing more than two populations (hatchery coho and wild spring
835

FISHERY BULLETIN: VOL. 69. NO.4
chinook salmon) at 10° C acclimation temperature.
EFFECT OF SUPERSATURATION OF NITROGEN GAS ON TOLERANCE OF FISH TO TEMPERATURE INCREASES
Supersaturation of nitrogen (125-130%) in the test tanks lowered the tolerance of all fish to temperature increases at all acclimation temperatures when tested below 26 0 C (Tables 2-10). More than 50),c mortality occurred within 18 hr even with no temperature increase when the test tanks were supersaturated at this level. Time to death of fish was accelerated regardless of acclimation temperature.
A comparison of LE50 (exposure time when 50% of the population is dead) curves developed under the four treatment levels indicates that a prior stress of 115 to 120% saturation for 12 hr did not greatly affect the fish when they were subjected to temperature increases in water saturated at 100% (Figure 1). When these
TABLE 2.-Mean values" of lethal exposure time (in min-utes) for coho salmon that had been acclimated to 5° C water temperature and then subjected to various in-creases in water temperature and saturation of nitrogen gas.
Dead fish in sample
25
One fish NN 125 15.5 NS 525 412 380 230 85 14 5N 102 8 55 250 330 197 112 35 10
Three fish NN 167 20.5 N5 615 457 405 270 108 16.5 SN 270 12 S5 483 435 315 128 137 13
Half of sample NN 300 27 NS 810 605 577 390 266 21.5
SN 20 55 626 580 435 229 186 20
All of sample NN 64 f'ols 990 1,080 420 58 SN 60 S5 840 450 445
a Mean of replicated tests. b NN = normal soturation (100%) of nitrogen gas in acclimation and
test tanks; NS = normal saturation in acclimation tank and supersaturation
(125-130%) in test tanks; SN = supersaturation in acclimation tank and normal saturation in
test tonks; S5 = supersaturation in acclimation and test tanks.
TABLE 3.-Mean values' of lethal exposure time (in minutes) for coho salmon that had been acclimated to 10° C water temperature and then subjected to various increases in water temperature and saturation of nitrogen gas.
Dead fish in sample
27
One fish NN 130 4 NS 773 413 360 215 130 6 5N 135 455 770 407 340 155 125 12
Tnree fish NN 100 <5 N5 877 472 517 297 152 16 SN 67 7.SS5 960 480 382 225 95 15
Half of sample NN 167 15 N5 1,085 540 550 192 23 5N 232.5 16.5S5 960 480 480 282.5 193.5 35.5
All of sample NN 215 32.5 N5 255 72.5 5N 255 3555 1.050 750 395 70
a Mean of replicated tests. b NN = normal saturation (1000/0) of nitrogen gas in acclimation and
test tanks; NS = normal saturation in acclimation tank and supersaturation
(125-130%) in test tanks; SN = s"persaturation in acclimation tank and normal saturation in
test tanks; 5S = supersaturation in acclimation and test tanks.
TABLE 4.-Mean valuesa of lethal exposure time (in minutes) for coho salmon that had been acclimated to 15° C water temperature and then subjected to various increases in water temperature and saturation of nitrogen gas.
Dead fish in sample
28
One fish NN 26.5 8.5 NS 420 265 2,325 222.5 38.5 7 5N 255 23 10 SS 70 36 45 29.5 17.5 12.5
Three fish NN 50 10.5
NS 430 295 297 245 51.5 14 SN 705 30 14 SS 175.5 78.5 62.5 38.5 32.5 18
Half of sample NN 62 13.5 NS 555 502.5 517.5 645 79 20.5
SN 855 70 24.5
55 247 115 124.5 86 52.5 38
All of sample NN 93 37 N5 115 46 SN 460 520 930 910 115 48 SS 519 450 465 312.5 96 38
a Mean of replicated tests. b NN = normal saturation (100%) of nitrogen gas in acclimation and
test tanks; NS = normal saturation in acclimation tank and supersaturation
(125-130%) in test tanks, SN = supersaturation in acclimation tank and normal saturation in
test tanks; 5S = supersaturation in acclimation and test tanks.
836

TABLE 5.-Mean valuesa of lethal exposure time (in minutes) for coho salmon that had been acclimated to 200 C water temperature and then subjected to various increases in water temperature and saturation of nitrogen gas.
Dead fish in sample
29
One fish NN 93 35 14 N5 375 558 400 130 29 11 5N 130 15 47 17 7.5 55 89 20 135 45 13 9.5
Three fish NN 104 47 14 N5 497 510 510 152 38 13 5N 82 34 13 55 180 300 165 69 30 12
Half of sample NN 121.5 60 20 N5 810 780 840 197 43 20 5N 115 53.5 22 55 317.5 570 266 115 42.5 16
All of sample NN 93.5 37 N5 920 1,040 930 910 115 48 5N 115 46 55 619 450 465 307 97 38.5
a Mean of replicated tests. b NN = normal saturation (100%) of nitrogen gas in acclimation and
test tanks; N5 = normal saturation in acclimation tank and supersaturation
(125-130%) in test tanks, 5N = supersaturation in acclimation tank and normal saturation In
test tanks; 5S = supersaturation in acclimation and test tanks.
TABLE 6.-Mean valuesa of lethal exposure time (in minutes) for hatchery spring chinook salmon that had been acclimated to 15° C water temperature and then subjected to various increases in water temperature and saturation of nitrogen gas.
Dead fish in sampl.
28
One fish 5 510 585 375 4.5 450 390 4
32.5 30 30 3
Three fish 255 55 9 510 735 510 198 45 8.5
245 9 6.5 217 190 110 80 11 4
Half of sample NN 360 66 115 NS 675 820 540 255 52.5 10.5 SN 370 39.5 9 SS 315 165 123 122.5 16.5 6
All of sample NN 1.020 88.5 30.5 NS 900 1,080 755 275 97 2S SN 700 78.5 19.5 55 720 780 525 399 50 40.5
EBEL, DAWLEY, and MONK: mERMAL TOLERANCE
a Mean of replicated tests. b NN = normal saturation (100%) of nitrogen gas in acclimation and
test tanks; NS = normal saturation in acclimptlon tank and supersaturation
(125-130%) in test tanks, SN - supersaturation in acclimation tank and normal saturation in
test tanks, SS = supersaturation in acclimation and test tanks.
TABLE 7.-Mean valuesa of lethal exposure time (in minutes) for hatchery spring chinook salmon that had been acclimated to 200 C water temperature and then subjected to various increases in water temperature and saturation of nitrogen gas.
Dead fish in sample
29
One fish 33.5 5 255 150 38.5 9.5
41.5 8.5 5.5 30 30 7.5 10.5 3
Three fish NN 84.5 44.5 6.5 N5 360 345 372 86 43.5 14.5 5N 795 39.5 16 7.5 55 45 67.5 30 28 16.5 4.5
Half of sample NN 95 51.5 8 N5 450 435 570 97 48.5 17 5N 620 66 23 8.5 55 75 176 42.5 44 22 6.5
All of sample NN 153.5 63.5 13.5 N5 780 690 750 133 66 27.5 5N 820 110 46.5 19 55 397 675 600 97.5 52.5 13.5
a Mean of replicated tests. b NN = normal saturation (100%) of nitrogen gas in acclimation and
test tanks, N5 = normal saturation in acclimation tank and supersaturation
(125-130%) in test tanks, 5N = supersaturation in acclimation tank and normal saturation in
test tanks; SS = supersaturation in acclimation and test tanks.
TABLE 8.-Mean valuesa of lethal exposure time (in minutes) for wild spring chinook salmon that had been acclimated to 100 C water temperature and then subjected to various increases in water temperature and saturation of nitrogen gas.
Dead fish in sample
27
One fish 4 600 645 3
98 1 38 35 1
Three fish NN 192.5 27 NS 720 465 43 5N 80 9 SS 660 660 600 780 71.5 6
Half of sample NN 82.5 5 NS 780 405 195 4 SN 1,080 7.5 2 SS 495 187 150 58 7.5 3
All of sample NN 193 27 NS 900 165 43 SN 80 9 SS 870 660 600 780 71 6
a Mean of replicated tests. b NN = normal saturation (100%) of nitrogen gas in acclimation and
test tanks; NS = normal saturation in aed imation tank and supersaturation
(125-130%) in test tonks, SN ~ supersaturation in acclimation tank and normal saturation in
test tanks, SS = supersaturation in acclimation and test tanks.
837

TABLE 9.-Mean valuesa of lethal exposure time (in minutes) for steelhead trout that had been acclimated to 100 C water temperature and then subjected to various increases in water temperature and saturation of nitrogen gas.
Dead fish in sample
25 27
One fish NN 930 458 60 4.5 NS 195 172.5 230 230 60 8.5
5N 360 10 6 6 55 57.5 15 6 6 8.5 5.5
Three fish NN 200 10 N5 280 217 367 320 112 15 5N 206 9 55 76 50 71 52 19 11
Half of sample NN 225 14 N5 307 340 493 450 165 175N 366 14 55 104 75 105 74 38 15
All of sample NN 675 34
N5 660 660 780 690 465 80
5N 52.5 55 347.5 307.5 202.5 202.5 95 30
FISHERY BULLETIN: VOL. 69, NO.4
a Mean of replicated tests. b NN = normal saturation (100%,) of nitrogen gas in acclimation and
test tanks; NS = normal saturation in acclimation tank and supersaturation
(125-130%) in test tanks; SN = supersaturation in acclimation tank and normal saturation in
test tanks; 55 = supersaturation in acclimation and test tanks.
TABLE 10.-Mean valuesa of lethal exposure time (in minutes) for steelhead trout that had been acclimated to 15 0 C water temperature and then subjected to various increases in water temperature and saturation of nitrogen gas.
Deod fish in sample
28
One fish NN 225 23 18 N5 570 480 4BO 207 37.5 15 5N 7 9.5 6 5S 15 25 14 14 4.5
Three fish NN 660 62.5 21 N5 645 570 600 390 53.5 20 5N 151.5 16.5 11.5 55 30 56 30 21.5 14 11
Half of sample NN 75 24 NS 840 630 645 435 58 '23.5 SN 495 23.5 15 55 45 94 52.5 43 19 19
All of sample NN 107.5 42 N5 1,320 870 900 720 Bl.5 34.5 SN 840 127.5 32.5 SS 690 452.5 157.5 225 57.2 24.5
a Mean of replicated tests. b NN = normal saturation (100%,) of nitrogen gas in acclimation and
test tonks; NS normal saturation in acclimation tank and supersaturation
(125·130%) in test tanks; SN = supersaturation in acclimation tank and normal saturation in
test tanks; SS = supersaturation in acclimation and test tanks.
stressed fish were subjected to temperature increases in water supersaturated at 125 to 130%, however, the prior stress significantly decreased their tolerance at temperatures below 26° C.Figure 1 shows only the data from populations acclimated to 15 0 C (Tables 3, 6, and 10), but similar curves that clearly show the effect of supersaturation can be constructed from the data on populations acclimated to the other temperatures.
Populations of coho salmon, steel head trout, and chinook salmon acclimated to higher temperatures were able to tolerate higher temperatures for longer periods in supersaturated water as well as in normally saturated water.A comparison of our LE50 curves for coho with those of Brett (1952) indicates that tolerance to higher temperatures in supersaturated water
---------r------,---------------------------
30 COHO
30 SPRING CHINOOK (HATCHERY REARED)
UJ 25 0: :::>...." 0: 20 UJ Q.
~ UJ ....
15
30 STEELHEAD
20
15
o 120
-- -.toPERCENTAGE SATURATION NITROGEN
AcclimationWater Te.t Water
100 ". 115-120 100 II ~-'20
100 ". 100 -. 12!5~130 --0
12!5-130
720 840240 360 480 600 TIME (minutes)
FIGURE I.-Comparison of LEoo curves of hatchery-reared juvenile coho salmon, spring chinook salmon, and steelhead trout acclimated at 15 0 C and stressed at various levels of nitrogen saturation.
838
EBEL, DAWLEY, and MONK: THERMAL TOLERANCE
was considerably lower at exposures over 100 min for the same acclimation temperature than at normal saturation levels (Figure 2).
A comparison of the NN and SN curves (Figure 1) indicates that the prior stress of supersaturation of nitrogen had little effect on the fish when they were subjected to test water that was not supersaturated. This suggests that migrating salmon and trout under stress from supersaturation of nitrogen gas could recover from the effects of supersaturation if there were river areas where water would equilibrate. These data also show that salmon and trout populations acclimated at 15° C and subjected to nitrogen saturation of 125 to 130 % will probably have about 50% mortality in less than 360 min with no temperature increase when stressed for 12 hr before testing and that subjecting the populations to temperature increases merely reduces the time to death.
In comparing the tolerance to temperature increases between coho and spring chinook salmon, we found that the results from the control testswhere both acclimation and test water were at 100% saturation-were similar to the results of Brett (1952). That is, coho were more tolerant than chinook and the respective upper lethal temperatures were 25 to 26° C. Brett did not study steelhead trout. We found that steelhead trout were nearly identical to coho in their tolerance
30
.u
\oJ
'" I" : ..\oJ .. ~
26
24
22
o
- - _ _ LE~o(Brett 1952)200c-- __
Acclimotioft TemDetohll'e
o
100 200 300 400 500 TIME TO DEATH (minute.)
FIGURE 2.-Median-resistance-time (LE50) plotted from temperature tolerance tests with coho salmon fingerlings acclimated at 5°, 10°, and 20° C and stressed for 12 hr at 115-120% saturation of N2, then subjected to temperature increases in water supersaturated at 125-130%. Brett's LE50 curves for fish acclimated at 5° and 20° Cwithout N2 stress-are shown for comparison.
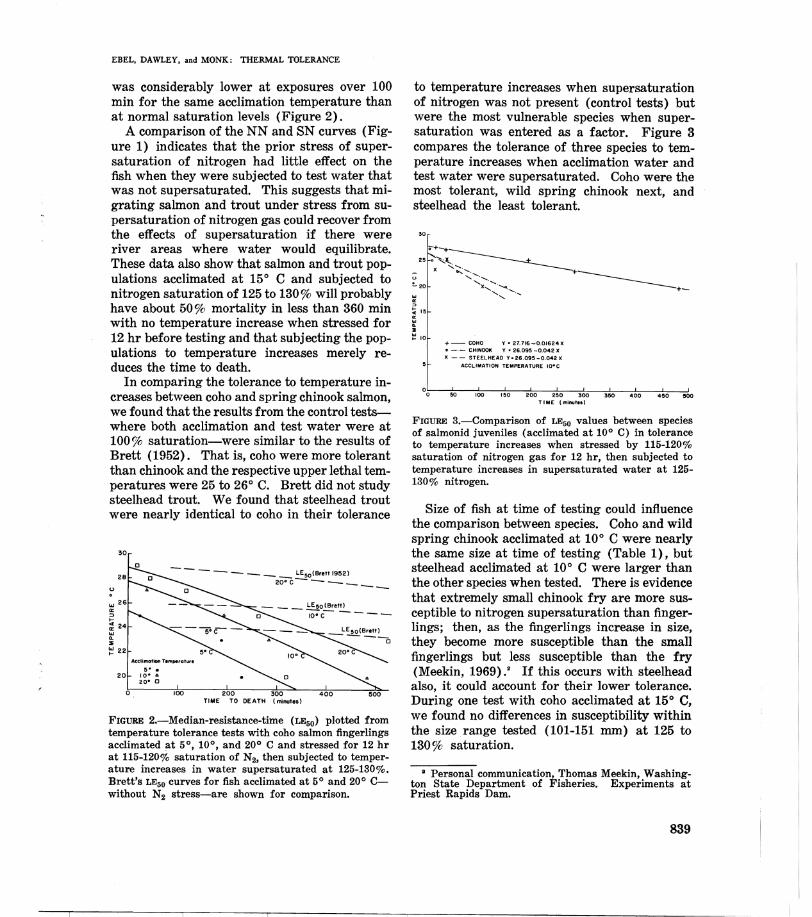
to temperature increases when supersaturation of nitrogen was not present (control tests) but were the most vulnerable species when supersaturation was entered as a factor. Figure 3 compares the tolerance of three species to temperature increases when acclimation water and test water were supersaturated. Coho were the most tolerant, wild spring chinook next, and steelhead the least tolerant.
30
+- COHO Y ~ 27716-0,OI624X o -.- CHINOOK Y 2 26.095 -0.042 X
X - - STEELHEAO '( ~ 26.095 -0.042 X
ACCLIMATION TEMPERATURE IQ-C
°0~~~~~loo~~,.nO~2~00n-~2~'0~~3~OO~~'~~~~'0~O~~4~'O~~'OO TIME (minute.)
FIGURE 3.-Comparison of LEoo values between species of salmonid juveniles (acclimated at 10° C) in tolerance to temperature increases when stressed by 115-120% saturation of nitrogen gas for 12 hr, then subjected to temperature increases in supersaturated water at 125130% nitrogen.
Size of fish at time of testing could influence the comparison between species. Coho and wild spring chinook acclimated at 10° C were nearly the same size at time of testing (Table 1), but steelhead acclimated at 10° C were larger than the other species when tested. There is evidence that extremely small chinook fry are more susceptible to nitrogen supersaturation than fingerlings; then, as the fingerlings increase in size, they become more susceptible than the small fingerlings but less susceptible than the fry (Meekin, 1969).' If this occurs with steelhead also, it could account for their lower tolerance. During one test with coho acclimated at 15° C, we found no differences in susceptibility within the size range tested (101-151 mm) at 125 to 130% saturation.
• Personal communication, Thomas Meekin, Washington State Department of Fisheries. Experiments at Priest Rapids Dam.
839

We intended to compare hatchery-reared chinook salmon with wild or naturally migrating spring chinook salmon acclimated to the same temperature. Wild fish were available only when they were acclimated to temperatures near 10° C. The hatchery population had deteriorated by then, however, so we compared wild fish acclimated at 10° C and hatchery fish acclimated to 15° C (Figure 4). As expected, the hatchery population-acclimated at the higher temperature-was able to tolerate the highest temperatures for a longer period, but when the LE50
curves-which include the effect of nitrogenare compared, little difference can be noted. This indicates that results achieved in the laboratory with hatchery stocks can be applied to wild Columbia River stocks with reasonable accuracy.
SPRING CHINOOK (WILD)
10" C ACCLIMATION
-" -- - ==--~ ......-...:: - - - - - - - - - - - -- - - ---,6
--- ---1080
20
16
U 12
\oJ a: => ... SPRING CHINOOK I HATCHERY REAREO)<f 28 15° C ACCLIMATIONa: \oJ.. \oJ " .... 24 - -.......
...... 20 - ...... ...... .....
16
" PERCENTAGE SATURATION NITROGEN
12
o 120 240 360 480 600 720 840 TIME (minutes)
FIGURE 4.-Comparison of LE50 curves between juvenile wild and hatchery spring chinook salmon at various temperatures and levels of saturation of nitrogen gas.
840
FISHERY BULLETIN: VOL. 69, NO.4
EFFECT OF DEPTH ON RELATION BETWEEN SUPERSATURATION OF NITROGEN AND TOLERANCE OF
JUVENILE FISH TO TEMPERATURE INCREASES
Examination of fish in cages at the forebay of Priest Rapids Dam (Ebel, 1969) indicated that juvenile coho and chinook salmon would not contract gas bubble disease if held at a sufficient compensating depth (5 m). This finding suggests that fish subjected to temperature increases in addition to nitrogen supersaturation would also be less affected if they remained at sufficient depth when they encountered a temperature increase.
To test this hypothesis, we subjected coho salmon acclimated at 10° C to three temperatures above acclimation in water supersaturated at 130% in the 9-m (deep) tank where they could select any depth from the surface to 9 m; we then compared LEIOO curves in the 20-cm (shallow) tanks with those in the deep tank (Figure 5). These curves definitely indicate that the coho benefited by having the option to sound in the deep tank. The LEIOO level never was reached during the IS-hr observation period when the fish were subjected to 20° C (10° C increase) in the deep tank, but occurred after
100 ·23.8"C __ II 23" C _, 20" C
>>
~ ~
., w
" >~ 40 u
'" w ~
80
° 60
20
I , I'
I I " !
I
/ I
,/
",
, I
/
• __ IS'
120 240 360 480 600 720 840 960 Ipeo TIME (minutes)
FIGUR8 5.-Comparison~ of LElOO curves for coho salmon acclimated at 10° C and subjected to three temperatures (15°, 20°, and 23° C) in 20-cm and 9-m deep tanks containing water s~lpersaturated with nitrogen gas at 130'i~ saturation. Oxygen concentrations varied from 115 to 125% saturation.

EBEL, DAWLEY, and MONK: THERMAL TOLERANCE
about 17 hr in the shallow tank. Similarly at 150 C ( 5 0 C increase), the LEso level was never reached in the deep tank but was reached in about 12.5 hr in the shallow tank. No benefit from depth is indicated in the curves at 23 0 C; in this comparison, the fact that temperature in the deep tank was 0.8° C higher (23.8° C) than that in the shallow tank could account for the lack of difference.
Wild juvenile spring chinook salmon from the gatewells at McNary Dam also were tested in the deep and shallow tanks. These fish were acclimated at 10° C and then subjected to a 5° C increase (15° C) with supersaturation of nitrogen gas at 130% saturation. The fish also were stressed for 12 hr before the test in 10° C water supersaturated at 120% saturation. Again, chinook tested in the deep tank survived at a higher rate than those in the shallow tanks; the LE50 was never reached in the deep tank, whereas 100% mortality was reached in approximately 11 hr in the shallow tanks (Figure 6).
Observations in the deep tank during tests with the coho and chinook salmon indicated that most fish remained between about 1 and 4 m of the surface. Light intensity and turbidity possibly influenced the depth distribution. During these tests, artificial light at an intensity of about 100 footcandles was present at the surface of the water. Turbidity in the tank was minimal; a Secchi disc was visible at the bottom of the tank and the Jackson turbidity unit measurement was O.
It is difficult to relate tests in the tank to natural conditions because turbidity in natural water varies greatly. In the Snake River, turbidity as measured by a Secchi disc varies from 0.2 to 8.0 m, depending on season and location. Turbidity usually is high during the spring runoff in both the Snake and Columbia Rivers; readings are seldom over 1 m on the Snake River (Ebel and Koski, 1968). This high turbidity limits visible light penetration to a maximum of about 1.5 m (observation verified by scuba diving) . We therefore believe that juveniles as observed in the tank were at greater depths than they might be in the Snake or Columbia Rivers during the spring migration. Durkin, Park, and
100
80
80
40
I " 20 1/
\ ~ ~ ~ ~ ~ = - - ~ TIME (lRinu",)
FIGURE 6.-Comparison of LEloo curves of wild spring chinook salmon acclimated at 10° C and subjected to a 5° C increase (15° C) in tanks 20 cm and 9 m deep that were supersaturated with nitrogen gas at 130'70 saturation. Oxygen concentrations varied from 115 to 125% saturation.
Raleigh (1970) found that most juvenile salmon were near the surface as they entered Brownlee Reservoir. Fish in the Columbia and Snake Rivers apparently do not sound to a depth sufficient to compensate for nitrogen saturation levels exceeding 130 %; hence the mortalities re~ ported herein are probably on the conservative side. We also emphasize that even though the· option of having sufficient depth reduced the mortality rate, substantial mortalities occurred.
TEMPERATURE STANDARDS FOR RIVERS WITH
NITROGEN SUPERSATURATION
Our test temperatures and experimental design were purposely selected so that these data could be compared with the results reported by Brett (1952). Brett cautions that the information he presents should not be applied verbatim to other environments. . Because of the excellence of his work and the lack of biter findings concerning temperature tolerance of Pacific salmon, the upper lethal levels established in his paper are widely quoted and used for setting temperature tolerance standards for rivers and streams containing salmon-without regard to other physical and chemical characteristics of the water. The changes in Brett's tolerance curves caused by the stresses of supersaturation of nitrogen gas were obvious.
841

Although complete statistical analysis of our data are not presented in this paper, the differences shown between tolerance curves of fish tested in water with and without supersaturation of nitrogen are so great that conclusions concerning the effect of supersaturation can be made with relative confidence.
Substantial mortalities will occur to migrating juvenile salmon and trout in the Columbia and Snake Rivers--even if no thermal plume or increase in temperature is encountered-whenever the populations must pass through large areas where 125 to 130% saturation of nitrogen occurs. Studies of vertical distribution (e.g., Smith, Pugh, and Monan, 1968; Durkin et aI., 1970) indicate that the majority of migrants are in surface waters, with substantial numbers in waters less than 2 m deep. This is too shallow to compensate for nitrogen levels as high as 130 %. Surveys of nitrogen levels by Ebel (1969), by Beiningen and Ebel (1971), and by NMFS and State fisheries personnel of Washington and Oregon during the 1970 spring migration, verify that nitrogen in large areas of both rivers exceed 130% saturation.· Examination of fish in cages suspended on the surface and at various depths revealed that mortalities caused by nitrogen often exceeded 40% in a deep (4.5 m) cage where the fish could sound at their volition. Periodic checks of juveniles in the Snake River by NMFS personnel in 1970 indicated that 25 to 45% of the chinook salmon and 30 to 58 % of the steelhead trout migrants arriving at Ice Harbor Dam had external symptoms of gas bubble disease. We made similar observations of migrants at The Dalles and McNary Dams in 1968 and 1969 and recorded similar findings.
Obviously the migrating juvenile salmon and trout in the Columbia and Snake Rivers are under stress during periods of nitrogen supersaturation. Any increase in temperature over the ambient river temperature, then, will harm these populations. Mortalities already occurring will be accelerated even with minimal temperature increases. Our data show that LEso
levels of temperature (Figures 1-4) are far higher than could be accepted as standards for upper limits of rivers containing trout and salmon even
FISHERY BULLETIN: VOL. 69, NO.4
at normal concentrations of dissolved nitrogen. The time to first mortality of wild spring chinook salmon, for example, that were acclimated to 10° C and tested in supersaturated water at 23° and 25° C was 10 and 3 min, respectively (Table 8). Temperatures and temperature increases such as these occur in thermal effluents (Coutant, 1969), and substantial mortalities could occur to juvenile salmon and trout passing through thermal plumes.
During spring and summer when flows are low, increases in temperature of the Columbia River from Priest Rapids Dam to the fore bay of McNary Dam have been as high as 2.5° C (Ebel, 1969). Increases in temperature over the acclimated temperature greatly accelerated time to death of juveniles when supersaturation of nitrogen gas was present in the test water whether the fish were held in shallow or deep tanks. However, during the low flow periods when temperature increases such as this occur, nitrogen saturation levels are usually low and mortalities such as indicated in the tests would not occur.
The obvious results of these tests are that supersaturation of nitrogen must be considered when setting temperature standards and that any increase allowed over the ambient temperature of the river during periods when the river is supersaturated with nitrogen will be detrimental to salmon and trout populations.
CONCLUSIONS
1. Supersaturation of nitrogen drastically affects the tolerance of juvenile coho salmon, chinook salmon, and steelhead trout to temperature increases. Tolerance to increases below 26° C is lowered and mortality rates are accelerated.
2. Acclimation to higher temperatures will enable the three species to tolerate higher temperatures longer when nitrogen supersaturation is a factor; however, 50% mortality will be reached in less than 18 hr at all acclimation temperatures with supersaturation of nitrogen at 125 to 130%. No temperature is suitable at the 125 to 130% level of nitrogen supersaturation.
3. Depth is an important compensating factor
842

EBEL, DAWLEY, and MONK: TIlERMAL TOLERANCE
when supersaturation of nitrogen is present. Tests in the deep (9-m) tank, where fish were free to roam from the surface to the bottom, revealed that mortality rates were much lower and tolerance to temperature increases was increased if the juveniles had the option to sound when subjected to temperature increases.
4. Coho were the most tolerant, chinook next, and steelhead the least tolerant to temperature increases when the water was supersaturated with nitrogen. When supersaturation was not a factor, coho and steelhead were about equally tolerant to temperature increases and chinook the least tolerant.
5. Any increase in temperature allowed over the ambient temperature (whether high or low) of the river during periods of supersaturation of nitrogen will be detrimental to. migrating juvenile salmon and trout. Temperature standards should account for the effect of supersaturation of nitrogen gas.
LITERATURE CITED
BEININGEN, K. T., AND W. J. EBEL. 1971. Dissolved nitrogen, dissolved oxygen, and
related water temperatures in the Columbia and lower Snake Rivers, 1965-69. Nat!. Oceanic Atmos. Admin., Natl. Mar. Fish. Serv., Data Rep. 56, 60 p.
BRETT, J. R. 1952. Temperature tolerance in young Pacific
salmon, genus Oncorhynchus. J. Fish. Res. Board Can. 9: 265-323.
1958. Implications and assessments of environmental stress. In P. A. Larkin (editor), The investigation of fish-power problems, p. 69-83. H. R. MacMillan Lectures in Fisheries, Inst. Fish., Univ. B.C., Vancouver, B.C.
COUTANT, C. C. 1969. Temperature, reproduction and behavior.
Chesapeake Sci. 10: 261-274. DURKIN, J. T., D. L. PARK, AND R. F. RALEIGH.
1970. Distribution and movement of juvenile salmon in Brownlee Reservoir, 1962-65. U.S. Fish Wildl. Serv., Fish. Bull. 68: 219-243.
EBEL, W. J. 1969. Supersaturation of nitrogen in the Columbia
River and its effect on salmon and steelhead trout. U.S. Fish Wildl. Serv., Fish. Bull. 68: 1-11.
EBEL, W. J., AND C. H. KOSKI. 1968. Physical and chemical limnology of Brownlee
Reservoir, 1962-64. U.S. Fish Wildt Serv., Fish. Bull. 67: 295-335.
FRY, F. E. J., J. S. HART, AND K. F. WALKER. 1946. Lethal temperature relations for a sample
of young speckled trout, (Sal1J6linus /07I.tinalis). Univ. Toronto Stud., BioI. Ser. 54 (Pubt Onto Fish. Res. Lab. 66): 9-35.
MIHURSKY, J. A., AND V. F. KENNEDY. 1967. Water temperature criteria to protect
aquatic life. Am. Fish. Soc., Spec. Pubt 4: 20-33. PuGH, J. R., A. B. GROVES, AND W. J. EBEL.
1969. Experimental tank to simulate certain reservoir conditions. J. Fish. Res. Board Can. 2.6: 1956-1959.
SMITH, J. R., ..T. R. PuGH, AND G. E. MONAN. 1968. Horizontal and vertical distribution of ju
venile salmonids in upper Mayfield Reservoir, Washington. U.S. Fish Wildt Serv., Spec. Sci. Rep. Fish 566, 11 p.
843

Recommended