October 9th, 2017.
Hartford Center of Gerontological Excellence
Featured Research on Aging forum
The St Louis African American Health Cohort: Science of Methods & Measures.
, Presented by: Elena M. Andresen, PhD. Professor of Epidemiology; OHSU-PSU School of Public Health.
Executive Vice President and Provost; Baird Hall, 1011j. Phone 503-494-4460 email: [email protected];

• Become familiar with field research methods & measures in a successful metropolitan cohort
• Identify advantages & disadvantages of individual & environment (neighborhood) risk factor measures
Learning
Objectives

Colleagues: NIH African American Health Cohort Study (AAH)
Mario Schootman, PhD
St Louis University
Frederic Wolinsky, PhD
University of IowaTed Malmstrom, PhD
Saint Louis University
J. Philip Miller, AB
Washington University
PI: Doug Miller, MD
(Ret) Indiana University

Background
• Health Disparity in the USAfrican American seniors have more disability & greater health risks than whites
• Health Diversity in the USAmong African Americans: substantial variability in disability levels & risks
Miller et al: AAH clinically relevant depressive symptoms 21%.
Range 14% (suburban men) to 30% (inner city women)
4

Missouri
5

Two Catchment Areas for AAH
Cohort N = 998
Ages 50-64 @ baseline
50-50 geographic split
Inner city
Suburbs
Mississippi River
6

AAH study
Door-to-door random sample selection of African American adults 50-64 from two neighborhoods (strata) in 2000 (75% response)
1. Inner city St. Louis neighborhoods.
47% annual incomes < $10,000
2. Suburban, integrated neighborhoods.
15% annual incomes < $10,000
Completed sample 1,000 in 9+ months
7

AAH Cohort Study Protocol
Years 1, 4, & 10.
Extensive in-home assessment
&
Observer ratings of
neighborhood
Baseline Year 1: 2000; Follow-up 10 (year 11): early 2011
AAH Research Team
Year 4
8

AAH Baseline Data Collection
• 75 minute in-home interview & assessment
– Substantial functional testing, e.g., lung
function, balance, gait, hand strength,
weight & body composition
• Retest of key variables (reliability)
• Blood samples (biomedical hypotheses)
• Muscle strength (in-lab) tests
9

AAH Study Data Collection
• Monetary incentives
– Increasing incentives, & by number of study
procedures, e.g., in home (all subjects), add blood
draw &/or in-lab visit, etc. ($100+)
• Neighborhood observer rating – Baseline: 5 item scale (Andresen et al., 2005)
– Wave 4: 20 item scale (Andresen et al., 2008)
– Wave 10: both; 27 items (Andresen et al., 2013)
• Data collected at intervening annual “waves”
by telephone
10

AAH Data Collection/Training
• One week training for in-home phases
• Includes study procedures, software/ tracking procedures for computer assisted interviewing
• Interviews with standardized components (e.g., fear of falling; depressive symptoms)
• Physiologic measures (equipment & performance tests)
• Special procedures, e.g., falls safety certification for performance tests
• Neighborhood (observer) rating
11
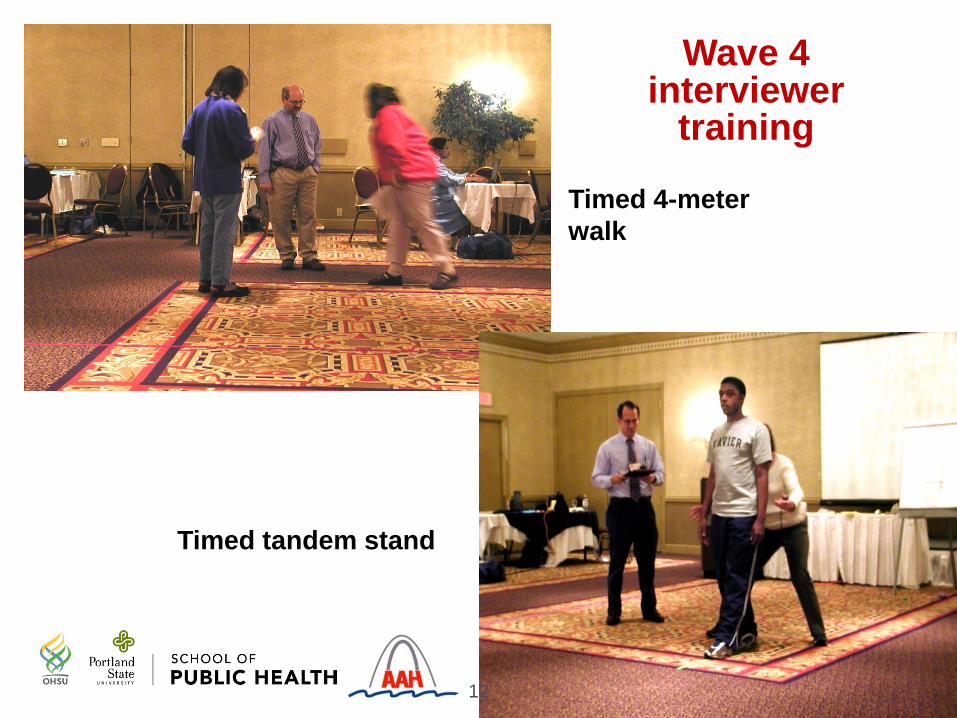
Timed 4-meter
walk
Timed tandem stand
Wave 4 interviewer
training
12

AAH Study Cohort Maintenance
• Periodic newsletters, health hints
– E.g., tips about heat waves, food safety,
emergency preparedness
• Annual report to respondents
– Lay summaries of scientific articles
• Calendar of local sites & people
• Study tee shirts (AAH logo)
13

AAH Study Cohort Maintenance
• Proxies when participants unavailable
– Temporary or not (admitted to nursing home, incarceration, etc.)
– Reported deaths verified by vital stats, National Death Index
• Very skilled field staff
– Interviewers professionals & moved from project to project (e.g., Census work)
– Extensive supervision, data quality, regular meetings
14

AAH Study Calendar Photos
Photo credit: K Mickelsen
15

Measurement Issues in Two Observer
Neighborhood Rating Systems
We hypothesized that in addition to
individual social & economic
circumstances (SES), the
neighborhoods people lived in would
exert an influence on outcome
… “Place matters”

Baseline Neighborhood Rating Scale
• Krause; 5-item assessmentKrause N. Neighborhood deterioration, religious coping, & changes in
health during late life. Gerontologist, 1998;38: 653-64.
• 10 Interviewers - general instructions
• Ratings during baseline household enumeration phase (before subject recruitment & enrollment)
• 150 ratings repeated (independent rater)
Andresen EM, et al. Reliability & validity of observer ratings of neighborhoods. J Aging Health 2006: 18: 28-36.
17

Krause Rating Method
BlockBlock
Housing
unit
street
Undefined / implied
neighborhood18

Total score summed, 5-20 points. higher = worse
Krause Scale Items
ex
ce
llen
t
go
od
fair
po
or
1. The condition of the houses & buildings 1 2 3 4
2. The amount of noise from traffic, trains,
airplanes, industry, & things like that1 2 3 4
3. The quality of the air -amount of pollution,
dirt, & fumes in the air1 2 3 4
4. Condition of streets & roads 1 2 3 4
5. Condition of the yards & sidewalks 1 2 3 4
19

AAH Psychometric Results: Krause
• Internal consistency alpha = 0.92 (excellent)
• Unidimensional factor; minimal factor loading = 0.80
But a problem surfaced
• Disproportionate ratings of “2” (good)
– 38% of total scores=10 (all items rated 2)
– Informal interviewer feedback suggested rating categories were too subjective; & more training needed
20
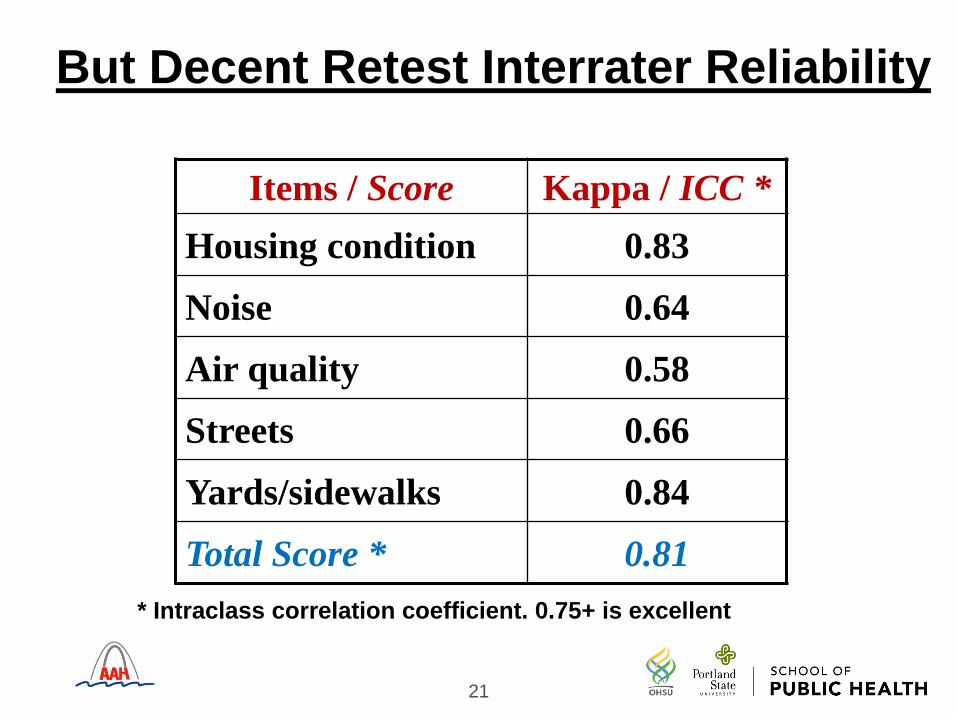
But Decent Retest Interrater Reliability
Items / Score Kappa / ICC *
Housing condition 0.83
Noise 0.64
Air quality 0.58
Streets 0.66
Yards/sidewalks 0.84
Total Score * 0.81
* Intraclass correlation coefficient. 0.75+ is excellent
21

Decent Discriminant Validity Results
Items 1-4; total 5-20
Inner city Suburbs
Housing condition * 3.2 2.3
Noise 2.6 2.3
Air quality * 2.5 2.2
Streets * 2.7 2.3
Yards/sidewalks * 3.3 2.2
Total Score * 14.9 11.4
* p<0.01 for worse (higher) scores in the inner city
Mean Scores
22

A Problem: Interviewer Effects
Linear regression model (outcome = total score)– Inner city scores +3.7 points (worse)
– Comparison: experienced U Michigan interviewers
• New St. Louis interviewers + 0.22 points
• St. Louis experienced interviewers + 1.8 points
– Individual interviewers still varied by 3.4
points after adjustments • (Scale scores 5-20 points / 16 point spread)
23

AAH Question # 1
Does neighborhood predict incident disability?
• Poor lower-body function plays a crucial role in the disablement process
• Inner-city African Americans have particularly high levels of excess disability & risk for further decline
Schootman M, et al. Neighborhood conditions & risk of incident lower-
body functional limitations. Am J Epidemiol 2006; 163(5): 450-458.
24
25
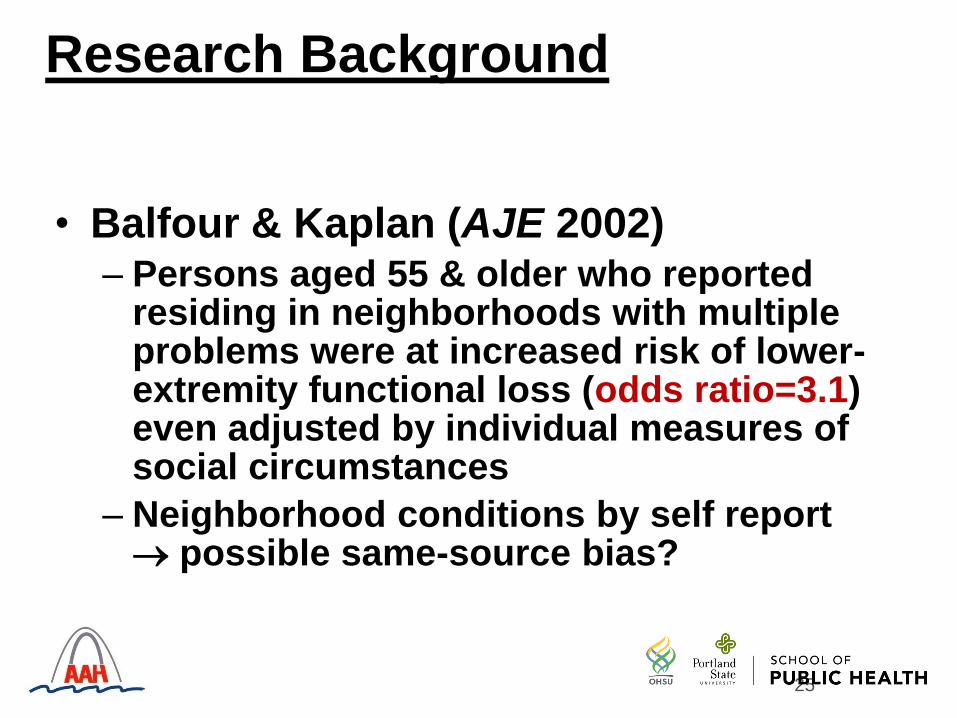
Research Background
• Balfour & Kaplan (AJE 2002)– Persons aged 55 & older who reported
residing in neighborhoods with multiple problems were at increased risk of lower-extremity functional loss (odds ratio=3.1) even adjusted by individual measures of social circumstances
– Neighborhood conditions by self report possible same-source bias?

26
The AAH Study
• Purpose: To confirm the association
shown by Balfour & Kaplan (AJE, 2002)
by examining the association between
observed neighborhood conditions &
self-reported incidence of lower-body
functional limitation (LBFL)

27
Methods
• Outcome: Nagi medical-model LBFL.
Self reported– difficulties in walking ¼ mile– walking up & down 10 steps without rest– standing for 2 hours– stooping, crouching, or kneeling– lifting 10 pounds
• Subjects with any difficulty or inability to perform the function or task were considered to be limited in that function/task
• Sum of functions/tasks (range: 0 - 5)

28
Methods: Statistics
– Predict: Development of difficulty/inability to perform 2 or more vs. 0-1 functions/tasks (Balfour & Kaplan)
– logistic regression models & propensity scores for “exposure” to 4-5 fair-poor neighborhood conditions vs. 0-1. And 2-3 vs. 0-1 (dose-response)
– 18 covariates: Social, demographic, health status, behavior
– Various sensitivity analyses• Classification of neighborhood condition
• Classification of lower body functional limitation
• Method of adjustment for covariates: propensity score
• Unmeasured binary confounder

29
Results
• Excluded 290 subjects with 2 or more prevalent LBFL at baseline
• 563 persons with 0-1 LBFL at baseline at risk for 2+ LBFL
• 109 (19%) experienced 2 or more LBFL at 3-year follow-up
30
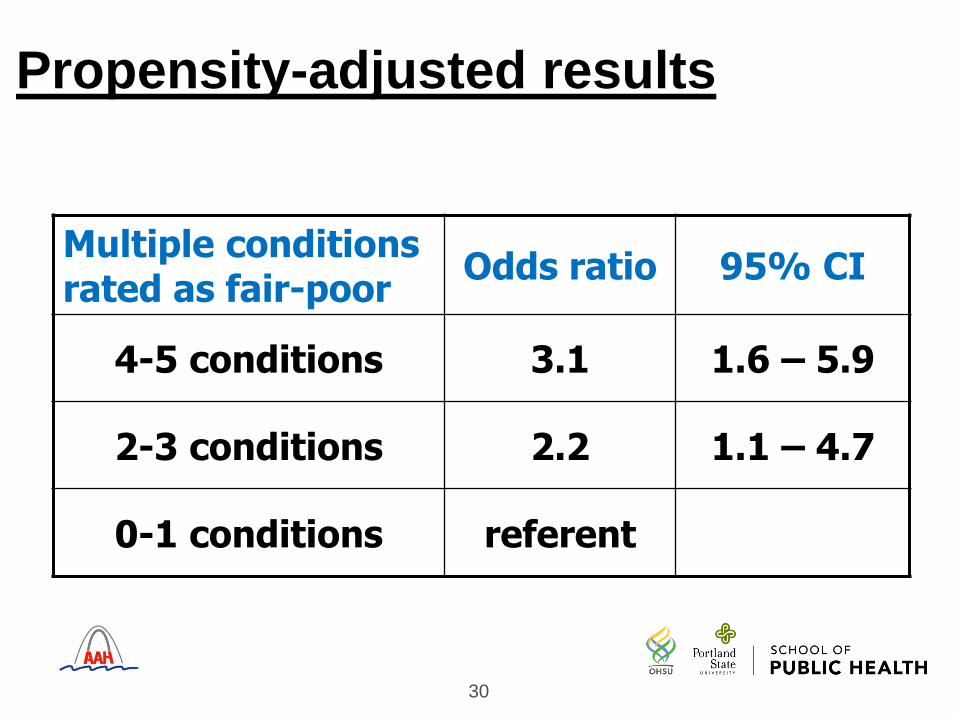
Propensity-adjusted results
Multiple conditions rated as fair-poor
Odds ratio 95% CI
4-5 conditions 3.1 1.6 – 5.9
2-3 conditions 2.2 1.1 – 4.7
0-1 conditions referent

Wave 4 Neighborhood Rating Scale
• 20-item block assessment adapted
from the Project on Human Development in
Chicago Neighborhoods
Sampson RJ, Raudenbush SW. Systematic social observation of
public spaces: A new look at disorder in urban neighborhoods.
Am J Sociol 1999; 105, 603-51.
31

Adapted “Chicago” Rating Method
Block bBlock a
housing
unit
Blo
ck fa
ce
a
street
Blo
ck fa
ce
b
Andresen EM et al. Rating neighborhoods for public health: results from the African American Health Study. BMC Public Health 2008.
32

Item Examples: Entire Street
1. Volume of traffic:No traffic
Light (occasional cars)
Moderate
Heavy (steady stream of cars)
2. Condition of street: Under construction
Very poor (many sizable cracks, potholes, broken curbs)
Fair
Moderately good (no sizable cracks, potholes, broken curbs)
Very good
33

Item Examples: Block Faces
a residence
b opposite side
6. Which of the following are
present on the block face? (yes/no)
Abandoned car
Empty beer/liquor bottles …
7. Are there cigarette or cigar butts
or discarded cigarette packages on
the sidewalk or in gutters? (yes/no)
Block faces
34

AAH Adapted “Chicago”
• Derived 7-item scale (alpha=0.75)
• Extensive photo/rating training protocol developed with St. Louis resident experienced interviewer testing & feedback.
35

Item 8. Light litter
36

Item 17: Housing condition – Very well kept/good condition
– attractive for its type. Don’t rate cost of the housing, but how it
rates for a single-family home of this type.
37

“Chicago” Scale Results
1.Traffic volume
2.Street condition
3.Noise
4.Beer/liquor bottles
5.Cigarettes
6.Garbage, litter
7.Housing condition
Seven Items, one factor
Item Factor loadings 0.47-0.80
= items similar to 5-item “Krause”
38

Results
• No advantage using both block faces
– Substantial agreement by block face
– Validity similar for one & two block faces
• Discriminant validity
– 0-15 point scale scores (one block face)
6.4 (inner city) vs. 3.5 (suburbs)
39

But we had interviewer effects
• Linear regression model with total scale as the outcome variable
– Inner city 3.4 points higher (worse)
– Interviewer (all St Louis) experience
(new vs. experienced) had no effect
– Individual interviewers still varied by 4.5
points after adjustment by area
(scores 0-15 / 16-point spread)
40
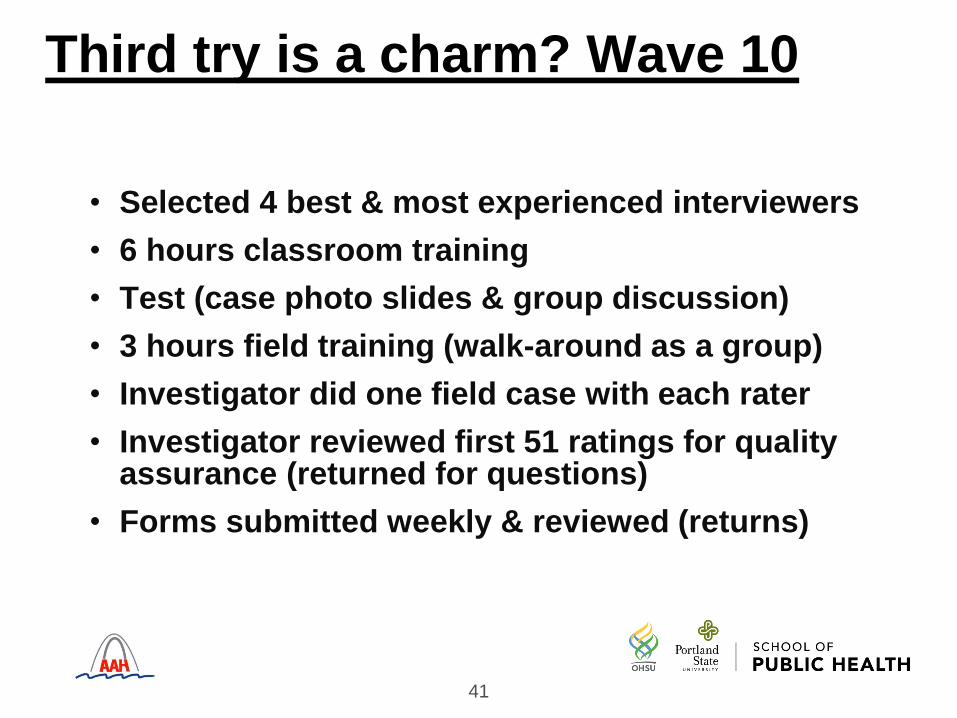
Third try is a charm? Wave 10
• Selected 4 best & most experienced interviewers
• 6 hours classroom training
• Test (case photo slides & group discussion)
• 3 hours field training (walk-around as a group)
• Investigator did one field case with each rater
• Investigator reviewed first 51 ratings for quality assurance (returned for questions)
• Forms submitted weekly & reviewed (returns)
41

Third try is a charm?
• Added observations & data on the duration of rating (minutes), day of week, time, & weather: environmental influences on rating?
• All raters assigned to street segments randomly, then provided map/sequence to rate in clusters (saving time)
• 120 street segments were rated by a randomly selected second rater (intraclass correlation on scale score totals)
42

43
Scale results
ScaleRaters
ICC*
Discriminant validity
Inner City Suburbs
Krause (5 item) 0.19 8.6 7.5
AAH (7 items) 0.56 5.2 3.4
*ICC 0.75+ is excellent agreement;
below 0.30 is poor agreement

44
Interviewer results
MeasuresInterviewer Means
all1 *
N=1122
N=1873
N=1844
N=187
Time (minutes) 10±7 7±3 10±9 7±5 13±5
Krause 8.0±2.6 9.4±2.3 7.4±2.4 6.2±1.3 9.4±2.5
AAH 7-item 4.2±3.0 5.4±2.9 4.2±2.6 2.2±2.1 5.5±3.3
* Supervisor (somewhat reduced rating assignments)
Linear regression: scores of two interviewers (2, 3) differed
significantly from the supervisor (p<0.001) adjusted by area

Concurrent Validity: Health Outcomes
Scale scores predict health outcomes? Regression models of the cross sectional data
Lower body function (self reported)
Modest association: poorer neighborhood conditions associated with poorer function
Short physical performance battery
Modest association: poorer neighborhood conditions associated with poorer function
Peak expiratory flowStrongest association: poorer neighborhoods associated with poorer lung function
Models adjusted by participant age, gender, area, interviewer
45

Mismeasurment Effects
• Outcome: participant report self rated health
• Neighborhood conditions assumed to have random additive error (test-retest data)
• Result: Uncorrected & corrected estimates showed lower neighborhood effects associated with lower health
• However, mismeasurement (low retest results) appeared to have driven the association toward the null (reduced the magnitude of the association)
46
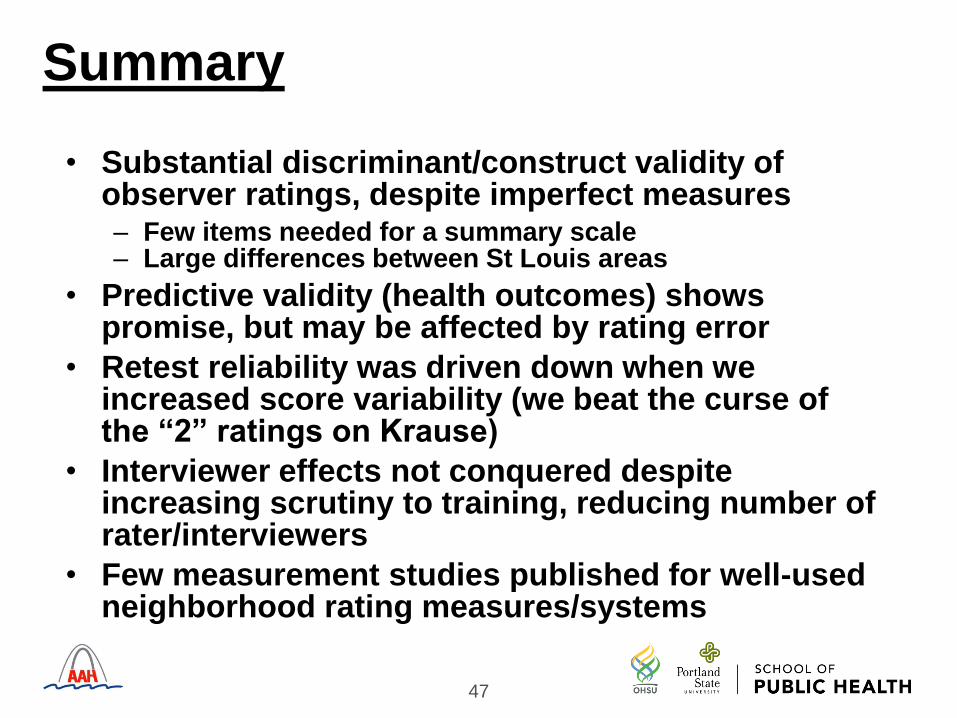
Summary
• Substantial discriminant/construct validity of observer ratings, despite imperfect measures– Few items needed for a summary scale– Large differences between St Louis areas
• Predictive validity (health outcomes) shows promise, but may be affected by rating error
• Retest reliability was driven down when we increased score variability (we beat the curse of the “2” ratings on Krause)
• Interviewer effects not conquered despite increasing scrutiny to training, reducing number of rater/interviewers
• Few measurement studies published for well-used neighborhood rating measures/systems
47

Questions? 48

Selected Publications of the AAH Study
Miller DK, Malmstrom TK, Joshi S, et al. Clinically relevant levels of depressive symptoms in community-dwelling middle-aged African Americans. J Am Geriatr Soc 2004;52:741-748.
Miller DK, Wolinsky FD, Malmstrom TK, et al. Inner city middle aged African Americans have excess premature disability. J Gerontol: MS 2005;60A:207-212.
Malmstrom TK, Wolinsky FD, Andresen EM, et al. Cognitive ability & physical performance in middle aged African Americans. JAGS 2005;53:997-1001.
Schootman M, Andresen EM, Wolinsky FD, et al. Neighborhood conditions & risk of incident lower-body functional limitations. Am J Epidemiol 2006;163:450-458.
Andresen EM, Wolinsky FD, Miller JP, et al. Cross-sectional & longitudinal risk factors for falls, fear of falling, & falls efficacy. Gerontologist 2006;46:249-257.
Schootman M, Andresen EM, Wolinsky TK, et al. Neighborhood environment & the incidence of depressive symptoms. J Epidemiol Commun Health 2007;61:527-532.
Schootman M, Andresen EM, Wolinsky FD, et al. Adverse housing & neighborhood conditions, & inflammatory markers among middle-aged African Americans. J Urban Health 2010;87:199-210.
Schootman M, Andresen EM, Wolinsky FD, et al. Neighborhood conditions, diabetes, & risk of lower-body functional limitations. BMC Public Health 2010;10:283.
Malmstrom T, Andresen EM, Wolinsky FD, et al. Predictors & correlates of urinary & fecal incontinence in middle-aged African Americans. J Am Geriatr Soc 2010;58:941-1945.
Wolinsky FD, Andresen EM, Malmstrom TK, et al. Childhood school segregation & later life sense of control & physical performance. BMC Public Health 2012;12:827.
Andresen EM, Malmstrom TK, Schootman M, et al. Observer ratings of neighborhoods: comparison of two methods. BMC Public Health 2013;13:1024.
Wolinsky FD, Malmstrom TK, Miller JP, et al. Association between childhood school segregation & changes in adult sense of control in the African American Health Cohort. J Gerontol B: Psychol SciSoc Sci 2013;68:956–962.
49
Recommended