Embed Size (px)
Citation preview
ORIGINAL ARTICLE
A 20-year cohort study of health gain fromorthodontic treatment: Psychological outcomeWilliam C. Shaw,a Stephen Richmond,b Pamela M. Kenealy,c Anne Kingdon,b and Helen Worthingtona
Manchester, Cardiff, and London, United Kingdom
Introduction: Despite the widespread expectation that orthodontic treatment improves psychologicalwell-being and self-esteem, there is little objective evidence to support this. The aim of this study was tocompare the dental and psychosocial status of people who received, or did not receive, orthodontictreatment as teenagers. Methods: A prospective longitudinal cohort design was adopted. A multidisciplinaryresearch team evaluated 1018 participants, aged 11 to 12 years, in 1981. Extensive assessments of dentalhealth and psychosocial well-being were conducted; facial and dental photographs and plaster casts ofdentition were obtained and rated for attractiveness and pretreatment need. No recommendations aboutorthodontic treatment were made, and an observational approach was adopted. At the third follow-up, 337subjects (30-31 years old) were reexamined in 2001. One-way ANOVA was used to explore differencesbetween the 4 groups (need/no need; treatment/no treatment). Results: The percentage changes in index ofcomplexity, outcome and need scores for the 4 groups were need/no treatment (12.7%), no need/notreatment (�17.1%), need/treatment (31%), and no need/treatment (�11.4%). Participants with a prior needfor orthodontic treatment as children who obtained treatment had better tooth alignment and satisfaction.However, when self-esteem at baseline was controlled for, orthodontic treatment had little positive impact onpsychological health and quality of life in adulthood. Conclusions: Lack of orthodontic treatment when therewas need did not lead to psychological difficulties in later life. (Am J Orthod Dentofacial Orthop 2007;132:
146-57)In 1962, a report from the World Health Organisa-tion (WHO) International Expert Committee onDental Health stated that an anomaly should be
regarded as requiring treatment if the disfigurement orfunctional defect is, or is likely to be, an obstacle to thepatient’s physical or emotional well-being.1 If this istrue for malocclusion, there would be clear justificationfor orthodontic treatment and an expectation of mea-surable health gain. However, a review conducted inthe late 1970s indicated that, despite the high demandfor orthodontic treatment, the literature contained littleevidence of benefit for oral health or psychologicalwell-being.2 This was the stimulus for a researchprotocol that subsequently gained competitive peerreview funding.
aProfessor, School of Dentistry, University of Manchester, Manchester, UnitedKingdom.bProfessor, Department of Dental Health and Biological Sciences, DentalSchool, Cardiff University, Cardiff, Wales, United Kingdom.cReader in psychology, Centre for Clinical and Health Psychology, School ofHuman and Life Sciences, Roehampton University, London, United Kingdom.Funded by NHS Research and Development Programme RDO/90/13 (PDC97-356) 1 October 1998-30 September 2002 and the Welsh Office and the MedicalResearch Council, United Kingdom (early stages).Reprint requests to: W. C. Shaw, School of Dentistry, University of Manchester,Manchester M15 6FH, United Kingdom; e-mail, [email protected], June 2006; revised and accepted, April 2007.0889-5406/$32.00Copyright © 2007 by the American Association of Orthodontists.
doi:10.1016/j.ajodo.2007.04.009146
The multi-disciplinary research program began in1981 as a prospective longitudinal cohort study toinvestigate oral health, the social and psychologicaleffects of malocclusion, and the effectiveness of orth-odontic treatment (separate reports in this series willconsider periodontal health, caries, and temperoman-dibular dysfunction). Extensive baseline data wererecorded for 1018 children in 1981 when they were 11to 12 years old. Reports from the earlier stages of thisstudy explored the relationship between attractiveness,dental status, and psychosocial variables. These pro-vided some empirical support for the relationship be-tween attractiveness and teacher expectations,3,4 attrac-tiveness and self-esteem,5 and social class and theuptake of orthodontic treatment,6 but the initial resultsprovided little support for the major hypothesis thatchildren with visible malocclusion were likely to besocially and psychologically disadvantaged.7 Severalpoints of caution were made with regard to this con-clusion, one of which related to measures that might nothave been best suited to show a psychological cost ofmalocclusion.
The operational definition of psychological well-being heavily depends on the measures available to thehealth psychologist, and, over the past 20 years, thenumber of validated measures of psychological health
has increased substantially. In 1981, self-esteem was
American Journal of Orthodontics and Dentofacial OrthopedicsVolume 132, Number 2
Shaw et al 147
considered to have a major causal influence on psycho-logical well-being in children and was one of a fewvalidated health measures available at that time. Self-esteem can be both cause and effect, and the impor-tance of the person in the causal relationship betweenattractiveness and self-esteem was addressed.4 Becausethe effects of low self-esteem have been assumed to bedamaging, there has been a particular interest in iden-tifying its causes,8 and the hypothesis that orthodontictreatment will lead to higher self-esteem (with a priorneed) or lack of treatment can lead to low self-esteemin adulthood appears well grounded.
MATERIAL AND METHODS
In 1981, access was granted to 23 of 29 SouthGlamorgan Education Authority schools in South Wales,United Kingdom. In the preliminary screening, 4810children were identified, consent to participate was deniedfor 390 children (8.1%), and 651 children (13.5%) wereabsent from school at the screening. Nonwhite children(163; 3.4%) and children already wearing orthodonticappliances (186; 3.9%) were excluded, leaving 3420potential subjects for the study.
The final allocation of children to the study wasdetermined by disproportionate stratified sampling toensure that occlusal conditions of low prevalence buthigh orthodontic interest would be well represented inthe cohort (Table I).9 This method of sampling pro-duced a total of 663 children with specific occlusalarrangements, approximately one fifth of the numberscreened; in addition, one tenth of the children withoutthese traits were included (355), giving a final total of1018 children. No recommendations about orthodontictreatment were made by the investigating team. Instead,an observational approach was adopted, with no at-tempt to influence the children’s attitudes to orthodon-tic treatment.
The primary assessments at age 11 to 12 years,completed in 1981, provide extensive baseline mea-sures for each child before (for some children) orth-odontic treatment.
Oral health examinations were conducted for theentire study group in a mobile dental clinic in 1981 andat the Cardiff Dental School in 2001. The psychologicaland social components of the study were developed toinvestigate the relationships among occlusal status,attractiveness, psychological well-being, social statusand achievement, and quality of life. Questionnaireswere distributed to the participants at each stage of thestudy, and to their parents and teachers in 1981. Eachparticipant was interviewed individually. Further de-tails of the initial sampling and methodology are
described elsewhere.2,7,10From 1999 to 2001, 733 participants for whomcontact details were available were targeted for the20-year follow-up. They included people residing in theUnited Kingdom, Ireland, and several other countries.Ethical approval was granted, and all participants re-turning in 2000 and 2001 completed consent forms.
Measures
The index of complexity, outcome and need(ICON) was used because it has been shown to be areliable and valid international occlusal index (Appen-dix.).11-15 Published in 2000, it represents the consen-sus opinion of 98 orthodontists in 9 countries obtainedfrom 1997 to 1999. Participants whose total ICONscores were 44 and above were classified as having aprior need for orthodontic treatment in 1981, and thosewith scores less than 44 as having no (or low) need fororthodontic treatment in 1981.
In 1981 and 2001, much data in addition to oralhealth were collected from subjects in the sample. Thepsychological component was executed by experiencedinterviewers16 under the supervision of a charteredhealth psychologist and included assessment of (1)physical appearance, including self- and objectivelyjudged attractiveness and dental status; (2) psycholog-ical health, including emotional health, social anxiety,self-esteem, quality of life, stress, and life events;(3) health status and health-related quality of life,including beliefs about health and illness; and (4)
Table I. Proportions retained from 1981 to 2001 by sex,original social class, and screening category
1981 2001n (%) n (%)
SexMale 508 (50) 146 (43)Female 508 (50) 191 (57)
Family social classManual 445 (50) 166 (49)Nonmanual 391 (44) 158 (47)Unemployed/unknown 51 (6) 13 (4)
Screening categoryControl 352 (35) 142 (40)Deepbite 65 (6) 22 (7)Prominent incisors 79 (8) 27 (8)Partial anterior crossbite 162 (16) 55 (17)Total anterior crossbite 22 (2) 0 (0)General anterior spacing 37 (4) 10 (3)Midline space 13 (1) 6 (2)Missing incisor 68 (7) 14 (4)Exposed upper gingivae 38 (4) 9 (3)Severe anterior crowding 174 (17) 51 (15)
individual and demographic characteristics.
American Journal of Orthodontics and Dentofacial OrthopedicsAugust 2007
148 Shaw et al
The psychological measures were completed by theparticipants before the clinical examinations. A bookletwas prepared and sent to participants, who were askedto complete the questionnaires in the week precedingtheir clinical appointment at the Cardiff Dental School.Photographs and dental casts were obtained during theclinical assessment.
A list of the data obtained that are relevant to thisreport is given in Tables III-V. An extended account ofthe measures used, the data obtained, and the statisticalanalysis are presented elsewhere.16
Subjects who had orthodontic treatment received itat specialist orthodontic offices or at Cardiff DentalSchool, and details of treatment were obtained from theprovider. The sample naturally divided into those whohad received and those who had not received orthodon-tic treatment by 2001, providing 4 groups of partici-pants: (1) treatment needed in 1981 but not received,(2) treatment not needed in 1981 and not received,(3) treatment needed in 1981 and received, and (4)treatment not needed in 1981 but received.
Statistical analyses
One-way ANOVAs were conducted on groups1 through 3 across the psychological outcome measuresobtained in 2001 (group 4 was excluded because ofinsufficient data). The significance level was set at�.05, since the variables were considered to be inde-pendent measures of psychological outcome. Signifi-cance levels less than .05 were considered not signifi-cant. Least significant difference post-hoc comparisonswere used to identify pairs of means that differedsignificantly.
Parametric statistics were used because no variableexhibited significant skewness (with the exception of1 measure, SF-36v2 health survey). Although the dataon some scales assessing psychological pathology andhealth status (SF-36v2) departed from statistical nor-mality, this was in all cases the result of the restrictedrange of the data, as might be expected in an essentiallyhealthy population of 31-year-old participants. Trans-forming these data, particularly when there is a power-ful floor effect, is unlikely to bring the distribution intonormality. “Distribution-free” statistics offer no advan-tage in relation to this problem, and, because parametricstatistics are more powerful and are generally robust todepartures from normality, the use of parametric statis-tics was thought to be justified.37,38
RESULTS
Three hundred thirty-seven (46% of the target)returned to participate in 2000 and 2001; 284 (62%) of
these last attended in 1989, and a further 53 lastattended in 1984. Thus, of the original 1981 sample of1018, 33% returned after 20 years (Table I).
Complete psychosocial data were collected from332 participants. One participant declined to take partin the psychological component of the study, and 4participants who failed to return their completed datawere classified as missing after 3 follow-up reminders.The ages of these participants ranged from 29.67 to32.42 years, with a mean age of 31.25 years (SD, 0.62).There were 144 men (mean age, 31.23 years; SD, 0.67)and 188 women (mean age, 31.26 years; SD, 0.58).
Of the 332 participants, 181 had not receivedorthodontic treatment by 2001, and 150 had (Table III).There were no differences in social class between thegroups.
There were statistically significant differences be-tween ICON scores for the 3 groups in 1981 and 2001(P �.001; Table III). (As noted above, group 4 wasexcluded from significance testing because of its smallsize.) For those with a prior need for orthodontictreatment who received it, the mean long-term im-provement was 23.37 ICON points (Table III). Forthose with a prior need that was unmet, the occlusionalso improved but only by 8.21 points. However, lowinitial scores tended to worsen irrespective of whetherorthodontic treatment had been received (deteriorationsof 3.75 points in those without prior need who receivedtreatment and 5.73 points in those without prior needwho did not). The percentage change in ICON scoresfor the 4 groups were need/no treatment (12.7%), noneed/no treatment (�17.1%), need/treatment (31%),and no need/treatment (�11.4%).
The ICON score was significantly reduced by anaverage of 21 points in the group that received orth-odontic treatment compared with an average reductionof 4 points in the group that did not (regardless of priorneed). The data are best visualized in the scatter plot(Fig). The regression lines are shown for treated anduntreated groups. The regression analysis confirms thatorthodontic treatment achieved a long-term reductionin malocclusion for higher initial scores but not for lowscores. The difference at 2001 is equivalent to a gain of3 points on the ICON esthetic component 10-pointscale.
Among those with prior need for orthodontic treat-ment, those who received it were significantly moresatisfied with their teeth than those who did not(P �.01, Table III). There were also higher ratings inthe perceived relative appearance of the participants’teeth (Table III), although those who had no prior needand no history of orthodontic treatment scored thehighest. Those with unmet needs scored the lowest
(P � .001).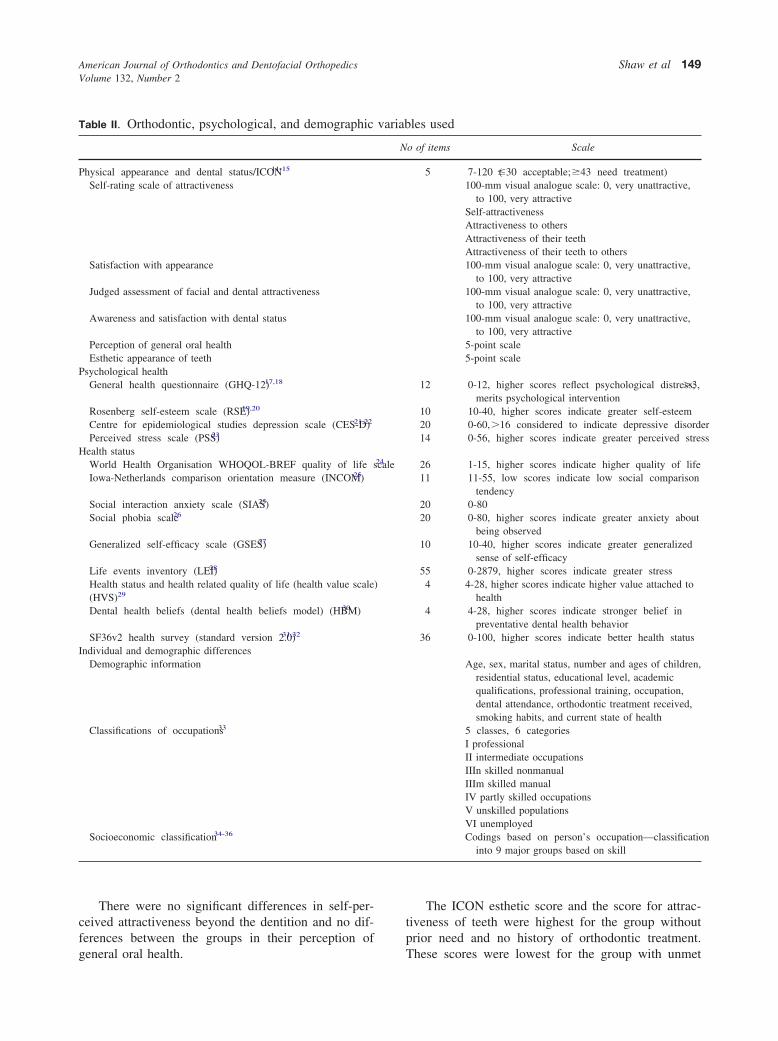
American Journal of Orthodontics and Dentofacial OrthopedicsVolume 132, Number 2
Shaw et al 149
There were no significant differences in self-per-ceived attractiveness beyond the dentition and no dif-ferences between the groups in their perception of
Table II. Orthodontic, psychological, and demographic
Physical appearance and dental status/ICON11-15
Self-rating scale of attractiveness
Satisfaction with appearance
Judged assessment of facial and dental attractiveness
Awareness and satisfaction with dental status
Perception of general oral healthEsthetic appearance of teeth
Psychological healthGeneral health questionnaire (GHQ-12) 17,18
Rosenberg self-esteem scale (RSE)19,20
Centre for epidemiological studies depression scale (CES-D)21,22
Perceived stress scale (PSS)23
Health statusWorld Health Organisation WHOQOL-BREF quality of life scaleIowa-Netherlands comparison orientation measure (INCOM)25
Social interaction anxiety scale (SIAS)25
Social phobia scale26
Generalized self-efficacy scale (GSES)27
Life events inventory (LEI)28
Health status and health related quality of life (health value scale(HVS)29
Dental health beliefs (dental health beliefs model) (HBM)30
SF36v2 health survey (standard version 2.0)31,32
Individual and demographic differencesDemographic information
Classifications of occupations33
Socioeconomic classification34-36
general oral health.
The ICON esthetic score and the score for attrac-tiveness of teeth were highest for the group withoutprior need and no history of orthodontic treatment.
les used
o of items Scale
5 7-120 (�30 acceptable; �43 need treatment)100-mm visual analogue scale: 0, very unattractive,
to 100, very attractiveSelf-attractivenessAttractiveness to othersAttractiveness of their teethAttractiveness of their teeth to others100-mm visual analogue scale: 0, very unattractive,
to 100, very attractive100-mm visual analogue scale: 0, very unattractive,
to 100, very attractive100-mm visual analogue scale: 0, very unattractive,
to 100, very attractive5-point scale5-point scale
12 0-12, higher scores reflect psychological distress; �3,merits psychological intervention
10 10-40, higher scores indicate greater self-esteem20 0-60, �16 considered to indicate depressive disorder14 0-56, higher scores indicate greater perceived stress
26 1-15, higher scores indicate higher quality of life11 11-55, low scores indicate low social comparison
tendency20 0-8020 0-80, higher scores indicate greater anxiety about
being observed10 10-40, higher scores indicate greater generalized
sense of self-efficacy55 0-2879, higher scores indicate greater stress4 4-28, higher scores indicate higher value attached to
health4 4-28, higher scores indicate stronger belief in
preventative dental health behavior36 0-100, higher scores indicate better health status
Age, sex, marital status, number and ages of children,residential status, educational level, academicqualifications, professional training, occupation,dental attendance, orthodontic treatment received,smoking habits, and current state of health
5 classes, 6 categoriesI professionalII intermediate occupationsIIIn skilled nonmanualIIIm skilled manualIV partly skilled occupationsV unskilled populationsVI unemployedCodings based on person’s occupation—classification
into 9 major groups based on skill
variab
N
24
)
These scores were lowest for the group with unmet

American Journal of Orthodontics and Dentofacial OrthopedicsAugust 2007
150 Shaw et al
Table III. Orthodontic, psychological, and demographic variables for subjects with and without orthodontic treatmentneed (1981) who either received or did not receive orthodontic care (means and standard deviations)
No orthodontic treatment (n � 181) Received orthodontic treatment (n � 150)
Need in 1981(ICON � 44�)
n � 124Mean (SD)
No need in 1981(ICON � �44)
n � 57Mean (SD)
Need in 1981(ICON � 44�)
n � 138Mean (SD)
No need in 1981(ICON � �44)
n � 12Mean (SD)
Psychosocial variables Group 1 Group 2 Group 3 Group 4 F (2316) P
Physical appearance and dental statusICON total score in 1981 64.82 (13.30) 33.60 (7.74) 75.34 (15.17) 32.83 (8.18) 196.74 �.001*ICON total score in 2001 56.61 (19.84) 39.33 (15.13) 51.97 (14.71) 36.58 (14.88) 20.33 �.001*Satisfaction with teeth (0-100) 49.03 (22.31) 58.33 (18.29) 55.04 (20.89) 63.00 (20.62) 4.66 .010†
Satisfaction with teeth line up and fit 2.56 (0.67) 3.04 (0.63) 2.85 (0.69) 3.00 (0.60) 11.19 �.001†
Peer comparison of teeth lineup and fit 2.90 (0.74) 3.32 (0.60) 3.09 (0.66) 3.33 (0.78) 7.46 .001*Perception of general oral health 3.15 (0.88) 3.11 (0.94) 3.30 (0.83) 3.33 (0.78) 1.49 NSICON esthetic component in 2001 5.27 (2.15) 3.35 (1.77) 4.69 (1.75) 3.33 (1.23) 19.51 �.001*Judged attractiveness of teeth 32.32 (9.87) 39.97 (8.06) 34.74 (8.65) 43.97 (7.09) 13.74 �.001*Self-rating of teeth (0-100) 43.44 (17.87) 49.60 (17.07) 48.96 (18.71) 63.33 (19.56) 3.79 .024†
Self-rating of others’ view of teeth 42.23 (18.58) 50.32 (16.65) 49.10 (19.00) 61.67 (22.48) 4.40 .013†
Dissatisfaction with appearance of teeth 2.50 (0.64) 2.82 (0.66) 2.72 (0.60) 2.92 (0.67) 6.50 .002†
Peer comparison: appearance of teeth 2.93 (0.83) 3.23 (0.68) 3.04 (0.63) 3.17 (0.72) 3.39 .035‡
Self-rating of attractiveness (0-100) 55.13 (17.53) 50.36 (16.80) 53.16 (16.27) 52.00 (21.38) 1.58 NSSelf-rating: attractiveness to others 52.33 (17.08) 49.29 (16.97) 51.70 (16.17) 49.50 (19.29) 0.66 NSSatisfaction with facial appearance 62.81 (17.73) 61.89 (15.68) 62.51 (16.95) 67.17 (13.29) 0.06 NSSatisfaction: overall appearance 61.81 (19.70) 59.21 (17.65) 60.78 (16.71) 61.58 (21.68) 0.41 NSJudged attractiveness: face (0-100) 36.36 (9.37) 37.40 (9.13) 36.84 (8.69) 36.00 (7.82) 0.27 NSJudged attractiveness: smiling face 35.05 (7.72) 37.21 (7.39) 35.82 (8.48) 37.25 (5.11) 1.40 NS
Psychological healthGeneral psychological health: GHQ-12 2.01 (2.83) 1.51 (2.38) 1.70 (2.29) 1.67 (2.02) 0.89 NSRSE 2001 (reversed score 10-40) 31.40 (4.83) 31.63 (4.84) 32.99 (4.25) 32.25 (5.41) 4.33 .014§
Depression: CES-D scale (0-60) 11.30 (10.00) 10.75 (9.35) 9.36 (7.80) 10.33 (10.40) 1.58 NSPerceived stress: PSS-14 (0-56) 22.79 (7.77) 22.39 (7.26) 21.71 (6.34) 21.33 (7.29) 0.77 NSSatisfaction with life scale (5-35) 22.85 (7.55) 24.30 (6.89) 25.07 (6.12) 26.33 (6.51) 3.47 .032§
Health status and health-related QOLWHOQOL-BREF:
Overall quality of life facet (1-5) 4.05 (0.76) 4.05 (0.69) 4.25 (0.65) 4.25 (0.62) 3.06 .048§
Physical domain (4-20) 16.32 (2.48) 16.47 (2.24) 17.09 (1.80) 16.71 (1.40) 4.49 .012§
Psychological domain (4-20) 14.44 (2.58) 14.75 (2.53) 15.30 (1.96) 14.83 (2.13) 4.61 .011§
Environment domain (4-20) 14.45 (1.98) 15.09 (1.97) 15.16 (1.92) 14.71 (2.07) 4.85 .008†
General health facet (1-5) 3.70 (0.97) 3.79 (0.84) 3.91 (0.91) 3.67 (0.89) 1.73 NSSocial relationships domain (4-20) 14.79 (3.34) 15.36 (3.37) 15.69 (3.11) 14.22 (3.18) 2.44 NSIowa-Netherlands comparison
orientation (INCOM) (11-55) 34.20 (7.76) 34.02 (7.39) 32.59 (7.64) 31.17 (7.04) 1.64 NSSocial interaction anxiety (0-80) 23.65 (14.54) 22.09 (12.13) 21.16 (12.57) 23.50 (13.51) 1.16 NSSocial phobia: SPS (0-80) 13.46 (12.65) 13.84 (13.03) 11.40 (10.93) 11.67 (8.44) 1.31 NSSelf efficacy: GSES (10-40) 30.35 (4.91) 30.54 (4.17) 30.78 (4.31) 30.92 (4.32) 0.29 NSLife events weighted score: LEI 259.4 (173.4) 230.3 (131.8) 260.7 (144.8) 205.2 (105.3) 0.88 NSValue attached to health (4-28) 20.06 (4.48) 20.19 (4.92) 19.93 (4.23) 21.25 (3.70) 0.07 NSBelief in dental health (4-28) 18.95 (3.79) 18.82 (3.36) 18.53 (4.02) 19.17 (3.29) 0.42 NS
SF-36 v2 health surveyGeneral health perception (0-100) 72.78 (18.03) 74.59 (16.34) 78.28 (16.13) 80.58 (10.64) 3.51 .031§
Reported health transition (1-5) 3.28 (0.79) 3.12 (0.71) 3.18 (0.59) 3.00 (0.43) 1.19 NSPhysical functioning (0-100) 92.12 (15.74) 91.31 (16.57) 93.45 (14.01) 92.50(13.23) 0.48 NSRole physical–limitations (0-100) 90.02 (18.76) 91.89 (18.86) 92.51 (15.02) 86.46 (25.39) 0.69 NSBodily pain (0-100) 79.48 (22.92) 79.96 (23.01) 84.99 (17.76) 82.33 (24.96) 2.56 NSVitality (0-100) 60.50 (18.49) 57.86 (18.72) 61.58 (15.53) 57.29 (20.09) 0.93 NSSocial function (0-100) 82.46 (21.44) 85.09 (22.59) 88.42 (18.61) 87.50 (23.23) 2.76 NSRole emotional–limitations (0-100) 88.58 (18.63) 89.77 (14.94) 91.67 (14.49) 95.83 (9.73) 1.18 NSMental health (0-100) 73.42 (16.45) 73.59 (15.72) 75.71 (14.76) 76.25 (17.34) 0.79 NS
Social classNS-SEC 2001 (1-8) 3.75 (2.34) 4.07 (2.51) 3.58 (2.28) 3.53 (2.55) 0.86 NS
*All groups: 1-2, 1-3, 2-3; †groups 1-2, 1-3; ‡groups 1-2; §groups 1-3.
NS, not significant; QOL, quality of life; NS-SEC, national statistics socioeconomic classification.
American Journal of Orthodontics and Dentofacial OrthopedicsVolume 132, Number 2
Shaw et al 151
orthodontic needs. However, there were no significantdifferences in the objective ratings of the smiling facephotographs.
For most of these measures, no statistically signif-icant differences emerged between the subgroups ofinterest (Table III), including general psychologicalhealth, depression, and stress, or in social interactionphobia, social phobia, and self-efficacy. However, dif-ferences did emerge for self-esteem, the satisfactionwith life scale, and some elements of the WHO qualityof life scale.
Thus, the group with a prior need for orthodontictreatment that was met had a higher level of self-esteemin 2001 (P � .014) and a higher score for satisfactionwith life (P � .032) than the group with an unmet need.Participants with a prior need who had received treat-ment also reported the highest overall quality of life(WHOQOL-BREF) and high quality of life in thedomains of physical, psychological, and environment;they also reported better general health (SF-36).
An analysis of covariance (ANCOVA) was per-formed to assess the effect of prior need and orthodon-tic treatment (3 levels) on self-esteem in 2001 withself-esteem in 1981 covaried (rescaled 1981 PiersHarris score). There was a significant main effect ofself-esteem in 1981 (F [1250] � 19.71, P �.001) butno longer a significant effect of orthodontic treatment(by prior need) on self-esteem in 2001 (F [2250] �1.91, not significant).
The association between orthodontic treatment andself-esteem in adulthood was therefore accounted forby self-esteem at baseline. Participants with a priororthodontic need who were subsequently treated had
Fig. Scatterplot and regression lines for ICON scoresfor treated and untreated groups.
higher self-esteem before treatment, and the observed
increase in self-esteem in this group was paralleled byincreases in the other 2 groups (difference in self-esteem 1981-2001 by prior need/treatment: F [2251] �0.86, not significant).
Because self-esteem at 11 years of age was found tohave an influence on health outcome 20 years later, itwas hypothesized that current self-esteem could beexerting an influence on present psychological health.ANCOVAs with self-esteem in 2001 as the covariatewere performed to reexamine the significant findingsrelated to psychological outcome.
Self-esteem in 2001 had a significant effect on allpsychological variables relating to attractiveness, psy-chological health, and health status (P �.01). Whenself-esteem was covaried, there were no longer anysignificant main effects of treatment; orthodontic treat-ment did not have a significant effect on any psycho-logical variables when self esteem at the 2001follow-up was controlled for.
When the effects of prior need and orthodontictreatment were reanalyzed, self-esteem in 2001 had asignificant effect on the psychological health and healthstatus variables (Table III): life satisfaction, quality oflife (WHOQOL-BREF), and SF-36v2 general healthperception (all at P �.001), and the effects of treatmentby prior need were no longer significant when self-esteem in 2001 was covaried. However, the significanteffects of treatment by pretreatment need remained for thevariables related to physical appearance; dental status, andattractiveness. In all cases, those with prior need whoreceived treatment had more positive scores than thosewith prior need who did not receive treatment.
Table IV shows the estimated means and standarderrors for variables when the effects of treatment byprior need remained significant after controlling forcurrent level of self-esteem; the means are estimatedafter evaluation of the covariate.
An exploratory stepwise multiple regression analy-sis was performed on all 2001 outcome study quanti-tative psychosocial measures, the measures of dentalstatus, and the ICON scores in 1981 and 2001 toidentify which variables, if any, made significant pre-dictive contributions to self-esteem.
The analysis produced a 10-step solution that pre-dicted 63% of the variance in self-esteem in 2001(adjusted R2, 0.632; SE estimate, 2.77). ANOVA indi-cated a linear relationship between the variables(F [10,307] � 55.54; P �.001).
The 10 variables identified as making significantcontributions to the prediction were then entered asindependent variables into a simultaneous multipleregression analysis. There were significant linear rela-
tionships between the variables (F [10,314] �59.75;
American Journal of Orthodontics and Dentofacial OrthopedicsAugust 2007
152 Shaw et al
P �.001), and the model significantly predicted 65% ofthe variance in self-esteem in 2001 (adjusted R2, 0.645;SE, 2.77). All 10 variables made significant contribu-tions to the predictive power of the model. The betacoefficients and the t values for these variables areshown in Table V. Good psychological quality of life,general satisfaction with life, and strong self-efficacybeliefs were predictive of higher self-esteem, as werelower levels of depression and less anxiety in socialinteractions. Beta values in Table V for social relation-ships, perceptions of general health, emotional health,and attractiveness, with severity of malocclusion in1981, indicated that the contributions of these variablesto predicting self-esteem in 2001, although significant,were negligible.
The skewness of some variables entered into theregression analysis indicated departures from normal-ity. The data from these variables were transformed,and the regression analysis was rerun with the trans-formed data; there was no change in the statisticalconclusions (adjusted R2, 0.653; SE estimate, 2.74),and the same 5 variables made the greatest contribu-tions to the prediction of self-esteem.
DISCUSSION
Our results indicate that persons with a prior needfor orthodontic treatment that was met have a morefavorable perception of, and higher satisfaction with,their own teeth than those with an unmet need. How-ever, although initial analysis indicated that these were
Table IV. Significant effects of prior need and orthodontin 2001
No orthon
Need in 1981(ICON � 44�)
n � 124 E mean (SPsychosocial variables Group 1
Physical appearanceDental status
ICON total score in 2001 56.58 (1.54)Satisfaction with teeth (0-100) 49.82 (1.85)Satisfaction with way teeth line up and
fit2.58 (0.06)
Peer comparison of teeth lineup and fit 2.92 (0.06)Attractiveness
ICON aesthetic component in 2001 5.28 (0.17)Self-rating of others’ view of teeth 43.83 (1.63)Judged attractiveness of teeth 32.42 (0.82)Dissatisfaction with appearance of teeth 2.51 (0.06)Peer comparison: appearance of teeth 2.95 (0.06)
E mean, Estimated mean.
accompanied by higher levels of self-esteem and re-
ported quality of life, these gains were lost whenaccount was taken of pretreatment self-esteem in 1981.Thus, the results on 31-year-olds confirm those whenthe cohort was in adolescence: visible malocclusion hasno discernable negative effect on social and psycholog-ical well-being, and orthodontic treatment has no dis-cernable positive effect.
Other attempts to construct comparisons betweengroups of subjects who either obtained or failed toobtain orthodontic correction of malocclusion reached
Table V. Standardized regression coefficients for simul-taneous regression of self-esteem at outcome uponpsychosocial and dental variables
Predictive variable Beta t Significance
Quality of life: psychologicaldomain 0.245 4.19 � .001
Self-efficacy 0.243 6.17 � .001Life satisfaction 0.212 4.72 � .001Depression �0.151 2.96 .01Social interaction anxiety �0.118 2.85 .01Quality of life: social
relationships domain �0.099 2.24 .02SF-36v2: emotional role
limitations 0.089 2.26 .02Self-rating of attractiveness 0.087 2.27 .02ICON total score in 1981 0.076 2.27 .02SF-36v2: general health
perception 0.068 1.89 .05Overall predictive power of model � 65%
tment on outcome variables, controlling for self-esteem
reatment Treatedn � 138
No need in 1981(ICON �44)
� 57 E mean (SD)
Need in 1981(ICON � 44�)
n � 138 E mean (SD)Group 2 Group 3 F (2315) P
39.32 (2.25) 52.01 (1.46) 20.27 �.00158.87 (2.71) 54.11 (1.76) 4.00 �.013.05 (0.09) 2.83 (0.06) 10.47 �.001
3.33 (0.09) 3.08 (0.06) 7.17 �.01
3.36 (0.25) 4.67 (0.16) 19.53 �.00150.72 (2.39) 48.40 (1.55) 3.51 �.0540.02 (1.21) 34.63 (0.77) 13.59 �.001
2.83 (0.08) 2.70 (0.05) 5.87 �.013.24 (0.09) 3.01 (0.06) 3.44 �.05
ic trea
dontic t� 181
D) n
equivocal conclusions. Two randomized trials evalu-

American Journal of Orthodontics and Dentofacial OrthopedicsVolume 132, Number 2
Shaw et al 153
ated short-term psychological outcomes. In an Ameri-can setting, Albino et al39 found that dental-specificevaluations appear to be influenced by treatment,whereas more general psychosocial responses are not.In their randomized trial of early treatment of Class IImalocclusion, subjects in general did not have below-average self-concepts, and those who received treat-ment did not experience improvement in social compe-tency or self-esteem. In contrast, children who receivedearly treatment in a recent randomized trial in theUnited Kingdom of Class II Division 1 malocclusionhad increased self-esteem.40 In a 15-year follow-up in30-year-old Danes, some subjects with untreated severemalocclusion experienced continuing feelings of dissat-isfaction with their teeth and memories of teasing thatpersisted into adulthood.41 However in their progres-sion through life with respect to personal accomplish-ment and achievement, and more general psychologicalwell-being, they did not appear disadvantaged.
The finding that dental status did not make a greatercontribution to the prediction of self-esteem led us toexplore the contribution of other variables to self-esteem in adulthood. In this 2001 study, 65% of thevariance in self-esteem was predicted by psychologicalvariables related to perception of quality of life, lifesatisfaction, affective state (depression and socialanxiety), emotional health, and perception of attractive-ness. Interestingly, poor quality of life with respect tosocial relationships was not predictive of low self-esteem,whereas higher levels of depression and social anxiety, asmight be expected, did predict low self-esteem.
The fact that severity of malocclusion assessed inchildhood made a weak contribution to the prediction ofself-esteem 20 years later is noteworthy, although priorneed and treatment received were not considered in thisanalysis. However, the contribution of dental status at age11 to self-esteem at age 30, although statistically signifi-cant, appears to be of minor importance in a model thatincludes other psychosocial variables.
Our findings demonstrate that analyzing the long-term effects of orthodontic treatment on psychologicalhealth without considering intervening factors mightlead to invalid conclusions regarding the efficacy oftreatment. The finding that participants who receivedorthodontic treatment had significantly higher scores onsome psychological health variables than those who didnot receive treatment appeared to be an artefact. Whenprior need for treatment 20 years earlier was taken intoaccount, there was little objective evidence to supportthe belief that orthodontic treatment improves psycho-logical well-being in adulthood. In addition, lack oforthodontic treatment when there was a prior need did
not lead to psychological difficulties in later life in theform of nonpsychotic mental disorders, depressivedisorders, social anxiety, or social phobia.
The observed effect of prior need and orthodontictreatment on self-esteem at outcome was accounted forby self-esteem at baseline. This finding emphasizes theneed for longitudinal analysis of baseline and outcomedata when evaluating the effect of treatment on psy-chological variables. In our sample, participants’ self-esteem increased over 20 years but not as a result ofreceiving orthodontic treatment and regardless ofwhether there was a prior need for treatment at base-line. Orthodontic treatment alone did not have a signif-icant effect on any psychosocial variables when self-esteem at outcome in 2001 was controlled for.
The principal uncertainty surrounding our studywas anticipating the dropout rate. From the outset, thiswas an observational study, and the subjects, re-cruited as schoolchildren, were offered neither treat-ment nor other benefit by the researchers. Thus,successful follow-up depended entirely on goodwilland the effectiveness and persistence of our recallefforts. In practical terms, retention became a greaterchallenge after 1989 when our subjects no longerattended school.
Some indication of the success of sequential recallefforts is shown by the proportion of subjects lost tofollow-up over each interval. Between 1981 and 1984,22% of the subjects failed to return, equal to 7.3% peryear. Between 1984 and 1989, the rate of loss was 8.4%per year. From 1989 to 2001, the rate of loss fell to2.2% per year, in spite of the longest gap.
Inevitably, however, the total level of dropouts(about two-thirds of the initial 1018) raises possibilitiesfor bias. Although the sample remaining in the study atthe 20-year follow-up was similar for the main charac-teristics recorded for the entire sample at the outset(Table I), the generalizability of the findings to theentire sample cannot be guaranteed.
Another issue concerns factors that determineddivision into the 2 groups with severe malocclusion—those who received treatment and those who did not. Asthe analyses indicate, those who received treatment didnot appear to differ in major respects in the 1981recorded characteristics from those who did not. Familysocial class in 1981 was not associated with the uptakeof orthodontic treatment, although social class in 2001was. However, a low valuation of dental alignment orunwillingness to comply with treatment must undoubt-edly have influenced entry to treatment and might havediminished any potential for psychological benefit to berealized. Interestingly, subjects with a high objectiveneed for treatment that was unmet had higher levels of
decayed, missing, or filled teeth at age 11, suggesting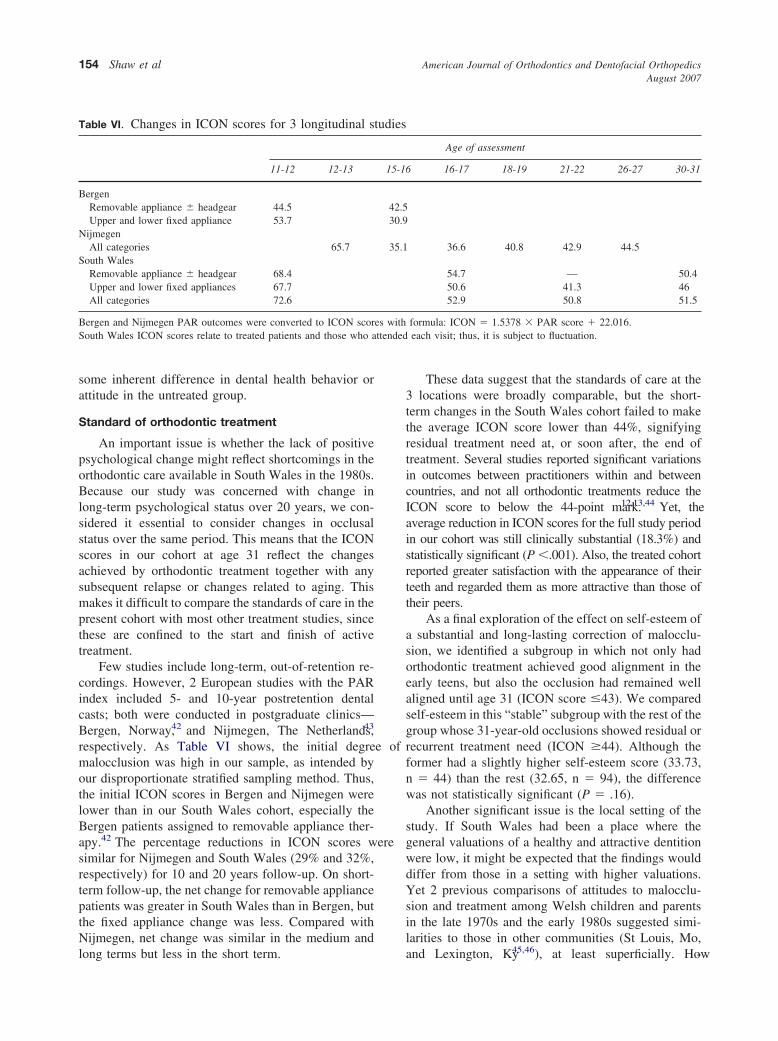
ttended
American Journal of Orthodontics and Dentofacial OrthopedicsAugust 2007
154 Shaw et al
some inherent difference in dental health behavior orattitude in the untreated group.
Standard of orthodontic treatment
An important issue is whether the lack of positivepsychological change might reflect shortcomings in theorthodontic care available in South Wales in the 1980s.Because our study was concerned with change inlong-term psychological status over 20 years, we con-sidered it essential to consider changes in occlusalstatus over the same period. This means that the ICONscores in our cohort at age 31 reflect the changesachieved by orthodontic treatment together with anysubsequent relapse or changes related to aging. Thismakes it difficult to compare the standards of care in thepresent cohort with most other treatment studies, sincethese are confined to the start and finish of activetreatment.
Few studies include long-term, out-of-retention re-cordings. However, 2 European studies with the PARindex included 5- and 10-year postretention dentalcasts; both were conducted in postgraduate clinics—Bergen, Norway,42 and Nijmegen, The Netherlands,43
respectively. As Table VI shows, the initial degree ofmalocclusion was high in our sample, as intended byour disproportionate stratified sampling method. Thus,the initial ICON scores in Bergen and Nijmegen werelower than in our South Wales cohort, especially theBergen patients assigned to removable appliance ther-apy.42 The percentage reductions in ICON scores weresimilar for Nijmegen and South Wales (29% and 32%,respectively) for 10 and 20 years follow-up. On short-term follow-up, the net change for removable appliancepatients was greater in South Wales than in Bergen, butthe fixed appliance change was less. Compared withNijmegen, net change was similar in the medium and
Table VI. Changes in ICON scores for 3 longitudinal s
11-12 12-13
BergenRemovable appliance � headgear 44.5Upper and lower fixed appliance 53.7
NijmegenAll categories 65.7
South WalesRemovable appliance � headgear 68.4Upper and lower fixed appliances 67.7All categories 72.6
Bergen and Nijmegen PAR outcomes were converted to ICON scorSouth Wales ICON scores relate to treated patients and those who a
long terms but less in the short term.
These data suggest that the standards of care at the3 locations were broadly comparable, but the short-term changes in the South Wales cohort failed to makethe average ICON score lower than 44%, signifyingresidual treatment need at, or soon after, the end oftreatment. Several studies reported significant variationsin outcomes between practitioners within and betweencountries, and not all orthodontic treatments reduce theICON score to below the 44-point mark.12,13,44 Yet, theaverage reduction in ICON scores for the full study periodin our cohort was still clinically substantial (18.3%) andstatistically significant (P �.001). Also, the treated cohortreported greater satisfaction with the appearance of theirteeth and regarded them as more attractive than those oftheir peers.
As a final exploration of the effect on self-esteem ofa substantial and long-lasting correction of malocclu-sion, we identified a subgroup in which not only hadorthodontic treatment achieved good alignment in theearly teens, but also the occlusion had remained wellaligned until age 31 (ICON score �43). We comparedself-esteem in this “stable” subgroup with the rest of thegroup whose 31-year-old occlusions showed residual orrecurrent treatment need (ICON �44). Although theformer had a slightly higher self-esteem score (33.73,n � 44) than the rest (32.65, n � 94), the differencewas not statistically significant (P � .16).
Another significant issue is the local setting of thestudy. If South Wales had been a place where thegeneral valuations of a healthy and attractive dentitionwere low, it might be expected that the findings woulddiffer from those in a setting with higher valuations.Yet 2 previous comparisons of attitudes to malocclu-sion and treatment among Welsh children and parentsin the late 1970s and the early 1980s suggested simi-larities to those in other communities (St Louis, Mo,
Age of assessment
16-17 18-19 21-22 26-27 30-31
36.6 40.8 42.9 44.5
54.7 — 50.450.6 41.3 4652.9 50.8 51.5
formula: ICON � 1.5378 � PAR score � 22.016.each visit; thus, it is subject to fluctuation.
tudies
15-16
42.530.9
35.1
es with
and Lexington, Ky45,46), at least superficially. How-
American Journal of Orthodontics and Dentofacial OrthopedicsVolume 132, Number 2
Shaw et al 155
ever, several cultural differences between communitiescould influence the extent to which orthodontics isbeneficial, so research in other settings would clearly bedesirable.
Most of the orthodontic literature concentrates onthe biologic basis of orthodontic treatment and methodsof treatment, with scant research on psychological andrelated health gains. This might reflect, in part, thechallenging nature of outcome research in orthodontics.Often, the expected benefits of orthodontic treatmentcan be realized only in the long term, and the wholeprocess of considering treatment, achieving entry intotreatment, and complying with it is surrounded bymany factors that could confound the chances ofobtaining or identifying benefit.
Random allocation, by far the preferred option forminimizing bias in treatment vs nontreatment compar-isons, is difficult to achieve in orthodontics becauseindividual patients with a common malocclusion decidewhether they desire treatment, whether they will com-ply with treatment, and whether they will accept non-treatment as an option. Randomization is more achiev-able when treatment is deferred, rather than denied, asin several recent Class II Division 1 trials. This ap-proach, however, obviously precludes long-term com-parison of treatment vs no treatment.
An opportunity for random allocation to treatmentor nontreatment, rather than treatment or delayed treat-ment, arises in cases of borderline need for treatment,especially when all or most treatment is provided in asocialized health service, and borderline need is ineli-gible. However, the potential for demonstrating treat-ment benefit would be diminished when the malocclu-sions are mild.
These points were contemplated in our planning forthis study, and we thought that a longitudinal observa-tional cohort design struck the best balance of rigor andpragmatism.
The demand for orthodontic treatment is high, almostregardless of geography and health systems,47,48 and,when cost barriers are removed, the uptake of treatment inthe young population can reach 60%.42 Thus, one mightregard the benefits of orthodontic treatment as self-evi-dent. Certainly, prospective patients (and parents) seemconfident of the gains they expect to achieve when startingtreatment.2,45,46
In recent decades, however, health professionalshave come under increasing pressure to demonstratetheir worth with factual evidence of benefits. Forexample, dentistry has been urged by the US Instituteof Medicine to “improve our knowledge of what worksand what does not work” in the advancement of
oral-health objectives. The report noted: “a focus onhealth outcomes is essential for dental professionalsand dental services in achieving desired health out-comes for individuals and communities, and cannotsimply be assumed, but must be demonstrated topatients, other purchasers of dental services and policyworkers.”49
On the evidence of this study, this remains achallenge for orthodontic treatment providers.
We thank Archie Cochrane (deceased), ColetteRay, Neil Frude, Corky Gormley, Susan Condor, PaulHackett, Paul Lucas, and Kate Gleeson for their con-tributions to the design, data collection, and analysis ofthe psychological components of earlier stages of theCardiff Dental Study (1981-1989); and Martin Addy,Paul Dummer, Lindsay Hunter, Bengt Mohlin, andRichard Pilley for their contributions to the dentalcomponents of the 2000-2001 study.
Parts of the text and data associated with TablesIII-V are reproduced with permission from the BritishJournal of Health Psycology © The British Psycholog-ical Society.
REFERENCES
1. World Health Organisation. Standardisation of reporting ofdental diseases and conditions. Report of an expert committee ondental health. Geneva: WHO; 1962.
2. Shaw WC, Addy M, Ray C. Dental and social effects ofmalocclusion and effectiveness of orthodontic treatment. Com-munity Dent Oral Epidemiol 1980;8:36-45.
3. Kenealy P, Frude N, Shaw WC. Influence of children’s physicalattractiveness on teacher expectations. J Soc Psychol 1988;128:373-83.
4. Kenealy PM, Frude N, Shaw W. Teacher expectations aspredictors of academic success. J Soc Psychol 1991;131:305-6.
5. Kenealy PM, Gleeson K, Frude N, Shaw W. The importance ofthe individual in the “causal” relationship between attractivenessand self-esteem. J Community Appl Soc Psychol 1991;1:45-56.
6. Kenealy P, Frude N, Shaw W. The effects of social class on theuptake of orthodontic treatment. Br J Orthod 1989;16:107-11.
7. Kenealy P, Frude N, Shaw W. An evaluation of the psycholog-ical and social effects of malocclusion: some implications fordental policy making. Soc Sci Med 1989;28:583-91.
8. Emler N. Self-esteem. The costs and causes of low self-worth.York, UK: Joseph Rowntree Foundation; 2001.
9. Moser CA, Kalton G. Survey methods in social investigations.London: Heinemann; 1979. p. 93-7.
10. Shaw WC, Addy M, Dummer PMH, Ray C, Frude N. Dental andsocial effects of malocclusion and effectiveness of orthodontictreatment: a strategy for investigation. Community Dent OralEpidemiol 1986;14:60-4.
11. Daniels C, Richmond S. The development of the index of complex-ity, outcome and need (ICON). J Orthod 2000;27:149-62.
12. Richmond S, Ikonomou C, Williams B, Ramel S, Rolfe B, KurolJ. Orthodontic treatment standards in a public group practice inSweden. Swed Dent J 2001;25:137-44.
13. Richmond S, Ikonomou, C, Williams, B, Rolfe, B. Orthodontic
standards in Greece. Hellenic Orthod Rev 2001;4:9-20.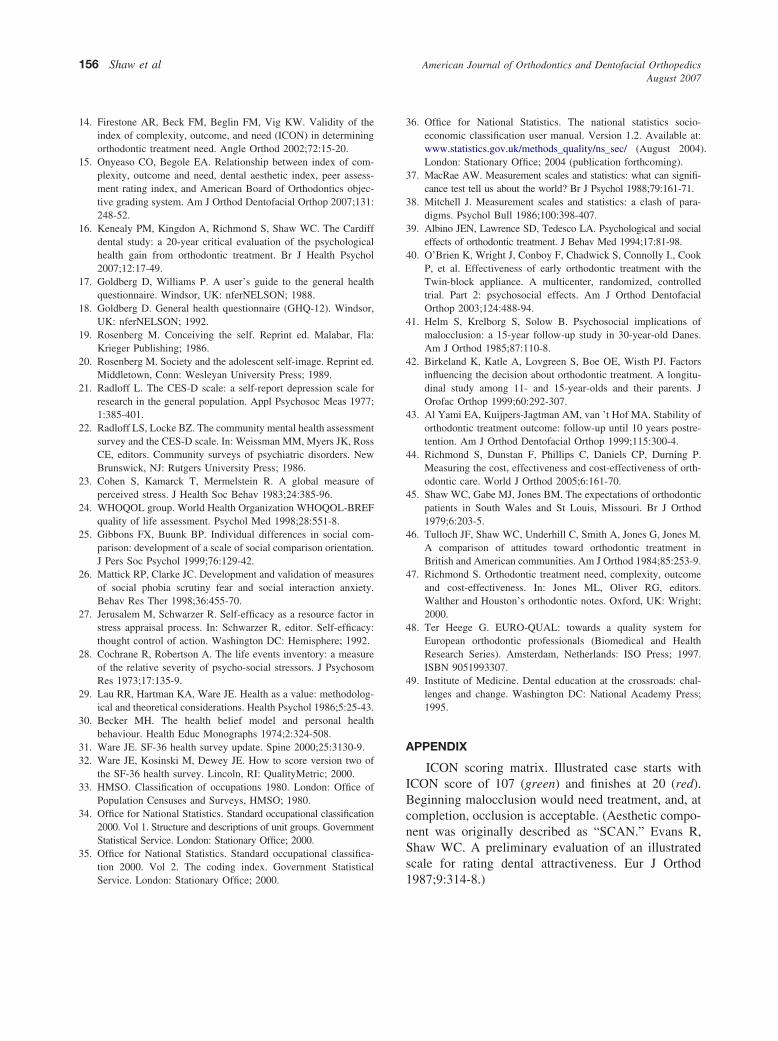
American Journal of Orthodontics and Dentofacial OrthopedicsAugust 2007
156 Shaw et al
14. Firestone AR, Beck FM, Beglin FM, Vig KW. Validity of theindex of complexity, outcome, and need (ICON) in determiningorthodontic treatment need. Angle Orthod 2002;72:15-20.
15. Onyeaso CO, Begole EA. Relationship between index of com-plexity, outcome and need, dental aesthetic index, peer assess-ment rating index, and American Board of Orthodontics objec-tive grading system. Am J Orthod Dentofacial Orthop 2007;131:248-52.
16. Kenealy PM, Kingdon A, Richmond S, Shaw WC. The Cardiffdental study: a 20-year critical evaluation of the psychologicalhealth gain from orthodontic treatment. Br J Health Psychol2007;12:17-49.
17. Goldberg D, Williams P. A user’s guide to the general healthquestionnaire. Windsor, UK: nferNELSON; 1988.
18. Goldberg D. General health questionnaire (GHQ-12). Windsor,UK: nferNELSON; 1992.
19. Rosenberg M. Conceiving the self. Reprint ed. Malabar, Fla:Krieger Publishing; 1986.
20. Rosenberg M. Society and the adolescent self-image. Reprint ed.Middletown, Conn: Wesleyan University Press; 1989.
21. Radloff L. The CES-D scale: a self-report depression scale forresearch in the general population. Appl Psychosoc Meas 1977;1:385-401.
22. Radloff LS, Locke BZ. The community mental health assessmentsurvey and the CES-D scale. In: Weissman MM, Myers JK, RossCE, editors. Community surveys of psychiatric disorders. NewBrunswick, NJ: Rutgers University Press; 1986.
23. Cohen S, Kamarck T, Mermelstein R. A global measure ofperceived stress. J Health Soc Behav 1983;24:385-96.
24. WHOQOL group. World Health Organization WHOQOL-BREFquality of life assessment. Psychol Med 1998;28:551-8.
25. Gibbons FX, Buunk BP. Individual differences in social com-parison: development of a scale of social comparison orientation.J Pers Soc Psychol 1999;76:129-42.
26. Mattick RP, Clarke JC. Development and validation of measuresof social phobia scrutiny fear and social interaction anxiety.Behav Res Ther 1998;36:455-70.
27. Jerusalem M, Schwarzer R. Self-efficacy as a resource factor instress appraisal process. In: Schwarzer R, editor. Self-efficacy:thought control of action. Washington DC: Hemisphere; 1992.
28. Cochrane R, Robertson A. The life events inventory: a measureof the relative severity of psycho-social stressors. J PsychosomRes 1973;17:135-9.
29. Lau RR, Hartman KA, Ware JE. Health as a value: methodolog-ical and theoretical considerations. Health Psychol 1986;5:25-43.
30. Becker MH. The health belief model and personal healthbehaviour. Health Educ Monographs 1974;2:324-508.
31. Ware JE. SF-36 health survey update. Spine 2000;25:3130-9.32. Ware JE, Kosinski M, Dewey JE. How to score version two of
the SF-36 health survey. Lincoln, RI: QualityMetric; 2000.33. HMSO. Classification of occupations 1980. London: Office of
Population Censuses and Surveys, HMSO; 1980.34. Office for National Statistics. Standard occupational classification
2000. Vol 1. Structure and descriptions of unit groups. GovernmentStatistical Service. London: Stationary Office; 2000.
35. Office for National Statistics. Standard occupational classifica-tion 2000. Vol 2. The coding index. Government Statistical
Service. London: Stationary Office; 2000.36. Office for National Statistics. The national statistics socio-economic classification user manual. Version 1.2. Available at:www.statistics.gov.uk/methods_quality/ns_sec/ (August 2004).London: Stationary Office; 2004 (publication forthcoming).
37. MacRae AW. Measurement scales and statistics: what can signifi-cance test tell us about the world? Br J Psychol 1988;79:161-71.
38. Mitchell J. Measurement scales and statistics: a clash of para-digms. Psychol Bull 1986;100:398-407.
39. Albino JEN, Lawrence SD, Tedesco LA. Psychological and socialeffects of orthodontic treatment. J Behav Med 1994;17:81-98.
40. O’Brien K, Wright J, Conboy F, Chadwick S, Connolly I., CookP, et al. Effectiveness of early orthodontic treatment with theTwin-block appliance. A multicenter, randomized, controlledtrial. Part 2: psychosocial effects. Am J Orthod DentofacialOrthop 2003;124:488-94.
41. Helm S, Krelborg S, Solow B. Psychosocial implications ofmalocclusion: a 15-year follow-up study in 30-year-old Danes.Am J Orthod 1985;87:110-8.
42. Birkeland K, Katle A, Lovgreen S, Boe OE, Wisth PJ. Factorsinfluencing the decision about orthodontic treatment. A longitu-dinal study among 11- and 15-year-olds and their parents. JOrofac Orthop 1999;60:292-307.
43. Al Yami EA, Kuijpers-Jagtman AM, van ’t Hof MA. Stability oforthodontic treatment outcome: follow-up until 10 years postre-tention. Am J Orthod Dentofacial Orthop 1999;115:300-4.
44. Richmond S, Dunstan F, Phillips C, Daniels CP, Durning P.Measuring the cost, effectiveness and cost-effectiveness of orth-odontic care. World J Orthod 2005;6:161-70.
45. Shaw WC, Gabe MJ, Jones BM. The expectations of orthodonticpatients in South Wales and St Louis, Missouri. Br J Orthod1979;6:203-5.
46. Tulloch JF, Shaw WC, Underhill C, Smith A, Jones G, Jones M.A comparison of attitudes toward orthodontic treatment inBritish and American communities. Am J Orthod 1984;85:253-9.
47. Richmond S. Orthodontic treatment need, complexity, outcomeand cost-effectiveness. In: Jones ML, Oliver RG, editors.Walther and Houston’s orthodontic notes. Oxford, UK: Wright;2000.
48. Ter Heege G. EURO-QUAL: towards a quality system forEuropean orthodontic professionals (Biomedical and HealthResearch Series). Amsterdam, Netherlands: ISO Press; 1997.ISBN 9051993307.
49. Institute of Medicine. Dental education at the crossroads: chal-lenges and change. Washington DC: National Academy Press;1995.
APPENDIX
ICON scoring matrix. Illustrated case starts withICON score of 107 (green) and finishes at 20 (red).Beginning malocclusion would need treatment, and, atcompletion, occlusion is acceptable. (Aesthetic compo-nent was originally described as “SCAN.” Evans R,Shaw WC. A preliminary evaluation of an illustratedscale for rating dental attractiveness. Eur J Orthod
1987;9:314-8.)
American Journal of Orthodontics and Dentofacial OrthopedicsVolume 132, Number 2
Shaw et al 157
Appendix 1. Index of Complexity, Outcome astarts with an ICON score of 107 (green) and fiin need of treatment and on completion of the
(The Aesthetic Component was originally depreliminary evaluation of an illustrated scale foOrthodontics 9:314-318)
nd Need (ICON) scoring matrix. The case illustratednishes at 20 (red). The start malocclusion would betreatment the occlusion is acceptable.
scribed as “SCAN” Evans R and Shaw WC 1987. Ar rating dental attractiveness. European Journal of