The Economics of Global Climate Change
Global Development And Environment InstituteTufts University
Medford, MA 02155http://ase.tufts.edu/gdae
By Jonathan M. Harris and Brian Roach
A GDAE Teaching Moduleon Social and Environmental
Issues in Economics
1
Copyright © 2009 Global Development And Environment Institute, Tufts University. Copyright release is hereby granted for instructors to copy this module for instructional purposes. Students may also download the module directly from http://ase.tufts.edu/gdae. Comments and feedback from course use are welcomed: Global Development And Environment Institute Tufts University Medford, MA 02155 http://ase.tufts.edu/gdae E-mail: [email protected]
2
THE ECONOMICS OF GLOBAL CLIMATE CHANGE
based on: Environmental and Natural Resource Economics: A Contemporary Approach by Jonathan M. Harris (Houghton Mifflin, 2006, http://college.hmco.com)
1. CAUSES AND CONSEQUENCES OF CLIMATE CHANGE
Concern has grown in recent years over the issue of global climate change1. In terms of economic analysis, greenhouse gas emissions, which cause planetary climate changes, represent both an environmental externality and the overuse of a common property resource.
The atmosphere is a global commons into which individuals and firms can release
pollution. Global pollution creates a “public bad” born by all -- a negative externality with a wide impact. In many countries environmental protection laws limit the release of local and regional air pollutants. In these situations, in economic terminology, the negative externalities associated with local and regional pollutants have to some degree been internalized. But few controls exist for carbon dioxide (CO2), the major greenhouse gas. This global air pollutant has no short-term damaging effects at ground level, but atmospheric accumulations of carbon dioxide and other greenhouse gases will have significant effects on global temperature and weather, although there is uncertainty about the probable scale and timing of these effects (See Box 1).
If indeed the effects of climate change are likely to be severe, it is in everyone’s
interest to lower their emissions for the common good. If no agreement or rules on emissions exist, actions by individual firms, cities or nations will be inadequate. Climate change can thus be viewed as a public good issue, requiring collaborative action. Since the problem is global, only a strong international agreement binding nations to act for the common good can prevent serious environmental consequences.
NOTE – terms denoted in bold face are defined in the KEY TERMS AND CONCEPTS section at the end of the module.
1 The issue, often called global warming, is more accurately referred to as global climate change. The phenomenon will produce complex effects – with warming in some areas, cooling in others, and generally increased variability in weather patterns.
3
BOX 1: WHAT IS THE GREENHOUSE EFFECT?
The sun’s rays travel through a greenhouse’s glass to warm the air inside, but the glass acts as a barrier to the escape of heat. Thus plants that require warm weather can be grown in cold climates. The global greenhouse effect, through which the earth’s atmosphere acts like the glass in a greenhouse, was first described by French scientist Jean Baptiste Fourier in 1824. Clouds, water vapor, and the natural greenhouse gases carbon dioxide (CO2), methane, nitrous oxide, and ozone allow inbound solar radiation to pass through, but serve as a barrier to outgoing infrared heat. This creates the natural greenhouse effect, which makes the planet suitable for life. Without it, the average surface temperature on the planet would average around -18° C (0ºF), instead of approximately 15°C (60º F). The possibility of an enhanced or human-induced greenhouse effect was introduced one hundred years ago by the Swedish scientist Svante Arrhenius. He hypothesized that the increased burning of coal would lead to an increased concentration of carbon dioxide in the atmosphere, and would warm the earth. Since Arrhenius’ time greenhouse gas emissions have grown dramatically. Carbon dioxide concentrations in the atmosphere have increased by about 35% over pre-industrial levels. In addition to increased burning of fossil fuels such as coal, oil and natural gas, synthetic chemical substances such as chlorofluorocarbons (CFCs) as well as methane and nitrous oxide emissions from agriculture and industry contribute to the greenhouse effect. Scientists have developed complex computer models that estimate the effect of current and future greenhouse gas emissions on the global climate. While considerable uncertainty remains in these models, virtually all scientists agree that the human-induced greenhouse effect poses a significant threat to the global ecosystem. The global average temperature has increased by about 0.7°C (1.3°F) during the 20th century. The Intergovernmental Panel on Climate Change (IPCC) concluded in 2001 that humans are already having a discernable impact on the global climate: “most of the observed warming over the last 50 years is likely to have been due to the increase in greenhouse gas concentrations.” In 2007 they reaffirmed and strengthened this conclusion.
Current emissions trends will lead to a doubling of greenhouse gas concentration
over pre-industrial levels by around 2050. The IPCC projects a global average temperature increase of 1 to 6 degrees Centigrade, or 2 to 10 degrees Fahrenheit, by 2100. This would have significant impacts on climate throughout the world.
Sources: Cline, 1992; Fankhauser, 1995; IPCC, 2001, 2007.
4
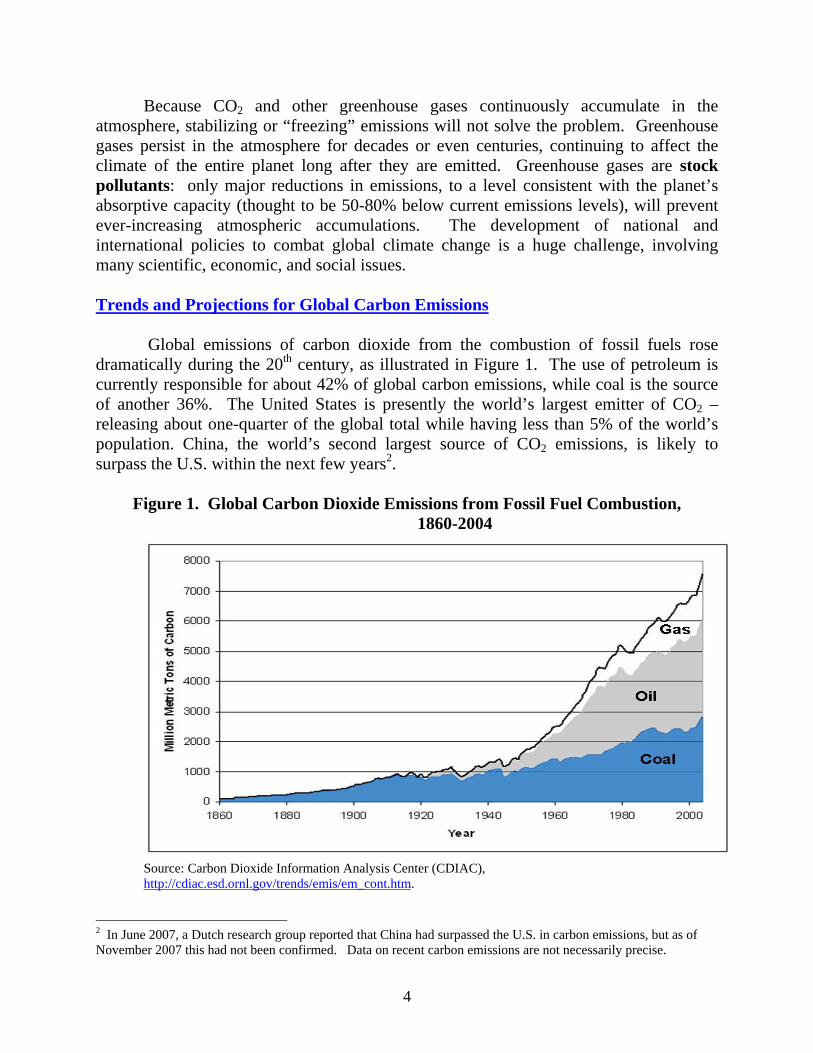
Because CO2 and other greenhouse gases continuously accumulate in the atmosphere, stabilizing or “freezing” emissions will not solve the problem. Greenhouse gases persist in the atmosphere for decades or even centuries, continuing to affect the climate of the entire planet long after they are emitted. Greenhouse gases are stock pollutants: only major reductions in emissions, to a level consistent with the planet’s absorptive capacity (thought to be 50-80% below current emissions levels), will prevent ever-increasing atmospheric accumulations. The development of national and international policies to combat global climate change is a huge challenge, involving many scientific, economic, and social issues. Trends and Projections for Global Carbon Emissions Global emissions of carbon dioxide from the combustion of fossil fuels rose dramatically during the 20th century, as illustrated in Figure 1. The use of petroleum is currently responsible for about 42% of global carbon emissions, while coal is the source of another 36%. The United States is presently the world’s largest emitter of CO2 – releasing about one-quarter of the global total while having less than 5% of the world’s population. China, the world’s second largest source of CO2 emissions, is likely to surpass the U.S. within the next few years2.
Figure 1. Global Carbon Dioxide Emissions from Fossil Fuel Combustion, 1860-2004
Source: Carbon Dioxide Information Analysis Center (CDIAC), http://cdiac.esd.ornl.gov/trends/emis/em_cont.htm.
2 In June 2007, a Dutch research group reported that China had surpassed the U.S. in carbon emissions, but as of November 2007 this had not been confirmed. Data on recent carbon emissions are not necessarily precise.
5
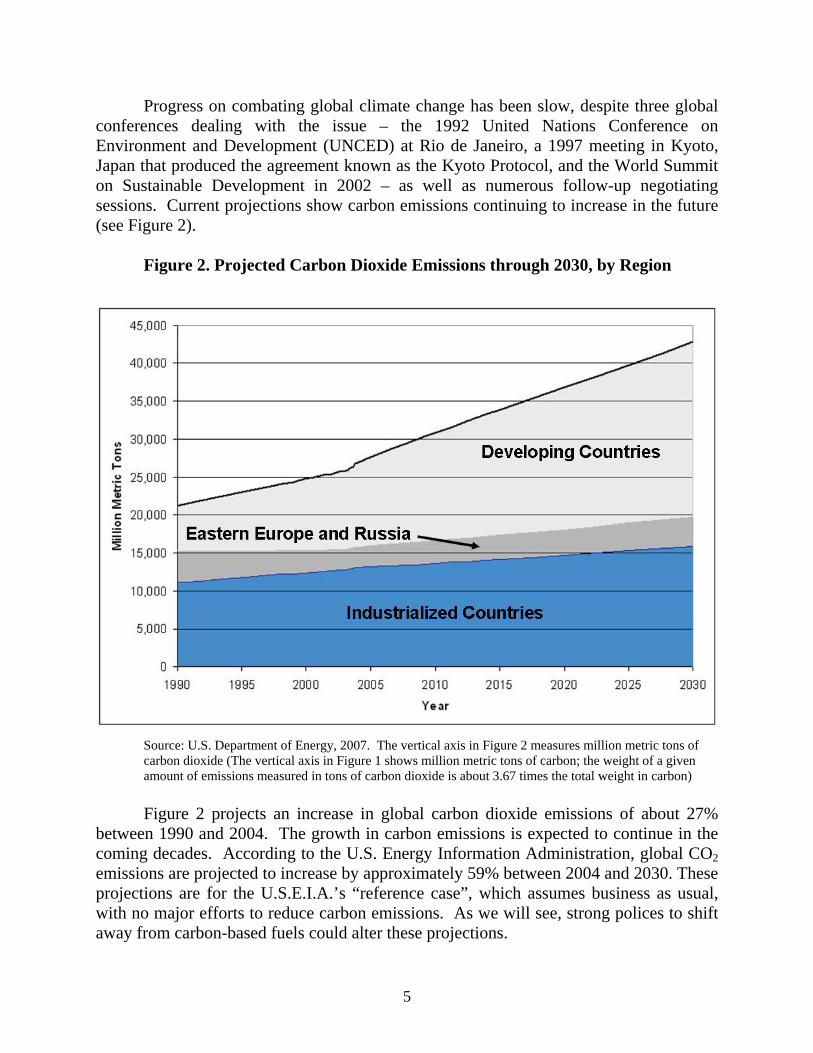
Progress on combating global climate change has been slow, despite three global conferences dealing with the issue – the 1992 United Nations Conference on Environment and Development (UNCED) at Rio de Janeiro, a 1997 meeting in Kyoto, Japan that produced the agreement known as the Kyoto Protocol, and the World Summit on Sustainable Development in 2002 – as well as numerous follow-up negotiating sessions. Current projections show carbon emissions continuing to increase in the future (see Figure 2).
Figure 2. Projected Carbon Dioxide Emissions through 2030, by Region
Source: U.S. Department of Energy, 2007. The vertical axis in Figure 2 measures million metric tons of carbon dioxide (The vertical axis in Figure 1 shows million metric tons of carbon; the weight of a given amount of emissions measured in tons of carbon dioxide is about 3.67 times the total weight in carbon) Figure 2 projects an increase in global carbon dioxide emissions of about 27%
between 1990 and 2004. The growth in carbon emissions is expected to continue in the coming decades. According to the U.S. Energy Information Administration, global CO2 emissions are projected to increase by approximately 59% between 2004 and 2030. These projections are for the U.S.E.I.A.’s “reference case”, which assumes business as usual, with no major efforts to reduce carbon emissions. As we will see, strong polices to shift away from carbon-based fuels could alter these projections.
6
As of 2004, the industrialized countries were responsible for just over half of
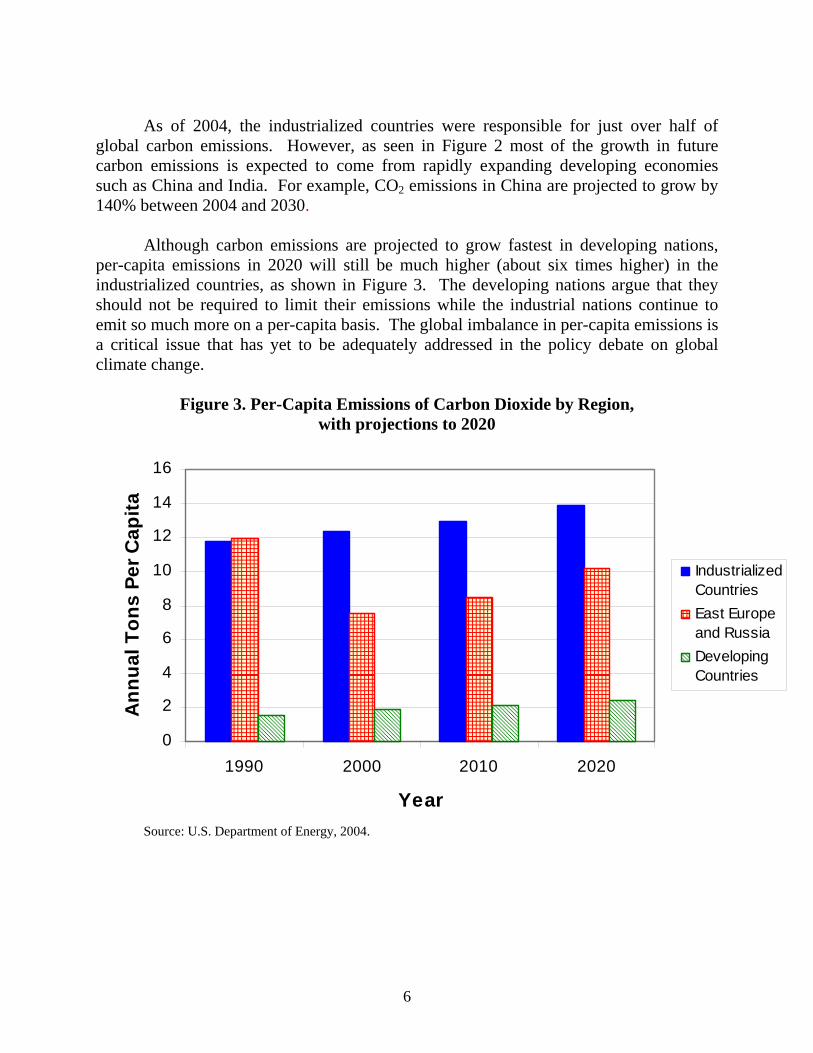
global carbon emissions. However, as seen in Figure 2 most of the growth in future carbon emissions is expected to come from rapidly expanding developing economies such as China and India. For example, CO2 emissions in China are projected to grow by 140% between 2004 and 2030. Although carbon emissions are projected to grow fastest in developing nations, per-capita emissions in 2020 will still be much higher (about six times higher) in the industrialized countries, as shown in Figure 3. The developing nations argue that they should not be required to limit their emissions while the industrial nations continue to emit so much more on a per-capita basis. The global imbalance in per-capita emissions is a critical issue that has yet to be adequately addressed in the policy debate on global climate change.
Figure 3. Per-Capita Emissions of Carbon Dioxide by Region, with projections to 2020
0
2
4
6
8
10
12
14
16
1990 2000 2010 2020
Year
Ann
ual T
ons
Per C
apita
IndustrializedCountriesEast Europeand RussiaDevelopingCountries
Source: U.S. Department of Energy, 2004.
7
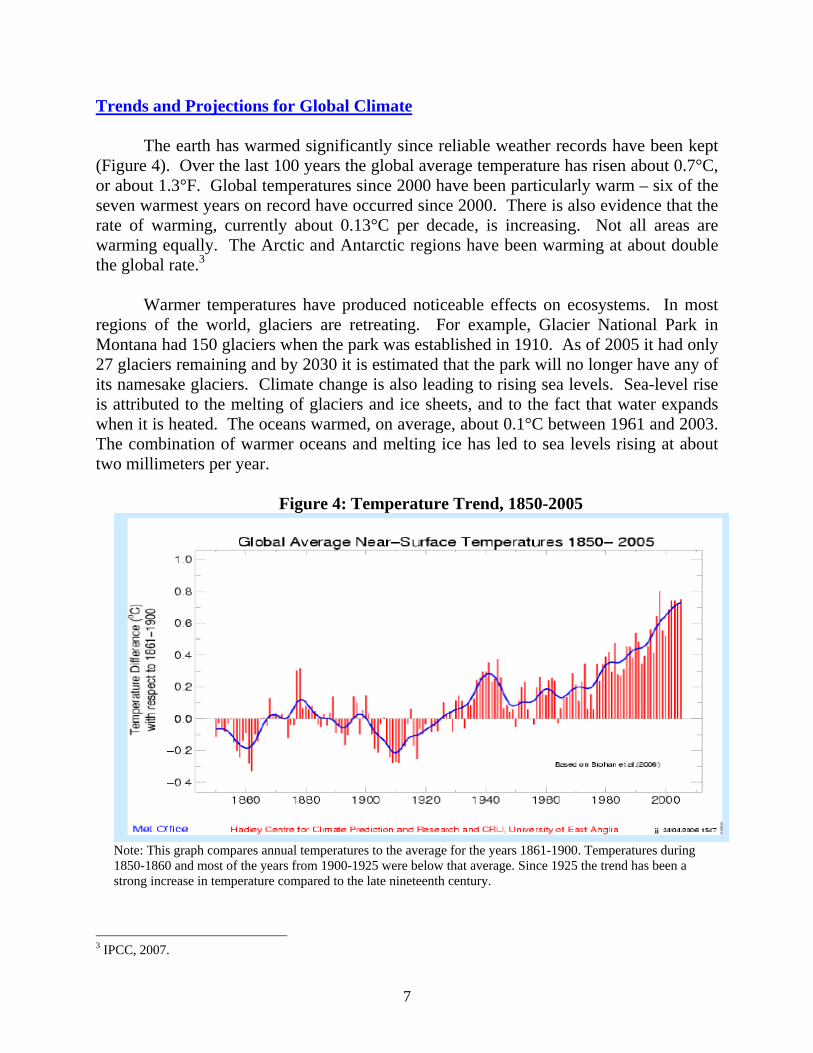
Trends and Projections for Global Climate The earth has warmed significantly since reliable weather records have been kept (Figure 4). Over the last 100 years the global average temperature has risen about 0.7°C, or about 1.3°F. Global temperatures since 2000 have been particularly warm – six of the seven warmest years on record have occurred since 2000. There is also evidence that the rate of warming, currently about 0.13°C per decade, is increasing. Not all areas are warming equally. The Arctic and Antarctic regions have been warming at about double the global rate.3 Warmer temperatures have produced noticeable effects on ecosystems. In most regions of the world, glaciers are retreating. For example, Glacier National Park in Montana had 150 glaciers when the park was established in 1910. As of 2005 it had only 27 glaciers remaining and by 2030 it is estimated that the park will no longer have any of its namesake glaciers. Climate change is also leading to rising sea levels. Sea-level rise is attributed to the melting of glaciers and ice sheets, and to the fact that water expands when it is heated. The oceans warmed, on average, about 0.1°C between 1961 and 2003. The combination of warmer oceans and melting ice has led to sea levels rising at about two millimeters per year.
Figure 4: Temperature Trend, 1850-2005
Note: This graph compares annual temperatures to the average for the years 1861-1900. Temperatures during 1850-1860 and most of the years from 1900-1925 were below that average. Since 1925 the trend has been a strong increase in temperature compared to the late nineteenth century.
3 IPCC, 2007.
8
Although some warming may be a natural trend, the Intergovernmental Panel on
Climate Change (IPCC) in 2007 concluded that: Most of the observed increase in global average temperatures since the mid-20th century is very likely due to the observed increase in anthropogenic greenhouse gas concentrations. Discernable human influences now extend to other aspects of climate, including ocean warming, continental-average temperatures, temperature extremes, and wind patterns. (IPCC, 2007, Summary for Policymakers, p. 10)
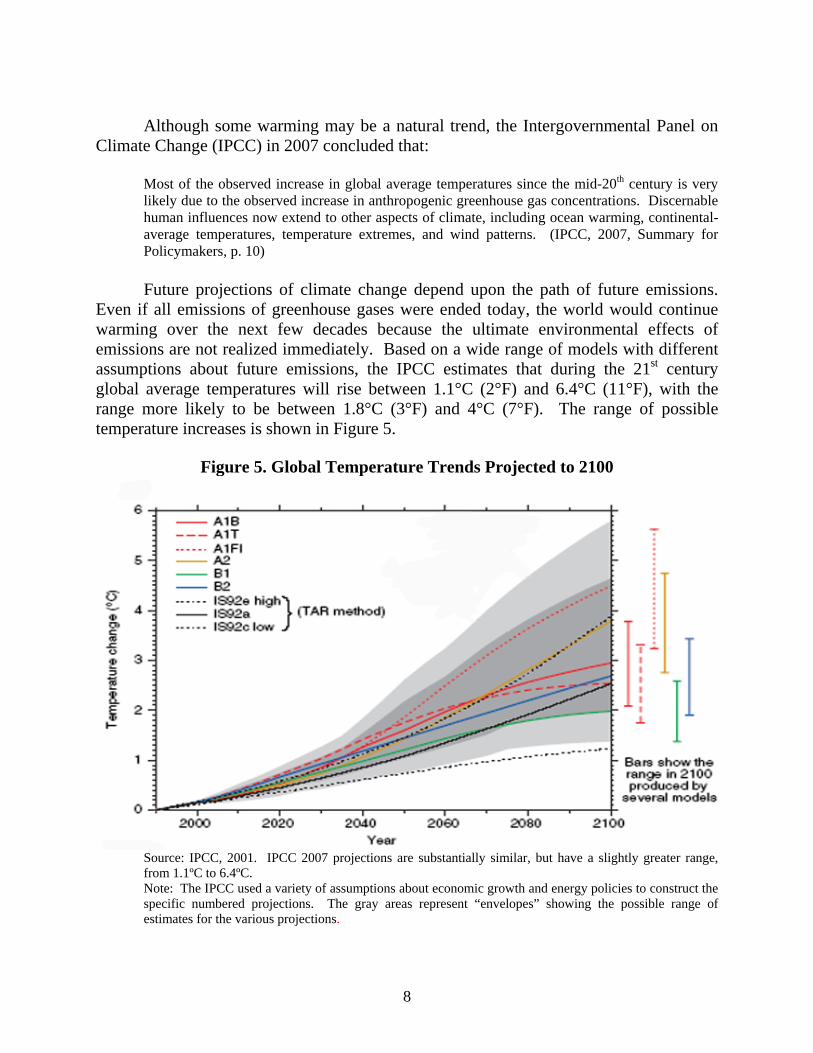
Future projections of climate change depend upon the path of future emissions. Even if all emissions of greenhouse gases were ended today, the world would continue warming over the next few decades because the ultimate environmental effects of emissions are not realized immediately. Based on a wide range of models with different assumptions about future emissions, the IPCC estimates that during the 21st century global average temperatures will rise between 1.1°C (2°F) and 6.4°C (11°F), with the range more likely to be between 1.8°C (3°F) and 4°C (7°F). The range of possible temperature increases is shown in Figure 5.
Figure 5. Global Temperature Trends Projected to 2100
Source: IPCC, 2001. IPCC 2007 projections are substantially similar, but have a slightly greater range, from 1.1ºC to 6.4ºC. Note: The IPCC used a variety of assumptions about economic growth and energy policies to construct the specific numbered projections. The gray areas represent “envelopes” showing the possible range of estimates for the various projections.
9
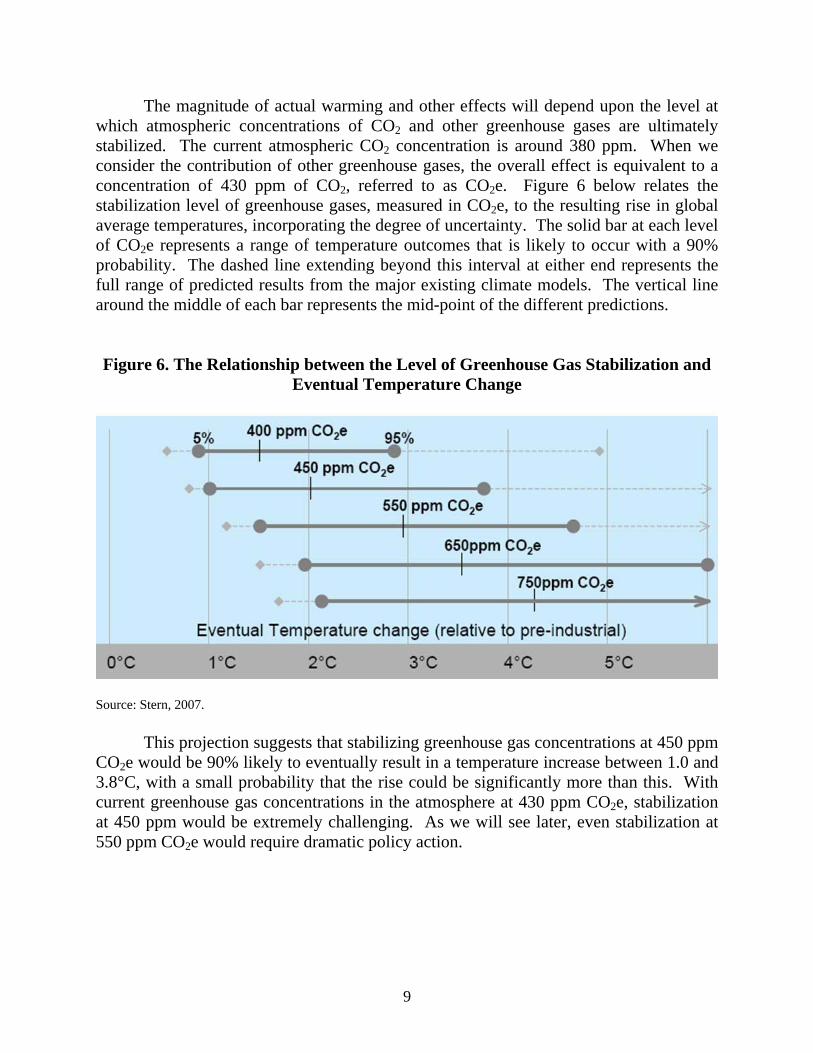
The magnitude of actual warming and other effects will depend upon the level at which atmospheric concentrations of CO2 and other greenhouse gases are ultimately stabilized. The current atmospheric CO2 concentration is around 380 ppm. When we consider the contribution of other greenhouse gases, the overall effect is equivalent to a concentration of 430 ppm of CO2, referred to as CO2e. Figure 6 below relates the stabilization level of greenhouse gases, measured in CO2e, to the resulting rise in global average temperatures, incorporating the degree of uncertainty. The solid bar at each level of CO2e represents a range of temperature outcomes that is likely to occur with a 90% probability. The dashed line extending beyond this interval at either end represents the full range of predicted results from the major existing climate models. The vertical line around the middle of each bar represents the mid-point of the different predictions. Figure 6. The Relationship between the Level of Greenhouse Gas Stabilization and
Eventual Temperature Change
Source: Stern, 2007. This projection suggests that stabilizing greenhouse gas concentrations at 450 ppm CO2e would be 90% likely to eventually result in a temperature increase between 1.0 and 3.8°C, with a small probability that the rise could be significantly more than this. With current greenhouse gas concentrations in the atmosphere at 430 ppm CO2e, stabilization at 450 ppm would be extremely challenging. As we will see later, even stabilization at 550 ppm CO2e would require dramatic policy action.
10
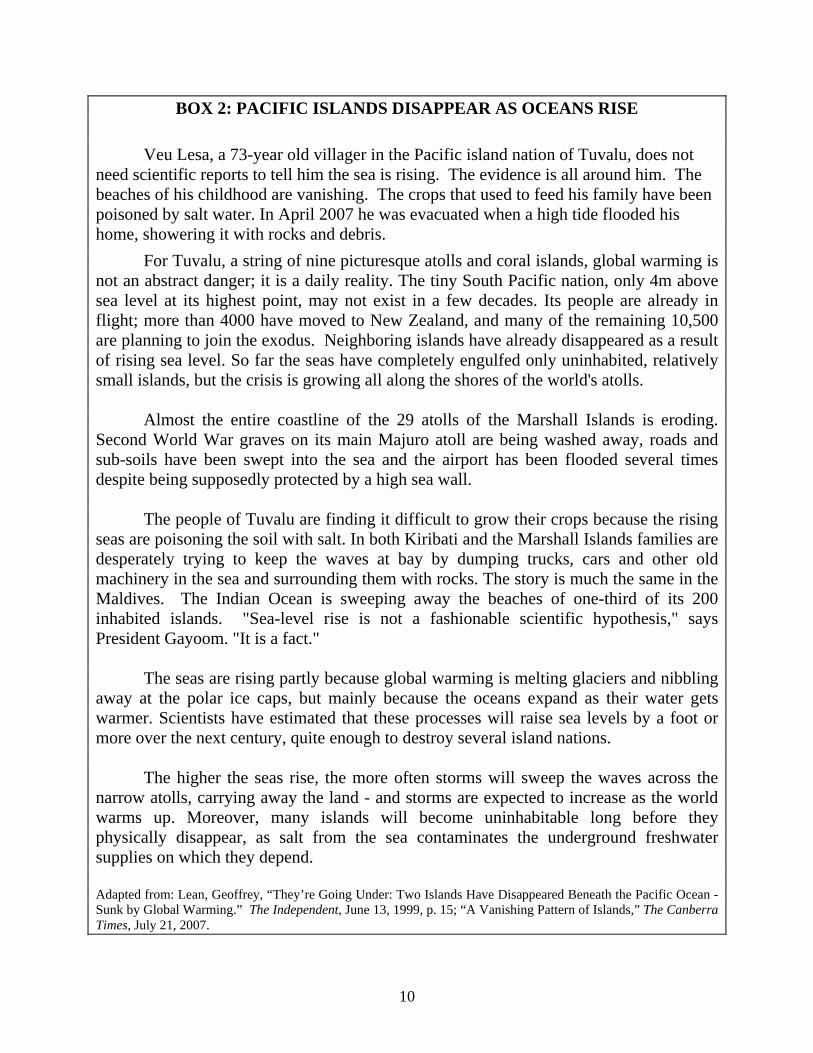
BOX 2: PACIFIC ISLANDS DISAPPEAR AS OCEANS RISE Veu Lesa, a 73-year old villager in the Pacific island nation of Tuvalu, does not need scientific reports to tell him the sea is rising. The evidence is all around him. The beaches of his childhood are vanishing. The crops that used to feed his family have been poisoned by salt water. In April 2007 he was evacuated when a high tide flooded his home, showering it with rocks and debris. For Tuvalu, a string of nine picturesque atolls and coral islands, global warming is not an abstract danger; it is a daily reality. The tiny South Pacific nation, only 4m above sea level at its highest point, may not exist in a few decades. Its people are already in flight; more than 4000 have moved to New Zealand, and many of the remaining 10,500 are planning to join the exodus. Neighboring islands have already disappeared as a result of rising sea level. So far the seas have completely engulfed only uninhabited, relatively small islands, but the crisis is growing all along the shores of the world's atolls. Almost the entire coastline of the 29 atolls of the Marshall Islands is eroding. Second World War graves on its main Majuro atoll are being washed away, roads and sub-soils have been swept into the sea and the airport has been flooded several times despite being supposedly protected by a high sea wall. The people of Tuvalu are finding it difficult to grow their crops because the rising seas are poisoning the soil with salt. In both Kiribati and the Marshall Islands families are desperately trying to keep the waves at bay by dumping trucks, cars and other old machinery in the sea and surrounding them with rocks. The story is much the same in the Maldives. The Indian Ocean is sweeping away the beaches of one-third of its 200 inhabited islands. "Sea-level rise is not a fashionable scientific hypothesis," says President Gayoom. "It is a fact." The seas are rising partly because global warming is melting glaciers and nibbling away at the polar ice caps, but mainly because the oceans expand as their water gets warmer. Scientists have estimated that these processes will raise sea levels by a foot or more over the next century, quite enough to destroy several island nations. The higher the seas rise, the more often storms will sweep the waves across the narrow atolls, carrying away the land - and storms are expected to increase as the world warms up. Moreover, many islands will become uninhabitable long before they physically disappear, as salt from the sea contaminates the underground freshwater supplies on which they depend. Adapted from: Lean, Geoffrey, “They’re Going Under: Two Islands Have Disappeared Beneath the Pacific Ocean - Sunk by Global Warming.” The Independent, June 13, 1999, p. 15; “A Vanishing Pattern of Islands,” The Canberra Times, July 21, 2007.
11
2. ECONOMIC ANALYSIS OF CLIMATE CHANGE Scientists have modeled the effects of a projected doubling of accumulated carbon dioxide in the earth’s atmosphere. Some of the predicted effects are:
• Loss of land area, including beaches and wetlands, to sea-level rise • Loss of species and forest area, including coral reefs and wetlands • Disruption of water supplies to cities and agriculture • Health damage and deaths from heat waves and spread of tropical diseases • Increased costs of air conditioning • Loss of agricultural output due to drought
Some beneficial outcomes might include:
• Increased agricultural production in cold climates • Lower heating costs • Less deaths from exposure to cold
In addition to these effects, there are some other, less predictable but possibly
more damaging effects, including:
• Disruption of weather patterns, with increased frequency of hurricanes and other extreme weather events
• A possible rapid collapse of the Greenland and West Antarctic Ice Sheets, which would raise sea levels by 12 meters or more, drowning major coastal cities
• Sudden major climate changes, such as a shift in the Atlantic Gulf Stream, which could change the climate of Europe to that of Alaska
• Positive feedback effects,4 such as an increased release of carbon dioxide from warming arctic tundra, which would speed up global warming
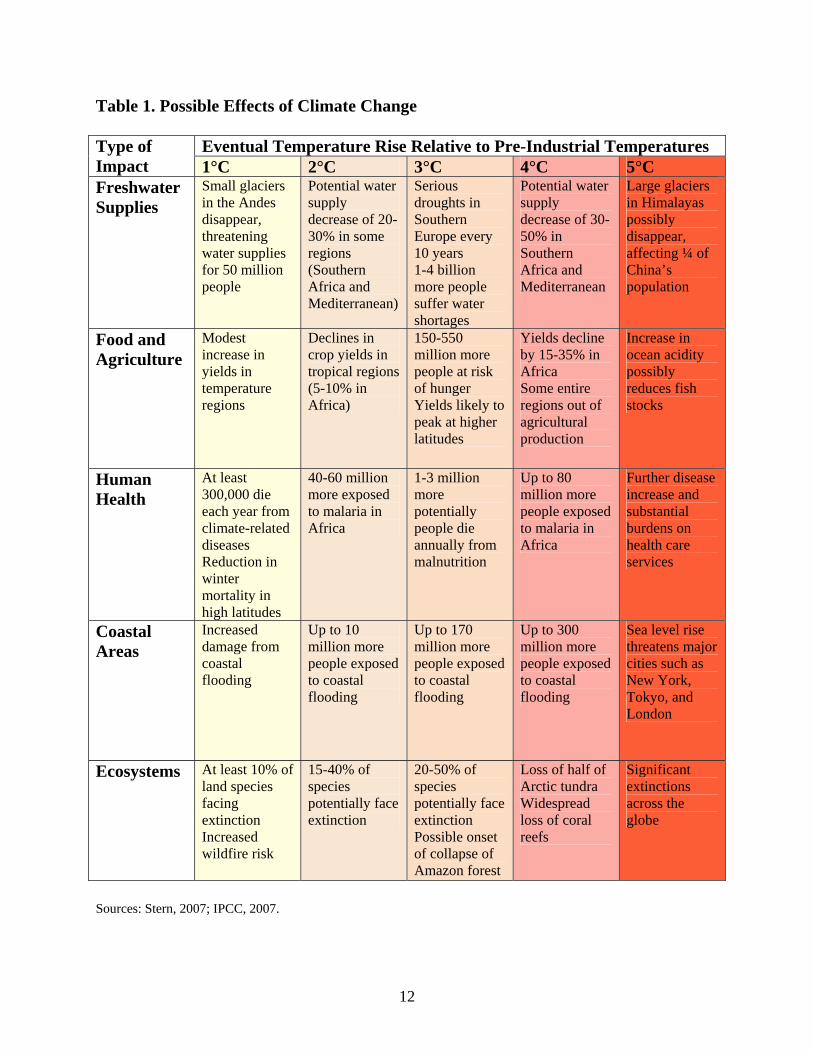
The IPCC projects that with increasing emissions and higher temperatures, negative effects will intensify and positive effects diminish (Table 1). As shown in Figure 5, there is considerable uncertainty about the expected global warming in the next century. We need to keep such uncertainties in mind as we evaluate economic analyses of global climate change.
4 A feedback effect occurs when an original change in a system causes further changes that either reinforce the original change (positive feedback) or counteract it (negative feedback).
12
Table 1. Possible Effects of Climate Change
Eventual Temperature Rise Relative to Pre-Industrial Temperatures Type of Impact 1°C 2°C 3°C 4°C 5°C Freshwater Supplies
Small glaciers in the Andes disappear, threatening water supplies for 50 million people
Potential water supply decrease of 20-30% in some regions (Southern Africa and Mediterranean)
Serious droughts in Southern Europe every 10 years 1-4 billion more people suffer water shortages
Potential water supply decrease of 30-50% in Southern Africa and Mediterranean
Large glaciers in Himalayas possibly disappear, affecting ¼ of China’s population
Food and Agriculture
Modest increase in yields in temperature regions
Declines in crop yields in tropical regions (5-10% in Africa)
150-550 million more people at risk of hunger Yields likely to peak at higher latitudes
Yields decline by 15-35% in Africa Some entire regions out of agricultural production
Increase in ocean acidity possibly reduces fish stocks
Human Health
At least 300,000 die each year from climate-related diseases Reduction in winter mortality in high latitudes
40-60 million more exposed to malaria in Africa
1-3 million more potentially people die annually from malnutrition
Up to 80 million more people exposed to malaria in Africa
Further disease increase and substantial burdens on health care services
Coastal Areas
Increased damage from coastal flooding
Up to 10 million more people exposed to coastal flooding
Up to 170 million more people exposed to coastal flooding
Up to 300 million more people exposed to coastal flooding
Sea level rise threatens major cities such as New York, Tokyo, and London
Ecosystems
At least 10% of land species facing extinction Increased wildfire risk
15-40% of species potentially face extinction
20-50% of species potentially face extinction Possible onset of collapse of Amazon forest
Loss of half of Arctic tundra Widespread loss of coral reefs
Significant extinctions across the globe
Sources: Stern, 2007; IPCC, 2007.
13
Given these uncertainties, some economists have attempted to place the analysis of global climate change in the context of cost-benefit analysis. Others have criticized this approach as an attempt to put a monetary valuation on issues with social, political, and ecological implications that go far beyond dollar value. We will first examine economists’ efforts to capture the impacts of global climate change through cost-benefit analysis, and then return to the debate over how to implement greenhouse gas reduction polices. Cost-Benefit Studies of Global Climate Change
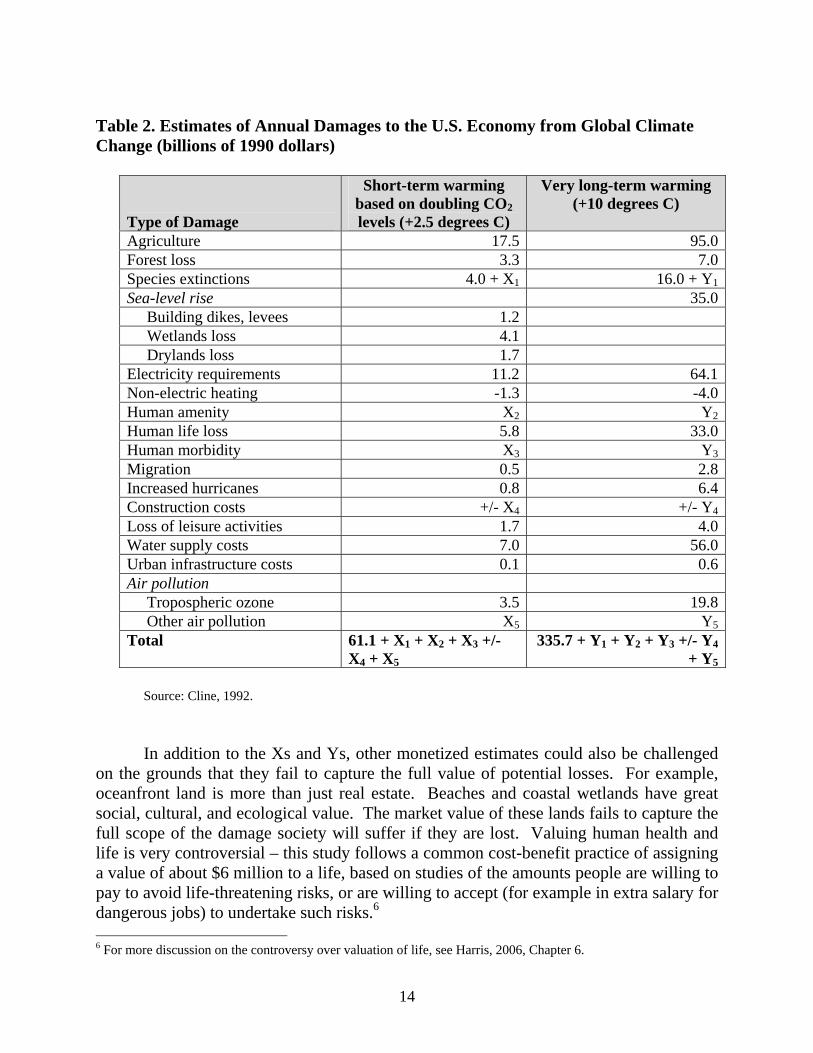
Without policy intervention, carbon emissions can be expected to continue to rise approximately as projected in Figure 2. Aggressive and immediate policy action would be required first to stabilize and then to reduce total CO2 emissions in the coming decades. In performing a cost-benefit analysis, we must weigh the consequences of the projected increase in carbon emissions versus the costs of current policy actions to stabilize or even reduce CO2 emissions. Strong policy action to prevent climate change will bring benefits equal to the value of damages that are avoided5. These benefits must be compared to the costs of taking action. Various economic studies have attempted to estimate these benefits and costs. The results of one such study for the U.S. economy are shown in Table 2. The study is based on an estimated doubling of CO2 over pre-industrial levels. When the monetized costs are added up, the total annual U.S. damages are estimated at approximately $60 billion (1990 dollars). This is about 1% of U.S. GNP. Although different economic studies come up with different estimates, most of them are in the range of 1-2% GNP. Cost estimates for larger temperature change over the longer term rise to around 5% of GNP (the far-right column of Table 2). Note, however, that there are also some “Xs” and “Ys” in the totals – unknown quantities that cannot easily be measured. The damages from species extinctions, for example, are difficult to estimate in dollar terms: the estimates used here show a cost of at least $4 billion in the short term and $16 billion in the long term, with additional unknown costs in both the short and long term.
5 These benefits of preventing damage can also be referred to as avoided costs.
14
Table 2. Estimates of Annual Damages to the U.S. Economy from Global Climate Change (billions of 1990 dollars)
Type of Damage
Short-term warming based on doubling CO2 levels (+2.5 degrees C)
Very long-term warming (+10 degrees C)
Agriculture 17.5 95.0Forest loss 3.3 7.0Species extinctions 4.0 + X1 16.0 + Y1Sea-level rise 35.0 Building dikes, levees 1.2 Wetlands loss 4.1 Drylands loss 1.7Electricity requirements 11.2 64.1Non-electric heating -1.3 -4.0Human amenity X2 Y2Human life loss 5.8 33.0Human morbidity X3 Y3Migration 0.5 2.8Increased hurricanes 0.8 6.4Construction costs +/- X4 +/- Y4Loss of leisure activities 1.7 4.0Water supply costs 7.0 56.0Urban infrastructure costs 0.1 0.6Air pollution Tropospheric ozone 3.5 19.8 Other air pollution X5 Y5Total 61.1 + X1 + X2 + X3 +/-
X4 + X5 335.7 + Y1 + Y2 + Y3 +/- Y4
+ Y5
Source: Cline, 1992. In addition to the Xs and Ys, other monetized estimates could also be challenged on the grounds that they fail to capture the full value of potential losses. For example, oceanfront land is more than just real estate. Beaches and coastal wetlands have great social, cultural, and ecological value. The market value of these lands fails to capture the full scope of the damage society will suffer if they are lost. Valuing human health and life is very controversial – this study follows a common cost-benefit practice of assigning a value of about $6 million to a life, based on studies of the amounts people are willing to pay to avoid life-threatening risks, or are willing to accept (for example in extra salary for dangerous jobs) to undertake such risks.6 6 For more discussion on the controversy over valuation of life, see Harris, 2006, Chapter 6.
15
In addition, these estimates omit the possibility of the much more catastrophic consequences that could result if weather disruption is much worse than anticipated. Hurricane Katrina in August 2005, for example, caused over $80 billion in damage, in addition to loss of over 1800 lives. If climate changes cause severe hurricanes to become much more frequent, the estimate given in Table 2 of less than one billion annual losses could be much too low. Another of the unknown values – human morbidity, or losses from disease – could well be enormous if tropical diseases extend their range significantly due to warmer weather conditions. Clearly, these damage estimates are not precise, and are open to many criticisms. But suppose we decide to accept them – at least as a rough estimate. We must then weigh the estimated benefits of policies to prevent climate change against the costs of such policies. To estimate these costs, economists use models that show how economic output is produced from factor inputs such as labor, capital, and resources. To lower carbon emissions, we must cut back the use of fossil fuels, substituting other energy sources that may be more expensive. In general, economic models predict that this substitution would reduce GNP growth. One major study showed GNP losses ranging from 1 to 3 percent of GNP for most countries, with higher potential long-term losses for coal-dependent developing nations such as China7. How can we weight the costs of taking action on global warming against the benefits in terms of avoided damage? Much depends on our evaluation of future costs and benefits. The costs of taking action must be born today or in the near future. Many of the benefits of taking action (the avoided costs of damages) are further in the future. How can we decide today how to balance these future costs and benefits? Economists evaluate future costs and benefits by the use of a discount rate. Costs and benefits in the future are considered to have a lower dollar value than the same costs and benefits today, with the size of the difference depending on the choice of discount rate (see Box 3). The problems and implicit value judgments associated with discounting add to the issues of ethics and judgment that we have already noted in valuing costs and benefits. This suggests that we should consider some alternative approaches – including techniques that incorporate ecological as well as economic costs and benefits.
7 Manne and Richels, 1992.
16
BOX 3: DISCOUNTING
Economists calculate the present value of a cost or benefit of $X that occurs in years in the future using the equation:
Present Value ($X) = $X / (1 + r)n
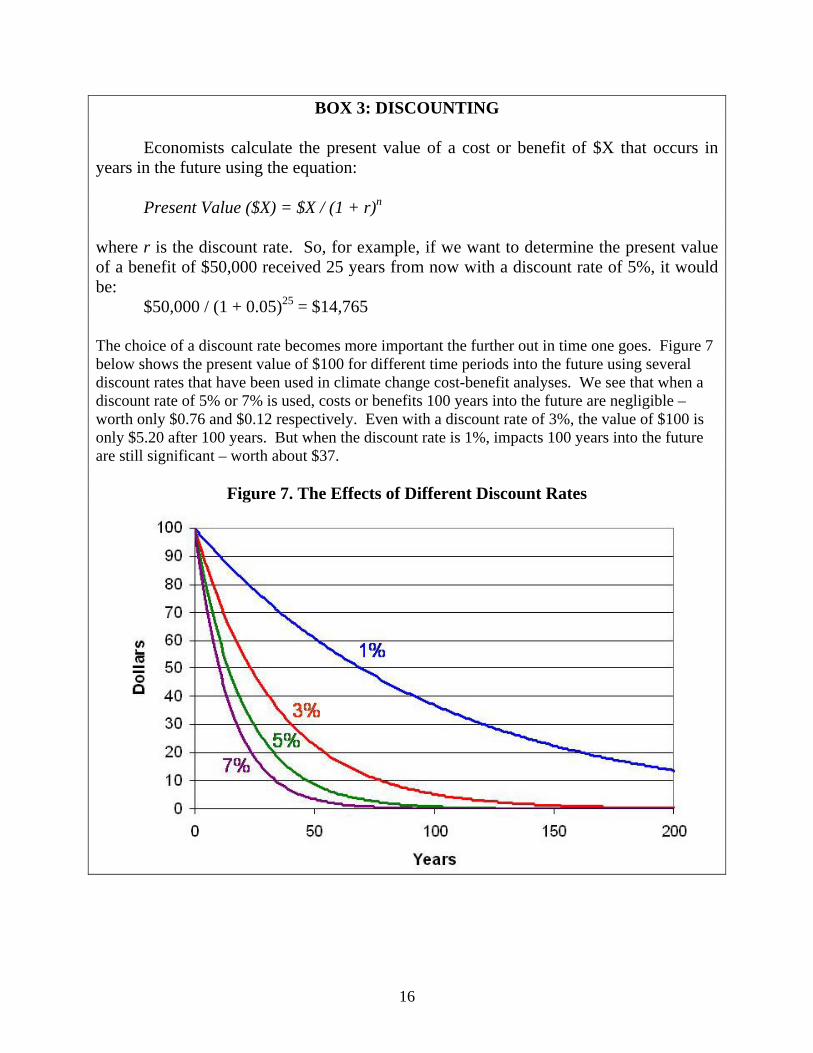
where r is the discount rate. So, for example, if we want to determine the present value of a benefit of $50,000 received 25 years from now with a discount rate of 5%, it would be: $50,000 / (1 + 0.05)25 = $14,765 The choice of a discount rate becomes more important the further out in time one goes. Figure 7 below shows the present value of $100 for different time periods into the future using several discount rates that have been used in climate change cost-benefit analyses. We see that when a discount rate of 5% or 7% is used, costs or benefits 100 years into the future are negligible – worth only $0.76 and $0.12 respectively. Even with a discount rate of 3%, the value of $100 is only $5.20 after 100 years. But when the discount rate is 1%, impacts 100 years into the future are still significant – worth about $37.
Figure 7. The Effects of Different Discount Rates
17
3. ANALYZING LONG-TERM EFFECTS OF CLIMATE CHANGE Economic studies dealing with benefit-cost analysis of climate change have come to very different conclusions about policy. According to a study by William Nordhaus and Joseph Boyer8, the “optimal” policy strategy would be only a small reduction in greenhouse gas emissions below current projections. This would require few changes in the carbon-based energy path typical of current economic development. Until recently, most economic studies of climate change reached conclusions similar to those of the Nordhaus and Boyer study, although a few recommended more drastic action. The debate on climate change economics altered in October 2006, when Nicholas Stern, a former chief economist for the World Bank, released a 700-page report, sponsored by the British government, titled “The Stern Review on the Economics of Climate Change”.9 Publication of the Stern Review generated significant media attention and has intensified the debate about climate change in policy and academic circles. While most previous economic analyses of climate change suggested relatively modest policy responses, the Stern Review strongly recommends immediate and substantial policy action:
The scientific evidence is now overwhelming: climate change is a serious global threat, and it demands an urgent global response. This Review has assessed a wide range of evidence on the impacts of climate change and on the economic costs, and has used a number of different techniques to assess costs and risks. From all these perspectives, the evidence gathered by the Review leads to a simple conclusion: the benefits of strong and early action far outweigh the economic costs of not acting. Using the results from formal economic models, the Review estimates that if we don’t act, the overall costs and risks of climate change will be equivalent to losing at least 5% of global GDP each year, now and forever. If a wider range of risks and impacts is taken into account, the estimates of damage could rise to 20% of GDP or more. In contrast, the costs of action – reducing greenhouse gas emissions to avoid the worst impacts of climate change – can be limited to around 1% of global GDP each year.10
What explains the dramatic difference between these two approaches to economic analysis of climate change? One major difference is the choice of the discount rate to use in valuing future costs and benefits. The present value (PV) of a long-term stream of benefits or costs depends on the discount rate. A high discount rate will lead to a low present valuation for benefits that are mainly in the longer-term, and a high present valuation for short-term costs. On the
8 Nordhaus and Boyer, 2000. 9 Now available in book form (Stern, 2007). The full Stern Review is available online at http://www.hm-treasury.gov.uk/independent_reviews/stern_review_economics_climate_change/sternreview_index.cfm, including both a 4-page and 27-page summaries. 10 Stern Review, Short Executive Summary, page vi.
18
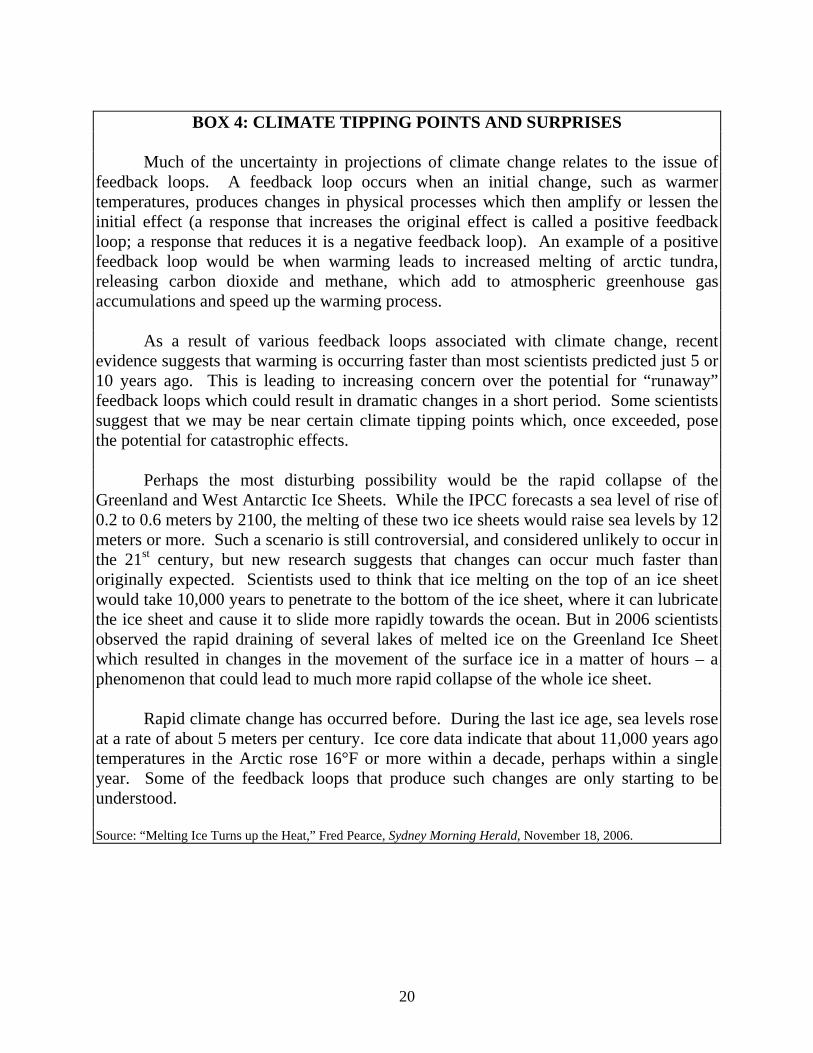
other hand, a low discount rate will lead to a higher present valuation for longer-term benefits. The estimated net present value of an aggressive abatement policy will thus be much higher if we choose a low discount rate (see Box 3). While both the Stern and Nordhaus/Boyer studies used standard economic methodology, Stern’s approach gives greater weight to long-term ecological effects. The Stern Review uses a low discount rate of 1.4% to balance present and future costs. Thus even though costs of aggressive action appear higher than benefits for several decades, the high potential long-term damages sway the balance in favor of aggressive action today. These are significant both for their monetary and non-monetary impacts. In the long term, damage done to the environment by global climate change will have significant negative effects on the economy too. But the use of a standard discount rate of in the 5-10% range has the effect of reducing the present value of significant long-term future damages to relative insignificance. Another difference between the two studies concerns their treatment of uncertainty. Stern’s approach gives a heavier weighting to uncertain, but potentially catastrophic impacts. This reflects the application of a precautionary principle: if a particular outcome could be catastrophic, even though it seems unlikely, strong measures should be taken to avoid it. This principle, which has become more widely used in environmental risk management, is especially important for global climate change because of the many unknown but potentially disastrous outcomes possibly associated with continued greenhouse gas accumulation (see Box 4). A third area of difference concerns the assessment of the economic costs of action to mitigate climate change. Measures taken to prevent global climate change will have economic effects on GDP, consumption, and employment, which explains the reluctance of governments to take drastic measures to reduce significantly emissions of CO2. But these effects will not all be negative. The Stern Review conducted a comprehensive review of economic models of the costs of carbon reduction. These cost estimates are very much dependent on the modeling assumptions that are used. The predicted costs of stabilizing atmospheric accumulations of CO2 at 450 parts per million range from a 3.4 percent decrease to a 3.9.percent increase in GDP. The outcomes depend on a range of assumptions including:
• The efficiency or inefficiency of economic responses to energy price signals • The availability of non-carbon “backstop” energy technologies • Whether or not nations can trade least-cost options for carbon reduction • Whether or not revenues from taxes on carbon-based fuels are used to lower other
taxes
19
• Whether or not external benefits of carbon reduction, including reduction in ground-level air pollution, are taken into account11
Depending on which assumptions are made, policies for emissions reduction could range from a minimalist approach of slightly reducing the rate of increase in emissions to a dramatic CO2 emissions reduction of 50% - 80%. Climate Change and Inequality The effects of climate change will fall most heavily upon the poor of the world. For example, analysis by the IPCC found that a 2.5°C temperature increase would result in a loss of 1.0 to 1.5% of GDP in developed countries but a 2–9% loss of GDP in developing countries.12 While the richer countries may have the economic resources to adapt to many of the effects of climate change, poorer countries will be unable to implement preventative measures, especially those that rely on the newest technologies. The way in which economists incorporate inequality into their analyses can have a significant impact on their policy recommendations. If all costs are evaluated in dollars, a loss of, say, 10% of GDP in a poor country is likely to be much less than a loss of 3% of GDP in a rich country. Thus the damages from climate change in poor countries, which may be large as a percentage of GDP, would receive relatively little weight because the losses are relatively small in dollar terms. The Stern Review asserts that the disproportionate effects of climate change on the world’s poorest people should increase the estimated costs of climate change. Stern estimates that, without the effects of inequity, the costs of a BAU scenario will be 11-14% of global GDP. Weighing the impacts on the world’s poor more heavily gives a cost estimate of 20% of global GDP. Thus we see that assumptions about the proper way to evaluate social and environmental costs and benefits can make a big difference to policy recommendations. Most economists who have analyzed the problem agree that action is necessary (see Box 5) but there is a wide scope of opinion on how drastic this action should be, and how soon it should occur.
11 Stern Review, Chapter 10: “Macroeconomic Models of Costs”. 12 IPCC, Second Assessment Report, 1996.
20
BOX 4: CLIMATE TIPPING POINTS AND SURPRISES
Much of the uncertainty in projections of climate change relates to the issue of feedback loops. A feedback loop occurs when an initial change, such as warmer temperatures, produces changes in physical processes which then amplify or lessen the initial effect (a response that increases the original effect is called a positive feedback loop; a response that reduces it is a negative feedback loop). An example of a positive feedback loop would be when warming leads to increased melting of arctic tundra, releasing carbon dioxide and methane, which add to atmospheric greenhouse gas accumulations and speed up the warming process. As a result of various feedback loops associated with climate change, recent evidence suggests that warming is occurring faster than most scientists predicted just 5 or 10 years ago. This is leading to increasing concern over the potential for “runaway” feedback loops which could result in dramatic changes in a short period. Some scientists suggest that we may be near certain climate tipping points which, once exceeded, pose the potential for catastrophic effects. Perhaps the most disturbing possibility would be the rapid collapse of the Greenland and West Antarctic Ice Sheets. While the IPCC forecasts a sea level of rise of 0.2 to 0.6 meters by 2100, the melting of these two ice sheets would raise sea levels by 12 meters or more. Such a scenario is still controversial, and considered unlikely to occur in the 21st century, but new research suggests that changes can occur much faster than originally expected. Scientists used to think that ice melting on the top of an ice sheet would take 10,000 years to penetrate to the bottom of the ice sheet, where it can lubricate the ice sheet and cause it to slide more rapidly towards the ocean. But in 2006 scientists observed the rapid draining of several lakes of melted ice on the Greenland Ice Sheet which resulted in changes in the movement of the surface ice in a matter of hours – a phenomenon that could lead to much more rapid collapse of the whole ice sheet. Rapid climate change has occurred before. During the last ice age, sea levels rose at a rate of about 5 meters per century. Ice core data indicate that about 11,000 years ago temperatures in the Arctic rose 16°F or more within a decade, perhaps within a single year. Some of the feedback loops that produce such changes are only starting to be understood. Source: “Melting Ice Turns up the Heat,” Fred Pearce, Sydney Morning Herald, November 18, 2006.
21
4. POLICY RESPONSES TO CLIMATE CHANGE
Two types of measures can be used to address climate change; preventive measures tend to lower or mitigate the greenhouse effect, and adaptive measures deal with the consequences of the greenhouse effect and trying to minimize their impact. Preventive measures include:
• Reducing emissions of greenhouse gases, either by reducing the level of emissions-related economic activities or by shifting to more energy-efficient technologies that would allow the same level of economic activity at a lower level of CO2 emissions.
• Enhancing carbon sinks.13 Forests recycle CO2 into oxygen; preserving forested
areas and expanding reforestation have a significant effect on net CO2 emissions. Adaptive measures include:
• Construction of dikes and seawalls to protection against rising sea level and extreme weather events such as floods and hurricanes.
• Shifting cultivation patterns in agriculture to adapt to changed weather conditions
in different areas, and relocating people away from low-lying coastal areas. • Creating institutions that can mobilize the needed human, material, and financial
resources to respond to climate-related disasters.
For any particular preventive or adaptive measure, an economic approach suggests that we should apply cost-effectiveness analysis in considering which policies to adopt. The use of cost-effectiveness analysis avoids many of the controversies associated with cost-benefit analysis. While cost-benefit analysis attempts to offer a basis for deciding whether or not a policy should be implemented, cost-effectiveness analysis accepts a goal as given by society, and uses economic techniques to evaluate the most efficient way to reach that goal. In general, economists favor approaches that work through market mechanisms to achieve their goals (see Box 5). Market-oriented approaches are considered to be cost-effective; rather than attempting to control market actors directly, they shift incentives so that individuals and firms will change their behavior to take account of external costs and
13 Carbon sinks are areas where excess carbon may be stored. Natural sinks include the oceans and forests. Human intervention can either reduce or expand these sinks through forest management and agricultural practices.
22
benefits. Examples of market-based policy tools include pollution taxes and transferable, or tradable, permits. Both of these are potentially useful tools for greenhouse gas reduction. Other relevant economic policies include measures to create incentives for the adoption of renewable energy sources and energy-efficient technology.
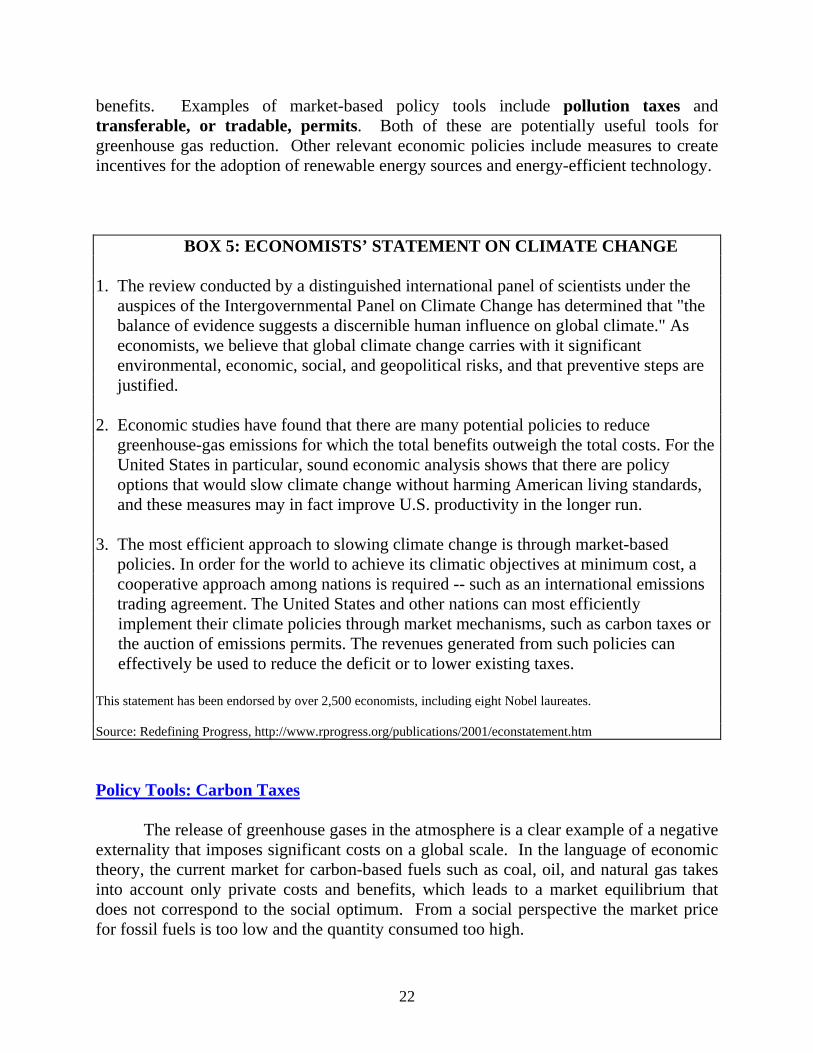
BOX 5: ECONOMISTS’ STATEMENT ON CLIMATE CHANGE 1. The review conducted by a distinguished international panel of scientists under the auspices of the Intergovernmental Panel on Climate Change has determined that "the balance of evidence suggests a discernible human influence on global climate." As economists, we believe that global climate change carries with it significant environmental, economic, social, and geopolitical risks, and that preventive steps are justified. 2. Economic studies have found that there are many potential policies to reduce greenhouse-gas emissions for which the total benefits outweigh the total costs. For the United States in particular, sound economic analysis shows that there are policy options that would slow climate change without harming American living standards, and these measures may in fact improve U.S. productivity in the longer run. 3. The most efficient approach to slowing climate change is through market-based policies. In order for the world to achieve its climatic objectives at minimum cost, a cooperative approach among nations is required -- such as an international emissions trading agreement. The United States and other nations can most efficiently implement their climate policies through market mechanisms, such as carbon taxes or the auction of emissions permits. The revenues generated from such policies can effectively be used to reduce the deficit or to lower existing taxes. This statement has been endorsed by over 2,500 economists, including eight Nobel laureates. Source: Redefining Progress, http://www.rprogress.org/publications/2001/econstatement.htm Policy Tools: Carbon Taxes The release of greenhouse gases in the atmosphere is a clear example of a negative externality that imposes significant costs on a global scale. In the language of economic theory, the current market for carbon-based fuels such as coal, oil, and natural gas takes into account only private costs and benefits, which leads to a market equilibrium that does not correspond to the social optimum. From a social perspective the market price for fossil fuels is too low and the quantity consumed too high.
23
A standard economic remedy for internalizing external costs is a per-unit tax on the pollutant. In this case, what is called for is a carbon tax, levied exclusively on carbon-based fossil fuels in proportion to the amount of carbon associated with their production and use. Such a tax will raise the price of carbon-based energy sources, and so give consumers incentives to conserve energy overall, as well as shifting their demand to alternative, non-carbon sources of energy (which are not taxed). Demand may also shift from carbon-based fuels with a higher proportion of carbon, such as coal, to those with relatively lower carbon content, such as natural gas.
“Carbon taxes would appear to consumers as energy price increases. But since taxes would be levied on primary energy, which represents only one part of the cost of delivered energy (such as gasoline or electricity) and more important, since one fuel can in many cases be substituted for another, overall price increases may not be jolting. Consumers can respond to new prices by reducing energy use and buying fewer carbon-intensive products (those that require great amounts of carbon-based fuels to produce). In addition, some of these savings could be used to buy other less carbon-intensive goods and services.
“Clearly, a carbon tax creates an incentive for producers and consumers to avoid paying the tax by reducing their use of carbon-intensive fuels. Contrary to other taxed items and activities, this avoidance has social benefits – reduced energy use and reduced CO2 emissions. Thus, declining tax revenues over time indicate policy success – just the opposite of what happens when tax policy seeks to maintain steady or increasing revenues.”14
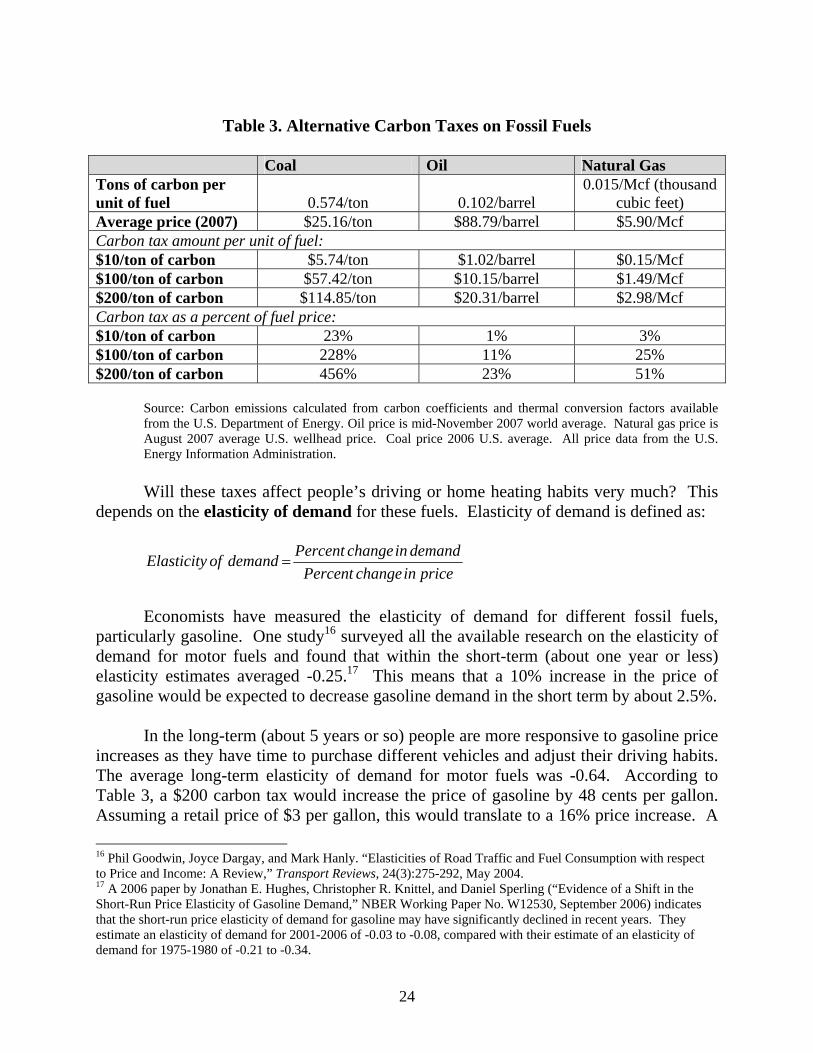
Table 3 shows the impact that different levels of a carbon tax would have on the prices of coal, oil, and natural gas. A $10/ton carbon tax, for example, raises the price of a barrel of oil by about a dollar, equivalent to only about two cents per gallon.15 A $100/ton carbon tax would equate to an increase in gasoline prices of about 24 cents per gallon.
14 Dower and Zimmerman, 1992. 15 There are 42 gallons in a barrel of oil.
24
Table 3. Alternative Carbon Taxes on Fossil Fuels
Coal Oil Natural Gas Tons of carbon per unit of fuel
0.574/ton
0.102/barrel
0.015/Mcf (thousand cubic feet)
Average price (2007) $25.16/ton $88.79/barrel $5.90/Mcf Carbon tax amount per unit of fuel: $10/ton of carbon $5.74/ton $1.02/barrel $0.15/Mcf $100/ton of carbon $57.42/ton $10.15/barrel $1.49/Mcf $200/ton of carbon $114.85/ton $20.31/barrel $2.98/Mcf Carbon tax as a percent of fuel price: $10/ton of carbon 23% 1% 3% $100/ton of carbon 228% 11% 25% $200/ton of carbon 456% 23% 51%
Source: Carbon emissions calculated from carbon coefficients and thermal conversion factors available from the U.S. Department of Energy. Oil price is mid-November 2007 world average. Natural gas price is August 2007 average U.S. wellhead price. Coal price 2006 U.S. average. All price data from the U.S. Energy Information Administration.
Will these taxes affect people’s driving or home heating habits very much? This depends on the elasticity of demand for these fuels. Elasticity of demand is defined as:
priceinchangePercent
demandinchangePercentdemandofElasticity =
Economists have measured the elasticity of demand for different fossil fuels, particularly gasoline. One study16 surveyed all the available research on the elasticity of demand for motor fuels and found that within the short-term (about one year or less) elasticity estimates averaged -0.25.17 This means that a 10% increase in the price of gasoline would be expected to decrease gasoline demand in the short term by about 2.5%. In the long-term (about 5 years or so) people are more responsive to gasoline price increases as they have time to purchase different vehicles and adjust their driving habits. The average long-term elasticity of demand for motor fuels was -0.64. According to Table 3, a $200 carbon tax would increase the price of gasoline by 48 cents per gallon. Assuming a retail price of $3 per gallon, this would translate to a 16% price increase. A 16 Phil Goodwin, Joyce Dargay, and Mark Hanly. “Elasticities of Road Traffic and Fuel Consumption with respect to Price and Income: A Review,” Transport Reviews, 24(3):275-292, May 2004. 17 A 2006 paper by Jonathan E. Hughes, Christopher R. Knittel, and Daniel Sperling (“Evidence of a Shift in the Short-Run Price Elasticity of Gasoline Demand,” NBER Working Paper No. W12530, September 2006) indicates that the short-run price elasticity of demand for gasoline may have significantly declined in recent years. They estimate an elasticity of demand for 2001-2006 of -0.03 to -0.08, compared with their estimate of an elasticity of demand for 1975-1980 of -0.21 to -0.34.
25
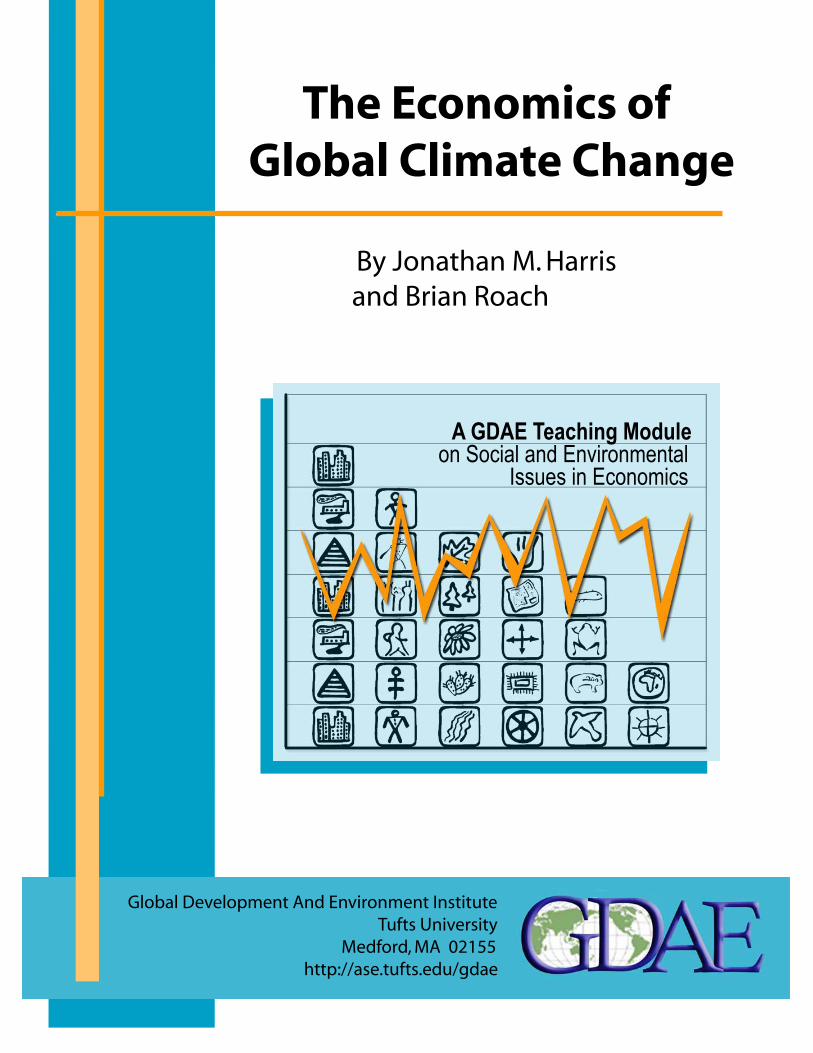
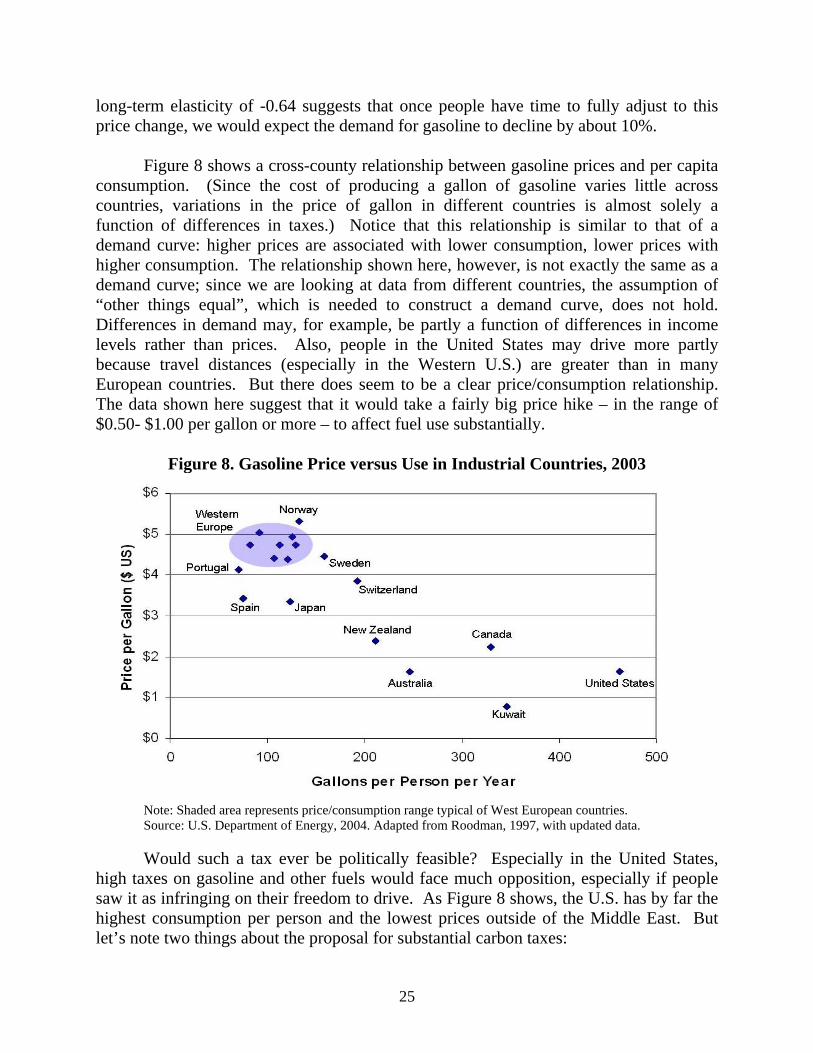
long-term elasticity of -0.64 suggests that once people have time to fully adjust to this price change, we would expect the demand for gasoline to decline by about 10%. Figure 8 shows a cross-county relationship between gasoline prices and per capita consumption. (Since the cost of producing a gallon of gasoline varies little across countries, variations in the price of gallon in different countries is almost solely a function of differences in taxes.) Notice that this relationship is similar to that of a demand curve: higher prices are associated with lower consumption, lower prices with higher consumption. The relationship shown here, however, is not exactly the same as a demand curve; since we are looking at data from different countries, the assumption of “other things equal”, which is needed to construct a demand curve, does not hold. Differences in demand may, for example, be partly a function of differences in income levels rather than prices. Also, people in the United States may drive more partly because travel distances (especially in the Western U.S.) are greater than in many European countries. But there does seem to be a clear price/consumption relationship. The data shown here suggest that it would take a fairly big price hike – in the range of $0.50- $1.00 per gallon or more – to affect fuel use substantially.
Figure 8. Gasoline Price versus Use in Industrial Countries, 2003
Note: Shaded area represents price/consumption range typical of West European countries. Source: U.S. Department of Energy, 2004. Adapted from Roodman, 1997, with updated data. Would such a tax ever be politically feasible? Especially in the United States, high taxes on gasoline and other fuels would face much opposition, especially if people saw it as infringing on their freedom to drive. As Figure 8 shows, the U.S. has by far the highest consumption per person and the lowest prices outside of the Middle East. But let’s note two things about the proposal for substantial carbon taxes:
26
• First, revenue recycling could redirect the revenue from carbon and other
environmental taxes to lower other taxes. Much of the political opposition to high energy taxes comes from the perception that they would be an extra tax – on top of the income, property, and social security taxes that people already pay. If a carbon tax was matched, for example, with a substantial cut in income or social security taxes, it might be more politically acceptable. The idea of increasing taxes on economic “bads” such as pollution, while reducing taxes on things we want to encourage, such as labor and capital investment, is fully consistent with principles of economic efficiency18. Rather than a net tax increase, this would be revenue-neutral tax shift - the total amount which citizens pay to the government in taxes is unchanged. Some of the tax revenues could also be used to provide relief for low-income people to offset the burden of higher energy costs.
• Second, if such a revenue-neutral tax shift did take place, individuals or businesses
whose operations were more energy-efficient would actually save money overall. The higher cost of energy would also create a powerful incentive for energy-saving technological innovations and stimulate new markets. Economic adaptation would be easier if the higher carbon taxes (and lower income and capital taxes) were phased-in over time.
Policy Tools: Tradable Permits An alternative to a carbon tax is a system of tradable carbon permits. A carbon trading scheme could be national in scope, or include several countries. An international permit system would work as follows:
• Each nation would be allocated a certain permissible level of carbon emissions. The total number of carbon permits issued would be equal to the desired national goal. For example, if carbon emissions for a particular country are currently 40 million tons and the policy goal is to reduce this by 10%, then permits would be issued to emit only 36 million tons. Note that different nations could be obliged to meet different targets, which is the case under the Kyoto Protocol.
• Permits are allocated to individual carbon-emitting sources in each nation.
Including all carbon sources (e.g., all motor vehicles) in a trading scheme is clearly not practical. Instead, under most proposals permits would be allocated to the largest carbon emitters, such as power companies and manufacturing plants, or else to the suppliers through which carbon fuels enter the country – oil importers, coal mines, etc. These permits could initially be allocated for free on the basis of
18 To encourage higher investment, carbon tax revenues could be used to lower capital gains or corporate taxes.
27
past emissions, or could be auctioned to the highest bidders. Economic theory indicates that the effectiveness of the trading system should be the same regardless of how the permits are allocated. However, there is a significant difference in the distribution of costs and benefits: giving permits out for free essentially amounts to a government subsidy to the polluters, while auctioning permits imposes real costs upon firms and generates public revenues.
• Firms are able to trade permits freely among themselves. Firms whose emissions
exceed the number of permits they hold must purchase additional permits or else face penalties. Meanwhile firms that are able to reduce their emissions below their allowance at low cost will seek to sell their permits for a profit. Firms will settle upon permit prices through free market negotiations. It may also be possible for environmental groups or other organizations to purchase permits and retire them – thus reducing overall emissions.
• Nations and firms could also receive credit for financing carbon reduction efforts
in other countries. For example, a German firm could get credit for installing efficient electric generating equipment in China, replacing highly polluting coal plants.
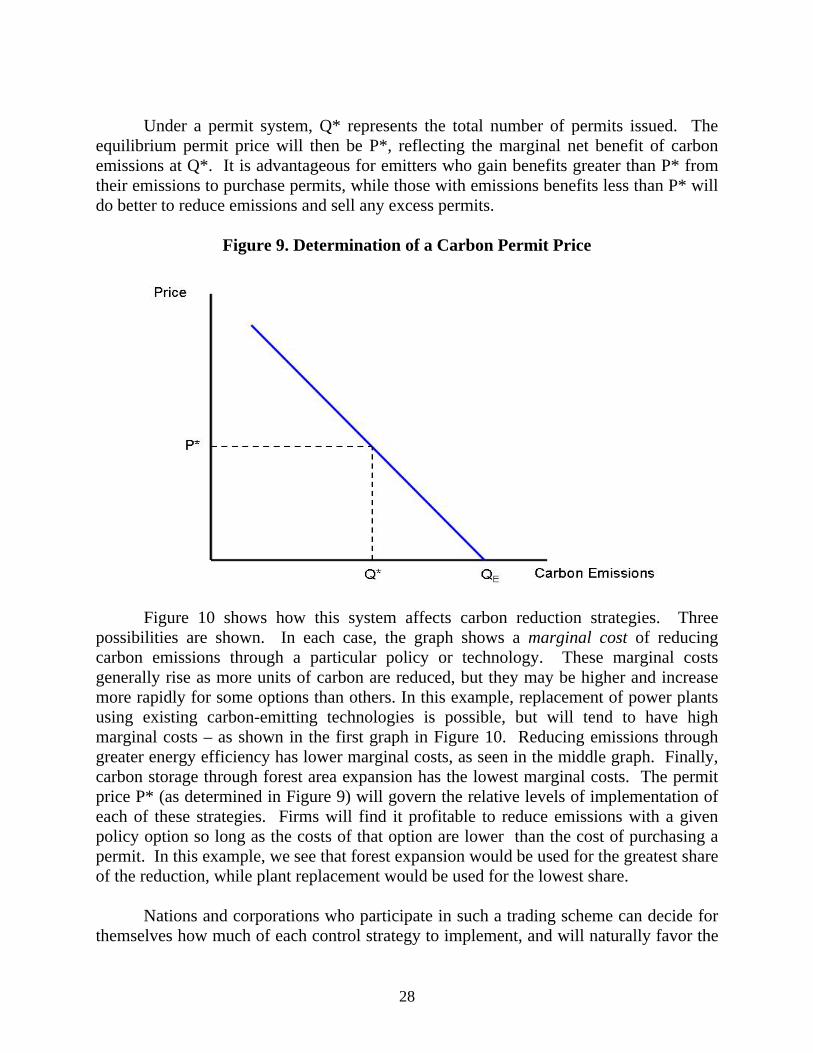
From an economic point of view, the advantage of a tradable permit system is that it would encourage the least-cost carbon reduction options to be implemented. Depending on the allocation of permits, it might also mean that developing nations could transform permits into a new export commodity by choosing a non-carbon path for their energy development. They would then be able to sell permits to industrialized nations who were having trouble meeting their reduction requirements. To demonstrate the economic impacts of a tradable carbon permit system, we can use the analytical concept of marginal net benefits. Figure 9 shows the marginal net benefit of carbon emissions to producers and consumers.19 We would expect the marginal net benefit curve to slope downward because the initial carbon emissions are used to produce those goods and services which are most valued by producers and consumers. Subsequent carbon emissions are used to produce goods and services of lower net value. The emissions level QE will result if there are no limits on emissions – this is the market equilibrium, where consumers and producers maximize net benefits. We can see that the marginal benefits of the last units of carbon emissions are rather small. However, producers and consumers interacting in a market do not take into account environmental externalities. Thus the overall level of carbon emissions is too high from the perspective of maximizing social welfare. 19 The marginal net benefit curve is derived from the demand and supply curve (in this case for carbon-based fuels), showing the marginal benefits of the product minus the marginal costs of the supply.
28
Under a permit system, Q* represents the total number of permits issued. The equilibrium permit price will then be P*, reflecting the marginal net benefit of carbon emissions at Q*. It is advantageous for emitters who gain benefits greater than P* from their emissions to purchase permits, while those with emissions benefits less than P* will do better to reduce emissions and sell any excess permits.
Figure 9. Determination of a Carbon Permit Price
Figure 10 shows how this system affects carbon reduction strategies. Three possibilities are shown. In each case, the graph shows a marginal cost of reducing carbon emissions through a particular policy or technology. These marginal costs generally rise as more units of carbon are reduced, but they may be higher and increase more rapidly for some options than others. In this example, replacement of power plants using existing carbon-emitting technologies is possible, but will tend to have high marginal costs – as shown in the first graph in Figure 10. Reducing emissions through greater energy efficiency has lower marginal costs, as seen in the middle graph. Finally, carbon storage through forest area expansion has the lowest marginal costs. The permit price P* (as determined in Figure 9) will govern the relative levels of implementation of each of these strategies. Firms will find it profitable to reduce emissions with a given policy option so long as the costs of that option are lower than the cost of purchasing a permit. In this example, we see that forest expansion would be used for the greatest share of the reduction, while plant replacement would be used for the lowest share. Nations and corporations who participate in such a trading scheme can decide for themselves how much of each control strategy to implement, and will naturally favor the
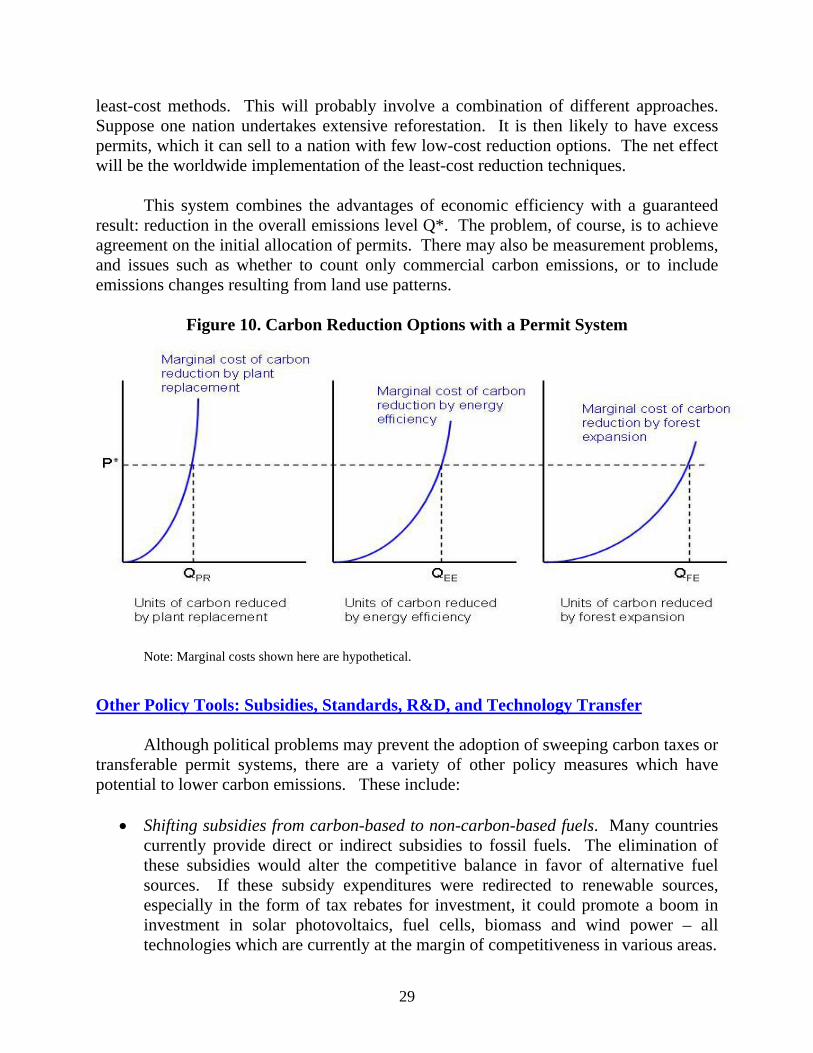
29
least-cost methods. This will probably involve a combination of different approaches. Suppose one nation undertakes extensive reforestation. It is then likely to have excess permits, which it can sell to a nation with few low-cost reduction options. The net effect will be the worldwide implementation of the least-cost reduction techniques. This system combines the advantages of economic efficiency with a guaranteed result: reduction in the overall emissions level Q*. The problem, of course, is to achieve agreement on the initial allocation of permits. There may also be measurement problems, and issues such as whether to count only commercial carbon emissions, or to include emissions changes resulting from land use patterns.
Figure 10. Carbon Reduction Options with a Permit System
Note: Marginal costs shown here are hypothetical. Other Policy Tools: Subsidies, Standards, R&D, and Technology Transfer Although political problems may prevent the adoption of sweeping carbon taxes or transferable permit systems, there are a variety of other policy measures which have potential to lower carbon emissions. These include:
• Shifting subsidies from carbon-based to non-carbon-based fuels. Many countries currently provide direct or indirect subsidies to fossil fuels. The elimination of these subsidies would alter the competitive balance in favor of alternative fuel sources. If these subsidy expenditures were redirected to renewable sources, especially in the form of tax rebates for investment, it could promote a boom in investment in solar photovoltaics, fuel cells, biomass and wind power – all technologies which are currently at the margin of competitiveness in various areas.
30
• The use of efficiency standards to require utilities and major manufacturers to
increase efficiency and renewable content in power sources. A normal coal-fired generating plant achieves about 35% efficiency, while a high-efficiency gas-fired co-generation facility achieves from 75% to 90% efficiency. Current automobile fuel-efficiency standards in the United States do not exceed 27.5 miles per gallon, while efficiencies of up to 50 miles per gallon are achievable with proven technology. Tightening standards over time for plants, buildings, vehicles, and appliances would hasten the turnover of existing, energy-inefficient capital stock.
• Research and development (R&D) expenditures promoting the commercialization
of alternative technologies. Both government R&D programs and favorable tax treatment of corporate R&D for alternative energy can speed commercialization. The existence of a non-carbon “backstop” technology significantly reduces the economic cost of measures such as carbon taxes, and if the backstop became fully competitive with fossil fuels carbon taxes would be unnecessary.
• Technology transfer to developing nations. The bulk of projected growth in
carbon emissions will come in the developing world. Many energy development projects are now funded by agencies such as the World Bank and regional development banks. To the extent that these funds can be directed towards non-carbon energy systems, supplemented by other funds dedicated specifically towards alternative energy development, it will be economically feasible for developing nations to turn away from fossil-fuel intensive paths, achieving significant local environmental benefits at the same time.
Climate Change Policy in Practice Climate change is an international environmental issue. Each individual nation has little incentive to reduce its emissions if other nations do not agree to similar reductions, because unilaterally reducing emissions could impose significant costs while having a negligible effect on overall emissions. Thus a binding international agreement is necessary, especially if the policy goal is to reduce emissions by 50-80%. The most comprehensive international agreement on climate change has been the Kyoto Protocol. Under the treaty industrial countries agreed to emission reduction targets by 2008-2012 compared to baseline emissions in 1990. For example, the United States agreed to a 7% reduction, France to an 8% reduction, and Japan to a 6% reduction. Developing nations such as China and India are not bound to emissions targets under the treaty, an omission that the United States and some other countries objected to. As of October 2007, the Kyoto Protocol has been ratified by 176 countries. The United States signed the treaty in 1998 but has never ratified it. In 2001, the Bush administration
31
rejected the Kyoto Protocol, arguing that negotiations had failed and that a new approach was necessary. While this has dealt a serious blow to efforts to control global greenhouse gas emissions, the Kyoto Protocol nonetheless entered into force in early 2005 after Russia ratified the treaty in November 2004.
To achieve the goals of the Protocol in a cost effective manner, the treaty includes three “flexibility mechanisms.” One is the trading of emissions permits among nations that are bound by specific targets. Thus one nation unable to meet its target could purchase permits from another nation that reduces its emissions below its requirements. The European Union has set up a carbon trading system which went into effect in 2005. (see Box 6).
Another flexibility mechanism is joint implementation, whereby an industrial
nation receives credit for financing emission-reducing projects in other countries bound to emissions targets, mainly in transitional countries such as Russia and Lithuania. The third is the clean development mechanism, whereby industrial nations can obtain credit for financing emission-reducing or emission-avoiding projects in developing nations not bound to specific emissions targets, including China and India.
As the Kyoto Protocol approaches its 2012 expiration date, will the treaty meet its
objectives? The overall goal was a 5% reduction (compared to the 1990 baseline) in greenhouse gas emissions among participating countries. As of 2004, total emissions among countries that have signed the treaty, including countries that haven’t ratified it such as the U.S. Australia, have declined about 3% compared to the 1990 baseline.20 This appearance of success is largely illusory, for much of the decline is a result of economic collapse in the former Soviet Union and other Eastern European countries. For these transitional nations, overall emissions have declined by 37%. For the remaining participating countries, overall emissions have increased by 11%. Canada, for example, agreed to a 6% reduction but its emissions had increased 27% over the baseline as of 2004. Negotiations are currently underway to draft a successor to the Kyoto Protocol when it expires in 2012. A central question in these negotiations is whether it will be possible to obtain agreements from the United States and developing nations to meet emissions targets.
20 United Nations Framework Convention on Climate Change, “National Greenhouse Gas Inventory Data for the Period 1990-2004 and Status of Reporting,” October 19, 2006.
32
While the United States has dropped out of the Kyoto Protocol, it has set its own climate change goals. Unlike the Kyoto Protocol, these goals are voluntary rather than binding. In 2002 President Bush set a goal of reducing greenhouse gas intensity by 18% between 2002 and 2012. Greenhouse gas intensity is defined as the quantity of greenhouse gas emissions per unit of GDP. Thus even if actual emissions remain constant greenhouse gas intensity will decline as long as the economy is growing. In fact, it is possible for greenhouse gas intensity to decline even while actual emissions increase. Does the goal of reducing greenhouse gas intensity by 18% represent an ambitious goal? It does not. Consider that greenhouse gas intensity fell by 21% during the 1980s
BOX 6: THE EUROPEAN UNION CARBON TRADING SYSTEM
In 2005 the European Union launched its Emissions Trading Scheme (ETS), which covers about 12,000 facilities that collectively emit about 40% of the EU’s carbon emissions. Under the ETS, each nation develops a National Allocation Plan to determine the overall number of permits available in the country, and the number of permits to allocate to each facility. So far, permits have been allocated to firms. for free. Any unneeded permits can be sold on the open market.
The effectiveness of the ETS has proven to be disappointing. The problem is
that national governments have been too generous in allocating the free permits, resulting in a declining price for carbon permits. While the going price of a permit to emit a ton of carbon gradually rose during the first year or so of the program, up to about 30 euros, the price crashed in May 2006 to under €10 per ton and then continued to fall, going below €1 per ton in early-2007. EU statistics indicate that 93% of the facilities included in the ETS emitted less carbon than allowed by their permit allocation in 2006. With a glut of permits available, those firms emitting above their allocation were able to purchase permits at very low prices. Statistics also show that the ETS has had little effect on overall carbon emissions in the EU.
The EU is currently moving towards the second phase of the ETS, which will
cover the 2008-2012 period. EU nations have recognized that permits were over-allocated in the initial phase and intend to reduce the number of permits available in the second phase, with the goal of increasing the permit price in the future and thus creating greater incentives for firms to reduce emissions.
Sources: “Q&A: Europe’s Carbon Trading Scheme,” BBC News, December 20, 2006; “Smoke Alarm: EU Shows Carbon Trading is not Cutting Emissions,” The Guardian, April 3, 2007.
33
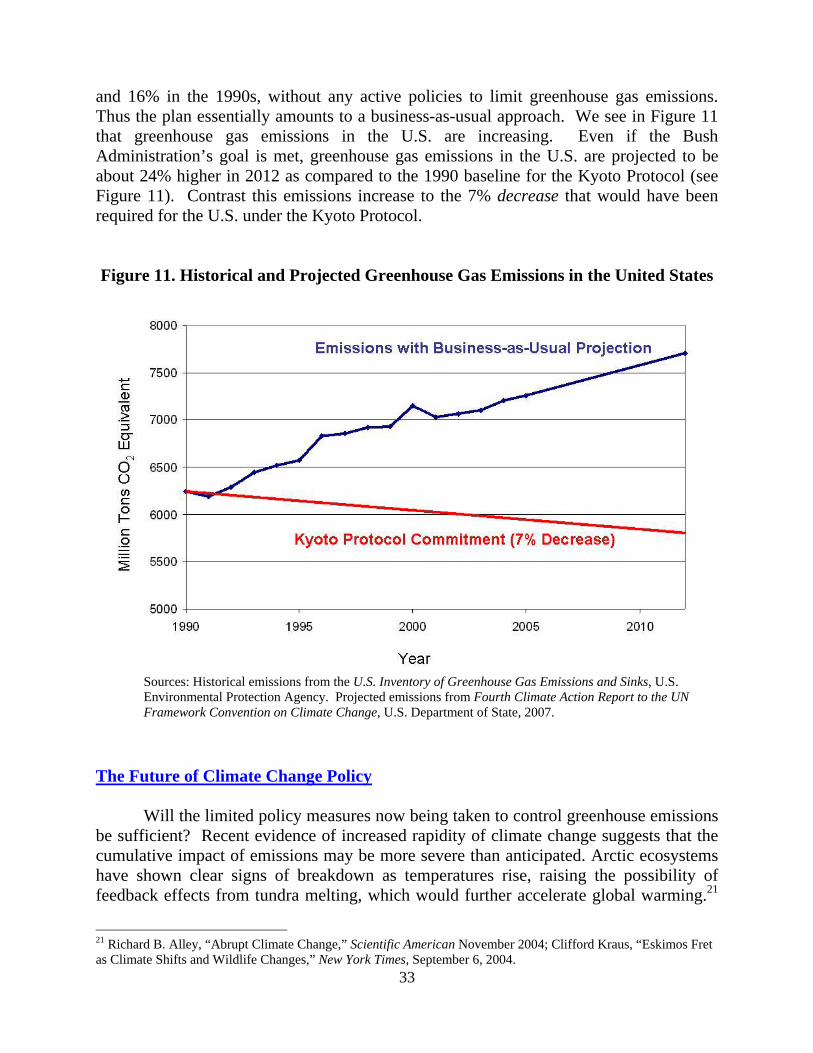
and 16% in the 1990s, without any active policies to limit greenhouse gas emissions. Thus the plan essentially amounts to a business-as-usual approach. We see in Figure 11 that greenhouse gas emissions in the U.S. are increasing. Even if the Bush Administration’s goal is met, greenhouse gas emissions in the U.S. are projected to be about 24% higher in 2012 as compared to the 1990 baseline for the Kyoto Protocol (see Figure 11). Contrast this emissions increase to the 7% decrease that would have been required for the U.S. under the Kyoto Protocol. Figure 11. Historical and Projected Greenhouse Gas Emissions in the United States
Sources: Historical emissions from the U.S. Inventory of Greenhouse Gas Emissions and Sinks, U.S. Environmental Protection Agency. Projected emissions from Fourth Climate Action Report to the UN Framework Convention on Climate Change, U.S. Department of State, 2007.
The Future of Climate Change Policy Will the limited policy measures now being taken to control greenhouse emissions be sufficient? Recent evidence of increased rapidity of climate change suggests that the cumulative impact of emissions may be more severe than anticipated. Arctic ecosystems have shown clear signs of breakdown as temperatures rise, raising the possibility of feedback effects from tundra melting, which would further accelerate global warming.21
21 Richard B. Alley, “Abrupt Climate Change,” Scientific American November 2004; Clifford Kraus, “Eskimos Fret as Climate Shifts and Wildlife Changes,” New York Times, September 6, 2004.
34
A report prepared for the U.S. Department of Defense cited the possibility of large-scale drought in critical agricultural regions; a collapse of the North Atlantic Gulf Stream, causing an abrupt shift to much colder temperatures in Europe and the Northern U.S.; and widespread civil unrest and mass migration caused by disruption of water and food supplies.22 The costs of such developments would be clearly be very high, well into the higher range of estimates in Table 2, amounting to hundreds of billions of dollars per year. The Intergovernmental Panel on Climate Change has estimated that the stabilization of atmospheric CO2 levels would require reduction of CO2 emissions to a small fraction of current levels. This goal is far beyond the Kyoto Protocol targets, and would require major policy intervention to redirect the world’s economies towards non-carbon energy sources. The IPCC also finds, however, that opportunities for reductions of 30-70% in greenhouse gas emissions are available at a net cost below $100 per ton of carbon equivalent; a substantial portion of these cuts would have low or even zero marginal cost. According to these figures, the IPCC’s maximum estimated reduction, of 5 billion tons, could be achieved at a net cost of several hundred billion dollars – a large amount, but probably less than the cost of the high-scenario damages, even using standard discount rates.23 Certainly the low-cost cuts look like a good investment. Economic analysis could thus justify much more aggressive climate change policy, but significant political barriers stand in the way of such policies, especially in the U.S. As the ratifying nations move to implant the Kyoto Protocol, and as attention focuses on future policies “beyond Kyoto”, the economic policy measures discussed in this chapter will certainly become increasingly important. Political leaders and the public will determine how strongly we will respond to this major issue of the twenty-first century, but economic policies will be central to accomplishing the goals we choose.
22 Peter Schwartz and Doug Randall, “An Abrupt Climate Change Scenario and Its Implications for U.S. National Security,” October 2003, available at http://www.ems.org/climate/pentagon_climate_change.html. 23 IPCC 2001, 2007.
35
SUMMARY Climate change, arising from the greenhouse effect of heat-trapping gases, is a global problem. All nations are involved in both its causes and consequences. Currently developed nations are the largest emitters of greenhouse gases, but emissions by developing nations will grow considerably in coming decades. The most recent scientific evidence indicates that effects during the twenty-first century may range from a global temperature increase of1.1ºC (2ºF) to as much as 6.4ºC (11.5ºF). In addition to simply warming the planet, other predicted effects include disruption of weather patterns and possible sudden major climate shifts. One approach to economic analysis of climate change is cost/benefit analysis. The benefits in this case are the damages potentially averted through action to prevent climate change; the costs are the economic costs of shifting away from fossil fuel dependence, as well as other economic implications of greenhouse gas reduction. Cost-benefit studies have estimated both costs and benefits in the range of several percent of GDP. However, the relative evaluation of costs and benefits depends heavily on the discount rate selected. Since the damages are expected to increase with time, the use of a high discount rate leads to a lower evaluation of the benefits of avoiding climate change. In addition, some effects such as species loss and effects on human life and health are difficult to measure in monetary terms. Also, depending on the assumptions used in economic models, the GDP impacts of policies to avoid climate change could range from a 3.4% decrease to a 3.9% increase in GDP. Policies to respond to global climate change could be preventive or adaptive. One of the most widely discussed policies is a carbon tax, which would fall most heavily on fuels causing the highest carbon emissions. The revenues from such a tax could be recycled to lower taxes elsewhere in the economy, or they could be used to assist people in lower income brackets, who will suffer most from higher costs of energy and goods. Another policy option is tradable carbon emissions permits, which could be bought and sold by firms or nations, depending on their level of carbon emissions. Both these policies have the advantage of economic efficiency, but it has been difficult to obtain the political support necessary to implement them. Other possible policy measures include shifting subsidies away from fossil fuels and towards renewable energy, strengthening energy efficiency standards, and increasing research and development on alternative energy technologies. The Kyoto Protocol mandating reductions of greenhouse gases by industrialized nations went into force in 2005, but the U.S. refused to participate. Effective climate change policy in the future will require involvement of the U.S. as well as China, India, and other developing nations. Much more ambitious reduction targets will be needed to avoid the costs associated with long-term climate change.
36
KEY TERMS AND CONCEPTS
Adaptive measures: policies intended to adapt to adverse environmental impacts. Avoided costs: costs avoidable through environmental preservation or improvement. Carbon sinks: portions of the ecosystem with the ability to absorb certain quantities of carbon dioxide, such as forests, soils and oceans. Carbon tax: a per-unit tax on goods and services based on the quantity of carbon dioxide emitted during the production or consumption process. Clean development mechanism: a component of the Kyoto Protocol that allows industrial countries to receive credits for helping developing countries to reduce their carbon emissions. Common property resource: a resource not subject to private ownership and available to all, such as a public park, or the oceans, or the capacity of the Earth and its atmosphere to absorb carbon. Cost-benefit analysis: a tool for policy analysis that attempts to monetize all the costs and benefits of a proposed action, in order to determine the net benefits. Cost-effectiveness analysis: a policy tool that determines the least-cost approach for achieving a given goal. Discount rate: the annual rate at which future benefits or costs are discounted relative to current benefits or costs. Elasticity of demand: the sensitivity of the quantity demanded to prices. Externality: an effect of a market transaction on individuals or firms other than those directly involved in the transaction. Feedback effects: the process of changes in a system leading to other changes that either counteract or reinforce the original change. Global climate change: the changes in global climate, including temperature, precipitation, and storm frequency and intensity, that result from changes in greenhouse gas concentrations in the atmosphere. Global commons: global common property resources such as the atmosphere and the oceans.
37
Greenhouse effect: the effect of certain gases in the earth’s atmosphere trapping solar radiation, resulting in an increase in global temperatures and other climactic changes. Greenhouse gas: gases such as carbon dioxide and methane whose atmospheric concentrations influence global climate by trapping solar radiation. Greenhouse gas intensity: the amount of greenhouse gas emissions per unit of economic output. Joint implementation: a component of the Kyoto Protocol whereby industrial nations can obtain credit for financing carbon-reducing projects in other industrial nations. Marginal net benefit: the net benefit of the consumption or production of an additional unit of a resource; equal to marginal benefit minus marginal cost. Pollution taxes: a per-unit tax based on the pollution associated with the production of a good or service. Public goods: goods available to all, whose use by one person does not reduce their availability to others. Precautionary principle: the principle that policies should take steps to avoid outcomes damaging to health or environment, even if the damaging outcomes cannot be predicted with certainty, and especially when such outcomes are potentially catastrophic or irreversible. Preventive measures: policies intended to prevent adverse environmental impacts. Revenue-neutral tax shift: policies designed to balance tax increases on certain products or activities with reductions in other taxes, such as a reduction in income taxes that offset a carbon-based tax. Stock pollutant: a pollutant that accumulates in the environment, such as carbon dioxide and chlorofluorocarbons (CFCs). Technology transfer: the process of sharing technological information or equipment, particularly among nations. Transferable (tradable) permits: permits that allow a certain quantity of pollution and that may be traded among firms or nations.
38
REFERENCES
Cline, William R. The Economics of Global Warming. Washington D.C.: Institute for International Economics, 1992. Dower, Roger C. and Zimmerman, Mary. The Right Climate for Carbon Taxes, Creating Economic Incentives to Protect the Atmosphere. Washington D.C.: World Resources Institute, 1992. Fankhauser, Samuel. Valuing Climate Change: the Economics of the Greenhouse. London: Earthscan Publications, 1995. Harris, Jonathan M. Environmental and Natural Resource Economics: A Contemporary Approach. Boston, Massachusetts: Houghton Mifflin, 2006 http://college.hmco.com Intergovernmental Panel on Climate Change (IPCC). Climate Change 2001, Volume 1: The Scientific Basis. Cambridge, UK: Cambridge University Press, 2001. Intergovernmental Panel on Climate Change (IPCC). Climate Change 2007, Volume 1: The Physical Science Basis. Available at http://www.ipcc.ch/ Manne, Alan S. and Richels, Richard G. Buying Greenhouse Insurance: The Economic Costs of CO2 Emissions Limits. Cambridge, Mass: The MIT Press, 1992. Nordhaus, William D., and Joseph Boyer, Warming the World: Economic Models of Global Warming. Cambridge, Mass: The MIT Press, 2000. Roodman, David M. Getting the Signals Right: Tax Reform to Protect the Environment and the Economy. Worldwatch Paper # 134. Washington, D.C.: Worldwatch Institute, 1997. Stern, Nicholas, The Economics of Climate Change: The Stern Review. New York and Cambridge, U.K.: Cambridge University Press, 2007. Available at http://www.hm-treasury.gov.uk/independent_reviews/stern_review_economics_climate_change/stern_review_report.cfm U.S. Department of Energy, Energy Information Administration. International Energy Outlook 2004, Report No. DOE/EIA-0484 (2004). U.S. Department of Energy, Energy Information Administration. International Energy Outlook 2007. Report No. DOE/EIA-0484 (2007).
39
DISCUSSION QUESTIONS
1. Do you consider cost-benefit a useful means of addressing the problem of climate change? How can we adequately value things like the melting of arctic ice caps and inundation of island nations? What is the appropriate role of economic analysis in dealing with questions that affect global ecosystems and future generations? 2. Which policies to address climate change would be most effective? How can we decide which combination of policies to use? What kinds of policies would be especially recommended by economists? What are the main barriers to effective policy implementation? 3. The process for formulating and implementing international agreements on climate change policy has been plagued with disagreements and deadlocks. What are the main reasons for the difficulty in agreeing on specific policy actions? From an economic point of view, what kinds of incentives might be useful to induce nations to enter and carry out agreements? What kinds of “win-win” policies might be devised to overcome negotiating barriers?
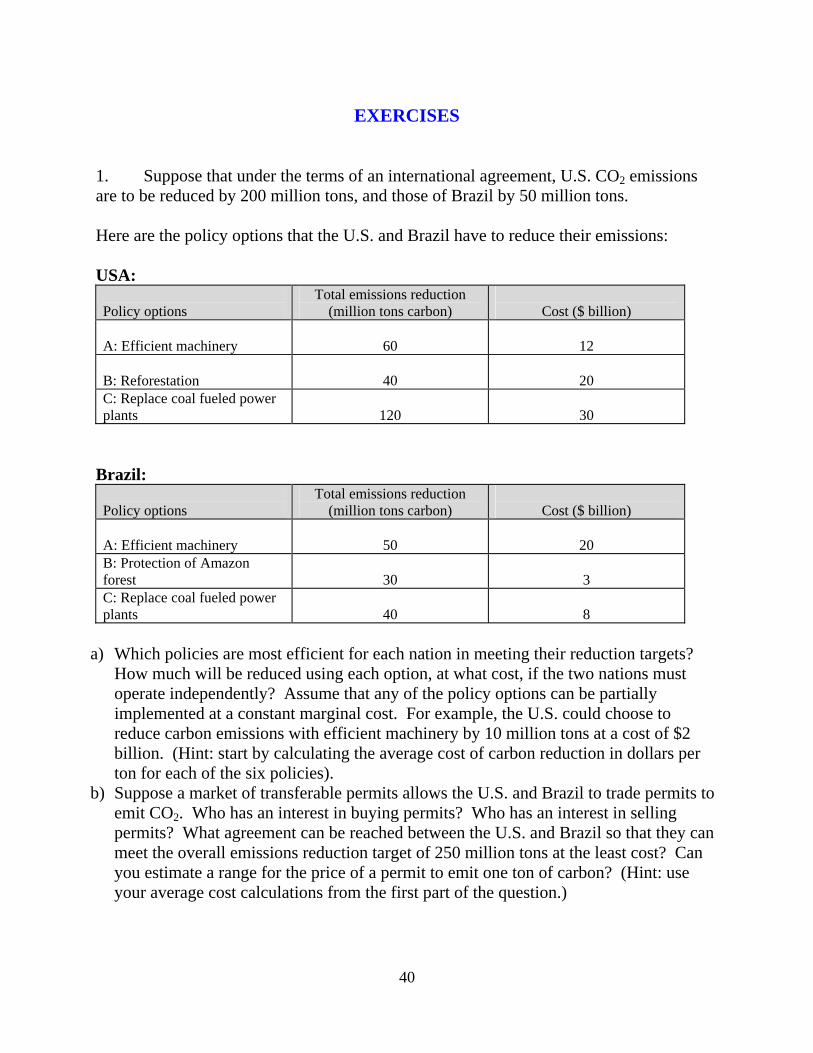
40
EXERCISES
1. Suppose that under the terms of an international agreement, U.S. CO2 emissions are to be reduced by 200 million tons, and those of Brazil by 50 million tons. Here are the policy options that the U.S. and Brazil have to reduce their emissions: USA: Policy options
Total emissions reduction (million tons carbon)
Cost ($ billion)
A: Efficient machinery
60
12
B: Reforestation
40
20
C: Replace coal fueled power plants
120
30
Brazil: Policy options
Total emissions reduction (million tons carbon)
Cost ($ billion)
A: Efficient machinery
50
20
B: Protection of Amazon forest
30
3
C: Replace coal fueled power plants
40
8
a) Which policies are most efficient for each nation in meeting their reduction targets?
How much will be reduced using each option, at what cost, if the two nations must operate independently? Assume that any of the policy options can be partially implemented at a constant marginal cost. For example, the U.S. could choose to reduce carbon emissions with efficient machinery by 10 million tons at a cost of $2 billion. (Hint: start by calculating the average cost of carbon reduction in dollars per ton for each of the six policies).
b) Suppose a market of transferable permits allows the U.S. and Brazil to trade permits to emit CO2. Who has an interest in buying permits? Who has an interest in selling permits? What agreement can be reached between the U.S. and Brazil so that they can meet the overall emissions reduction target of 250 million tons at the least cost? Can you estimate a range for the price of a permit to emit one ton of carbon? (Hint: use your average cost calculations from the first part of the question.)
41
2. Suppose that the annual consumption of an average American household is 2000 gallons of oil in heating and transportation and 300 ccf (hundred cubic feet) of natural gas. Using the figures given in Table 3 on the effects of a carbon tax, calculate how much an average American household would pay per year with an added tax of $10 per ton of carbon. (One barrel of oil contains 42 gallons.) Assume that this relatively small tax initially causes no reduction in the demand for oil and gas. Figuring 100 million households in the United States, what would be the revenue to the U.S. Treasury of such a carbon tax? What would be the national revenue resulting from a tax of $200 per ton of carbon? Consider the issue of the impact of increased prices on consumption – a reasonable assumption about consumption elasticity might be that a $200 per ton tax would cause the quantity of oil and gas consumed to decline by 20%. How might the government use such revenues? What would the impact be on the average family? Consider the difference between the short-term and long-term impacts.
42
WEB LINKS 1. http://epa.gov/climatechange/index.html The global warming web site of the U.S. Environmental Protection Agency. The site provides links to information on the causes, impact, and trends related to global climate change. 2. http://www.ipcc.ch/ The web site for the Intergovernmental Panel on Climate Change, a United Nations-sponsored agency “to assess the scientific, technical, and socioeconomic information relevant for the understanding of the risk of human-induced climate change.” Their web site includes assessment reports detailing the relationships between human actions and global climate change. 3. http://climate.wri.org/ World Resource Institute’s web site on climate and atmosphere. The site includes several articles and case studies, including research on Clean Development Mechanisms. 4. http://www.unfccc.de/ Home page for the United Nations Framework Convention on Climate Change. The site provides data on the climate change issue and information about the ongoing process of negotiating international agreements related to climate change. 5. http://www.weathervane.rff.org/ A web site sponsored by Resources for the Future devoted to climate change issues. The site includes several research papers on the trading of greenhouse gas emissions permits.
Recommended