Submitted to the Journal of Physical Chemistry A
Peter Armentrout Festschrift issue
The Dissociation Energy, Electronic and Vibrational Spectroscopy of Co+(H2O) and its Isotopomers
Abdulkadir Kocak, Geoff Austein-Miller, Wright L. Pearson III, Gokhan Altinaya and Ricardo B. Metz
Dept. of Chemistry, University of Massachusetts Amherst, Amherst, MA 01003
Abstract: The electronic spectra of Co+(H2O), Co+(HOD) and Co+(D2O) have been measured from 13500 cm-1 to 18400 cm-1 using photodissociation spectroscopy. Transitions to four excited electronic states with vibrational and partially resolved rotational structure are observed. Each electronic transition has an extended progression in the metal-ligand stretch, and the absolute vibrational quantum numbering is assigned by comparing isotopic shifts between Co+(H2
16O) and Co+(H218O). For the low-lying
excited electronic states, the first transition detected is to v3’=1. Extrapolation from this
data allows the Co+-(H2O) binding energy to be determined as D0(0 K) (Co+-H2O)=13730±90 cm-1 (164.2±1.1 kJ/mol). The photodissociation spectrum shows well-resolved Ka band structure due to rotation about the Co-O axis. This permits determination of the spin rotation constants !!!=-6 cm-1 and !!=4 cm-1 and the excited state rotational constant A’=14.5 cm-1 for the 15872 cm-1 band. However, the Ka rotational structure depends on v3
’, making the rotational constants unreliable. From the nuclear spin statistics of the rotational structure, the ground state is assigned as 3B1. The electronic transitions observed are from the Co+(H2O) ground state (which correlates to the 3F, 3d8 ground state of Co+) to excited states which correlate to Co+ (3F, 3d74s and 3P, 3d8). These excited states of Co+ interact less strongly with water than the ground state. As a result, the excited states are less tightly bound and have a longer metal-ligand bond than the ground state. Calculations at the CCSD(T)/aug-cc-pVTZ level predict that binding to Co+ increases the H-O-H angle in water from 104.1° to 106.8°, as the metal removes electron density from the oxygen lone pairs. The O-H stretching frequencies of the ground states of Co+(H2O) and Co+(HOD) were measured by combining IR excitation with visible photodissociation in a double resonance experiment. In Co+(H2O) the O-H symmetric stretch is v1
”=3609.7 cm-1; the antisymmetric stretch is v5
”=3679.5 cm-1. These values are 47 and 76 cm-1, respectively lower than those in bare H2O. In Co+(HOD) the O-H stretch is observed at 3650 cm-1, a red shift of 57 cm-1 relative to bare HOD.
a) Current address: Chemical Sciences and Engineering Division, Argonne National Laboratory, 9700 South Cass Avenue, Argonne, IL 60439
I. INTRODUCTION
The importance of metal-water interactions in solvation, catalysis and biology has
inspired numerous experimental and computational investigations of metal ion-water
complexes. Gas-phase studies allow for direct examination of the intrinsic interactions
between metal ions and solvent molecules, including their dependence on the ions’
charge and electron configuration and the metal-ligand bond’s effect on solvent
structure.1 The binding energies of water molecules to first-row transition metal cations
M+ were first measured by Magnera, David and Michl2 and Marinelli and Squires3 using
collision-induced dissociation (CID) in a triple-quadrupole mass spectrometer and were
later refined in a guided-ion beam (GIB) measurement by Dalleska, Honma, Sunderlin
and Armentrout.4
The Co+(H2O) complex is of particular interest because Co+ binds strongly to
ligands, providing insight into metal-ligand interactions. This is illustrated by the
measured Co+-H2O bond dissociation energies: 155±12 kJ/mol,2 168±16 kJ/mol,3 and
161±7 kJ/mol.4 This strong non-covalent interaction is due to the cobalt ion’s has a 3d8
(3F4) ground state.5 Metal cations with 3dn electronic configurations bind more strongly
than those with 3dn-1 4s1 configurations, as the 3d orbital is smaller than the 4s, which
allows the metal to get closer to the ligand. Unlike the s orbitals, the d orbitals are
directional, so the fully occupied orbitals point away from the ligand, reducing metal-
ligand repulsion. One potential implication of this strong bond is the recent proposal that
cobalt ion-water interactions are the key to efficient Co2+/Co+ reduction in the cobalamine
(vitamin B12) cofactor of methyltransferases.6

There have been several studies of the electronic spectra of M+(H2O) complexes.
This includes studies of hydrated alkaline earth cations Mg+(H2O)7, Ca+(H2O)8 and
Sr+(H2O)9 and transition metal cations V+(H2O),10 Ni+(H2O)11 and Zn+(H2O)12. Poisson et
al. studied photolysis of Co+(H2O)n (n=1-10) at 532, 355 and 266 nm, but observed no
photodissociation of Co+(H2O).13 In studies of hydrated Co(II) cluster ions, our group
measured the electronic spectra of Co2+(H2O)n (n=4-7) in the visible via
photodissociation,14 and Donald et al. photoexcited M2+(H2O)n (M=Mn, Fe, Co, Cu; n=19-
124) at 193 and 248 nm to determine H2O ligand binding energies for these large
clusters.15
In addition, Brucat and coworkers measured electronic spectra of Co+(L)
complexes for L=Ar, Kr, Xe,16 CO2,17 and N2.18 Duncan and coworkers recently
measured the electronic spectrum of Co+(Ne).19 The photodissociation spectra of these
complexes extend throughout the visible, with vibrationally- and, often, rotationally-
resolved transitions to several excited states. The spectra are similar, as they are due to
metal-centered transitions between states arising from the d8 (3F4) Co+ ground state and
states correlated to d7s (3F) and d8 (3P) excited states of Co+. Analysis of the spectra
reveals metal-ligand bond lengths, excited state vibrational frequencies, and diabatic
dissociation energies for the ground and excited electronic states.
Vibrational spectra of several transition metal M+(H2O)n have been measured in
the O-H stretching region. These spectra elucidate the cation’s effect on the ligands’
bonds and, for larger clusters, reveal hydrogen-bonding networks. Duncan and
coworkers have used argon tagging to measure vibrational spectra of M+(H2O) (M= Sc,20
V,21 Cr,22 Mn,23 Fe,24, Ni,25 Cu26) and M2+(H2O) (M= Sc,20 V,27 Cr,22, Mn,23) in the O-H

stretching region. The vibrational spectrum of Co+(H2O) has not been previously
published, although Furukawa et al. measured the photodissociation spectra of
Co+(H2O)n (n=4-6) in the O-H stretching region.28 O’Brien and Williams also used
vibrational spectra of solvated, multiply charged ions M2+(H2O)n (M=Mn, Fe, Co, Ni, Cu,
Zn; n=5-8) in the O-H stretching region to determine the coordination number of the
metal ion.29
Several groups have also calculated the structure and binding energies of
Co+(H2O).30 The Co+(H2O) complex is calculated to be planar, with C2v symmetry.
However, the calculations predict four low-lying electronic states whose energies are so
similar that the ground state depends on the level of theory.
Electronic spectroscopy of M+(H2O) potentially allows one the ability to measure
bond dissociation energies, vibrational levels of excited states, excited state dissociation
energies, and in some cases rotational structure, which can be used to determine the
geometries of the ground and excited electronic states. Vibrational spectra of M+(H2O)
reveal how metal ions affects bonds in the H2O ligand. Our group used photodissociation
spectroscopy and vibrationally mediated photodissociation (VMP) to measure the
electronic spectrum and O-H stretching frequencies of Ni+(H2O).11 The current
experiments extend this work to the Co+(H2O) complex and its isotopomers.
II. EXPERIMENTAL METHODS
The experiments are performed utilizing a home-built laser ablation source dual
time-of-flight reflectron mass spectrometer, which is described in detail elsewhere 31
Cobalt ions are produced through the ablation of a cobalt rod by the 532 nm second

harmonic of a pulsed Nd:YAG laser operating at 15 mJ/pulse at a repetition rate of 20
Hz. The Co+ interacts with a gas mix of 0.1-0.4% H2O seeded in helium at 30 psi backing
pressure introduced through a pulsed piezoelectric valve to form Co+(H2O). Ions expand
into vacuum and cool, forming a supersonic molecular beam with a rotational
temperature of ~15 K. The ion beam is skimmed, extracted into the time-of-flight mass
spectrometer, accelerated, and re-referenced to ground potential. Ions are mass
selected and are dissociated with a laser at the turning point of the reflectron. Parent
and fragment molecules are reaccelerated and are mass analyzed in the second time-of-
flight stage. Ions are measured at a microchannel plate detector. The resulting signal is
amplified, collected on a digital oscilloscope or a gated integrator, and recorded using a
LabView-based program. By taking the ratio of the amount of fragments to parents and
laser power as a function of laser wavelength we obtain the photodissociation spectrum.
For electronic spectroscopy studies, a wavelength range of 543-740 nm (13511-
18431 cm-1) was scanned with a Continuum ND6000 dye laser at a line width of 0.1 cm-1
using a variety of laser dyes. A multipass mirror arrangement32 allows the laser to make
approximately 11 passes through the ion cloud, enhancing the dissociation yield. To
avoid damaging the mirrors, the dye laser is attenuated to <10 mJ per pulse. The
infrared studies use a Laser Vision IR OPO/OPA tunable from 2200 cm-1 to >4000 cm-1.
This laser is also multi-passed and produces approximately 10 mJ per pulse near 3600
cm-1, with a line width of approximately 1.8 cm-1. The dye laser wavelength is calibrated
using the optogalvanic spectrum of neon; the IR laser is calibrated using the absorption
spectrum of water vapor. The spectra of Co+(HOD), Co+(D2O) and Co+(H218O) were also
measured to aid in analyzing and assigning the spectrum. They were produced using a

H2O/D2O mixture, pure D2O, and H218O (Cambridge Isotope Labs) in the carrier gas
respectively.
The computational studies used the Gaussian 09 suite of programs.33 The
geometries, relative energies and vibrational frequencies of low-lying states of Co+(H2O)
were calculated with the B3LYP and BHandHLYP hybrid density functionals with the 6-
311++G(3df,p) basis set. Higher-lying excited states were calculated using time-
dependent density functional theory (TD-DFT). In addition, the geometries and relative
energies of low-lying states of Co+(H2O) were calculated at the CCSD(T)/aug-cc-pVTZ
level, as was the Co-O stretch potential.
III. RESULTS AND DISCUSSION
A. Electronic Spectroscopy
Photodissociation studies of Co+(H2O) and its isotopomers Co+(HOD), Co+(D2O)
and Co+(H218O) were carried out from 13500 cm-1 to 18400 cm-1. In this wavelength
region, only one active dissociation channel, cobalt cation + water, is observed. This is
not surprising, as production of CoOH+ + H from Co+(H2O) is endothermic by 360
kJ/mol,34 requiring wavelengths below 332 nm. The electronic spectrum was thus
obtained by monitoring the Co+ fragment from photolysis of Co+(H2O) and its
isotopomers. The photodissociation spectrum is structured with well-resolved vibrational
features and partially resolved rotational structure as illustrated in Figure 1.
The electronic spectrum is similar to those of other Co+(L) (L=Ne, Ar, Kr, Xe, CO2)
complexes, which show transitions to several excited electronic states, with long
progressions in the metal-ligand stretch.16-17, 19 Here, a number of the vibrational

features are single, sharp peaks, while others are multiplets (typically triplets). This is
similar to rotational structure observed in the electronic spectra of Mg+(H2O),7b-d
Ca+(H2O),8 Ni+(H2O)11 and Zn+(H2O).12 These molecules are near-prolate tops. Rotation
about the M-O bond (the a axis) has a small moment of inertia (only the hydrogen
atoms are off axis), and hence a large A rotational constant of ~14 cm-1. The B and C
rotational constants are similar and much smaller (~0.25 cm-1, depending on the metal
and the M-O bond length). The sharp single peaks such as the one at 13964 cm-1 in
Figure 1 are due to parallel bands, !Ka=0. Perpendicular bands, which have !Ka=±1,
lead to several peaks spaced by ~30 cm-1, (as is observed near 13808 cm-1 for
Co+(H2O)) as several initial Ka states are populated even at the ~15K rotational
temperature. This allows us to distinguish four different vibrational progressions, two of
which are parallel bands (labeled B and D) while the other two are perpendicular bands
(labeled A and C). In order to determine whether these are due to four different
electronic states or to combinations of vibrations, and to assign the vibration
progressions, we measured spectra of isotopomers and calculated the geometries,
rotational constants and vibrational frequencies of the ground and several excited states
of Co+(H2O).
The nature of the ground state of Co+(H2O) has been the subject of several
studies. Early calculations by Rosi and Bauschlicher using the modified coupled-pair
functional method showed that interaction of ground state Co+ (d8, 3F) with H2O leads to
four low-lying states.30a Rosi and Bauschlicher orient the molecule so that it lies in the
xz plane. However, using a standard axis system in which the molecule is in the yz
plane, with the Co-O bond along the z axis, the b1 and b2 orbitals are reversed from

those of Rosi and Bauschlicher.30d For consistency, all orbitals and states have been
converted to standard notation. Rosi and Bauschlicher predict the ground state to be
3B1, with the nearly degenerate 3A2 and 3A1 states 245 cm-1 higher in energy and the 3B2
state at 630 cm-1. The results of several calculations,30 which generally predict a 3B1 or
3A2 ground state, are summarized in table 1.
The geometry of each of the four low-lying states of Co+(H2O) was optimized at
the B3LYP/6-311++G(3df,p), BHandHLYP/6-311++G(3df,p), and CCSD(T)/aug-cc-
pVTZ level. In each case, the 3B1, 3A2 and 3A1 states are nearly degenerate. The 3B2
state lies somewhat higher in energy and distorts from C2v to Cs symmetry by out-of-
plane hydrogen bending. The ground state was calculated to be the 3A2 state with
B3LYP and BHandHLYP and 3B1 with CCSD(T). As will be discussed later, the
experiments determine the ground state to be 3B1. Molecular orbitals for the 3B1 state
are shown in figure 2. In C2v symmetry, the 3d orbitals on Co+ lead to 3d!(z2) and
3d"(x2-y2) with a1 symmetry, 3d"(xy) with a2 symmetry, 3d#(xz) with b1 symmetry, and
3d#(yz) with b2 symmetry. In the 3B1 state, the 3d!(z2) and 3d"(x2-y2) orbitals mix. One
hole is in this mixed, a1 orbital, and the second hole is in the 3d#(xz) orbital. This mixing
was also observed by Rosi and Bauschlicher.30a
The Co+(H2O) molecule has six vibrations, whose calculated values are shown in
Table 2. The three high-frequency vibrations are essentially perturbed H2O vibrations.
There are also three low-frequency vibrations: the Co-O stretch and two H2O hindered
rotations (bends). Five of the six vibrations primarily correspond to motion of the
hydrogen atoms. Thus, substitution of deuterium for hydrogen should lead to large
isotopic shifts in these frequencies, while the Co-O stretch should show only a small H/D

isotopic shift. Experimentally, each band (A-D) consists of a series of peaks separated
by ~320 cm-1. This spacing decreases slightly at higher energy due to vibrational
anharmonicity. Upon deuteration, the peak spacing decreases only slightly. Therefore,
the observed vibrations are assigned to a progression in the Co-O stretch (v3’) and each
band (A-D) corresponds to a transition to a different electronic state.
The first peak observed in the photodissociation spectrum is not necessarily the
transition to v’=0, as this transition might lie below the dissociation energy. Therefore,
the origin band, and so the vibrational quantum numbering, is not clear from the
Co+(H2O) spectrum, but can be determined using isotope shifts. For an electronic
transition between two Morse oscillators, the shift is given by
!!!"# ! !!!! !! !! !!! ! !!!!!! !! !!! !!! !!! ! ! ! !!!!!!!!!!!!!!!!!!!!
where !!!! and !!!!!! are the upper state frequency and anharmonicity, !!!"# is the
difference in the v3’"v3”=0 transition energy between the light (L) and heavy (H)
isotopomers, !! ! !!!!!! and $T00 is the difference in the origin transition between the
two isotopomers.
In principle, in order to determine the quantum numbering of the transitions, the
observed energy shift can be used between any two of Co+(H2O), Co+(HOD), and
Co+(D2O). However, hydrogen-to-deuterium substitution leads to two complications. The
first is that it significantly changes the A rotational constant and thus the appearance of
the perpendicular bands. Rotational simulations of each vibrational feature would thus
be required to determine the isotope shift. The second difficulty is that H/D substitution

leads to large frequency shifts in five of the six vibrations. If the frequencies of these
vibrations change upon electronic excitation, it will lead to a shift in the zero point
energy (and hence in T00) upon deuteration. It is difficult to quantify this effect, as only
one of these vibrational frequencies (%5”) is measured. Clearly, isotopic substitution at
Co or O is preferable. Cobalt-59 is the only stable isotope. So, isotopic shifts were
measured using H218O. This has two advantages: H2
18O does not affect the A rotational
constant, and the shift in the zero point energy is small. Lessen et al. also used 18O
substitution to assign the vibrational quantum numbering in V+(H2O).10
Figure 3 shows the observed shift from Co+(H216O) to Co+(H2
18O) for the first three
peaks in each of the four electronic states. For the higher-energy bands, C and D, the
observed shifts lie along the solid line, indicating that the first observed peak is due to
the v3’=0 "v3”=0 transition. However, for the low-energy bands, A and B, the shifts lie
along the upper, dashed line, so the first peak observed is due to the v3’=1 "v3”=0
transition. Once the quantum numbers have been assigned, the Co-O stretching
frequencies and anharmonicities in each excited electronic state can be calculated. The
results are summarized in Table 2. All of the excited states have similar Co-O stretching
frequencies of %3#325 cm-1. This is substantially lower than the calculated
CCSD(T)/aug-cc-pVTZ value for the ground state: %3”=400 cm-1.
The lowest energy at which Co+(H2O) photodissociates is the v3’=1, Ka’=0"v3”=0,
Ka”=1 transition of band A at 13808 cm-1. This gives an upper limit to the Co+-H2O bond
strength (corrected for the rotational energy in Ka”=1, approximately 8 cm-1) of D0(Co+-
H2O)$13816 cm-1. Transitions to v3’=0 are not observed for bands A and B, implying that
they lie below the dissociation energy. The bond strength’s lower limit is estimated from

the observed v3’=1-5 transitions in band B extrapolated to v3’=0 at 13640 cm-1.
Combining the upper and lower limits gives D0(0K)(Co+-H2O)=13730±90 cm-1 =164.2±1.1
kJ/mol. This is in agreement with the values reported earlier: 155±12 kJ/mol, 2 168±16
kJ/mol 3 and 161±7 kJ/mol.!4
The relative intensities in each v3’ vibrational progression reflect the change in the
Co-O bond length following electronic excitation. These intensities are calculated by
solving the one-dimensional Schrödinger Equation along the Co-O stretch coordinate.
Here the molecule is treated as a pseudo diatomic, with the H2O as a single “atom” with
mass 18 amu. To determine $rCo-O from the experimental intensities the ground
electronic state is modeled as a Morse oscillator with the CCSD(T) vibrational frequency
and experimental dissociation energy. For each excited state, a Morse oscillator with the
experimental frequency and anharmonicity is used, and $rCo-O is adjusted until the best
match is found between the calculated and measured intensities. This corresponds to a
change in the metal-ligand bond length $rCo-O of 0.14 to 0.19 Å, depending on the excited
state. Although this analysis does not identify the sign of $rCo-O, it is clear from the
rotational structure (discussed below) that the bond length increases upon electronic
excitation.
The excited states of Co+(H2O) accessed in this study correlate to electronically
excited Co+*+H2O. The excited states involved are identified by estimating the diabatic
dissociation energy of each excited state. Treating the Co+-H2O stretch as a Morse
oscillator,
!! !!!!!!!!
!!!!!!!!!!!!!!!!!!!

where !! and !! are the Co-O stretching frequency and anharmonicity. The resulting
values are shown in Table 2. The calculated dissociation energies have large
uncertainties due to errors in anharmonicity. It would be more accurate to determine the
excited state dissociation limits using a LeRoy-Bernstein plot which properly accounts for
the long-range Co+-H2O interactions. This approach has been used to measure very
precise bond strengths for Co+-rare gas complexes.16a, 16c, 19 Unfortunately, this method
is not applicable as vibrational levels sufficiently close to the dissociation limit are not
observed. The energy of the excited state of Co+ is estimated using equation 3 and
solving for $E(Co+*).
!!! ! !!!! ! !! !"!! ! !!!!!!!!!!!!!!!!!!!
where !!!! and !!! are dissociation energies for the ground and excited electronic state,
!! !"! is the energy difference between Co+ and (Co+)* and !!!!is the origin band for
the transition in the molecule. Using D0’’=13730 cm-1, the D0’ values were calculated and
are listed in table 2. The resulting $E(Co+*) are sufficiently accurate to identify the triplet
excited electronic state of Co+ to which each excited state of Co+(H2O) correlates, but
not the spin-orbit state. States A and B correlate to Co+ 3FJ (3d74s) at 9813-11322 cm-1,
while the C and D states correlate to 3PJ (3d8) at 13261-13593 cm-1. If the parallel and
perpendicular bands correspond to transitions from the ground state of Co+(H2O) (which
correlates to the 3F4 ground state of Co+) to excited states with even $J and odd $J
respectively, then we can assign the spin-orbit state to which each excited state
correlates, and estimate D0’ using equation 2, with the known $E(Co+*). These results
are summarized in table 2. Morse potential curves for the ground and excited states of

Co+(H2O) observed in this study are shown in figure 4. The excited states are bound by
~10000 cm-1, or about 75% of the ground state binding energy. This is consistent with
the decreased Co-O stretching frequency and increased Co-O bond length upon
electronic excitation.
These results are similar to those observed in electronic photodissociation studies
of Ni+(H2O) by our group and of Co+(L) complexes by Brucat, Duncan and coworkers.
In the Ni+(H2O) study, transitions from the 2A1 ground state of Ni+(H2O), which correlates
to the 2D (3d9) ground state of Ni+, to the nearly degenerate 2A1 and 2A2 ground states,
which correlate to the 2F (3d84s) excited state of Ni+ are observed. Each band contains
a long progression in the Ni-O stretch, as the Ni-O bond lengthens by 0.20 Å upon
electronic excitation. The diabatic bond strength of the excited states is also ~78% that
of the ground state.11 The electronic spectra of Co+(L) (L=Ne,19 Ar,16a, b Kr, Xe,16c CO217
and N218) all show transitions to excited states in the visible with extended progressions
in the M-L stretch. The observed excited states correlate to Co+ 3F (3d74s) and 3P (3d8).
In addition, Brucat and coworkers observed weak transitions to singlet states which
correlate to Co+ 1D (3d8).16c For many Co+(RG) complexes, vibrational structure is
observed up to the diabatic dissociation limit, which allows for the determination of very
accurate bond strengths. The Co+-RG bond strengths range from 930 cm-1 for Co+(Ne)
to 7700 cm-1 for Co+(Xe). Diabatic binding energies of excited states which correlate to
3d8 states are smaller than those of the ground state, while those of states which
correlate to 3d74s states are even smaller. These photodissociation spectra typically
show well-resolved rotational structure, from which bond lengths have been determined.

Time dependent density functional theory calculations were carried out in order to
characterize the electronic excitations which lead to the observed excited states of
Co+(H2O). These calculations used the BHandHLYP functional with the 6-311++G(3df,p)
basis set. This particular functional was selected because it predicts excitation energies
of bare M+ much more accurately than other popular functionals (e.g., B3LYP), as we
have discussed in detail in our studies of V+(OCO) and Ni+(H2O).11, 35 Potential curves of
the ground and excited triplet states of Co+(H2O) are shown in figure 5. At each value of
rCo-O the geometry of the rest of the molecule is fixed at its equilibrium value. Several
excited states are predicted in the energy range observed in the photodissociation
spectrum. All of the bands in this region are calculated to be weak, with integrated
oscillator strengths of f<0.0010. This is consistent with the low signal levels observed.
Band A is likely due to the 2 3A2"X, 3B1 transition, which is predicted to be a
perpendicular band, with a calculated Te=11700 cm-1. The primary excitation is 4b1,
3d# "1a2, 3d". Band B is tentatively assigned to the 2 3B2"X, 3B1 transition (4b1,
3d# "4b2, 3d#), with a calculated Te=12000 cm-1. Though this transition is symmetry
forbidden, it could be observed due to vibronic coupling or to a magnetic dipole transition
and is expected to show parallel band structure. This is observed in the 1A2"X, 1A1 band
of H2CS.36 Band C is assigned to the perpendicular 3 3A2"X, 3B1 transition (11a1,
4s! "4b2, 3d#), with a calculated Te=16700 cm-1. Band D is likely due to the 3 3B1"X,
3B1 (primarily 11a1, 4s! "9a1, 3d"+3d!) transition, with a calculated Te=14400 cm-1,
although the symmetry forbidden 3 3B2"X, 3B1 (primarily 11a1, 4s! "1a2, 3d")
transition, with a calculated Te=16500 cm-1 is also a possibility.

B. Electronic Spectroscopy: Rotational Structure
Rotational structure in the electronic transitions can give information about the
geometry of the molecule, as well as the symmetry of the ground and excited states. As
previously mentioned, the four electronic bands of Co+(H2O) show two types of rotational
structure. Each vibrational transition in bands A and C (fig. 2) is a multiplet, consisting of
several peaks spaced by about 30 cm-1. This spacing is significantly smaller in
Co+(HOD) and even smaller in Co+(D2O). Bands B and D consist of single, sharp
vibrational peaks. Analogous structure is also observed in electronic bands of M+(H2O)
(M=Mg,7b-d Ca,8 Zn,12 Ni11). For Ni+(H2O) the A” and B”#C” rotational constants are
approximately 13.8 cm-1 and 0.30 cm-1, respectively,11 and similar values are expected
for Co+(H2O). The rotational Hamiltonian for open-shell M+(H2O) can be expressed as
the sum of a purely rotational and a spin-rotation term:37
! ! !!"#! ! !!!" !!!!!!!!!!!!
with
!!"# ! !!!! ! !!!! ! !!!!!!!!!!!!!!!!!!!
!!" !!! !!!! !!!! ! !!!! !!!!!!!!!!!!!!!!!!!!!!!!!!!!!!!!
where N is the rotational angular momentum, S is the spin angular momentum, A, B, and
C are the rotational constants, and !!!! are the components of the spin-rotation tensor in
the inertial axis system (a,b,c). For a prolate near-symmetric top, the eigenvalues of Hrot
are given by

! !!!! ! ! ! ! !!! ! !! ! ! ! !!!!!!!!!!!!!!!!!!!!!
where J is the total rotational angular momentum quantum number, Ka is the quantum
number for rotation along the a axis (the Co-O bond in our molecule), and ! ! ! ! !! !
!! For a symmetric prolate top, A > B and B=C. The A rotational constant is inversely
proportional to the moment of inertia for rotation about the a axis. It thus depends on the
H-O-H bond angle and the O-H bond length and is strongly affected by deuterium
substitution. The multiplet bands (A and C) are perpendicular transitions with selection
rules %Ka=±1 and %J=0, ±1.38 The triplets observed for Co+(H2O) are due to transitions
from Ka”=0 to Ka’=1 and from Ka”=1 to Ka’=0 and 2. The sharp bands B and D are
parallel transitions with selection rules %Ka=0 and %J=0, ±1 for Ka&0 and %Ka=0 and
%J=±1 for Ka=0. Transitions are observed from Ka”=0 to Ka’=0 and from Ka”=1 to Ka’=1.
These transitions overlap as the A constants are similar for the two electronic states,
resulting in a single peak rather than a multiplet. Because individual J lines are not
resolved in the photodissociation spectra of Co+(H2O) and its isotopomers, the
perpendicular transitions are more useful for determining rotational constants.
Figure 6 shows the v3’=2!v3”=0 transition in the perpendicular band C for
Co+(H2O), Co+(HOD) and Co+(D2O), highlighting the partially resolved rotational
structure. The three major peaks are labeled by the Ka quantum numbers. Spin-rotation
and J interaction determines the structure within each peak. The relative intensities of
peaks arising from Ka”=0 and 1 allows one to ascertain the lower state of the electronic
transitions. These intensities are determined by the overall wavefunction, a product of
vibrational, rotational, electronic and nuclear wavefunctions:
'tot= 'vib 'rot 'elec 'nucl (8)

where 'tot must be ODD to satisfy conservation principles. The vibrational wavefunction
'vib is EVEN for the ground state and for any a1 vibration. The rotational wavefunction
'rot is EVEN if Ka” is even, and ODD if Ka” is odd. At the ~15K temperature, Co+(H2O)
molecules cool to Ka”=0 and 1. Cooling states with Ka”=1 to Ka”=0 is very inefficient, as
it requires changing nuclear spin. If Co+(H2O) has C2v symmetry, the two protons are
equivalent, and there are 3 symmetric (EVEN) states in (nucl and 1 antisymmetric
(ODD) state. For Co+(D2O), the EVEN:ODD ratio is 1:2. Thus, if 'elec is EVEN, the
spectra should show enhanced intensity for odd Ka” for Co+(H2O) and for even Ka” for
Co+(D2O). This is what is observed in electronic spectra of M+(H2O) (M=Mg,7b-d Ca,8
Zn,12 Ni11), all of which have a 2A1 ground state. However, the spectra in figure 6 show
enhanced intensity for Ka”=0 for Co+(H2O) and for Ka”=1 for Co+(D2O), indicating that
states with Ka”=0 have ODD overall spatial symmetry. This same intensity pattern is
observed throughout the perpendicular bands A and C. In the parallel bands, transitions
from Ka”=0 and 1 overlap, making intensity comparisons difficult. In C2v the electronic
wavefunction is symmetrical (EVEN) for rotational about the C2 axis (the a axis) for
states with A symmetry and is antisymmetrical (ODD) for states with B symmetry. The
observed intensities indicate that the lower state involved has 'elec ODD and thus has
B1 or B2 symmetry. Calculations predict that the ground state of Co+(H2O) is 3B1 or 3A2
(table 1), with a low-lying 3A1 state. The 3B2 state is somewhat higher in energy and is
often calculated to distort to Cs symmetry. Thus, based on the calculations and
experimental intensities, Co+(H2O) has C2v symmetry and the lower electronic state in
the perpendicular transitions is a 3B1 state. This state appears to be the ground state of

Co+(H2O), as the relative intensities of bands A-D do not depend on the conditions in
the ion source (and hence its temperature).
The rotational structure in the spectra of Co+(H2O), Co+(HOD) and Co+(D2O) was
simulated using the spfit and spcat programs.39 Figure 6 shows simulated spectra, and
the fit parameters are listed in table 4. Fits to the spectra indicate a Lorentzian linewidth
of 1 cm-1, which likely reflects the excited state lifetime. The modest spectral resolution
precludes detailed analysis of the J structure. In addition, although the spin-rotation
interaction parameter, !, has components along all three rotational axes, !!! will
dominate as the A rotational constant is much larger than B#C. Therefore, in the
analysis, all other components of ! are assumed to be zero. To further constrain the fits,
the ground state rotational constants are set to their calculated values. Based on the
calculated CCSD(T)/aug-cc-pVTZ ground state geometry, Co+(H2O) is a near-prolate
top with rotational constants Ae=13.93 cm-1, Be=0.292 cm-1 and Ce=0.286 cm-1. To
correct these rotational constants for zero-point displacement, an anharmonic frequency
calculation was carried out. Because this is not available for CCSD(T) in Gaussian09,
they were carried out at the BHandHLYP/6-311++G(3df,p) level, and the difference
between the zero-point corrected and equilibrium rotational constants is added to the
CCSD(T) equilibrium rotational constants, giving A0”=13.74 cm-1, B0”=0.289 cm-1 and
C0”=0.283 cm-1. The simulations are moderately sensitive to the change in B and C on
electronic excitation, and clearly indicate that the Co-O bond lengthens ($B<0). Due to
the modest spectral resolution, $rCo-O from the vibrational intensities is substantially
more precise than $rCo-O derived from rotational analysis of $B. The vibrational analysis

gives $rCo-O=0.19±0.02 Å. For Co+(H2O), this implies $B=-0.044 cm-1 which is the value
used in the fit.
Two factors contribute to the spin-rotation parameter !: coupling of the electron
spin to the magnetic field due to molecular rotation and second-order interaction
between the spin-orbit coupling and the Coriolis interaction.37b The second term
dominates. In atomic Co+, the spin-orbit splitting is 697 cm-1 for the 3F (3d9) ground state,
657 cm-1 for the 3F (3d84s1) excited state and 89 cm-1 for the 3P (3d8) excited state. The
large atomic spin-orbit coupling leads to fairly large spin-rotation constants. Including !!!
modifies the energies given by equation 7. A perturbation treatment shows that it
introduces an additional term proportional to !!!!!!, where &=0,±1 is the projection of
the spin angular momentum onto the a axis. This leads to broadening in peaks with
Ka>0. It also produces a term proportional to Ka2, which affects the apparent A rotational
constant.8b, 40 For Co+(H2O), we determine !!!!! =-6 cm-1. The effect of this parameter is
most clearly seen in the width of the Ka’=0"Ka’’=1 peak. For the upper state, !!!! =4 cm-
1, which leads to the broad structure in the Ka’=2"Ka’’=1 peak. The value of !!!!! is half
that in Ni+(H2O).
In the absence of spin-rotation interaction, equation 7 predicts that the
Ka’=0"Ka’’=1 and Ka’=2"Ka’’=1 transitions are separated by 4A’. As noted above, !!!!
modifies this spacing. So, once !!!! has been fit, A’ can be determined. Excitation of the
Co-O stretch v3’ should reduce the B and C rotational constants, but should have little
effect on the A rotational constant. This is confirmed by the anharmonic frequency
calculations. However, comparison of the rotational structure of peaks in band C with

v3’=0 to 5 (figure S1) shows that the spacing between the Ka’=0"Ka’’=1 and
Ka’=2"Ka’’=1 peaks drops monotonically from 85 cm-1 for v3’=0 to 53 cm-1 for v3’=5. The
widths of the peaks don’t change significantly, suggesting that !!!! doesn’t depend on v3’.
Fitting the spectra thus requires unphysically large values of A’#21 cm-1 for v3’=0 and
rather low A’#13 cm-1 for v3’=5. A similar apparent reduction of A’ with increased Co-O
stretch excitation is observed for band A. The A and B states are almost degenerate, as
are the C and D states. Interactions between these states could lead to perturbations in
the rotational structure that depend strongly on the excitation energy. As a result of this
perturbation, we are unable to use the rotational structure to determine the excited state
geometry.
C. Vibrational Spectroscopy
A key question is how the presence of the metal ion affects the bonding in the
water ligand. One way to address this question is to measure the vibrations of the ligand.
Our calculations predict that binding to Co+ reduces the water O-H stretching frequencies
by ~50 cm-1 for the symmetric stretch, ~80 cm-1 for the antisymmetric stretch, and ~20
cm-1 for the bend (table 1). Comparable red shifts in the O-H stretches have been
observed in spectra of other transition metal M+(H2O) complexes.11, 20-26
Measuring vibrational spectra of small, tightly-bound ions using photodissociation
is challenging. Breaking the strong Co+-H2O bond requires four photons in the O-H
stretching region. This high bond strength and the small size of the molecule make
infrared multiple photon dissociation (IRMPD) very inefficient. Spectra of several
M+(H2O) have been measured via photodissociation of argon tagged M+(H2O)(Ar)n
complexes, where absorption of light by the O-H chromophore eventually leads to loss of
the weakly bound argon.20-26 Calculations predict that the presence of the argon usually
only leads to small shifts in the O-H stretching frequencies. However, the argon does
change the rotational structure. A particular concern in Co+(H2O) is that the energies of
the 3B1, 3A1 and 3A2 states are so similar that binding to argon could actually change the
ground state! Because Co+(H2O) has a structured electronic photodissociation spectrum,
vibrationally mediated photodissociation (VMP) is used to measure its vibrational
spectrum. In this two laser double-resonance technique, parent molecules are
dissociated using a fixed wavelength (from a dye laser) in the visible region while an
infrared laser, firing 30 ns before, scans through the wavelength region of interest. When
the IR laser is in resonance with a vibrational transition, molecules will be vibrationally
excited, which leaves less population in the ground vibrational level. As the
photodissociation laser is set to a wavelength where vibrationally cold molecules absorb,
but vibrationally excited molecules do not (or absorb only weakly), the vibrational
excitation leads to less photodissociation. Hence a vibrational spectrum is obtained by
monitoring the depletion or “dip” of the fragment signal. We have used this technique to
measure the O-H stretching vibrations of Ni+(H2O).11
Figure 7 shows vibrational spectra of the O-H stretching region of Co+(H2O)
measured using VMP. The spectrum in the top panel was obtained with the
photodissociation laser set to the 16215 cm-1 (v3’=1, Ka’=1) ! X 3B1 (v3”=0, Ka”=0)
transition. This double-resonance experiment only probes vibrational transitions with
Ka”=0. The O-H symmetric stretch vibration is a parallel transition, ($Ka=0), and the (0,0)

transition is observed at 3610 cm-1. The O-H antisymmetric stretch vibration %5 is a
perpendicular transition, ($Ka=±1); exciting the intense (1,0) transition at 3693 cm-1 leads
to >40% depletion of the photofragment signal. Similar vibrational spectra are observed
when exciting other electronic transitions with Ka”=0. The lower spectrum was obtained
with the photodissociation laser set to the 16253 cm-1 (v3’=1, Ka’=2) ! X 3B1 (v3”=0,
Ka”=1) transition. The observed transitions all have Ka”=1. The symmetric stretch (1,1)
transition is also observed at 3610 cm-1, while the antisymmetric stretch leads to two
absorptions, (0,1) at 3670 cm-1 and (2,1) at 3713 cm-1.
In principle, vibrational spectra can also be measured in an enhancement
experiment in which the visible laser is set to a wavelength at which vibrationally excited
molecules selectively absorb. We have used this method to measure vibrational spectra
of V+(OCO), with greatly improved signal-to-noise over the depletion experiment.41 In
order to find the absorption of the vibrationally excited molecules the IR laser is first set
to an absorption and the visible laser is scanned. The difference between the resulting
spectrum and one with the IR laser blocked gives the photodissociation spectrum of
vibrationally excited molecules. For small molecules such as V+(OCO) this often has
well-defined peaks. In the present study, the IR laser was set to 3693 cm-1 as the visible
laser scanned the low-energy region of bands A and B. Unfortunately, the resulting
vibrationally mediated photodissociation spectrum is broad, with no sharp features. This
persists for other IR bands shown in figure 7, and when scanning the visible laser over
bands C and D as well. The vibrationally mediated photodissociation spectrum of
Ni+(H2O) is also mostly non-resonant, although one moderately intense peak is
observed.11 For larger species, the vibrationally excited molecules often show a broad

photodissociation spectrum due to efficient intramolecular vibrational relaxation (IVR).42
However, IVR should be slow in a molecule as small as Co+(H2O) due to the low
vibrational density of states near 3700 cm-1. One possible mechanism for state mixing is
via coupling to one of the many low-lying electronic states.
The vibrational spectra were simulated using the spfit and spcat programs,39 and
the results are shown in figure 7 and summarized in Table 4. The simulations use a
temperature of 15 K and assume that the visible laser overlaps all of the thermally
populated J states so the double resonance experiment selects states with specific Ka’’
but does not select J’’. For the ground state, the same calculated rotational constants
were used as for the electronic spectrum. Anharmonic frequency calculations at the
BHandHLYP level predict rotational constants for the ground and excited vibrational
states. The change in rotational constants upon vibrational excitation ($A=-0.13 cm-1,
$B=$C=0 for v1 and v5) was then used in the spectral simulations. The spin-rotation
parameter !!! was assumed to be the same for the ground and vibrationally excited
states. For the ground electronic state, the previously determined !!!=-6±1 cm-1 gives a
good fit to the vibrational and electronic spectra. The O-H symmetric stretch frequency is
%1=3609.7±1 cm-1 and the O-H antisymmetric stretch is %1=3679.5±2 cm-1. Binding to Co+
thus leads to red shifts of 47 and 76 cm-1 in the symmetric and antisymmetric stretching
frequencies, respectively. For Co+(HOD) we measure an O-H stretching frequency of
3650 cm-1, a red shift of 57 cm-1 compared to bare HOD. The Co+(HOD) vibrational
spectrum and fit are in figure S2. When Co+ binds to H2O, it removes electron density
from the oxygen, which slightly weakens the O-H bonds. Therefore, we observe a red
shift in the O-H stretching frequencies.

The red shifts are slightly larger than those observed in Ni+(H2O),11 40 cm-1 and
68 cm-1. Furukawa et al. measured IR spectra of Co+(H2O)n (n=4-6) in the O-H stretching
region via photodissociation spectroscopy.28 Their spectra show that all the ions are
three coordinate and are fairly hot, so the sharpest spectrum obtained is of the tagged
cluster Co+(H2O)4(N2). This ion has IR absorptions at 3430, 3530 cm-1 due to H-bonded
OH groups and at 3620 and 3710 cm-1 due to free OH groups. The free-OH stretches
are less red-shifted than in Co+(H2O), as each water molecule donates less electron
density to the cation in the cluster.
IV. SUMMARY AND CONCLUSIONS
The electronic spectra of Co+(H2O), Co+(HOD) and Co+(D2O) were measured from
13500 cm-1 to 18400 cm-1 using photodissociation spectroscopy. They show transitions
to four excited electronic states, with long progressions in the Co-O stretch and partially
resolved rotational structure. The absolute vibrational quantum numbering is assigned by
comparing isotopic shifts between Co+(H216O) and Co+(H2
18O). For the two low-lying
excited electronic states, the first transition observed is to v3’=1. This allows the Co+-
(H2O) binding energy to be bracketed as D0(0 K) (Co+-H2O)=13730±90 cm-1 (164.2±1.1
kJ/mol). The ground state is assigned as 3B1 based on the nuclear spin statistics of the
Ka rotational structure. The vibrational spectrum of Co+(H2O) in the O-H stretching region
was measured using photodissociation. The O-H stretches are observed at %1=3609.7
cm-1 for the symmetric stretch and %5=3679.5 cm-1 for the antisymmetric stretch. This
corresponds to a 47 cm-1 red shift for the symmetric stretch and 76 cm-1 red shift for the
antisymmetric stretch, relative to bare H2O.

V. ACKNOWLEDGEMENTS
The authors thank Fernando Aguirre for measuring preliminary spectra of
Co+(H2O). Financial support from the National Science Foundation under award CHE-
0911225 is gratefully acknowledged.
Supporting Information Available: overlapped photodissociation spectrum of
Co+(H2O), highlighting the rotational structure in band C with v3’=0 to 5 (Figure S1) and
vibrational spectrum of Co+(HOD) in the O-H stretching region (Figure S2).
References 1. Beyer, M. K. Mass Spectrom. Rev. 2007, 26, 517. 2. Magnera, T. F.; David, D. E.; Michl, J. J. Am. Chem. Soc. 1989, 111, 4100. 3. Marinelli, P. J.; Squires, R. R. J. Am. Chem. Soc. 1989, 111, 4101. 4. Dalleska, N. F.; Honma, K.; Sunderlin, L. S.; Armentrout, P. B. J. Am. Chem. Soc. 1994, 116, 3519. 5. Moore, C. E., Atomic Energy Levels. In NSRDS-NBS 35, Vol. 2, 1949. 6. Kumar, M.; Kumar, N.; Hirao, H.; Kozlowski, P. M. Inorg. Chem. 2012, 51, 5533. 7. (a) Misaizu, F.; Sanekata, M.; Tsukamoto, K.; Fuke, K.; Iwata, S. J. Phys. Chem. 1992, 96, 8259; (b) Willey, K. F.; Yeh, C. S.; Robbins, D. L.; Pilgrim, J. S.; Duncan, M. A. J. Chem. Phys. 1992, 97, 8886; (c) Yeh, C. S.; Willey, K. F.; Robbins, D. L.; Pilgrim, J. S.; Duncan, M. A. Chem. Phys. Lett. 1992, 196, 233; (d) Yeh, C. S.; Pilgrim, J. S.; Willey, K. F.; Robbins, D. L.; Duncan, M. A. Int. Rev. Phys. Chem. 1994, 13, 231. 8. (a) Scurlock, C. T.; Pullins, S. H.; Reddic, J. E.; Duncan, M. A. J. Chem. Phys. 1996, 104, 4591; (b) Ishikawa, H.; Nakano, T.; Eguchi, T.; Shibukawa, T.; Fuke, K. Chem. Phys. Lett. 2011, 514, 234. 9. (a) Donnelly, S. G.; Schmuttenmaer, C. A.; Qian, J.; Farrar, J. M. J. Chem. Soc.-Faraday Trans. 1993, 89, 1457; (b) Sperry, D. C.; Midey, A. J.; Lee, J. I.; Qian, J.; Farrar, J. M. J. Chem. Phys. 1999, 111, 8469; (c) Farrar, J. M. Int. Rev. Phys. Chem. 2003, 22, 593. 10. Lessen, D. E.; Asher, R. L.; Brucat, P. J. J. Chem. Phys. 1990, 93, 6102. 11. Daluz, J. S.; Kocak, A.; Metz, R. B. J. Phys. Chem. A 2012, 116, 1344. 12. Abate, Y.; Kleiber, P. D. J. Chem. Phys. 2005, 122, 084305. 13. Poisson, L.; Dukan, L.; Sublemontier, O.; Lepetit, F.; Reau, F.; Pradel, P.; Mestdagh, J. M.; Visticot, J. P. Int. J. Mass Spectrom. 2002, 220, 111. 14. Faherty, K. P.; Thompson, C. J.; Aguirre, F.; Michne, J.; Metz, R. B. J. Phys. Chem. A 2001, 105, 10054. 15. Donald, W. A.; Leib, R. D.; Demireva, M.; Negru, B.; Neumark, D. M.; Williams, E. R. J. Phys. Chem. A 2011, 115, 2. 16. (a) Lessen, D.; Brucat, P. J. J. Chem. Phys. 1989, 90, 6296; (b) Asher, R. L.; Bellert, D.; Buthelezi, T.; Brucat, P. J. Chem. Phys. Lett. 1994, 227, 277; (c) Buthelezi, T.; Bellert, D.; Lewis, V.; Brucat, P. J. Chem. Phys. Lett. 1995, 242, 627. 17. (a) Asher, R. L.; Bellert, D.; Buthelezi, T.; Brucat, P. J. Chem. Phys. Lett. 1994, 227, 623; (b) Bellert, D.; Buthelezi, T.; Brucat, P. J. Chem. Phys. Lett. 1998, 290, 316. 18. Asher, R. L.; Bellert, D.; Buthelezi, T.; Brucat, P. J. J. Phys. Chem. 1995, 99, 1068. 19. Mosley, J. D.; Cheng, T. C.; Hasbrouck, S. D.; Ricks, A. M.; Duncan, M. A. J. Chem. Phys. 2011, 135, 104309. 20. Carnegie, P. D.; Bandyopadhyay, B.; Duncan, M. A. J. Chem. Phys. 2011, 134, 014302. 21. (a) Walker, N. R.; Walters, R. S.; Pillai, E. D.; Duncan, M. A. J. Chem. Phys. 2003, 119, 10471; (b) Kasalova, V.; Allen, W. D.; Schaefer III, H. F.; Pillai, E. D.; Duncan, M. A. J. Phys. Chem. A 2007, 111, 7599. 22. Carnegie, P. D.; Bandyopadhyay, B.; Duncan, M. A. J. Phys. Chem. A 2008, 112, 6237.

23. Carnegie, P. D.; Bandyopadhyay, B.; Duncan, M. A. J. Phys. Chem. A 2011, 115, 7602. 24. (a) Walters, R. S.; Duncan, M. A. Aust. J. Chem. 2004, 57, 1145; (b) Garza-Galindo, R.; Castro, M.; Duncan, M. A. J. Phys. Chem. A 2012, 116, 1906. 25. Walters, R. S.; Pillai, E. D.; Duncan, M. A. J. Am. Chem. Soc. 2005, 127, 16599. 26. Carnegie, P. D.; McCoy, A. B.; Duncan, M. A. J. Phys. Chem. A 2009, 113, 4849. 27. Bandyopadhyay, B.; Duncan, M. A. Chem. Phys. Lett. 2012, 530, 10. 28. Furukawa, K.; Ohashi, K.; Koga, N.; Imamura, T.; Judai, K.; Nishi, N.; Sekiya, H. Chem. Phys. Lett. 2011, 508, 202. 29. O'Brien, J. T.; Williams, E. R. J. Phys. Chem. A 2011, 115, 14612. 30. (a) Rosi, M.; Bauschlicher, C. W., Jr. J. Chem. Phys. 1989, 90, 7264; (b) Trachtman, M.; Markham, G. D.; Glusker, J. P.; George, P.; Bock, C. W. Inorg. Chem. 1998, 37, 4421; (c) Irigoras, A.; Elizalde, O.; Silanes, I.; Fowler, J. E.; Ugalde, J. M. J. Am. Chem. Soc. 2000, 122, 114; (d) Klippenstein, S. J.; Yang, C.-N. Int. J. Mass Spectrom. 2000, 201, 253; (e) Nakao, Y.; Hirao, K. J. Chem. Phys. 2001, 114, 5216. 31. (a) Husband, J.; Aguirre, F.; Ferguson, P.; Metz, R. B. J. Chem. Phys. 1999, 111, 1433; (b) Aguirre, F.; Husband, J.; Thompson, C. J.; Metz, R. B. Chem. Phys. Lett. 2000, 318, 466. 32. (a) Altinay, G.; Citir, M.; Metz, R. B. J. Phys. Chem. A 2010, 114, 5104; (b) Kaur, D.; Desouza, A. M.; Wanna, J.; Hammad, S. A.; Mercorelli, L.; Perry, D. S. Appl. Optics 1990, 29, 119. 33. Frisch, M. J.; Trucks, G. W.; Schlegel, H. B.; Scuseria, G. E.; Robb, M. A.; Cheeseman, J. R.; Scalmani, G.; Barone, V.; Mennucci, B.; Petersson, G. A.; Nakatsuji, H.; Caricato, M.; Li, X.; Hratchian, H. P.; Izmaylov, A. F.; Bloino, J.; Zheng, G.; Sonnenberg, J. L.; Hada, M.; Ehara, M.; Toyota, K.; Fukuda, R.; Hasegawa, J.; Ishida, M.; Nakajima, T.; Honda, Y.; Kitao, O.; Nakai, H.; Vreven, T.; Montgomery Jr., J. A.; Peralta, J. E.; Ogliaro, F.; Bearpark, M.; Heyd, J. J.; Brothers, E.; Kudin, K. N.; Staroverov, V. N.; Keith, T.; Kobayashi, R.; Normand, J.; Raghavachari, K.; Rendell, A.; Burant, J. C.; Iyengar, S. S.; Tomasi, J.; Cossi, M.; Rega, N.; Millam, J. M.; Klene, M.; Knox, J. E.; Cross, J. B.; Bakken, V.; Adamo, C.; Jaramillo, J.; Gomperts, R.; Stratmann, R. E.; Yazyev, O.; Austin, A. J.; Cammi, R.; Pomelli, C.; Ochterski, J. W.; Martin, R. L.; Morokuma, K.; Zakrzewski, V. G.; Voth, G. A.; Salvador, P.; Dannenberg, J. J.; Dapprich, S.; Daniels, A. D.; Farkas, O.; Foresman, J. B.; Ortiz, J. V.; Cioslowski, J.; Fox, D. J. Gaussian 09, Gaussian, Inc., Wallingford, CT: Pittsburgh PA, 2010. 34. Freiser, B. S., Organometallic Ion Chemistry. Kluwer Academic Publishers: Dordrecht, 1996; Vol. 15. 35. Citir, M.; Metz, R. B. J. Chem. Phys. 2008, 128, 024307. 36. Clouthier, D. J.; Ramsay, D. A. Ann. Rev. Phys. Chem. 1983, 34, 31. 37. (a) Brown, J. M.; Sears, T. J. J. Mol. Spectrosc. 1979, 75, 111; (b) Tarczay, G.; Gopalakrishnan, S.; Miller, T. A. J. Mol. Spectrosc. 2003, 220, 276. 38. Herzberg, G., Molecular Spectra and Molecular Structure. III. Electronic Spectra and Electronic Structure of Polyatomic Molecules. Krieger Publishing: New York, 1991. 39. Pickett, H. M. J. Mol. Spectrosc. 1991, 148, 371. 40. Whitham, C. J.; Jungen, C. J. Chem. Phys. 1990, 93, 1001. 41. Citir, M.; Altinay, G.; Metz, R. B. J. Phys. Chem. A 2006, 110, 5051. 42. Rizzo, T. R.; Stearns, J. A.; Boyarkin, O. V. Int. Rev. Phys. Chem. 2009, 28, 481.

Method/Basis State rCo-O (Å) rO-H (Å) < HOH Energy (cm-1) Orbital Occupancy (Holes)
MCPF
(Ref. 30a)
3A1 ~245 3d!(x2-y2) , 3d"(z2) 3A2 2.022 245 3d!(xy) , 3d"(z2) 3B1 1.991 0 [3d! (x2-y2), 3d#(xz)] + [3d"(z2),3d#(xz)] 3B2 630 3d!(xy) , 3d#(xz)
CCSD(T)(FULL)/6-311++G**//MP2(FULL)/6-
311++G**
(Ref. 30b)
3A1 14 3d! (x2-y2), 3d"(z2) 3A2 2.003 0.964 106.6 0 3d!(xy), 3d"(z2) 3B1 1.973 0.965 106.6 115 3d! (x2-y2), 3d#(xz) 3A” 3d! (x2-y2), 3d#(yz)
B3LYP/B3//
B3LYP/B2
(Ref. 30d)
3A1 1.988 175 3A2 1.985 175 3B1 1.960 0 3B2 1.992 944
MR-SDCI(+Q)
(Ref. 30e)
3A1 35 3A2 1.944 0.967 108.1 0 3dz2, 3dxy 3B1 245 3B2 105
CCSD(T)/aug-cc-pVTZ
(This work)
3A1 2.0003 0.964 106.7 39 3d"(z2), 3d! (x2-y2) 3A2 1.9996 0.964 106.8 25 3d"(z2), 3d!(xy) 3B1 1.9705 0.965 106.8 0 [3d! (x2-y2), 3d#(xz)] + [3d"(z2),3d#(xz)] 3B2 1.9115
Table 1. Calculated energies and geometries of low-lying states of Co+(H2O)

Table 2. Experimental and calculated vibrational frequencies of Co+(H2O) and Co+(D2O). The frequencies at the BHandHLYP/6-311++G(3df,p) level are scaled by 0.92. By binding to Co+, the symmetric and antisymmetric stretches of H2O red shift by 47 and 76 cm-1, respectively.
Vibrational Symmetry
Mode (vi)
Description Frequency (cm-1) Co+(H2O)
BHandHLYP
Frequency (cm-1) Co+(D2O)
BHandHLYP
Frequency (cm-1) Co+(H2O)
Experimental
Frequency (cm-1) H2O
Frequency (cm-1) D2O
a1 1 H-O-H symmetric stretch
3604 2626 3609.7 ± 1 3657 2671
2 H-O-H bend 1575 1169 1595 1178
3 Co-O stretch 354 343 -
b1 4 Out-of-plane bend 318 246 -
b2 5 H-O-H antisymmetric
stretch
3674 2725 3679.5 ± 2 3756 2788
6 In-plane bend 538 405 -
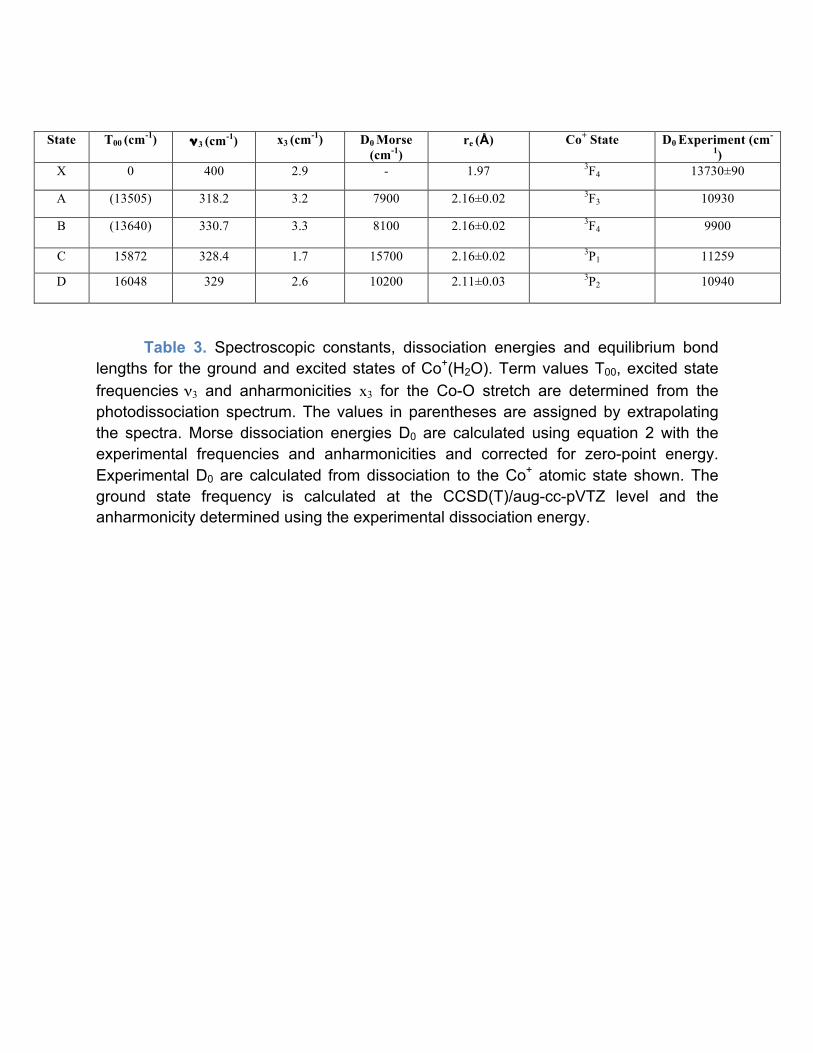
State T00 (cm-1) !3 (cm-1) x3 (cm-1) D0 Morse (cm-1)
re (Å) Co+ State D0 Experiment (cm-
1) X 0 400 2.9 - 1.97 3F4
13730±90
A (13505) 318.2 3.2 7900 2.16±0.02 3F3 10930
B (13640) 330.7 3.3 8100 2.16±0.02 3F4 9900
C 15872 328.4 1.7 15700 2.16±0.02 3P1 11259
D 16048 329 2.6 10200 2.11±0.03 3P2 10940
Table 3. Spectroscopic constants, dissociation energies and equilibrium bond lengths for the ground and excited states of Co+(H2O). Term values T00, excited state frequencies !3 and anharmonicities x3 for the Co-O stretch are determined from the photodissociation spectrum. The values in parentheses are assigned by extrapolating the spectra. Morse dissociation energies D0 are calculated using equation 2 with the experimental frequencies and anharmonicities and corrected for zero-point energy. Experimental D0 are calculated from dissociation to the Co+ atomic state shown. The ground state frequency is calculated at the CCSD(T)/aug-cc-pVTZ level and the anharmonicity determined using the experimental dissociation energy.

Co+(H2O) (cm-1) 3B1 Ground State (v”=0) State C (v3’=2) A 13.74a 14.5 B 0.289a 0.245 C 0.283a 0.241 !!! -6 ± 1 4 ± 1
Co+(D2O) A 6.87a 7.3 B 0.252a 0.212 C 0.243a 0.203 !!! -3 ± 1 6 ± 1
Co+(HOD) A 9.56a 9.95 B 0.272a 0.228 C 0.264a 0.224 !!! -3.5 ± 1 3 ± 1
Table 4. Rotational constants for Co+(H2O) and isotopomers. Excited state values are for the v3’=2 band of electronic state C. a) Calculated at the CCSD(T)/aug-cc-pVTZ level.

Figure captions
Figure 1. Photodissociation spectra of the Co+(H2O), Co+(HOD) and Co+(D2O) complexes from 13500 to
18400 cm-1. The combs indicate the Co-water stretch quantum number v3! in each of the four electronic states
observed.
Figure 2. Molecular orbital diagram and orbital occupancy of Co+(H2O) X, 3B1.
Figure 3. Assignment of the cobalt-water stretch vibrational quantum numbering for the four electronic states
observed in the photodissociation spectrum of Co+(H2O). Experimental shifts of Co+(H216O) vs. Co+(H2
18O) are
compared to values calculated assuming the first peak observed is due to v3!=1"v3#=0 (dashed line),
v3!=0"v3#=0 (solid line), and to v3!=0"v3#=1 (dotted line). The four electronic states are labeled as in Figure
1.
Figure 4. Potential energy curves of the ground and excited electronic states of Co+(H2O) along the Co-O
stretch based on experiment. The inset shows an expanded view of the excited states in the region near the
dissociation limit.
Figure 5. Calculated potential energy curves for triplet states of Co+(H2O) along the Co-O stretch. Excited
states are calculated using TD-DFT at the BHandHLYP/6-311++G(3df,p) level.
Figure 6. Partially resolved rotational spectra of the Band C (v3’=2) " X 3B1 (v3”=0) band of Co+(H2O) (top),
Co+(HOD) (middle) and Co+(D2O) (bottom) showing the $Ka=±1 features characteristic of a perpendicular
transition. The simulated spectra are also shown, using the spectroscopic parameters in Table 3, a rotational
temperature of 15 K and a Lorentzian linewidth of 1 cm-1.
Figure 7. Vibrational spectra of Co+(H2O) in the O-H stretching region. The spectra are obtained by
vibrationally mediated photodissociation, monitoring depletion in the Co+ photofragment produced by
irradiation of the (v3’=1, Ka’=1) " X 3B1 (v3”=0, Ka”=0) transition at 16215 cm-1 (top) and (v3’=1, Ka’=2) " X 3B1 (v3”=0, Ka”=1) transition at 16253 cm-1 (bottom). IR absorption removes molecules from v”=0, leading to a
15-45% reduction in the fragment yield. Simulated spectra are also shown, using the spectroscopic parameters
in Table 4. Vertical bars denote the positions of the symmetric and antisymmetric stretches in bare H2O.

Figure 1
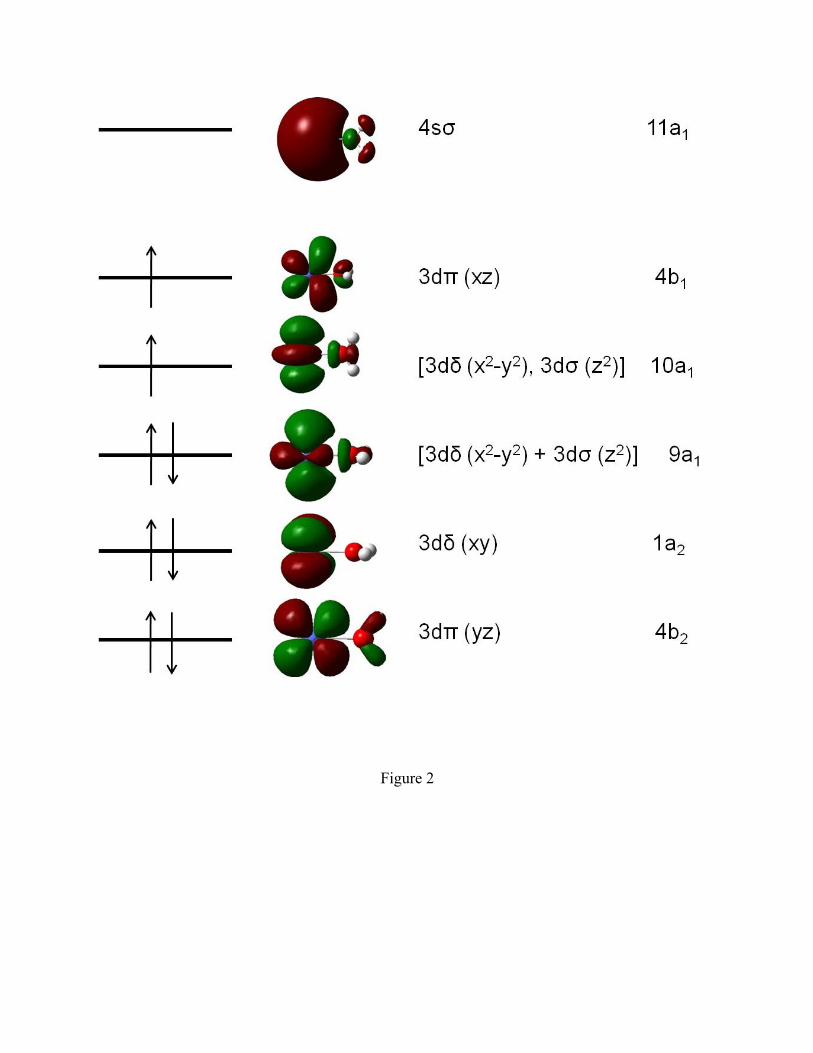
Figure 2
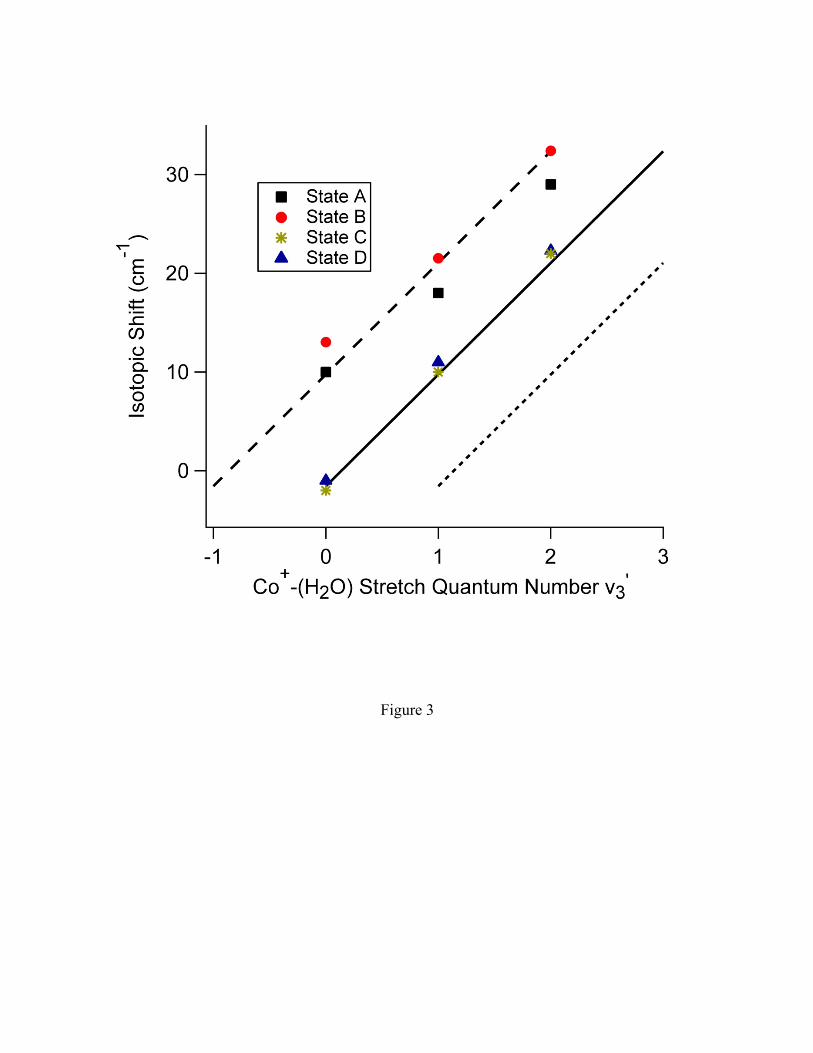
Figure 3
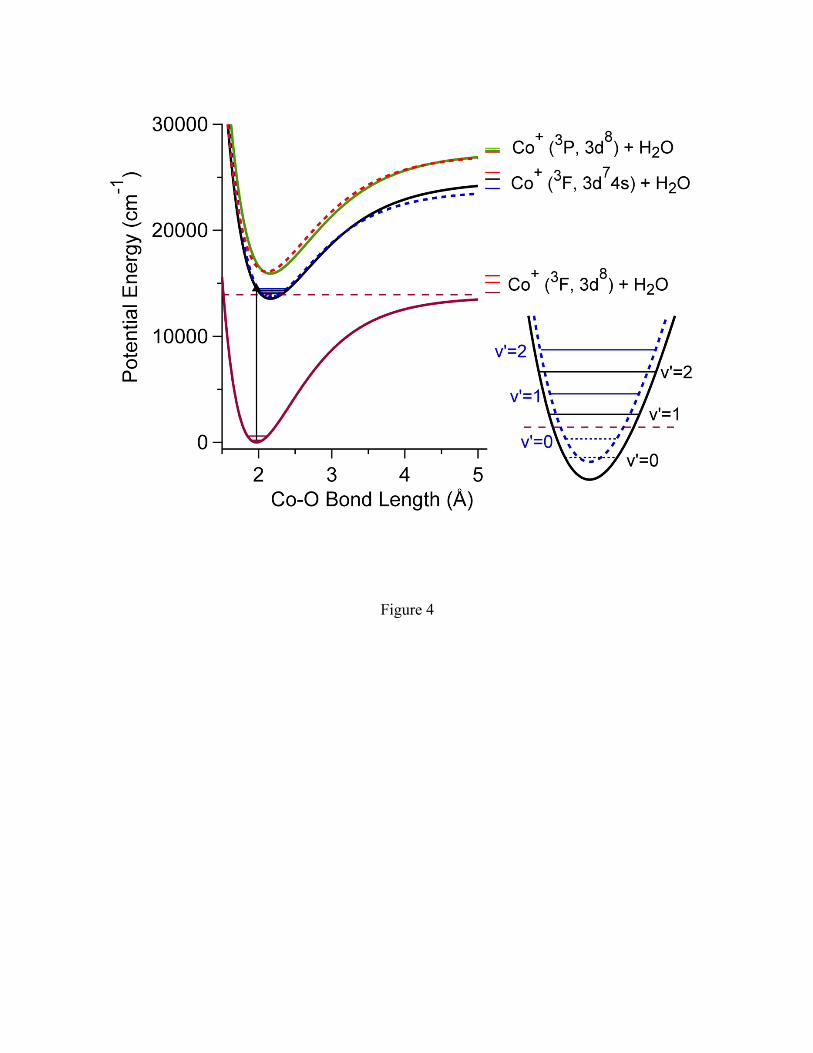
Figure 4

Figure 5

Figure 6
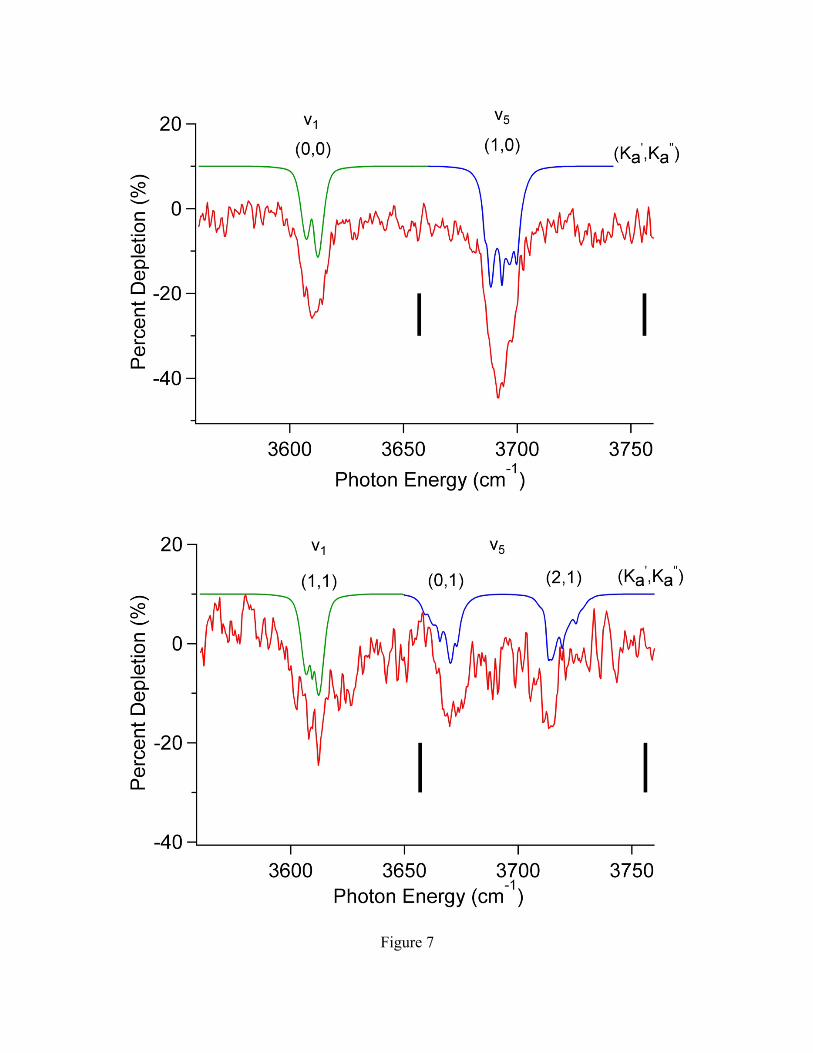
Figure 7

Figure for graphical abstract

Figure S1. Overlapped photodissociation spectrum of Co+(H2O), highlighting the rotational structure in band C with v3’=0 to 5. The spacing between the (0,1) and (2,1) transitions drops with increasing Co-O stretch quantum number, which indicates a reduction in the excited state A’ rotational constants.

Figure S2. Vibrational spectrum of Co+(HOD) in the O-H stretching region. The spectrum is obtained by vibrationally mediated photodissociation, monitoring depletion in the Co+ photofragment produced by irradiation of the band C (v3’=4, Ka’=1) ! X 3B1 (v3”=0, Ka”=0) transition at 17139 cm-1. The simulated spectrum (shown in black) contains both parallel (shown in green) and perpendicular (shown in red) contributions. The simulation uses the following parameters, all in cm-1: !0=3650, A”=9.56, B”=0.272, C”=0.264, !!!!! =-3.5; A’=9.46, B’=0.272, C’=0.264, !!!! =-3.5. Only ! 0 and !!!!! =!!!! are adjusted in the fit. Rotational constants Ae, Be and Ce are from the CCSD(T)/aug-cc-pVTZ geometry are corrected by the change in the rotational constant due to zero point (to get ground state constants) and to OH stretch excitation (to get upper state constants) using anharmonic frequency calculations at the BHandHLYP/6-311++G(3df,p) level.
Recommended