The Business Case for Retail Media Networks Trends Report: September 2007
Amended March 2008 By:
Nikki Baird Managing Partner
Sponsored by:

Table of Contents
Executive Summary ..........................................................................................................................................i SECTION I: Overview...................................................................................................................................... 1
Why The Study Was Conducted ................................................................................................................ 1
Methodology ............................................................................................................................................. 1
Retail Panel ................................................................................................................................................ 1
SECTION II: Business Challenges..................................................................................................................... 3 Placing Digital Signage in Context.............................................................................................................. 3
Consumers are Harder to Reach................................................................................................................ 3
Manufacturers Turn to the Store............................................................................................................... 3
Retailers Seek Differentiation.................................................................................................................... 4
SECTION III: OPPORTUNITIES.......................................................................................................................... 5 Technology Plays an Inescapable Role ...................................................................................................... 5
How In‐Store Media Contributes to Sales ................................................................................................. 5
Turbo‐Charging Results: Value Accelerators ............................................................................................. 7
SECTION IV: Organizational Barriers............................................................................................................... 9 Cost ............................................................................................................................................................ 9
Risks ......................................................................................................................................................... 10
The Net Result ......................................................................................................................................... 12
SECTION VI: TECHNOLOGY ENABLERS ......................................................................................................... 14 Evolution, Not Revolution........................................................................................................................ 14
The Basics ................................................................................................................................................ 14
Advancing Past the Basics........................................................................................................................ 14
Beyond Advanced .................................................................................................................................... 14
SECTION VI: BootStrap Recommendations .................................................................................................. 15 Technology And The Buying Process ....................................................................................................... 15
Building An In‐Store Media Strategy ....................................................................................................... 15

Have Your Say .......................................................................................................................................... 16
APPENDIX A: The BOOT Methodology ...........................................................................................................a Appendix B: Hypothetical Retailer Example ................................................................................................... b APPENDIX C: About Our Sponsor....................................................................................................................c APPENDIX D: About RSR ................................................................................................................................ e

Figures
Figure 1: Promotion Contribution from Digital In‐Store Media ..................................................................... 6
Figure 2: Implementation and On‐going Cost Assumptions......................................................................... 10
Figure 3: Net Income Statement Impact of Digital In‐Store Media on Hypothetical Retailer ...................... 13

EXECUTIVE SUMMARY Retail media networks aren’t revolutionary, but do play an important part in a technology revolution that over time is significantly transforming how consumers engage with retailers. However, before that technology can get off the ground, retailers have to be able to understand the value that a retail media network can contribute to their business. This research aims to start that conversation by providing a hypothetical business case for a retail media network.
THE BUSINESS CHALLENGE Retail media networks sit at the heart of a convergence point. Consumers are harder to reach in the home, and manufacturers and retailers alike are seeking new ways to reach them. At the same time, consumers are increasingly accepting of technology as part of the shopping experience, giving retailers an opportunity to use both the efficiency and the leverage of technology to reach consumers more effectively. Retail media networks aren’t really revolutionary, but the convergence of all these factors – consumer, manufacturer, and retailer – together creates an environment where revolution is possible.
OPPORTUNITIES Retail media networks contribute to sales by moving the levers of impressions, awareness, and compliance to generate lift. Our retail interviewees supported a business case model that generated an additional 2% of revenue through the use of a retail media network. They also noted soft benefits from employee training, customer satisfaction, and ad revenue.
ORGANIZATIONAL BARRIERS AND HOW WINNERS OVERCOME THEM Cost and risk are the two biggest organizational barriers to implementation. The biggest cost is the hardware, and as with any in‐store implementation of technology, retailers continue to seek ways to minimize the lump‐sum impact. In one case, the retailer did so by aligning the roll‐out plan with store refreshes and new store openings. Risks that have the potential to send costs out of control or put benefits in question include risks from organizational ownership that crosses multiple departments, unanticipated costs from selling ad space, content risks (getting the content right and having enough content), and risks from a lack of measures.
Ultimately, the opportunities far outweigh the costs and risks. Our hypothetical business case showed a 1.1% increase in revenue and 5% increase in operating profit in the first year, and a 2.3% increase in revenue and 10.4% increase in operating profit in the second year.
TECHNOLOGY ENABLERS The technology to implement a retail media network is more advanced than retailers are capable of using today. To make the most of an implementation, retailers need to focus on enabling a flexible platform that will help them grow more sophisticated over time.
BOOTSTRAP RECOMMENDATIONS To get the most out of a retail media network implementation, make sure your network goals match up with your customers’ buying process. Identify the key customer segments you are trying to reach through a retail media network, and identify the buying process those segments follow. Then identify where in‐store media fits into that process – design solutions around specific customer needs. Finally, measure the impact with a well‐defined measurement strategy.

SECTION I: OVERVIEW
WHY THE STUDY WAS CONDUCTED Retailers are a cautious bunch – a technology needs to be proven before it can make any headway in terms of adoption. A classic example: retail media networks (RMN).1 This technology has emerged as a viable affordable technology within the past ten years. But while some retailers have successfully deployed RMN’s, overall adoption within the industry still remains low. A critical success factor for the technology is customer and employee response to the medium’s presence in stores – a key factor driving the return on investment in RMN’s – and for most retailers, the jury is still out.
With more than three years of pilots, rollouts, and case studies available, the industry has finally begun to accumulate the data needed to overcome doubts and objections, but a definitive business case for RMN’s – one focused on those retailers who lack a natural base of advertisers to fund a network, and face the daunting prospect of installing thousands of dollars of equipment in each and every store – is still lacking. The objective of this research is to define a methodology and create specific metrics around what the financial opportunity, or business case, really can be.
METHODOLOGY Everyone knows that getting retailers to talk about the business case for any technology solution is challenging. Results are jealously guarded – and the more successful the results, the more jealously they are protected. Sarbanes‐Oxley and mass media factoids have only upped the challenge quotient. Even retail practitioners that are willing to talk find themselves gagged by PR department concerns about Sarbanes‐Oxley or that one misquoted figure that lives on in the press.
To get around these constraints, RSR developed a unique approach to outline the business case for retail media networks – an objective mathematical model, based on retailer experience. We interviewed a select set of retail practitioners to gain their insights into selecting, implementing, and maintaining a digital in‐store media network. We also scoured more than three years of research, articles, case studies, and presentations for results that could be applied to non‐ad‐supported networks. We used these resources as inputs, developed a hypothetical business case for a 500‐store retailer, and then asked our volunteer retail practitioners to review and comment on the business case – to identify where the business case was optimistic or conservative and to validate that the results were reasonable. This document and its accompanying spreadsheet is the result (see Appendix B).
RETAIL PANEL We interviewed three retailers.
1 This technology has been called many things – digital signage, in‐store media, digital media networks. We have chosen to use the term “Retail Media Networks”, a phrase coined by Laura Davis‐Taylor of Retail Media Consulting. It encompasses the critical aspects of the technology – retail‐specific, media‐based, and networked.
1

• Retailer #1, anonymous, is a specialty retailer in the media and entertainment vertical. This retailer is in the process of rolling out digital signs after a 6 month pilot test. The displays are in the front of the store and behind the cash registers, averaging 4 screens per store with no sound and a 30‐minute loop (content may repeat within the loop). Content is all self‐branded, with no paid advertisers, though the retailer has begun to tie promotions on the digital signage network into promotion strategies developed with suppliers. The business is title‐ and new release‐driven, so content focuses most on making consumers aware of new releases and future release dates. A few minutes in every loop are dedicated to promoting local events. There is very little video – content is mostly animation of what would have been static signs in the past. We interviewed the merchandise manager who was the main business contact for the digital signage implementation.
• Retailer #2, anonymous, is a small format specialty retailer with less than 100 stores. The retailer sells gifts, clothing, and some home accessories, all private label merchandise developed exclusively for the retailer. The company has completed its rollout of an average of 2 digital signs per store, placed within line of sight of the front of the store, located in proximity to merchandise displays, rather than check‐out stands. The content features a mix of video and animation of static signs, and is exclusive to the retailer’s brand and products. The one hour loop with low, directional sound offers 2 minute segments on lifestyle content consistent with the retailer’s brand, interspersed with promotions, local events, and brand‐building content (content may repeat within the loop). We interviewed the marketing director in charge of content.
• Retailer #3 is UPS Canada, the main franchisor for UPS retail locations within Canada. As a franchisor, the retailer had the additional challenge of having to convince franchisees to pay for and install the digital signs out of their own pockets. Stores average about 1 sign per store, with approximately 100 of the chain’s 300 stores rolled out. Signs are placed near the checkout, but not behind the cash registers, so that the sign can serve both as a way to reduce perceived wait time and as a way to engage shoppers entering the store. Content consists of a 2‐3 minute loop, with standard promotional spots and opportunities for franchisees to customize their playlist from a library of content. Because the loop is so short, the retailer opted for no sound for employees’ sakes. We interviewed the COO, Malcolm Houser.
2

SECTION II: BUSINESS CHALLENGES
PLACING DIGITAL SIGNAGE IN CONTEXT Retail media networks sit at the heart of a convergence point. Consumers are increasingly comfortable with technology as part of the shopping experience, as their adoption and continued use of self‐checkout demonstrates. And right as they are more tolerant of technology’s presence in stores, fragmented reach and the high cost of traditional media are driving brand owners – manufacturers and retailers alike – to look for new ways to reach consumers. Retail media networks aren’t really revolutionary, but the convergence of all these factors – consumer, manufacturer, and retailer – together creates an environment where revolution is possible.
CONSUMERS ARE HARDER TO REACH Consumers are increasingly distracted in the home. Studies have consistently shown that as internet and broadband enter the home, consumers increasingly divide their attention between multiple media outlets at the same time. For example, a survey of consumers by BIGresearch found that nearly 40% of consumers regularly browsed online while watching TV2
As the number of simultaneous activities increase, and the time spent doing each one individually decreases, advertisers’ ability to influence consumers in the home becomes more difficult. The well‐documented decline of TV advertising recall over the years, combined with fragmented audiences as consumers adjust to more media choices, leads to a consumer audience that is increasingly difficult to reach in the home.
MANUFACTURERS TURN TO THE STORE Manufacturers are well aware that the advertising future does not lie with traditional media. A study conducted by Forrester Network in July of 2006 found that 69% of its advertiser respondents believe the effectiveness of TV advertising is declining, and 60% are very actively looking for alternatives.3
Manufacturers are putting their money where their mouths are ‐ this decade has seen the beginning of major advertising budget reallocations as manufacturers begin to shift funds away from traditional media. According to the Wall Street Journal, Proctor &Gamble cut their cable advertising commitments in 2005 by 25%, and broadcast advertising commitments by 5% ‐ within an ad budget that rose incrementally.4
Forrester Network’s survey found that 72% of the advertisers it surveyed were looking to in‐store media
2 BIGresearch, December 2006 for 15,167 US adults, compiled by Ad Age 2007 FactPack, “Digital Marketing and Media”
3 “If Not TV…?”, an online survey conducted by the Partnering Group and Forrester Networks in July, 2006. For more information about this survey, see http://www.reveries.com/reverb/research/not_tv/
4 “Shelf Promotion: In a Shift, Marketers Beef Up Ad Spending Inside Stores”, Emily Nelson and Sarah Ellison, The Wall Street Journal, September 21, 2005.
3

as an alternative to traditional advertising, 50% rated in‐store advertising’s overall effectiveness as excellent or very good, and 54% would increase their in‐store budget at the expense of TV.5
RETAILERS SEEK DIFFERENTIATION Retailers are laser‐focused on providing a high‐quality, differentiated experience to their customers: our research shows that customer complaints about their in‐store experience is retailers’ number one concern, with 84% of respondents rating it an influential challenge.6 RMN’s offers the potential to improve that experience through targeted messaging and timely product information delivered at the shelf.
Retailers’ business challenges are similar to those of manufacturers. While this analysis does not focus on the value derived from ad‐supported networks, manufacturers who are paying and playing on ad‐supported networks have important lessons to offer. Manufacturers are driving three trends retailers need to keep in mind: one, that the store plays an important role in reaching consumers; two, that more money is headed toward in‐store advertising now and increasingly in the future; and three, that management of in‐store media content, profits and costs cross organizational boundaries, and is bound to cause strife without clear organizational ownership and boundaries.
Our interviewees confirm these challenges. Across the three participating retailers, not one owner comes from the same organization – one retailer manages their in‐store media through the merchandising department, one through marketing, and one through store operations. In one case, the retailer is actively seeking content from suppliers, but all three retailers expressed how important it is to maintain control over the content – none of them are soliciting advertising dollars from their suppliers, though two have been approached by suppliers interested in advertising on their network.
5 “If Not TV…?”, an online survey conducted by the Partnering Group and Forrester Networks in July, 2006. For more information about this survey, see http://www.reveries.com/reverb/research/not_tv/
6 Technology‐Enabled Customer Centricity in the Store, a Benchmark Research Report, Paula Rosenblum, RSR Research, January 2007.
4
SECTION III: OPPORTUNITIES
TECHNOLOGY PLAYS AN INESCAPABLE ROLE Retailers are historically loathe to implement technology, especially in the store where the distributed nature of the retail business makes implementation long and technology support difficult and expensive. However the rate of consumer technology adoption and the increased need for technology’s combination of scale and leverage is forcing a change of heart – helped along by technology innovations that make it easier and faster to deploy in‐store technology, and cheaper to support it. Our research shows that Retail Winners (those that outperform their peers) in particular have realized the value of in‐store technology. In a recent survey, 90% of Retail Winners said that their top opportunity for improving the in‐store experience is through technology to empower and educate in‐store employees. “Adding self‐service customer‐facing technologies” follows close behind, with 85% of respondents, identifying it as a key opportunity.7 RMN’s play an important role in meeting both of these objectives.
HOW IN‐STORE MEDIA CONTRIBUTES TO SALES The main driver of value behind digital in‐store media is the concept of “recency”. It’s not just how often a consumer sees an ad that matters (frequency), it’s how long from when they last saw the ad to the point where they know they “need” a product – how “recently” they saw the ad – that counts.
This is partly why ad recall rates from in‐home media are so miserable (some estimates put it at less than 25% and still falling), and partly why recall of ads seen in stores is so high – Wal‐Mart TV has achieved at least double that level of recall in multiple Nielsen Media Research studies. How much more “primed to buy” can a consumer be than when they are standing at the shelf?
Ultimately, in‐store media contributes to in‐store sales through a relatively simple formula:
Impressions X Awareness X Compliance = Lift = Revenue
This works whether you are talking about an ad‐supported model or an in‐house model. Whether someone else is paying for the ad, or you are, the objective is to drive revenue by using a retail media network to pull on the levers of impressions, awareness, and compliance.
So what kinds of results are possible? Let’s walk through a hypothetical example (see Appendix B for detailed assumptions about the hypothetical retailer characteristics, and see the spreadsheet accompanying this research for detailed calculations).
• Assumption: 15% incremental lift from products promoted on an in‐store network.
Multiple studies have shown that items promoted on an in‐store network achieve incremental lift over and above the same items in stores that don’t have an in‐store network (whether on promotion through other means – circulars, signage, etc. – or not). Benefits have varied widely – from 10‐60%, depending on who you ask. Our retail interviewees agreed that 20% is a fair representation of product lift attributable to
7 Technology‐Enabled Customer Centricity in the Store, a Benchmark Research Report, Paula Rosenblum, RSR Research, January 2007.
5

the use of digital signage. One retailer has not yet measured the lift associated with items promoted on the in‐store displays, one retailer confirmed 20%, and one retailer estimated that it was closer to 30%. To stay conservative, we used 15%.
• Assumption: 10% incremental lift from improved display compliance.
The retailers we interviewed did not explicitly look at the benefits from compliance improvements as part of their business case – more a reflection of the “invisible problem” of compliance than because they didn’t believe there would be benefits. One retailer estimated that the use of digital signs improved in‐store compliance for displays from a base of 75% to an average of 95%, but could not estimate the impact such compliance had on the promotion itself. To be conservative, we used an estimate of 10% ‐ half of the potential impact that compliance could have, according to one retailer, and in line with other studies that have shown that display compliance can lead to a minimum of a 10% boost in sales.8
• Assumption: The percent of SKUs on promotion make up roughly the same percentage of a transaction.
In other words, if 10% of SKUs are being promoted in a store during a week on average, then 10% of the average transaction value is made up of promoted SKUs. This is actually a highly conservative assumption. One interviewee felt that the proportion of promoted items in their average transaction value was closer to 30%.
With these assumptions in place for a 500 store chain with $2B in revenue, an average transaction value of $11.57 and 8% of SKUs on promotion per week, a digital in‐store network contributes $40M or 2% of sales to the top line (see Figure 1).9
Figure 1: Promotion Contribution from Digital In-Store Media
Lift Calculation: Promotion Contributions
Average Transaction Size $ 11.57
Average Number of Transactions per week 3,324,247
Percent of average transaction from promo items 8%
$ Value of average transaction from promo items $ 0.93
Lift from In‐store media 15%
$ value of in‐store media lift $ 0.14
Lift from compliance 10%
8 “Using Technology to Improve In‐Store Marketing”, Jim Brennan and Scott Liles, The McKinsey Quarterly, April 2007.
9 For a detailed description of the assumptions used for our hypothetical retailer, see Appendix B.
6

$ value of compliance lift $ 0.09
Total $ of lift $ 0.23
New average transaction value $ 11.80
New revenue $ 2,040,000,000
Contribution to revenue $ 40,000,000
% increase in revenue 2.0%
This result is consistent with the findings of our interviewees. UPS Canada reported an increase of over 2.5% in revenue in stores with the displays over stores without them.
TURBO‐CHARGING RESULTS: VALUE ACCELERATORS Direct revenue‐generating results provide the foundation for the business case, while softer benefits like brand building helped speed the decision process, according to our retail participants. In building their own business cases, our interview participants did not focus exclusively on the “hard” benefits of revenue – though one participant did note that their company examined and approved the implementation based on the direct revenue‐generating benefits alone. In all three cases, the retailers noted that internal buy‐in to the concept of building the brand through RMN’s helped move them through the decision‐making process faster. The “softer” benefits considered by participants included:
Employee Training Benefits: The impact of digital signage on employees is impressive. In CompUSA’s pilot, where nearly 200 stores – half with and half without digital signs – were studied, employees’ recall of both brands and important selling points of those brands improved significantly in the stores with digital signage over those without. Employees’ unaided recall of brands advertised on the in‐store network was 23% greater than control stores, and they were 32% more likely to recommend brands advertised on the network to customers. 10
Interview respondents agreed. While they had not measured the extent of this benefit, they did feel that employees became better educated. Two participants emphasized, however, that monitoring employee tolerance of the content plays a key role in ensuring that employees pay attention to and absorb it. UPS Canada used a short loop – 2‐3 minutes – because its customers weren’t in the store much longer than that, but chose not to use sound to reduce the “wear and tear” on employees. In the other case, the retailer did use sound, but employed a longer loop of content to reduce employee irritation with the displays.
All of the interviewees were also interested in the value of using the network to reach employees when the store is closed. They see this as an opportunity to help build employee loyalty and satisfaction. Using video‐based communication helps develop a stronger identification with the company brand. However, all
10 Results presented by George Ehinger of In‐Store Media Networks at the 2005 Digital Retailing Expo, on May 18, 2005.
7
interviewees also saw this as a far‐off opportunity – they are more focused on getting the promotional benefits out of their networks today and for the foreseeable future.
Customer Satisfaction: Measuring customer satisfaction as a result of an RMN is a tricky thing. When you ask consumers directly, they tend to be lukewarm about the concept, expressing dismay that obnoxious ads are following them into yet new territory. The reality, however, is different. In the right context, consumers perceive an enhanced shopping experience – or at a minimum, a reduced wait time when standing in line.
The key is “the right context.” In CompUSA’s case, the use of in‐store media was seen by customers as highly complementary to an image of “techno‐savvy” critical to a consumer electronics retailer – consumer surveys revealed an overall better impression of the test stores than the control stores, without being able to pinpoint the exact source. This doesn’t necessarily translate well to other categories. One retail participant agreed – as a specialty retailer that does not provide consumer electronics, they did not believe that having the signs contributed any environmentally‐driven brand element, but they did note that when traffic was slow, consumers tended to linger longer in the stores with in‐store media, as if reassured by or more comfortable with the sound and motion of the screens.
In the case of UPS Canada, store managers and franchise owners shared anecdotes of customers offering unsolicited positive feedback about the content of the signs – that they had been made aware of services and offerings they had not known UPS provided.
Ad Revenue: While ad revenue provides an opportunity for direct benefit, it is potentially the least reliable source of revenue for those without a naturally large base of advertisers. In order to get ad rates that make the cost of selling, certifying, and managing ad space affordable, retailers need to have critical mass of some segment’s “eyeballs.” Wal‐Mart – who, according to USA Today, had 140 advertisers on its network by the first half of 2007 – is the exception, not the rule.11 Case studies and our interviewees offer two pieces of advice. First, make sure that the weight of the retailer is behind the ad sales – for example, expect to have to “volunteer” some time, perhaps in conjunction with a trade promotion, in order to get potential advertisers interested and prove the value of the space.
Interviewees also felt strongly that selling spots to advertisers of complementary brands – products and services that are not carried in the store – is risky, and may ultimately be self‐defeating. As one participant noted, “They’re in my store – why would I want to use their time and attention selling them something else?” Another participant said, “Just as with in‐store radio, half the point of digital signage is to control the content, so that I’m not playing competitors’ ads in my store. Ultimately, I’m competing with share of wallet against every retailer. The last thing I would want to do is bring another brand’s messages in to play on my signs.”
11 “Wal‐Mart takes in‐store TV to the next level”, Laura Petrecca, USA Today, March 28, 2007.
8
SECTION IV: ORGANIZATIONAL BARRIERS Along with proving out the benefits of a new medium, two other primary organizational barriers work against adoption of digital in‐store media: cost, and risk.
COST Hardware challenges are the biggest internal barrier to in‐store technology investments: 80% of respondents to our survey on in‐store technology ranked it as an influential challenge, making it the highest ranked challenge. 12 Durability of the devices is a serious concern as well.
For our retail interviewees, the costs varied widely, with the main drivers of cost being the number and size of screens, and whether the implementation required in‐store design or enclosure changes to accommodate the screens. In one case, the retailer redesigned a major merchandise wall in order to incorporate screens into the display. Across all our interviewees, the cost of the hardware (including player) to support one screen ranged from $3,000‐4,000. A retailer who did not participate in the full interview for this study spent the most: this retailer deployed an in‐store wireless network to support its digital signs, significantly upgrading its network and wireless security along with it, and estimated that the hardware costs ran nearly $10,000 per screen, averaging 3‐4 screens per location.
Retailers have high expectations about the life of the hardware they deploy in stores. POS systems are often pushed to last 7‐10 years, and it is not unheard of to find a retailer that has kept their POS hardware running for 15 years or longer. These expectations extend to retail media networks as well. While none of our interviewees expect their RMN hardware to last 15 years, most expected them to last a minimum of three years, and an average of about 5 years, and so have spread the costs of their investments accordingly. None of our interviewees have had their implementations running long enough to validate whether a five year assumption is reasonable, and one interviewee noted that the innovation he has seen in both players and screens – not to mention lower prices – makes him wonder if three years is a more reasonable assumption.
Our research into in‐store technology shows that retailers are increasingly seeking ways to spread out or offset the costs of in‐store technology investments, and experience shows that the wave of hardware replacement that took place in anticipation of Y2K has really increased retailers’ awareness of the problem caused by a consolidated “wave” of technology investment in stores. With retailers’ thin margins, it’s very hard to swallow a large capital investment that is lumped all in a single fiscal year. Retailers are increasingly looking for innovative ways to help avoid these lump sum investments. 13
This trend has not reached RMN’s quite yet, but interest is increasing. Of our participants, all took direct ownership of their media network, but all outsourced the development of content and employed some degree of managed services for bandwidth and network. Two of the three interviewees provided local control of content – within strict boundaries of approved content – over the internet, though none have hosted their content management systems.
12 Technology‐Enabled Customer Centricity in the Store, a Benchmark Research Report, Paula Rosenblum, RSR Research, January 2007.
13 Ibid.
9

In one case, the retailer charged back the cost of managing the network, hosting the software, funding content, and maintaining the hardware back to stores. This charge ran $50‐60/month per store. The retailer commented that they chose to create many inexpensive spots in order to build up a library of content quickly, with the intent of adding higher quality spots over time once the stores have paid back the initial investment in content through their monthly management fee.
For our hypothetical retailer’s business case, we assumed an implementation of 2 screens per store (see Figure 2). Hardware costs per screen include the labor costs of installing the screen, any enclosure or mounting, and any supporting hardware, for example, a player or wiring in the store.
Figure 2: Implementation and On-going Cost Assumptions
Number of screens per store 2
One‐time hardware cost per screen $ 4,000
Per screen managed service cost $ 60
Managed services setup fees $ 100,000
Number of months to full rollout 12
Additional bandwidth cost per store per month $ 50
Yearly investment in content $ 500,000
One of the participants developed an implementation plan that tracked with store remodels, in order to build some of the screen provisioning needs – power and connectivity in particular – into the new store design. This saved the retailer some implementation costs, but means a longer timeline to get all screens up and running.
None of our interviewees required additional bandwidth to stores to support their RMN implementations, but to be conservative we included costs for that eventuality. Because all of our interviewees had outsourced content creation, we were not able to get a good estimate for those costs, so we followed the “managed service” charge‐back to stores that one of our interviewees had adopted as a way to capture the software, content, and maintenance support costs on a per store basis.
In pulling together the business case, we added new stores quarterly, and assumed the expenses (including expensed capital outlay) came the quarter before the stores were up and running, and that the benefits began the quarter after. We also assumed that any ad revenue would not start until the first year that all stores were implemented (see the spreadsheet for the full calculation and timing of costs and benefits).
RISKS There are two kinds of risks to any implementation: the kind you can’t manage, and the kind you can. The risks that you can manage, if managed well, ensure that you maximize your benefits while minimizing
10

your costs, and if unmanaged, put those benefits at risk, while escalating the costs. Our participants and research identified four major risks that retailers should be aware of – and actively manage – when pursuing an RMN implementation.
Organizational Ownership: None of our interviewees had issues with ownership, but two made specific efforts to minimize in‐fighting over ownership of the network by creating cross‐functional executive committees that were the project owners. There still appears to be a lot of variability in terms of who actually operates and manages the day‐to‐day of retail media networks. Among our three interviewees, ownership crossed merchandising, marketing, and operations. Ultimately, it doesn’t matter who owns the network – as long as that ownership is clear and enforced, and recognizes the needs of the various constituents who have a stake in a retail media network implementation.
Ad Sales: If a retailer pursues revenue from selling ad space on their RMN, they must account for the cost of selling that ad space in their revenue calculations. Ads don’t sell themselves, and either through give‐backs in bundling ad space with trade promotions, or through specific headcount or commission costs associated with selling ad space, there will be some “costs of sales” that come with ad revenue.
Content: There are a lot of risks around content, and many of them come from having to adapt content to a new medium. Content needs to be the right length for the audience and the environment – if the screen is facing a queue, longer content is a good choice, vs. shorter content needed for a screen in the middle of an aisle. It depends greatly on what a shopper is doing when he or she sees the screen, the field of view for a particular screen, and where the screen appears in the course of a shopper’s buying process. For example, one interviewee balanced flashy, short content that was visible from outside the store and designed to bring a consumer into the store with longer content that fit with browsing shoppers’ needs once they were in the store, because their sign placement meant the screen served both purposes.
Another interviewee deliberately stayed away from screen placement near checkout because he was concerned that it was too late in the buying process to have influence – if the consumer is already at the register, or deep in line at the register, odds are they won’t leave the line because they were inspired by an ad. However, even though all interviewees emphasized that a specific ad must have a strong call to action or a very clear objective, they also all used their in‐store networks to promote non‐promotional aspects of their companies. One interviewee focused on lifestyle elements of their brand, promoting the images that they felt their customers would identify with, while another focused on the community aspects of their company, making their customers aware of their charity works and contributions.
Getting the spot wrong means that the lift from your RMN will not reach planned levels. Getting the loop wrong means potentially irritating both customers and employees. Your decision on how long a loop should be and how many times it will run in a day should be balanced against both constituents. You don’t want a loop so short that it irritates both groups, but you also just plain won’t have enough content to cover only 1‐2 loops per day. One interviewee opted for a short loop – just 2‐3 minutes, but implemented with no sound in order to avoid irritating employees. In an early example of in‐store digital signage (though at the time it was not networked), Blockbuster had to increase the length of its loops from one hour to two, specifically in order to increase employee acceptance. A display has no chance of impacting sales or customer satisfaction if it’s off.
All of our interviewees operate one loop, and one loop only, with no segmentation or day‐parting. And all interviewees rotate their content monthly on average, though as noted earlier, two give store managers
11

control over the play list (within boundaries), so that the list could potentially vary as often as a store manager is willing to tweak it.
Measurement. Tied to content risks are the very significant risks coming from a retailer’s measurement strategy – or lack thereof. Measuring the impact of RMN’s is extremely tricky. As one interviewee said, “I don’t know if the digital signs were directly responsible for my revenue benefits or if there was something else going on too. All I know for sure is that revenue at stores with the signs was higher than at the stores without the signs.”
A lack of measures ‐ and a lack of measurement strategy ‐ is a significant risk, and still part of a major barrier to investment in RMN’s today. Forty‐seven percent of respondents in the Forrester Networks study said that a limitation of retail media is that it’s not any easier to measure than TV.14 Of our interviewees, only one measured promotional lift on specific items featured on the network in a test/control environment. The other two interviewees only looked at gross impact on store sales.
In‐store measurement is a problem for more than just RMN’s. According to study of UK brands and retailers, conducted by in 2006, only 23% measured the ROI of in‐store marketing.15 In‐store, whether marketing or media, has been something of a neglected opportunity within the marketing portfolio. As more attention turns to the opportunities of in‐store, as with any new process or process improvement, if you don’t measure it, you won’t know whether you made a difference.
THE NET RESULT Benefits, costs, and risks came together to yield significant top and bottom line impact to our hypothetical retailer (see Figure 3). We spread the timing of both benefits and costs across the first two years of implementation, assuming that the implementation would be completed in the first year, that the full benefits from the implementation would not come until the second year, and that the effective life of the technology was only three years (see Appendix B and accompanying spreadsheet for more details). Even with conservative assumptions, the business case resulted in a 1.1% increase in revenue and 1.5% increase in operating profit in the first year, and a 2.3% increase in revenue and 3.6% increase in operating profit in the second year.
14 “If Not TV…?”, an online survey conducted by the Partnering Group and Forrester Networks in July, 2006. For more information about this survey, see http://www.reveries.com/reverb/research/not_tv/
15 “POP Rights”, a survey conducted by bezier, March 2006.
12
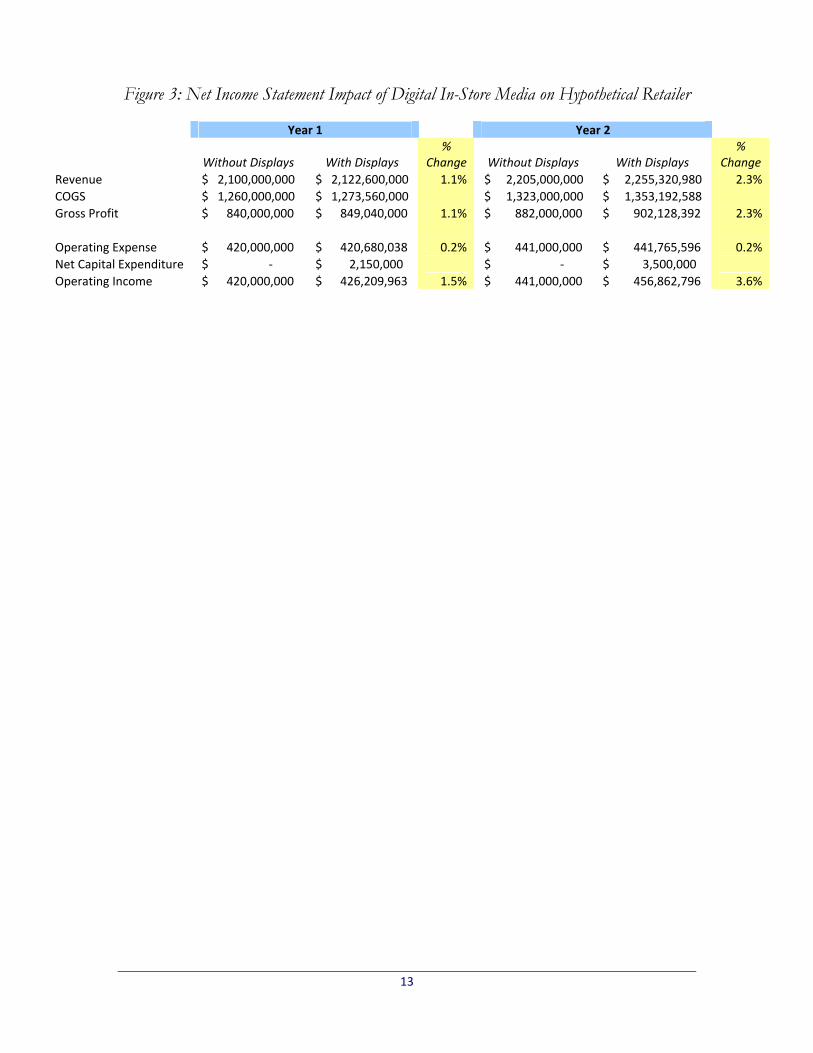
Figure 3: Net Income Statement Impact of Digital In-Store Media on Hypothetical Retailer
Year 1 Year 2
Without Displays With Displays %
Change Without Displays With Displays %
Change Revenue $ 2,100,000,000 $ 2,122,600,000 1.1% $ 2,205,000,000 $ 2,255,320,980 2.3% COGS $ 1,260,000,000 $ 1,273,560,000 $ 1,323,000,000 $ 1,353,192,588 Gross Profit $ 840,000,000 $ 849,040,000 1.1% $ 882,000,000 $ 902,128,392 2.3% Operating Expense $ 420,000,000 $ 420,680,038 0.2% $ 441,000,000 $ 441,765,596 0.2% Net Capital Expenditure $ ‐ $ 2,150,000 $ ‐ $ 3,500,000 Operating Income $ 420,000,000 $ 426,209,963 1.5% $ 441,000,000 $ 456,862,796 3.6%
13

SECTION VI: TECHNOLOGY ENABLERS
EVOLUTION, NOT REVOLUTION The technology capabilities to support RMN’s are way ahead of most businesses’ ability to take advantage of them. This means that anyone embarking on an RMN deployment needs to have very specific goals and objectives – and stick to them. Laying a strong foundation today means more flexibility to adapt and evolve in the future.
THE BASICS A first generation retail media network implementation needs to focus on the basics: the in‐store hardware configuration to store and display in‐store media; the network to deliver content and ensure that screens are on, working, and playing the right content; and the content management to enable basic play list creation and management as well as serve as the foundation for building larger content libraries in the future.
There won’t be enough content to do anything fancier, and it will be critically important to monitor the in‐store hardware to make sure that the screens are playing what they should be playing (and that someone hasn’t turned a screen off).
Two of our interviewees also shared that they ran into unexpected complications around bandwidth – not at the stores, but at the enterprise. Trying to distribute the same content across a large number of stores became problematic for the network “pipe” coming out of the enterprise, and had to be re‐evaluated.
ADVANCING PAST THE BASICS When there is enough content to support it, the next phase of technology capability will be around segmentation and day‐parting. Also, integration to other systems will help automate play list creation, enabling analytics‐based customization of play lists by store. While integration to other systems – for example, marketing automation or point of sale – is minimal today, as segmentation and day‐parting become more complex, they will play an important role in enabling granularity in targeting. For example, integration to POS can be used to prevent the display of an ad for a product that is out of stock in the store.
BEYOND ADVANCED RMN’s ultimately are headed for interactive and personalized experiences in stores. Interactive media will become an important component if only to help boost the ability to measure response rates to in‐store media. Not every ad or promotion will need to be interactive, but as other technologies are deployed in‐store, a convergence between the roles different types of screens play will mean that companies looking at in‐store media today will need to consider the role that interactivity may play in the future. For example, a kiosk may not be a “kiosk” 100% of the time, but may very well become part of the retail media network when the kiosk is not in use.
The more flexible the infrastructure is today, the more likely you will be able to evolve your capabilities as retail media networks mature.
14
SECTION VI: BOOTSTRAP RECOMMENDATIONS
TECHNOLOGY AND THE BUYING PROCESS The biggest driver behind the success or failure of RMN’s is how customers and employees respond to its presence in stores. The biggest challenge for retailers will be to figure out where in‐store media really fits. The closer they get to the right place and the right time, the more likely in‐store media – whatever the business case – will be successful.
The right place and the right time mean understanding the consumer’s buying process and determining the role that RMN’s can play in the buying process. For example, a retailer implementing an in‐store kiosk with an interactive gift finder was finding acceptance of the kiosk in stores to be much lower than expected. The retailer observed the use of the kiosk, and found as soon as a customer approached it, an employee would come up to them and ask them if they needed help. The customer would then shy away from the kiosk, and either engage with the employee, or, more often, would just leave. The retailer asked employees to wait until it appeared that the customer was done using the kiosk and then ask them if they needed help finding anything. When the employee waited to engage with the customer, kiosk usage was higher, and customers would more often engage with employees, asking them for help locating some of the gift ideas they had just found through the kiosk.
In‐store media operates on the same principle. It is too late in the buying process to advertise a new product when the consumer is waiting in line at the cash register. Conversely, advertising how the retailer contributes to the community is probably not the best use of a sign greeting customers as they come into the store.
BUILDING AN IN‐STORE MEDIA STRATEGY To get the most out of a retail media network implementation, make sure your network goals match up with your customers’ buying process:
• Identify key customer segments that you are trying to reach through in‐store media. Its effectiveness will not be the same across all customer segments, so focus on the ones that are most strategic to you.
• Identify the buying process those customer segments follow. This starts from the initial awareness of the need, all the way through post‐purchase use of the products your customers buy. Different segments will follow different processes. For example, one customer segment may use your stores as a showroom and buy primarily online. Another segment may use your online site to identify the specific brand they want to buy, and purchase in‐store.
• Identify where in‐store media fits into that process. For example, for the primarily online shopper who just comes into your stores to see the merchandise before buying online, digital in‐store media will probably play an information role – these customers are either selecting a specific brand and looking for information to help them decide, or are vetting a brand they’ve already selected to make sure it’s what they really want and are seeking information that helps them confirm they’ve made the right choice. For the shopper who primarily purchases in‐store, in‐store media serves more of a promotional or cross‐selling role. This shopper is in the store
15

because she already knows what she wants to buy – now you have an opportunity to make her aware of other things that may be of interest to her.
• Design in‐store media projects around customer needs. Like the interviewee who balanced their in‐store media across two objectives – attracting people into the store, and promoting and entertaining shoppers once they came in – it may be necessary to balance different needs from different segments. As long as you keep it simple, and stay focused on how in‐store media fits into the buying process, it will be hard to go wrong.
• Identify how you will measure success – and then measure it. Nothing can undermine your project faster than a lack of results! While measurement of in‐store media is still more art than science today, making the effort protects and supports your investment – and helps guide you in prioritizing how your retail media network will evolve.
HAVE YOUR SAY Retail media networks aren’t revolutionary, but they do play an important part in a technology revolution that over time is significantly transforming how consumers engage with retailers. This report is not intended to be the final say in the value that the medium contributes to that relationship – retail media networks and how consumers and retailers use them are still too much in their infancy for any business case to be definitive. It is intended, however, to get the conversation started, and to help that along, we have created a blog where you can contribute your own perspective on the business case for retail media networks. To participate, go to http://www.retailsystemsresearch.com/_blog/recent.
16

APPENDIX A: THE BOOT METHODOLOGY The “BOOT” methodology is designed to reveal and prioritize the following:
• Business Challenges – Retailers of all shapes and sizes face significant external challenges. These issues provide a business context for the subject being discussed and drive decision‐making across the enterprise.
• Opportunities – Every challenge brings with it a set of opportunities, or ways to change and overcome that challenge. The ways retailers turn business challenges into opportunities often define the difference between winners and “also‐rans”. Within the BOOT, we can also identify opportunities missed – and describe leading edge models we believe drive success.
• Organizational Inhibitors – Even as enterprises find opportunities to overcome their external challenges, they may find internal organizational inhibitors that keep them from executing on their vision. Opportunities can be found to overcome these inhibitors as well. Winning retailers understand their organizational inhibitors and find creative, effective ways to overcome them.
• Technology Enablers – If a company can overcome its organizational inhibitors it can use technology as an enabler to take advantage of the opportunities it identifies. Retail winners are most adept at judiciously and effectively using these enablers, often far earlier than their peers.
A graphical depiction of the BOOT follows:
a

APPENDIX B: HYPOTHETICAL RETAILER EXAMPLE In order to provide a base case for developing a business case for retail media networks, we started with a hypothetical retailer of 500 stores, with annual revenue of $2 billion. Assumptions used in the business case, for example, the number of stores, revenue, cost of goods sold as a percent of revenue, are variables that you can change to reflect your circumstances.
We based our assumptions and test case on a mid‐size retailer with large‐box specialty stores. Store size averages 30,000 square feet, and we assumed 5 screens per store, operating a single channel (i.e., no segmentation or day‐parting) and a single loop of 20 minutes – the assumed average dwell time of a customer. We assumed an average transaction value of $11.57, and that chain‐wide weekly foot traffic averaged approximately 450,000 people.
All of these are variables in the Excel spreadsheet that accompanies this report, and are available for you to change. If you are reading this report and do not have the spreadsheet, you can download it at www.rsrresearch.com.
To use the spreadsheet, begin with the “Start Here” tab, which describes each of the tabs in the spreadsheet, and how to use them. The spreadsheet is intended as a tool to facilitate discussion about the potential business case for a retail media network. It in no way replaces a retailer’s own due diligence about their specific circumstances.
If you have questions or comments about the assumptions or calculations in the business case, we encourage you to share them in a public format, using the blog we have set up for that purpose at http://www.retailsystemsresearch.com/_blog/recent, or by contacting the author directly: Nikki Baird, [email protected].
b

APPENDIX C: ABOUT OUR SPONSOR
Cisco is the worldwide leader in networking that transforms how people connect, communicate, and collaborate. The company’s technology is changing the nature of work and the way we live.
Founded in 1984, Cisco pioneered the development of Internet Protocol (IP)‐based networking technologies. This tradition continues with the development of routing, switching, and numerous advanced technologies: application networking services, home networking, hosted small‐business systems, security, storage area networking, unified communications, video systems, and wireless.
As an innovator in the communications and information technology industry, Cisco and its valued partners sell Cisco hardware, software, and services to businesses of all sizes, governments, service providers, and consumers.
Cisco offers a Digital Media System that is a comprehensive set of products for the creation, management and access of compelling digital media for digital signage and desktop video. With the Cisco Digital Media System, customers can easily connect and reach their customers, employees, or partners anywhere and at any time. Cisco's Digital Media System, gives retailers the flexibility to create customized digital signage screen layouts and provide flexible options for playback. Cisco also has a Desktop Video offering that enables live broadcasts and video‐on‐demand (VoD) sessions with the ability to manage audience questions and presentations.
An integral part of Cisco’s business strategy is strong corporate citizenship. Responsible business practices help ensure accountability, business sustainability, and commitment to environmentally conscious operations and products. Social investments built upon partnerships with local organizations positively impact recipient communities around the world. As an expression of the company’s values and beliefs, these activities are designed to build trust in Cisco and empower its employees.
c

d

APPENDIX D: ABOUT RSR
Retail Systems Research (“RSR”) is the only research company run by retailers for the retail industry. RSR provides insight into business and technology challenges facing the extended retail industry, and thought leadership and advice on navigating these challenges for specific companies and the industry at large. RSR’s services include benchmark reports covering the state of retailer technology adoption for topics ranging from merchandising and supply chain, store operations and workforce management, to customer‐facing and multi‐channel technologies. Custom research reports provide more in‐depth views into topics of industry interest, and advisory services help retailers and technology vendors make the most of the insights RSR provides. To learn more about RSR, visit www.rsrresearch.com.
Copyright© 2007 by Retail Systems Research LL
this document may be reproduced or transmpermission of the publisher. Contact rese
C • All rights reserved. No part of the contents ofitted in any form or by any means without the
[email protected] for more information.
e
Recommended