Testing the Effectiveness of Fish
Passage Solutions
December 2014
Horizons Report 2015/EXT1418
Envirolink 1510-HZLC113
Prepared for: Dr Jon Roygard December 2014 Science Manager Report No. 2015/EXT/1418 Horizons Regional Council ISBN 978-1-927259-09-2 Palmerston North Prepared by: National Institute of Water & Atmospheric Research Ltd Client Report No. HAM2014-117 P O Box 11115 Project ELF15204 Hamilton 3251 Author: Cindy Baker Phone no: +64 7 856 7026
CONTACT 24 hr Freephone 0508 800 800 [email protected] www.horizons.govt.nz
SERVICE CENTRES
Kairanga Cnr Rongotea and
Kairanga-Bunnythorpe Roads Palmerston North Marton Hammond Street Taumarunui 34 Maata Street
REGIONAL HOUSES
Palmerston North 11-15 Victoria Avenue Wanganui 181 Guyton Street
DEPOTS
Levin
11 Bruce Road Taihape Torere Road Ohotu Woodville 116 Vogel Street
POSTAL ADDRESS
Horizons Regional Council, Private Bag 11025, Manawatu Mail Centre, Palmerston North 4442 F 06 9522 929
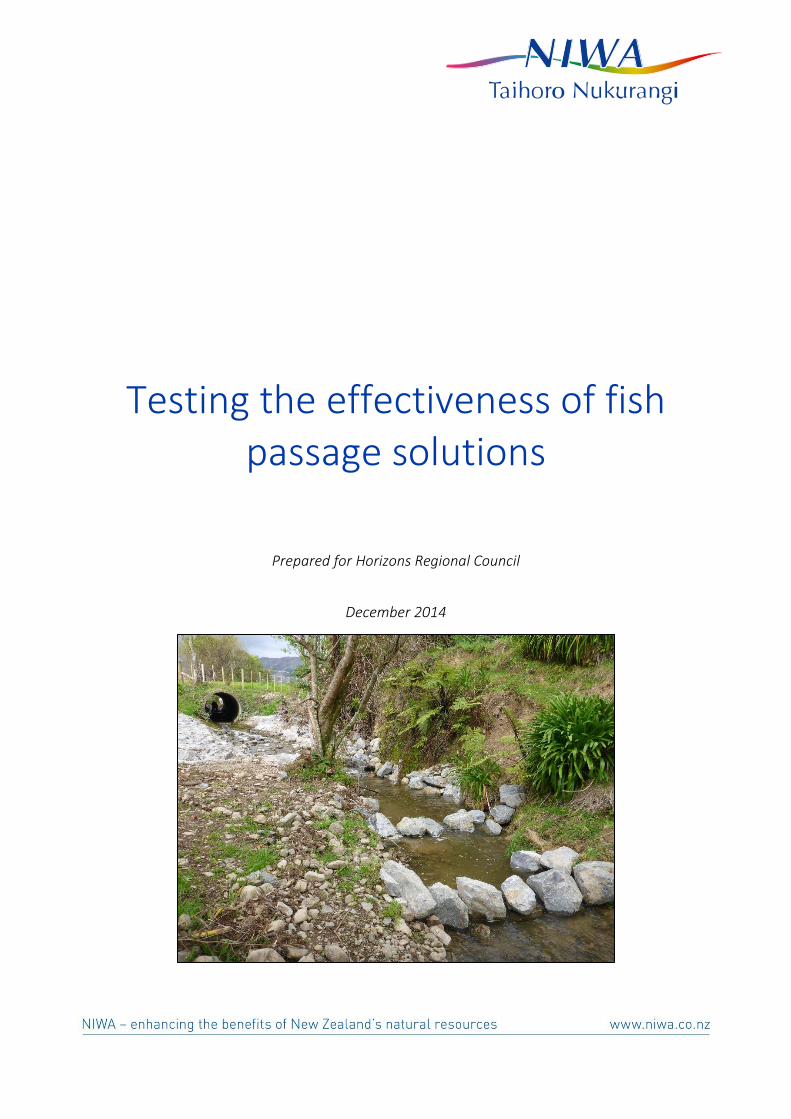
Testing the effectiveness of fish passage solutions
Prepared for Horizons Regional Council
December 2014

© All rights reserved. This publication may not be reproduced or copied in any form without the permission of the copyright owner(s). Such permission is only to be given in accordance with the terms of the client’s contract with NIWA. This copyright extends to all forms of copying and any storage of material in any kind of information retrieval system.
Whilst NIWA has used all reasonable endeavours to ensure that the information contained in this document is accurate, NIWA does not give any express or implied warranty as to the completeness of the information contained herein, or that it will be suitable for any purpose(s) other than those specifically contemplated during the Project or agreed by NIWA and the Client.
Prepared by: Cindy Baker
For any information regarding this report please contact:
Cindy Baker Freshwater Fish Scientist Group Manager Freshwater Ecology +64-7-856 1774
National Institute of Water & Atmospheric Research Ltd
PO Box 11115
Hamilton 3251
Phone +64 7 856 7026
NIWA CLIENT REPORT No: HAM2014-117 Report date: December 2014 NIWA Project: ELF15204

Testing the effectiveness of fish passage solutions
Contents
1 Introduction ........................................................................................................................6
2 Retrofitting structures for fish passage .................................................................................7
3 Monitoring the effectiveness of fish passage solutions ..........................................................8
4 BACI survey .........................................................................................................................9
4.1 Methodology ....................................................................................................................... 9
4.2 Frequency and timing ........................................................................................................10
5 Mark & recapture study ..................................................................................................... 11
5.1 Target species ....................................................................................................................11
5.2 Fish capture and maintenance ..........................................................................................11
5.3 Fish marking procedure .....................................................................................................12
5.4 Timing ................................................................................................................................13
5.5 Trial design .........................................................................................................................14
5.6 Barricades ..........................................................................................................................15
5.7 Measurements ...................................................................................................................17
5.8 Trial length .........................................................................................................................17
5.9 Methodology .....................................................................................................................17
6 Mark & recapture case study: Upper Kingston .................................................................... 19
6.1 Introduction .......................................................................................................................19
6.2 Upper Kingston study description .....................................................................................19
6.3 Control fish .........................................................................................................................20
6.4 Trial 1: Rock-ramp + culvert (24 h) ....................................................................................21
6.5 Trial 2: Culvert only (20.5 h) ..............................................................................................24
6.6 Trial 3: Rock-ramp + mod apron + culvert (12 h) ...............................................................26
6.7 Retrofit options for Upper Kingston culvert apron ............................................................28
7 Conclusions and recommendations .................................................................................... 32
7.1 Recommendations for Upper Kingston .............................................................................32
8 Acknowledgements ........................................................................................................... 33
9 References ......................................................................................................................... 33
Appendix A Equipment for mark & recapture studies .................................................... 34
Testing the effectiveness of fish passage solutions
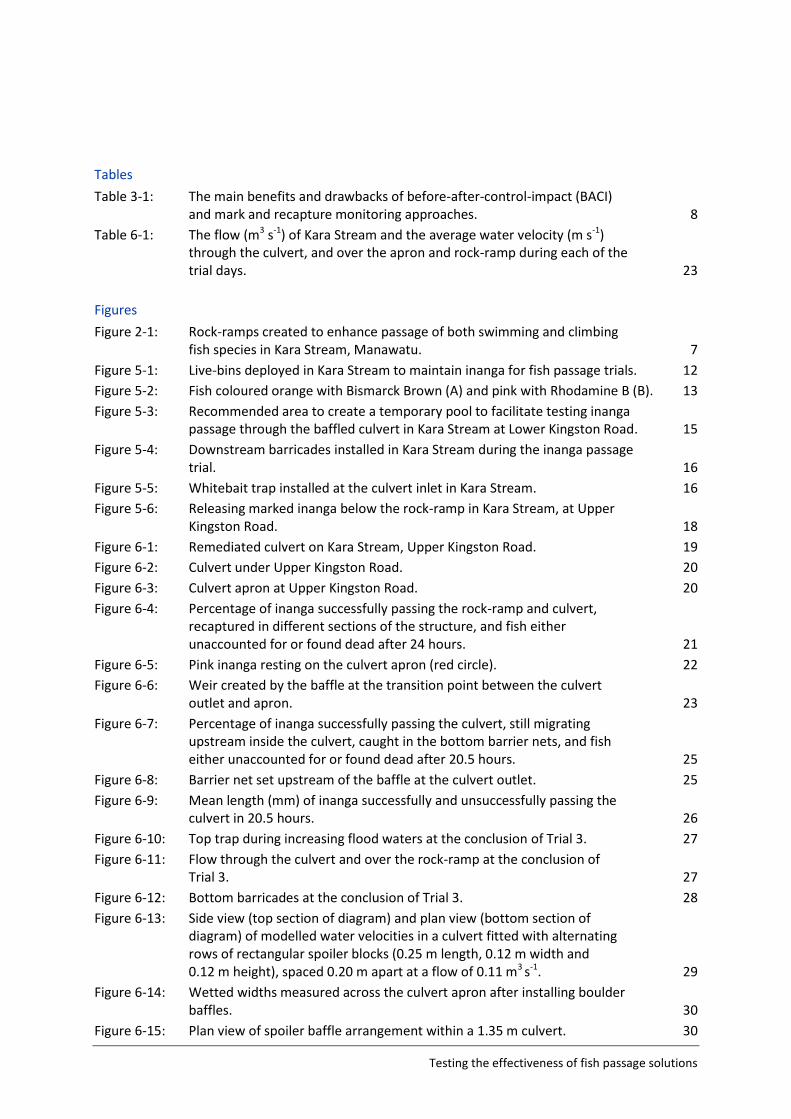
Tables
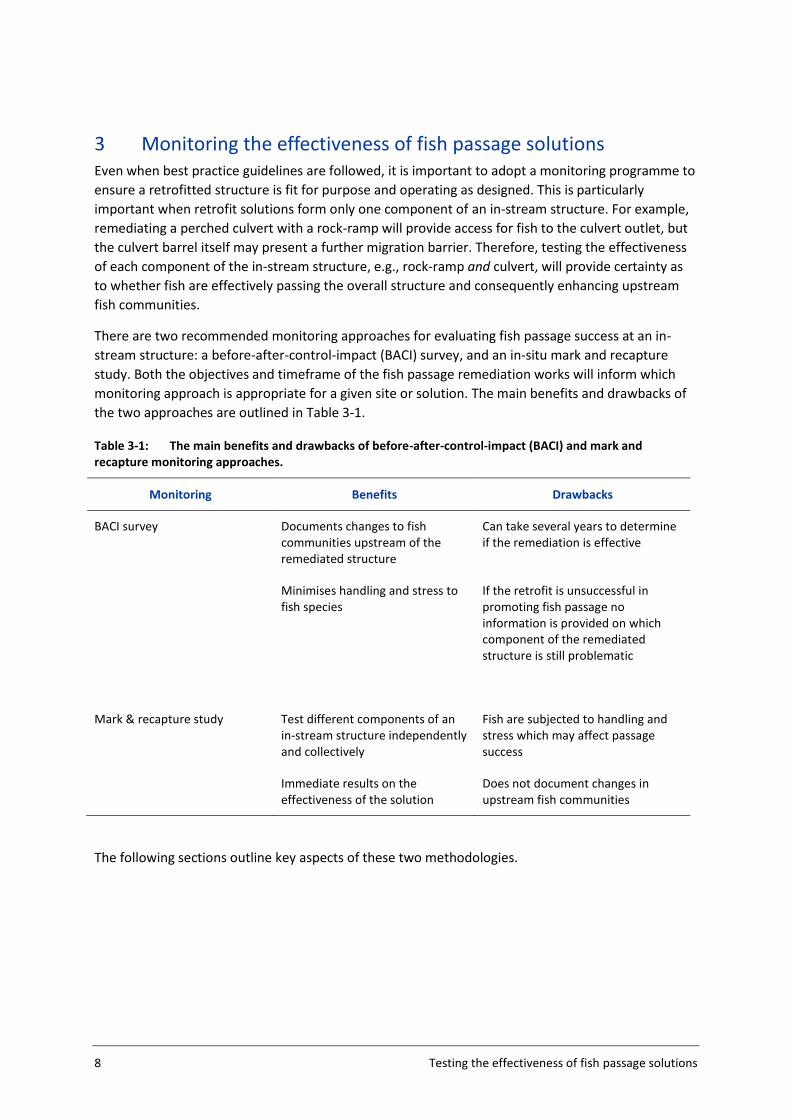
Table 3-1: The main benefits and drawbacks of before-after-control-impact (BACI) and mark and recapture monitoring approaches. 8
Table 6-1: The flow (m3 s-1) of Kara Stream and the average water velocity (m s-1) through the culvert, and over the apron and rock-ramp during each of the trial days. 23
Figures
Figure 2-1: Rock-ramps created to enhance passage of both swimming and climbing fish species in Kara Stream, Manawatu. 7
Figure 5-1: Live-bins deployed in Kara Stream to maintain inanga for fish passage trials. 12
Figure 5-2: Fish coloured orange with Bismarck Brown (A) and pink with Rhodamine B (B). 13
Figure 5-3: Recommended area to create a temporary pool to facilitate testing inanga passage through the baffled culvert in Kara Stream at Lower Kingston Road. 15
Figure 5-4: Downstream barricades installed in Kara Stream during the inanga passage trial. 16
Figure 5-5: Whitebait trap installed at the culvert inlet in Kara Stream. 16
Figure 5-6: Releasing marked inanga below the rock-ramp in Kara Stream, at Upper Kingston Road. 18
Figure 6-1: Remediated culvert on Kara Stream, Upper Kingston Road. 19
Figure 6-2: Culvert under Upper Kingston Road. 20
Figure 6-3: Culvert apron at Upper Kingston Road. 20
Figure 6-4: Percentage of inanga successfully passing the rock-ramp and culvert, recaptured in different sections of the structure, and fish either unaccounted for or found dead after 24 hours. 21
Figure 6-5: Pink inanga resting on the culvert apron (red circle). 22
Figure 6-6: Weir created by the baffle at the transition point between the culvert outlet and apron. 23
Figure 6-7: Percentage of inanga successfully passing the culvert, still migrating upstream inside the culvert, caught in the bottom barrier nets, and fish either unaccounted for or found dead after 20.5 hours. 25
Figure 6-8: Barrier net set upstream of the baffle at the culvert outlet. 25
Figure 6-9: Mean length (mm) of inanga successfully and unsuccessfully passing the culvert in 20.5 hours. 26
Figure 6-10: Top trap during increasing flood waters at the conclusion of Trial 3. 27
Figure 6-11: Flow through the culvert and over the rock-ramp at the conclusion of Trial 3. 27
Figure 6-12: Bottom barricades at the conclusion of Trial 3. 28
Figure 6-13: Side view (top section of diagram) and plan view (bottom section of diagram) of modelled water velocities in a culvert fitted with alternating rows of rectangular spoiler blocks (0.25 m length, 0.12 m width and 0.12 m height), spaced 0.20 m apart at a flow of 0.11 m3 s-1. 29
Figure 6-14: Wetted widths measured across the culvert apron after installing boulder baffles. 30
Figure 6-15: Plan view of spoiler baffle arrangement within a 1.35 m culvert. 30

Testing the effectiveness of fish passage solutions
Figure 6-16: Wooden spoiler baffles (0.25 m length, 0.12 m width and 0.12 m height) installed in a 1.3 m diameter culvert. 31
Reviewed by Approved for release by
Paul Franklin David Roper Formatting checked by

6 Testing the effectiveness of fish passage solutions
1 Introduction Many of the migratory fish species in New Zealand appear to be declining in both abundance and
distribution across their ranges (Goodman et al. 2014). Apart from the degradation of adult habitats,
one of the most significant causes of the decline in freshwater fish populations in New Zealand is the
construction of in-stream structures such as culverts, weirs and tide gates that prevent migratory fish
from accessing critical upstream habitats. As such, remediation of migration barriers to restore
longitudinal habitat connectivity and to re-establish fish populations is an integral component of river
restoration.
In the Manawatu Region, a series of perched culverts and weirs that are preventing or restricting fish
passage have been identified and prioritised for remediation. Significant investment is often required
to retrofit structures to promote fish passage, and therefore it is important to ensure that solutions
are likely to be effective in restoring passage for the target fish species. In this regard, any retrofit
solution that is being installed to restore fish passage at barriers requires robust and repeatable
testing to ensure it is fit for purpose prior to widespread installation.
This report describes methods suitable for evaluating the effectiveness of retrofit solutions for
enhancing fish passage. These methods can be used to ensure that solutions are fit for purpose and
fulfil objectives for improving upstream fish communities. This provides greater certainty for regional
councils and other land owners that their investments are optimised and are effective. A case study
is also presented of a site in the Manawatu Region where these methods have been applied. As trials
to test the effectiveness of retrofits at two further sites in the Manawatu Region are planned for
spring 2015, guidance and reference to applying methods at these sites is also provided.

Testing the effectiveness of fish passage solutions 7
2 Retrofitting structures for fish passage Retrofitting existing in-stream structures is the most cost-effective means to restoring habitat
connectivity for fish. However, to be effective at promoting fish passage, the retrofit implemented
needs to account for fish behaviour, fish swimming ability, the receiving environment and the
engineering constraints at each site. Each site’s suitability for fish passage should be assessed
according to the characteristics of the site and the type of fish passage problem that exists. As each
potential barrier is different, and the species to be catered for are not always the same, passage
solutions will tend to vary from site to site.
For streams prone to floods and erosion, such as many waterways in the Manawatu, back-filling the
weir or culvert outlet with rock and cement to create a rock-ramp can effectively promote passage of
both swimming and climbing fish species. This technique is advantageous for flashy dynamic streams
as the solution is long lasting and retains a natural look against the surrounding landscape. Presently,
rock-ramps have been retrofitted to perched culverts at two sites in Kara Stream (Figure 2-1), and
these fishways are planned to be installed at several other sites in the Manawatu Region.
Figure 2-1: Rock-ramps created to enhance passage of both swimming and climbing fish species in Kara Stream, Manawatu. A, Upper Kingston Road culvert before remediation. B, Upper Kingston Road culvert after remediation. C, Lower Kingston Road double culvert before remediation. D, Lower Kingston Road double culvert after remediation.
B D
A C
8 Testing the effectiveness of fish passage solutions
3 Monitoring the effectiveness of fish passage solutions Even when best practice guidelines are followed, it is important to adopt a monitoring programme to
ensure a retrofitted structure is fit for purpose and operating as designed. This is particularly
important when retrofit solutions form only one component of an in-stream structure. For example,
remediating a perched culvert with a rock-ramp will provide access for fish to the culvert outlet, but
the culvert barrel itself may present a further migration barrier. Therefore, testing the effectiveness
of each component of the in-stream structure, e.g., rock-ramp and culvert, will provide certainty as
to whether fish are effectively passing the overall structure and consequently enhancing upstream
fish communities.
There are two recommended monitoring approaches for evaluating fish passage success at an in-
stream structure: a before-after-control-impact (BACI) survey, and an in-situ mark and recapture
study. Both the objectives and timeframe of the fish passage remediation works will inform which
monitoring approach is appropriate for a given site or solution. The main benefits and drawbacks of
the two approaches are outlined in Table 3-1.
Table 3-1: The main benefits and drawbacks of before-after-control-impact (BACI) and mark and recapture monitoring approaches.
Monitoring Benefits Drawbacks
BACI survey Documents changes to fish communities upstream of the remediated structure
Can take several years to determine if the remediation is effective
Minimises handling and stress to fish species
If the retrofit is unsuccessful in promoting fish passage no information is provided on which component of the remediated structure is still problematic
Mark & recapture study Test different components of an in-stream structure independently and collectively
Fish are subjected to handling and stress which may affect passage success
Immediate results on the effectiveness of the solution
Does not document changes in upstream fish communities
The following sections outline key aspects of these two methodologies.
Testing the effectiveness of fish passage solutions 9
4 BACI survey Where the objective is to evaluate the effects of improved connectivity on upstream fish
communities, the recommended long-term approach to monitoring would be to utilise a before-
after-control-impact (BACI) survey design. This is where fishing surveys are undertaken both
downstream (control) and upstream (impact) of the structure before and after remediation is carried
out. A BACI survey coupled with mark and recapture trials would provide the most robust
assessment of a fish passage retrofit.
4.1 Methodology
Fishing methods at the downstream and upstream sites should follow the National Freshwater Fish
Sampling Protocols by Joy et al. (2013). However, there are two caveats to utilising the electric
fishing protocol suggested by Joy et al. (2013):
Stop nets. The standardised electric-fishing protocol does not utilise stop nets at the start and end of
the survey reach. Recent works by Crow and Jellyman (2014) have indicated that population
estimates generated without stop net catches will underestimate fish abundance by 12-25%
depending on the time of year. Therefore, utilising stop nets will provide a more accurate
representation of the fish community at the survey sites.
Fish density assessment. The standardised electric-fishing protocol utilises a single pass, which is a
semi-quantitative method. Therefore, the results generated are the relative abundance of fish
species, which is not equivalent to fish density and can only be used for a relative comparison
between sites. Multi-pass depletion fishing would need to be utilised to generate population
estimates and fish densities, therefore allowing a quantitative comparison of fish communities
before and after remediation of the passage barrier and improved detection of trends in populations
over time. Should multi-pass depletion fishing be carried out, the recommended protocol is as
follows:
Utilise a 50 m reach at each site.
Set stop nets should be used at the top and bottom of each reach.
Carry out multiple electric-fishing passes until there is at least a 50% reduction in the
catch of each fish species compared with the previous pass. Generally, three passes
are the minimum necessary.
Fish and habitat information (e.g., fish lengths, wetted stream widths) would still be
collected as detailed in Joy et al. (2013), but with five 10 m sub-reaches assessed
instead of ten reaches.
For three pass depletion fishing, population estimates for each species in the reach can then be
calculated using the explicit approximation of the maximum likelihood formulae from Cowx (1983):
Population estimate No = (6X2 – 3XY – Y2 + (Y x √(Y2 + 6XY – 3X2))) / (18 x (X-Y))
Where X = 2c1 + c2 and Y = c1 + c2 + c3 and cn = the number of fish captured during n pass.
The density of each fish species in each section can then be calculated by dividing the population
estimate by either the length of stream fished, to give the number of fish per linear metre of stream,
or the stream area, to give the number of fish per metre square.

10 Testing the effectiveness of fish passage solutions
It should be noted that if a different electric-fishing method from that of Joy et al. (2013) is
employed, it will provide more detailed information on fish communities in the survey stream, but
these data will not be comparable to other areas where the standardised approach has been utilised
e.g., for state of the environment monitoring.
4.2 Frequency and timing
As recruitment of diadromous fish species can show annual variation, and migrations of juveniles
tend to be seasonal, it can take several years of monitoring to detect the change in biodiversity and
fish abundance attributable to the remediation. At any given site, there is also considerable temporal
variation in most fish species’ abundances. To help account for this, we would recommend annual
surveys of the upstream impact site in the same month each year until results are clear. Where
possible it is recommended that surveys should be carried out between December and April inclusive
(Joy et al. 2013). Use of quantitative multi-pass survey methods will further enhance the ability to
detect real changes in fish numbers over time.
Testing the effectiveness of fish passage solutions 11
5 Mark & recapture study A mark and recapture study would be recommended if a particular fish passage solution is to be
installed across a range of sites, the effectiveness of the solution has not been demonstrated in
practice, and/or if only one component of the structure is retrofitted and other unmodified aspects
may still represent an impediment to migratory fish. For example, remediation of perched culverts
commonly entails retrofitting a fish pass to the culvert outlet, yet the culvert barrel or transition from
the fish pass to inside the culvert may still represent an impediment or barrier to certain fish species.
Because this type of study requires the stream to be barricaded at the top and bottom of the test
reach, it is difficult to carry out in large non-wadable rivers and streams, or streams with high
discharges and water velocities. For larger, high flow systems a BACI survey using nets and traps
would be more applicable.
5.1 Target species
To ensure the fish pass is effective for all target species, mark and recapture trials should focus on
the weakest species that requires passage. If passage of swimming fish is desirable, juvenile inanga
are the benchmark species to use if present in the catchment. If passage of climbing fish is the
objective, then juvenile redfin bullies are the least adept climbing species. If redfin bullies are not
present in the catchment, then utilise juveniles of the weakest climbing galaxiid(s) present. Of the
four diadromous galaxiids capable of climbing, their ability to surmount in-stream obstacles in
ascending order would be: giant kokopu, shortjaw kokopu, banded kokopu, and koaro. As obtaining
large numbers of identifiable shortjaw and giant kokopu whitebait is difficult and/or costly, either
banded kokopu or koaro juveniles would be recommended.
5.2 Fish capture and maintenance
It is important to test the life-stage of the target species that reaches the in-stream obstacle. For
example, the perched culvert on Kara Stream, Upper Kingston Road (described in the case study in
Section 6), is more than 30 km from the sea. Therefore, inanga reaching these culverts will be
pigmented, feeding fish (post-whitebait/juvenile) with stronger swimming abilities than fresh-run
whitebait. In this regard, the site of capture for test fish should be representative of the test location.
In the upcoming trials examining inanga passage past the culverts in Waterfall Creek and Kara Stream
(Lower Kingston Road), using post-whitebait/juvenile fish as opposed to fresh run whitebait is
recommended.
It is desirable to capture test fish using nets and traps rather than electric-fishing. This is to minimise
the physiological damage to fish that is likely to influence passage performance.
To reduce stress and increase performance of the test fish, it is recommended to hold all fish in the
stream they are to be tested in. This is because previous trials carried out by NIWA have indicated
that fish held in a different water supply to that of the test system, display reduced upstream
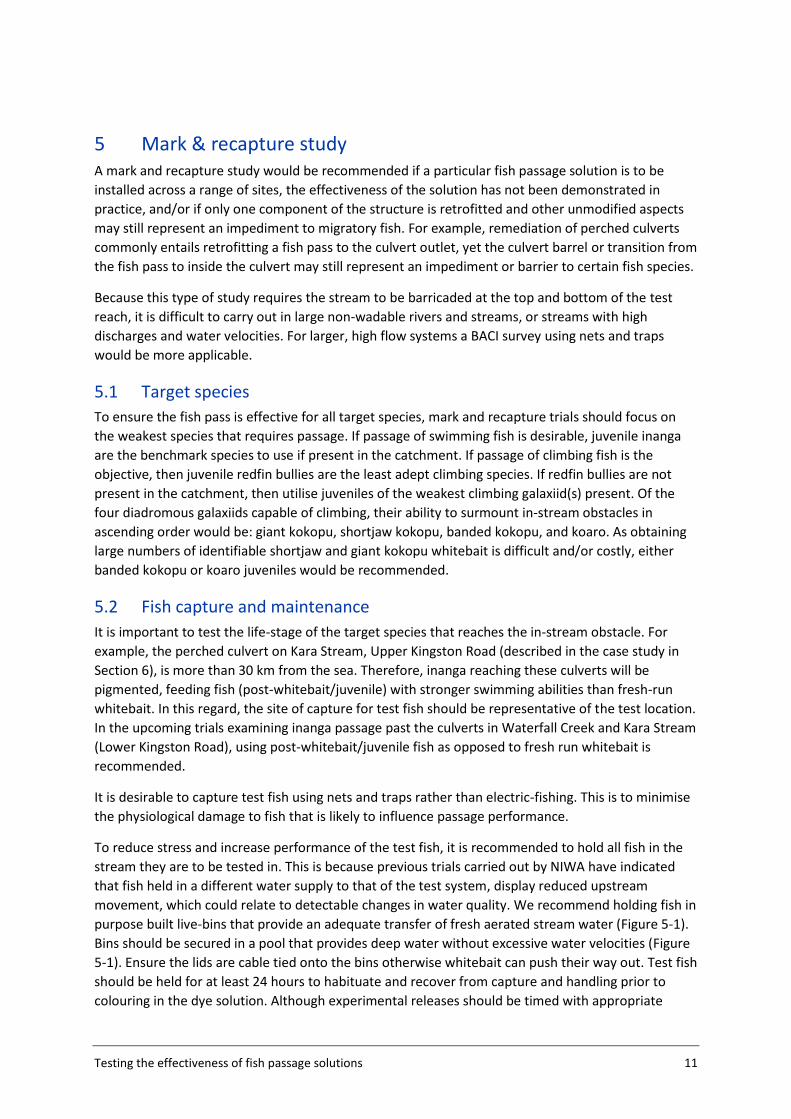
movement, which could relate to detectable changes in water quality. We recommend holding fish in
purpose built live-bins that provide an adequate transfer of fresh aerated stream water (Figure 5-1).
Bins should be secured in a pool that provides deep water without excessive water velocities (Figure
5-1). Ensure the lids are cable tied onto the bins otherwise whitebait can push their way out. Test fish
should be held for at least 24 hours to habituate and recover from capture and handling prior to
colouring in the dye solution. Although experimental releases should be timed with appropriate

12 Testing the effectiveness of fish passage solutions
weather and flow conditions, it is advisable to not hold fish for longer than a week before using in
trials.
Figure 5-1: Live-bins deployed in Kara Stream to maintain inanga for fish passage trials. Inset shows close up of live-bin.
5.3 Fish marking procedure
Mark test fish by immersion in a solution of Rhodamine B or Bismarck Brown. By colouring fish in
both dyes, it provides two replicates of test fish that can be trialled simultaneously, under the same
environmental conditions. In the case study of the Upper Kingston culvert (Section 6), where next to
no inanga were present in Kara Stream at the time of carrying out the mark and recapture trials,
unmarked inanga could also be released as a third replicate. These fish also act as a control for the
marked fish as they haven’t had the additional stress of staining, and are not more visible to
predators. Unmarked fish should only be used as test fish in situations where these fish are not
naturally occurring in high numbers, and therefore cannot infiltrate the test reach and confound
results. In upcoming trials examining inanga passage past the culverts in Waterfall Creek and Kara
Stream (Lower Kingston Road), it would be appropriate to use unmarked inanga as a third replicate.
For each trial, utilise between 100 and 200 fish per replicate. However, if only low numbers of test
fish are able to be reliably captured (i.e., such as banded kokopu whitebait) then using 30-50 fish per
replicate will suffice.
To stain fish:
In the shade adjacent to the stream, set up a separate bin containing 50 litres of
stream water (to stain up to 500 fish) for each dye solution.
To increase survival and buffer the solution, add aquarium salts (sold in pet shops to
make salt water) to produce a salinity of c. 18-20%o.

Testing the effectiveness of fish passage solutions 13
Add 10 g of Rhodamine B1 (0.2 g/L) or 2.5 g Bismarck Brown2 (0.05g/L). Wear gloves
when handling both dyes. Refer to the MSDS for each compound to ensure safe
practices are adhered to. Rhodamine B colours fish pink, and Bismarck brown colours
fish orange (Figure 5-2).
Figure 5-2: Fish coloured orange with Bismarck Brown (A) and pink with Rhodamine B (B).
Aerate the solution well with a portable air supply system. This will require more than
a small 3 or 6 volt battery powered air bubbler. Use a dive cylinder and adapted
regulator or portable 12 volt air compressor unit.
Determine the stream water temperature and add ice as necessary to the dye
solutions to maintain the water at ambient stream temperature.
For fish in Rhodamine B, remove after 2 hours, and for fish in Bismarck Brown, remove
after 1 to 1.5 hours. Hold coloured fish overnight in live bins to recover before trials.
After removing the fish, discard the waste solution onto the bank. Do not pour it into
the stream.
Wear gloves whilst removing fish, discarding waste solutions and cleaning bins and dip
nets.
For each experimental trial, it is advisable to hold 10% of the marked fish in a live-bin as ‘control’ fish
to verify mortality attributable to the colouring procedure.
5.4 Timing
A critical aspect of mark and recapture trials is timing. That is, carrying out the trials during base flow
in the study stream, under a high pressure front that will limit rainfall and subsequent rises in stream
discharge over the trial period. This is not only because the barricades and trap can get washed out,
but also because fish species such as inanga may alter their behaviour during changing flow
conditions, which will disrupt trial results.
1http://www.sigmaaldrich.com/catalog/product/sigma/r6626?lang=en®ion=NZ&gclid=Cj0KEQiAw
PCjBRDZp9LWno3p7rEBEiQAGj3KJgIsyxGXuruPdLVT5O5k7MEP9-rFYmNe--7qRJcTBOIaAkMt8P8HAQ
2 http://www.sigmaaldrich.com/catalog/product/sigma/15000?lang=en®ion=NZ

14 Testing the effectiveness of fish passage solutions
5.5 Trial design
At some culverts, monitoring the effectiveness of the rock-ramp retrofits will require separating
passage through the culvert from passage over the ramp. This ensures that the culvert itself is not an
additional obstacle, and allows the effectiveness of the rock-ramp to be assessed independently of
the culvert influence, as well as when paired with the secondary obstacle. This was particularly
important in the case study at Upper Kingston Road, as the culvert had baffling installed that had not
previously been field tested for passage of juvenile inanga. If a resting pool is present between the
rock-ramp and the culvert outlet, this provides a means of easily separating the rock-ramp trials from
the culvert trials (i.e., fish can be trapped in the pool and/or at the culvert inlet). For structures such
as the Kara Stream culvert at Upper Kingston Road, the absence of a resting pool directly
downstream of the culvert outlet makes separating each component challenging, and the
recommended approach would be that carried out in September 2014:
Examining fish passage through the culvert only.
Examining fish passage over the entire structure; rock-ramp and culvert.
This will control for the culvert influence and allow the effectiveness of the ramp to be determined.
In some cases, multiple culvert barrels may be present in which case the trial design must be
adapted. The recommended approach would be to test the two culverts and any associated retrofits
collectively to determine what proportion of fish select, and successfully pass, each culvert. For these
tests, a whitebait trap would need to be deployed at the inlet (upstream end) of each culvert.
5.5.1 Kara Stream – Lower Kingston Road
At the Kara Stream double culverts (Lower Kingston Road), two approaches could be utilised. The
recommended approach would be that described above, to test the two culverts and rock-ramps
collectively to determine what proportion of fish select, and successfully pass, the true right culvert
with the higher flow and spat rope and baffles installed, compared with the true left culvert with
lower flows and no baffling installed. As previously stated, for these tests, a whitebait trap would
need to be deployed at the inlet of each culvert.
Alternatively, or additionally, passage through the true right culvert with the spat ropes and baffles
could be tested independently. Here, a temporary pool would need to be created in the rock-ramp
below the culvert outlet (Figure 5-3). Sandbags and/or rock (lined with mesh) can be used to form
the pool boundaries. However, the pool should be kept shallow (20 – 40 cm) to prevent significant
increases in the water level within the culvert. If deemed necessary, place one or two large boulders
in the pool to ensure low velocity refuge areas are present. This approach will determine the
effectiveness of the spat ropes and baffles in promoting inanga passage through the culvert, but will
provide less information on how effective the whole system is in promoting inanga passage.

Testing the effectiveness of fish passage solutions 15
Figure 5-3: Recommended area to create a temporary pool to facilitate testing inanga passage through the baffled culvert in Kara Stream at Lower Kingston Road. Utilise sandbags and/or rocks to form the pool boundary.
5.5.2 Waterfall Creek
Because of the shallow water depth and larger width of Waterfall Creek, it will be difficult to
effectively separate the culvert from the rock-ramp. Therefore, the box culvert and rock-ramp should
initially be tested together. Results of the trials will inform if additional testing is necessary, as well as
appropriate approaches.
5.6 Barricades
Install a barricade at the bottom of the test site to prevent fish escaping downstream or stream fish
moving upstream. A seine net or whitebait mesh form suitable barriers (Figure 5-4). It is important to
dig the bottom of the mesh into the substrate and cover with boulders to try and create a secure
barrier. If possible, the top of the mesh can be secured to trees on the stream banks (Figure 5-4B),
otherwise waratahs or stakes will need to be utilised (Figure 5-4C). Installing a second net
downstream as a back-up is also advisable (Figure 5-4). The barrier should be installed below the
pool at the base of the rock-ramps to provide fish with a low velocity area to rest before ascent.
Note: each retrofit rock-ramp should have rock weirs installed downstream to create a pool at the
base of the ramp (Figure 5-4B & C) to dissipate energy and prevent erosion.
16 Testing the effectiveness of fish passage solutions
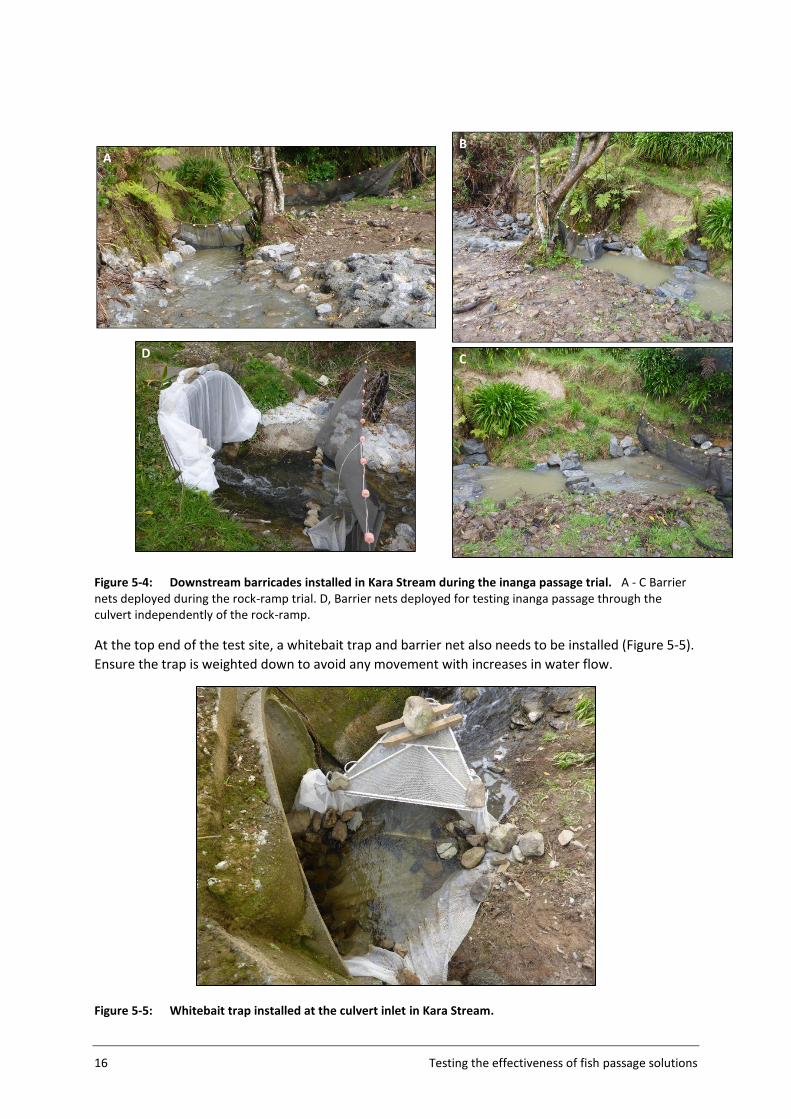
Figure 5-4: Downstream barricades installed in Kara Stream during the inanga passage trial. A - C Barrier nets deployed during the rock-ramp trial. D, Barrier nets deployed for testing inanga passage through the culvert independently of the rock-ramp.
At the top end of the test site, a whitebait trap and barrier net also needs to be installed (Figure 5-5).
Ensure the trap is weighted down to avoid any movement with increases in water flow.
Figure 5-5: Whitebait trap installed at the culvert inlet in Kara Stream.

Testing the effectiveness of fish passage solutions 17
At the double culvert on Kara Stream (Lower Kingston Road), a separate trap and whitebait mesh
should be used at the inlet of each culvert.
At the box culvert in Waterfall Creek, the whitebait trap should be set at the margin of the culvert
inlet where the main flow is located, with a seine net or whitebait mesh wing extending to the
opposite stream margin.
5.7 Measurements
5.7.1 Flow
It is important to record the flow at the time of the trials. If the study stream does not have a water
level recorder installed, a flow gauging can be carried out on each day the trials are being
undertaken. A flow gauging will require:
A current meter.
A gauging rod.
Tape measure.
If you are unfamiliar with flow gaugings, in-house hydrologists would be best placed to advise on
gauging methodology and explain the operation of flow gauging equipment.
5.7.2 Water velocity
It is also advisable to measure the average velocity over each section of the in-stream structure (e.g.,
culvert and rock-ramp). This will help inform or predict potential problem areas for fish passage, as
well as provide some comparative information between sites. The most commonly used method to
calculate average water velocity is to time how long a float takes to travel a set distance. A mandarin
or orange makes an excellent float as it’s easy to see, can withstand knocking into rocks, and it floats
almost submerged so the wind doesn't influence its movement.
For each site, measure the average water velocity inside the culvert separately from that over the
rock-ramp. For sites containing double culverts, measure the average velocity in both culverts. On
each trial day, undertake six orange/mandarin releases for each section of the structure (culvert and
rock-ramp). This will provide an indication of variation both within and between trial days.
5.8 Trial length
As each fish pass and stream system is different, the appropriate trial length will be determined
during the monitoring, but based on results from the Upper Kingston Road trial, it is recommended
that fish are given 24 hours to pass the culvert independently, and up to 36 hours to pass the rock-
ramp and culvert. The trap can be inspected after 12 and 24 hours to determine if extending the trial
to 36 hours is warranted.
5.9 Methodology
Initiate trials in the early morning. This may require the barricades to be installed the
previous day.
18 Testing the effectiveness of fish passage solutions
Prior to releasing the marked fish, electric-fish the test reach to remove any resident
fish that could confound trial results. Utilise multi-pass fishing until no fish are
captured.
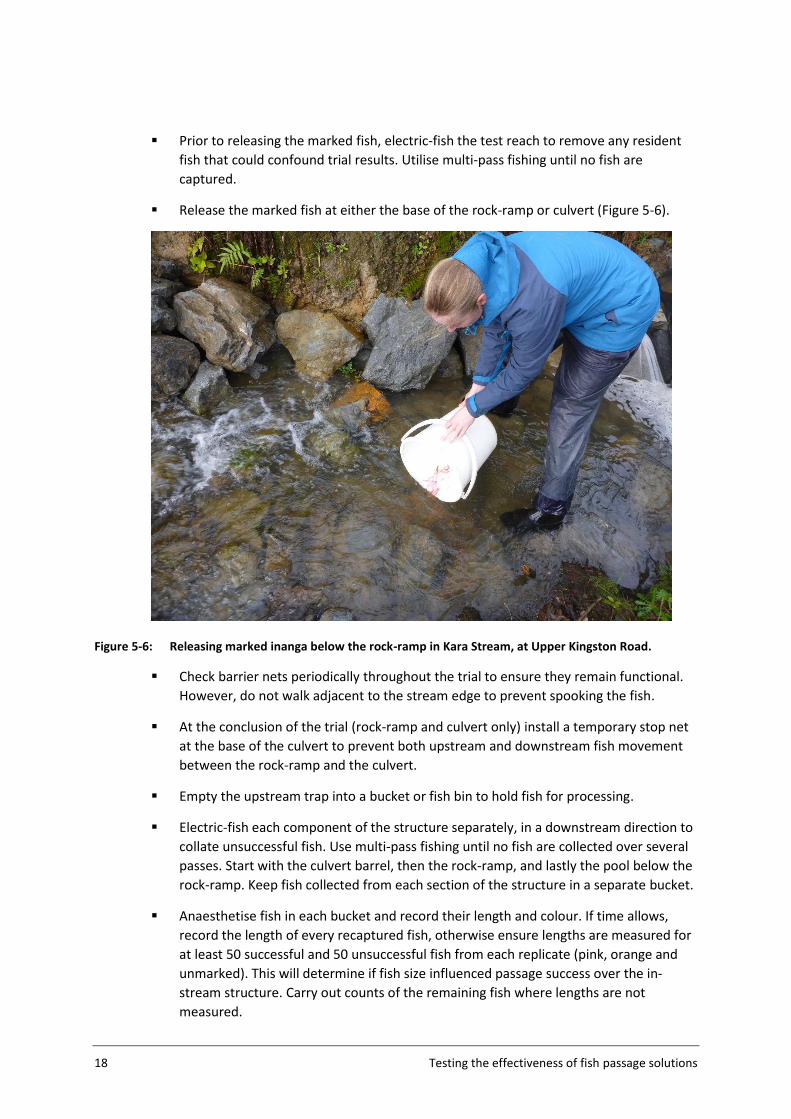
Release the marked fish at either the base of the rock-ramp or culvert (Figure 5-6).
Figure 5-6: Releasing marked inanga below the rock-ramp in Kara Stream, at Upper Kingston Road.
Check barrier nets periodically throughout the trial to ensure they remain functional.
However, do not walk adjacent to the stream edge to prevent spooking the fish.
At the conclusion of the trial (rock-ramp and culvert only) install a temporary stop net
at the base of the culvert to prevent both upstream and downstream fish movement
between the rock-ramp and the culvert.
Empty the upstream trap into a bucket or fish bin to hold fish for processing.
Electric-fish each component of the structure separately, in a downstream direction to
collate unsuccessful fish. Use multi-pass fishing until no fish are collected over several
passes. Start with the culvert barrel, then the rock-ramp, and lastly the pool below the
rock-ramp. Keep fish collected from each section of the structure in a separate bucket.
Anaesthetise fish in each bucket and record their length and colour. If time allows,
record the length of every recaptured fish, otherwise ensure lengths are measured for
at least 50 successful and 50 unsuccessful fish from each replicate (pink, orange and
unmarked). This will determine if fish size influenced passage success over the in-
stream structure. Carry out counts of the remaining fish where lengths are not
measured.
Testing the effectiveness of fish passage solutions 19
6 Mark & recapture case study: Upper Kingston
6.1 Introduction
This case study describes the results of mark-recapture trials undertaken by NIWA and Horizons
Regional Council at a culvert on Kara Stream, Manawatu, which has been retrofitted with a rock-
ramp and culvert baffles. The trials were carried out in September 2014 and demonstrate the
methodology described in Section 5. This case study helps to illustrate the practical limitations of
applying the methodology, but also the valuable inferences that can be gained from the results.
6.2 Upper Kingston study description
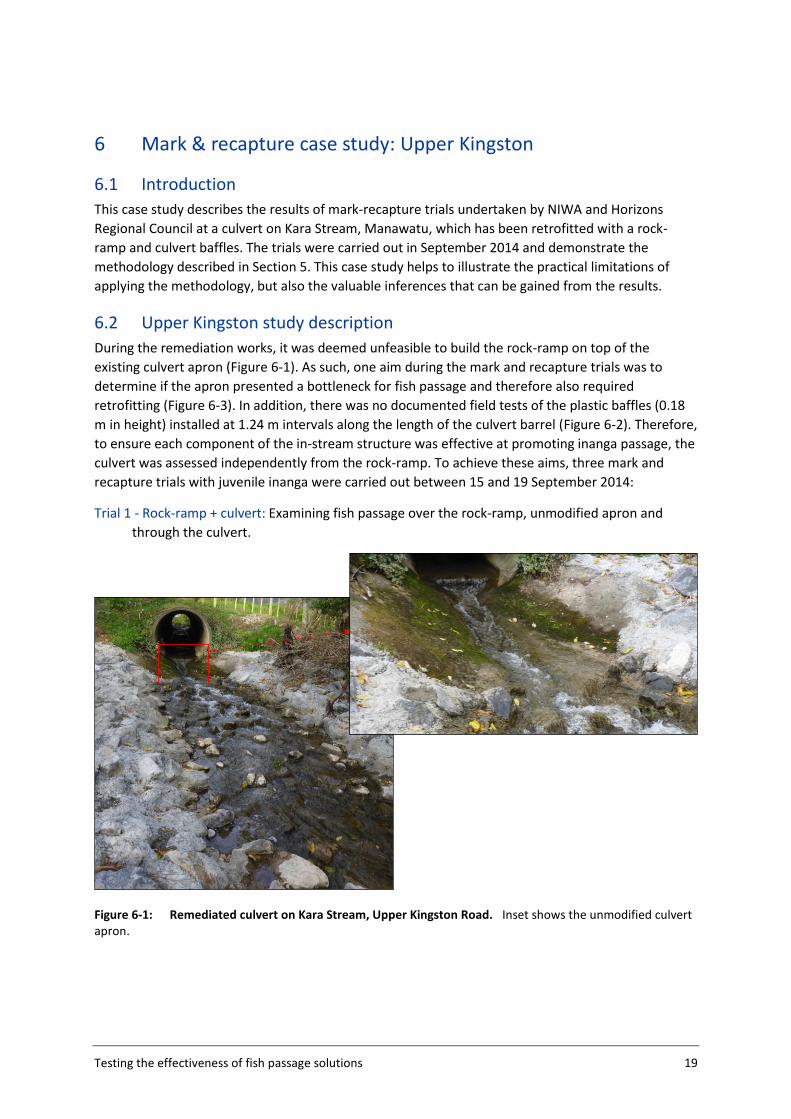
During the remediation works, it was deemed unfeasible to build the rock-ramp on top of the
existing culvert apron (Figure 6-1). As such, one aim during the mark and recapture trials was to
determine if the apron presented a bottleneck for fish passage and therefore also required
retrofitting (Figure 6-3). In addition, there was no documented field tests of the plastic baffles (0.18
m in height) installed at 1.24 m intervals along the length of the culvert barrel (Figure 6-2). Therefore,
to ensure each component of the in-stream structure was effective at promoting inanga passage, the
culvert was assessed independently from the rock-ramp. To achieve these aims, three mark and
recapture trials with juvenile inanga were carried out between 15 and 19 September 2014:
Trial 1 - Rock-ramp + culvert: Examining fish passage over the rock-ramp, unmodified apron and
through the culvert.
Figure 6-1: Remediated culvert on Kara Stream, Upper Kingston Road. Inset shows the unmodified culvert apron.
20 Testing the effectiveness of fish passage solutions
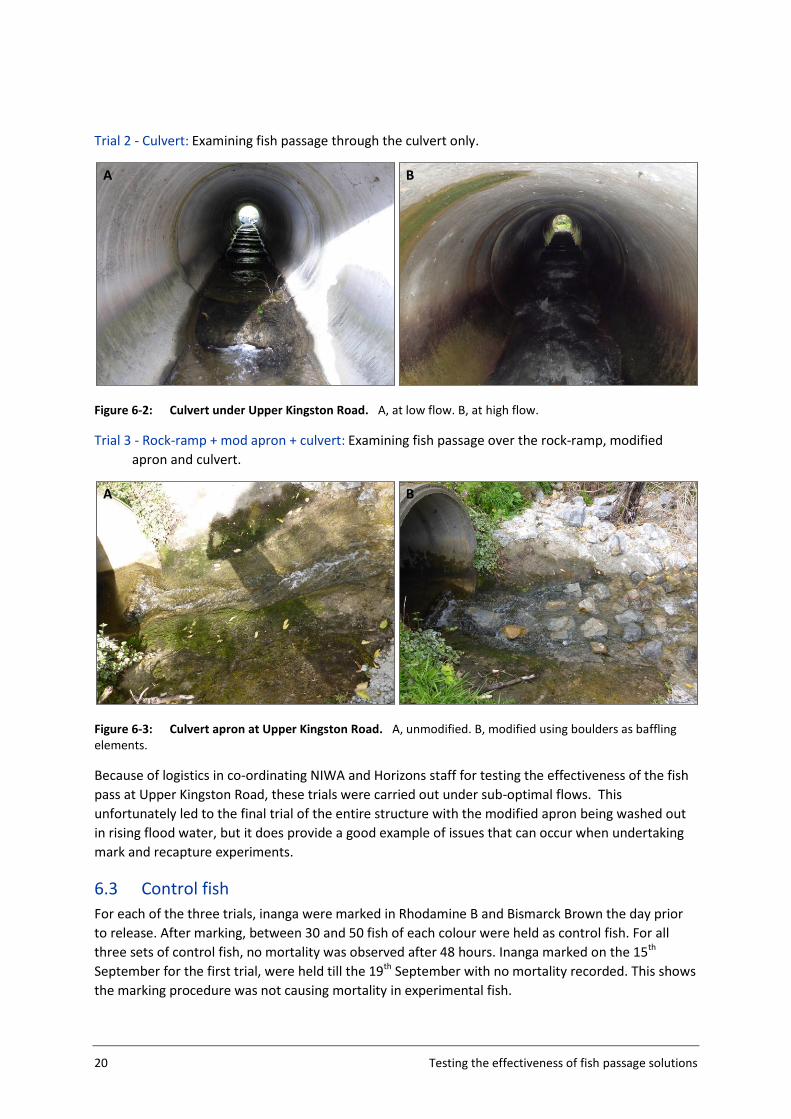
Trial 2 - Culvert: Examining fish passage through the culvert only.
Figure 6-2: Culvert under Upper Kingston Road. A, at low flow. B, at high flow.
Trial 3 - Rock-ramp + mod apron + culvert: Examining fish passage over the rock-ramp, modified
apron and culvert.
Figure 6-3: Culvert apron at Upper Kingston Road. A, unmodified. B, modified using boulders as baffling elements.
Because of logistics in co-ordinating NIWA and Horizons staff for testing the effectiveness of the fish
pass at Upper Kingston Road, these trials were carried out under sub-optimal flows. This
unfortunately led to the final trial of the entire structure with the modified apron being washed out
in rising flood water, but it does provide a good example of issues that can occur when undertaking
mark and recapture experiments.
6.3 Control fish
For each of the three trials, inanga were marked in Rhodamine B and Bismarck Brown the day prior
to release. After marking, between 30 and 50 fish of each colour were held as control fish. For all
three sets of control fish, no mortality was observed after 48 hours. Inanga marked on the 15th
September for the first trial, were held till the 19th September with no mortality recorded. This shows
the marking procedure was not causing mortality in experimental fish.
A B
A B
Testing the effectiveness of fish passage solutions 21
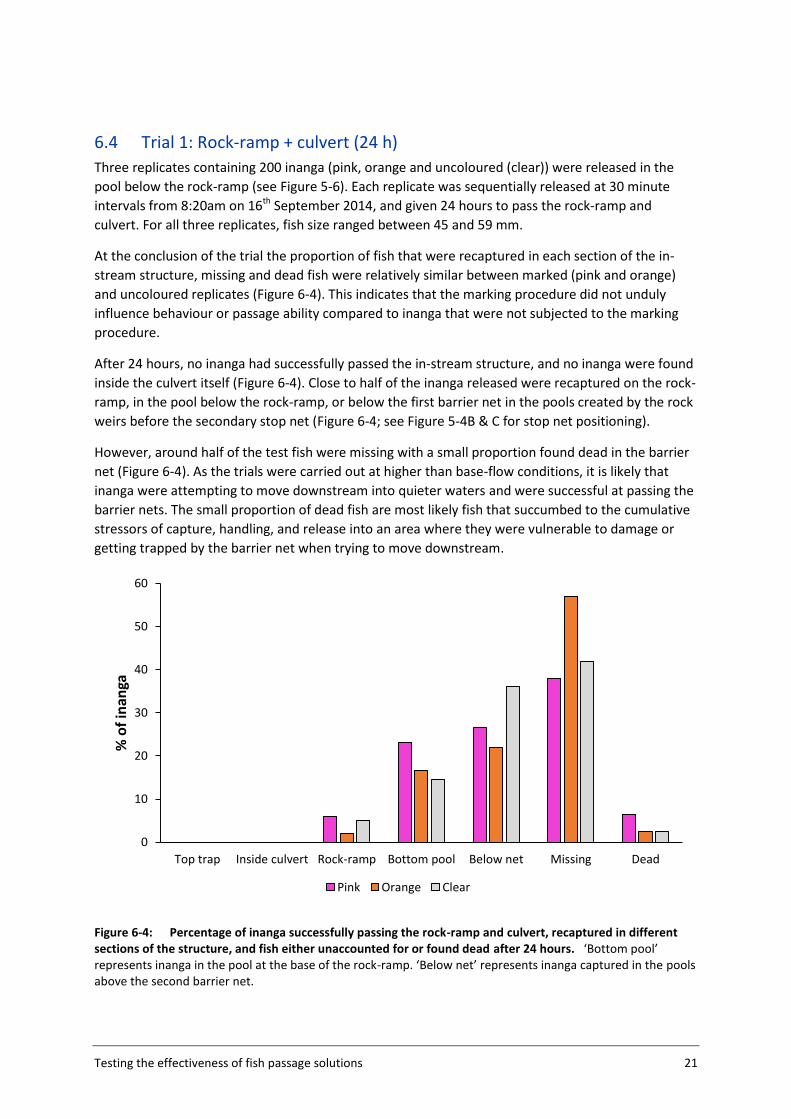
6.4 Trial 1: Rock-ramp + culvert (24 h)
Three replicates containing 200 inanga (pink, orange and uncoloured (clear)) were released in the
pool below the rock-ramp (see Figure 5-6). Each replicate was sequentially released at 30 minute
intervals from 8:20am on 16th September 2014, and given 24 hours to pass the rock-ramp and
culvert. For all three replicates, fish size ranged between 45 and 59 mm.
At the conclusion of the trial the proportion of fish that were recaptured in each section of the in-
stream structure, missing and dead fish were relatively similar between marked (pink and orange)
and uncoloured replicates (Figure 6-4). This indicates that the marking procedure did not unduly
influence behaviour or passage ability compared to inanga that were not subjected to the marking
procedure.
After 24 hours, no inanga had successfully passed the in-stream structure, and no inanga were found
inside the culvert itself (Figure 6-4). Close to half of the inanga released were recaptured on the rock-
ramp, in the pool below the rock-ramp, or below the first barrier net in the pools created by the rock
weirs before the secondary stop net (Figure 6-4; see Figure 5-4B & C for stop net positioning).
However, around half of the test fish were missing with a small proportion found dead in the barrier
net (Figure 6-4). As the trials were carried out at higher than base-flow conditions, it is likely that
inanga were attempting to move downstream into quieter waters and were successful at passing the
barrier nets. The small proportion of dead fish are most likely fish that succumbed to the cumulative
stressors of capture, handling, and release into an area where they were vulnerable to damage or
getting trapped by the barrier net when trying to move downstream.
Figure 6-4: Percentage of inanga successfully passing the rock-ramp and culvert, recaptured in different sections of the structure, and fish either unaccounted for or found dead after 24 hours. ‘Bottom pool’ represents inanga in the pool at the base of the rock-ramp. ‘Below net’ represents inanga captured in the pools above the second barrier net.
0
10
20
30
40
50
60
Top trap Inside culvert Rock-ramp Bottom pool Below net Missing Dead
% o
f in
anga
Pink Orange Clear
22 Testing the effectiveness of fish passage solutions
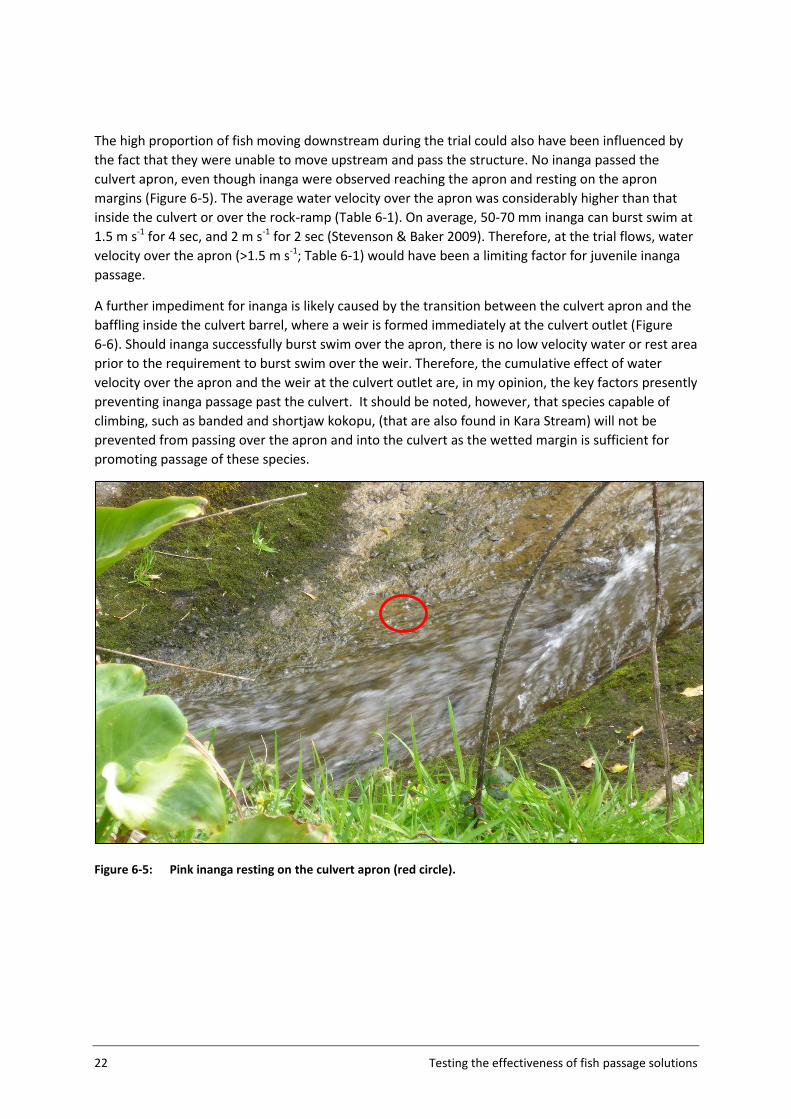
The high proportion of fish moving downstream during the trial could also have been influenced by
the fact that they were unable to move upstream and pass the structure. No inanga passed the
culvert apron, even though inanga were observed reaching the apron and resting on the apron
margins (Figure 6-5). The average water velocity over the apron was considerably higher than that
inside the culvert or over the rock-ramp (Table 6-1). On average, 50-70 mm inanga can burst swim at
1.5 m s-1 for 4 sec, and 2 m s-1 for 2 sec (Stevenson & Baker 2009). Therefore, at the trial flows, water
velocity over the apron (>1.5 m s-1; Table 6-1) would have been a limiting factor for juvenile inanga
passage.
A further impediment for inanga is likely caused by the transition between the culvert apron and the
baffling inside the culvert barrel, where a weir is formed immediately at the culvert outlet (Figure
6-6). Should inanga successfully burst swim over the apron, there is no low velocity water or rest area
prior to the requirement to burst swim over the weir. Therefore, the cumulative effect of water
velocity over the apron and the weir at the culvert outlet are, in my opinion, the key factors presently
preventing inanga passage past the culvert. It should be noted, however, that species capable of
climbing, such as banded and shortjaw kokopu, (that are also found in Kara Stream) will not be
prevented from passing over the apron and into the culvert as the wetted margin is sufficient for
promoting passage of these species.
Figure 6-5: Pink inanga resting on the culvert apron (red circle).

Testing the effectiveness of fish passage solutions 23
Table 6-1: The flow (m3 s
-1) of Kara Stream and the average water velocity (m s
-1) through the culvert, and
over the apron and rock-ramp during each of the trial days. The float used for calculating the average velocity (mandarin or stick) is also provided. For each day, the velocity given is the average of six replicates. - indicates measurements were not recorded that day. † The float over the rock-ramp needed to be changed from the mandarin because of issues with the mandarin getting stuck in the small pools on the ramp.
Average water velocity (m s-1
)
Date Trial start Flow (m
3 s
-1)
Rock-ramp
Unmodified apron
Culvert Modified apron
Stick† Mandarin Mandarin Mandarin
15 Sept 0.017 0.50 1.53 0.36 -
16 Sept Rock-ramp + culvert 0.025 0.45 1.52 0.34 -
17 Sept Culvert 0.019 - - 0.43 -
18 Sept Rock-ramp + mod apron + culvert 0.015 - - - 0.25
19 Sept 0.180 - - - -
Figure 6-6: Weir created by the baffle at the transition point between the culvert outlet and apron.
24 Testing the effectiveness of fish passage solutions
6.5 Trial 2: Culvert only (20.5 h)
Three replicates of fish (198 pink inanga, 200 orange inanga and 179 uncoloured (clear) inanga) were
released at 12:30 pm on 17th September 2014, and given 20.5 hours to pass the culvert. All fish were
released into the pool formed between the first and second baffles inside the culvert barrel. For all
three replicates, fish size ranged between 45 and 75 mm. These juvenile and post-juvenile inanga
were captured further inland than those used in Trial 1 and are more representative of the size of
inanga that would be reaching the culvert at Upper Kingston Road.
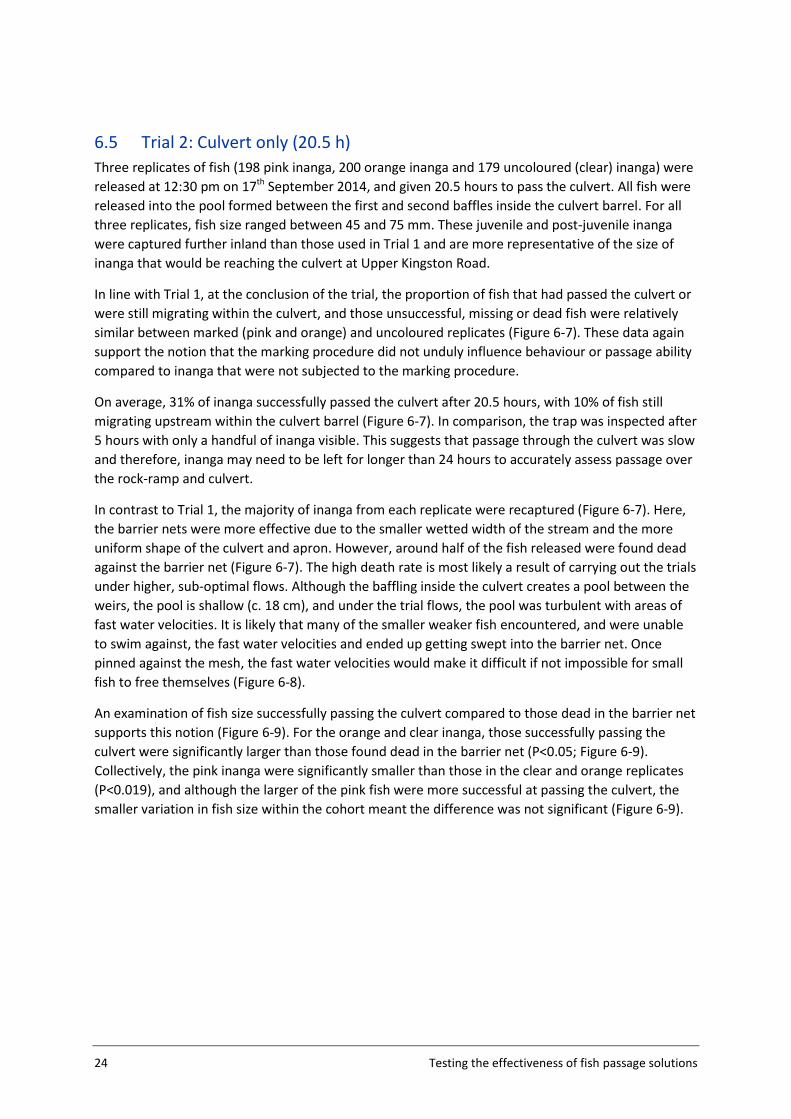
In line with Trial 1, at the conclusion of the trial, the proportion of fish that had passed the culvert or
were still migrating within the culvert, and those unsuccessful, missing or dead fish were relatively
similar between marked (pink and orange) and uncoloured replicates (Figure 6-7). These data again
support the notion that the marking procedure did not unduly influence behaviour or passage ability
compared to inanga that were not subjected to the marking procedure.
On average, 31% of inanga successfully passed the culvert after 20.5 hours, with 10% of fish still
migrating upstream within the culvert barrel (Figure 6-7). In comparison, the trap was inspected after
5 hours with only a handful of inanga visible. This suggests that passage through the culvert was slow
and therefore, inanga may need to be left for longer than 24 hours to accurately assess passage over
the rock-ramp and culvert.
In contrast to Trial 1, the majority of inanga from each replicate were recaptured (Figure 6-7). Here,
the barrier nets were more effective due to the smaller wetted width of the stream and the more
uniform shape of the culvert and apron. However, around half of the fish released were found dead
against the barrier net (Figure 6-7). The high death rate is most likely a result of carrying out the trials
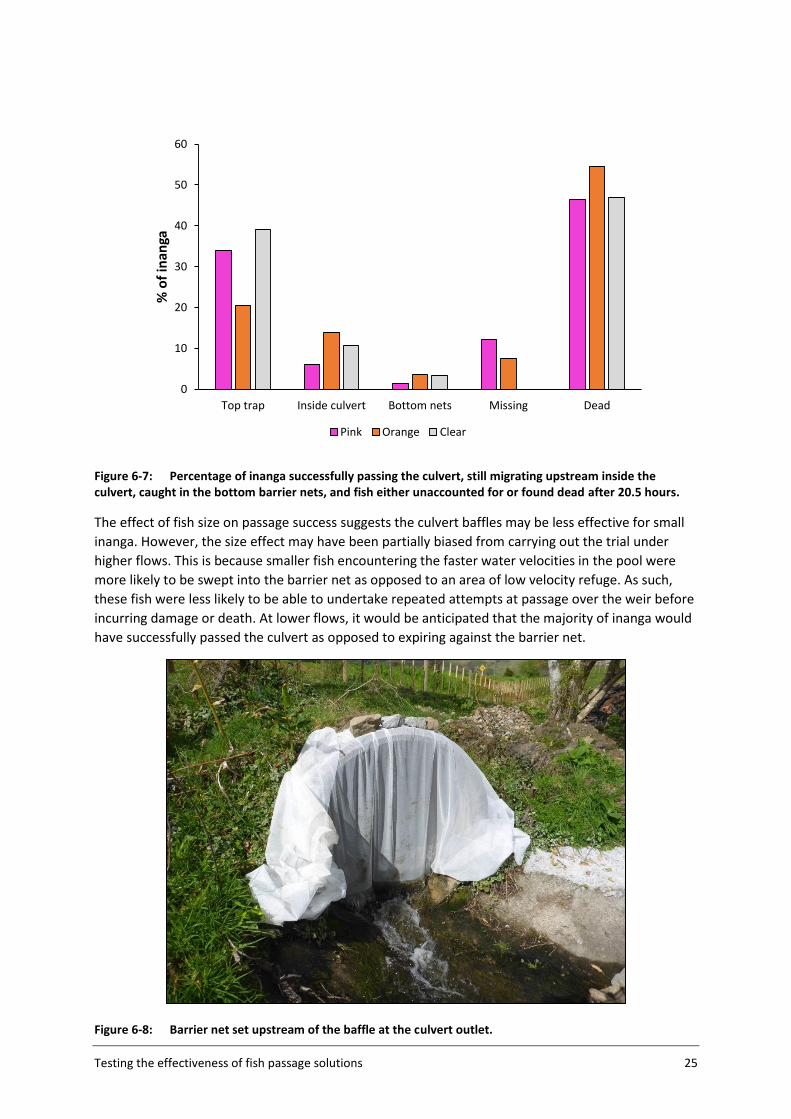
under higher, sub-optimal flows. Although the baffling inside the culvert creates a pool between the
weirs, the pool is shallow (c. 18 cm), and under the trial flows, the pool was turbulent with areas of
fast water velocities. It is likely that many of the smaller weaker fish encountered, and were unable
to swim against, the fast water velocities and ended up getting swept into the barrier net. Once
pinned against the mesh, the fast water velocities would make it difficult if not impossible for small
fish to free themselves (Figure 6-8).
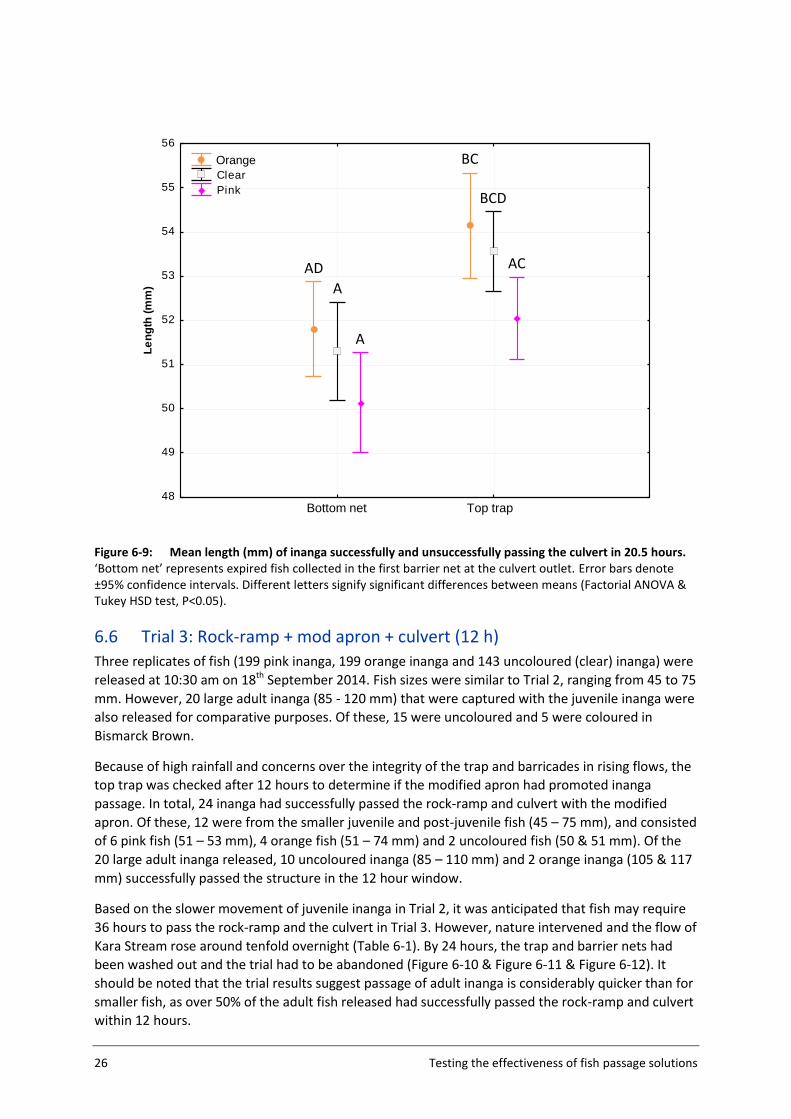
An examination of fish size successfully passing the culvert compared to those dead in the barrier net
supports this notion (Figure 6-9). For the orange and clear inanga, those successfully passing the
culvert were significantly larger than those found dead in the barrier net (P<0.05; Figure 6-9).
Collectively, the pink inanga were significantly smaller than those in the clear and orange replicates
(P<0.019), and although the larger of the pink fish were more successful at passing the culvert, the
smaller variation in fish size within the cohort meant the difference was not significant (Figure 6-9).
Testing the effectiveness of fish passage solutions 25
Figure 6-7: Percentage of inanga successfully passing the culvert, still migrating upstream inside the culvert, caught in the bottom barrier nets, and fish either unaccounted for or found dead after 20.5 hours.
The effect of fish size on passage success suggests the culvert baffles may be less effective for small
inanga. However, the size effect may have been partially biased from carrying out the trial under
higher flows. This is because smaller fish encountering the faster water velocities in the pool were
more likely to be swept into the barrier net as opposed to an area of low velocity refuge. As such,
these fish were less likely to be able to undertake repeated attempts at passage over the weir before
incurring damage or death. At lower flows, it would be anticipated that the majority of inanga would
have successfully passed the culvert as opposed to expiring against the barrier net.
Figure 6-8: Barrier net set upstream of the baffle at the culvert outlet.
0
10
20
30
40
50
60
Top trap Inside culvert Bottom nets Missing Dead
% o
f in
anga
Pink Orange Clear
26 Testing the effectiveness of fish passage solutions
Figure 6-9: Mean length (mm) of inanga successfully and unsuccessfully passing the culvert in 20.5 hours. ‘Bottom net’ represents expired fish collected in the first barrier net at the culvert outlet. Error bars denote ±95% confidence intervals. Different letters signify significant differences between means (Factorial ANOVA & Tukey HSD test, P<0.05).
6.6 Trial 3: Rock-ramp + mod apron + culvert (12 h)
Three replicates of fish (199 pink inanga, 199 orange inanga and 143 uncoloured (clear) inanga) were
released at 10:30 am on 18th September 2014. Fish sizes were similar to Trial 2, ranging from 45 to 75
mm. However, 20 large adult inanga (85 - 120 mm) that were captured with the juvenile inanga were
also released for comparative purposes. Of these, 15 were uncoloured and 5 were coloured in
Bismarck Brown.
Because of high rainfall and concerns over the integrity of the trap and barricades in rising flows, the
top trap was checked after 12 hours to determine if the modified apron had promoted inanga
passage. In total, 24 inanga had successfully passed the rock-ramp and culvert with the modified
apron. Of these, 12 were from the smaller juvenile and post-juvenile fish (45 – 75 mm), and consisted
of 6 pink fish (51 – 53 mm), 4 orange fish (51 – 74 mm) and 2 uncoloured fish (50 & 51 mm). Of the
20 large adult inanga released, 10 uncoloured inanga (85 – 110 mm) and 2 orange inanga (105 & 117
mm) successfully passed the structure in the 12 hour window.
Based on the slower movement of juvenile inanga in Trial 2, it was anticipated that fish may require
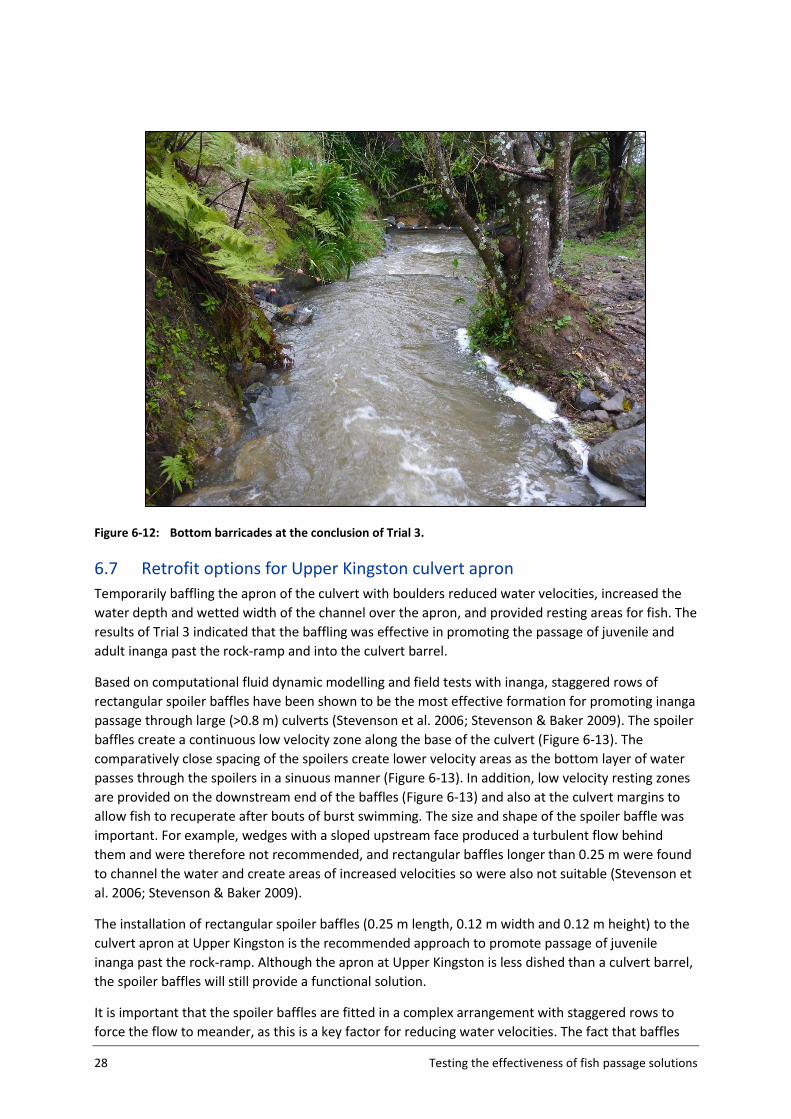
36 hours to pass the rock-ramp and the culvert in Trial 3. However, nature intervened and the flow of
Kara Stream rose around tenfold overnight (Table 6-1). By 24 hours, the trap and barrier nets had
been washed out and the trial had to be abandoned (Figure 6-10 & Figure 6-11 & Figure 6-12). It
should be noted that the trial results suggest passage of adult inanga is considerably quicker than for
smaller fish, as over 50% of the adult fish released had successfully passed the rock-ramp and culvert
within 12 hours.
Bottom Seine Net Top Trap48
49
50
51
52
53
54
55
56L
en
gth
(m
m)
Brown
Clear
Pink
Bottom net Top trap
Orange BC
BCD
ACAD
A
A

Testing the effectiveness of fish passage solutions 27
Although the flood waters prevented an accurate assessment of inanga passage past the rock-ramp
and culvert with the baffled apron, the successful passage of both small (50 mm) and large (>85 mm)
inanga recorded after 12 hours confirmed that the culvert apron is the key factor limiting swimming
fish passage. Therefore retrofitting baffles to the apron is recommended to enhance fish passage
past the culvert.
Figure 6-10: Top trap during increasing flood waters at the conclusion of Trial 3.
Figure 6-11: Flow through the culvert and over the rock-ramp at the conclusion of Trial 3.
28 Testing the effectiveness of fish passage solutions
Figure 6-12: Bottom barricades at the conclusion of Trial 3.
6.7 Retrofit options for Upper Kingston culvert apron
Temporarily baffling the apron of the culvert with boulders reduced water velocities, increased the
water depth and wetted width of the channel over the apron, and provided resting areas for fish. The
results of Trial 3 indicated that the baffling was effective in promoting the passage of juvenile and
adult inanga past the rock-ramp and into the culvert barrel.
Based on computational fluid dynamic modelling and field tests with inanga, staggered rows of
rectangular spoiler baffles have been shown to be the most effective formation for promoting inanga
passage through large (>0.8 m) culverts (Stevenson et al. 2006; Stevenson & Baker 2009). The spoiler
baffles create a continuous low velocity zone along the base of the culvert (Figure 6-13). The
comparatively close spacing of the spoilers create lower velocity areas as the bottom layer of water
passes through the spoilers in a sinuous manner (Figure 6-13). In addition, low velocity resting zones
are provided on the downstream end of the baffles (Figure 6-13) and also at the culvert margins to
allow fish to recuperate after bouts of burst swimming. The size and shape of the spoiler baffle was
important. For example, wedges with a sloped upstream face produced a turbulent flow behind
them and were therefore not recommended, and rectangular baffles longer than 0.25 m were found
to channel the water and create areas of increased velocities so were also not suitable (Stevenson et
al. 2006; Stevenson & Baker 2009).
The installation of rectangular spoiler baffles (0.25 m length, 0.12 m width and 0.12 m height) to the
culvert apron at Upper Kingston is the recommended approach to promote passage of juvenile
inanga past the rock-ramp. Although the apron at Upper Kingston is less dished than a culvert barrel,
the spoiler baffles will still provide a functional solution.
It is important that the spoiler baffles are fitted in a complex arrangement with staggered rows to
force the flow to meander, as this is a key factor for reducing water velocities. The fact that baffles

Testing the effectiveness of fish passage solutions 29
are not placed in a continuous line allows fish to progress upstream between low velocity areas
without having to negotiate the higher velocity flow above the baffles. Not having all the baffles
submerged during base/low flows is advantageous as the partially submerged baffles on the apron
margins can provide important resting areas for migrating fish.
The spacing of the baffles is also important as this will ensure that fish are able to use the resting
areas created between rows of baffles. A spacing of 0.20 m between baffles will ensure that the
resting areas provided are large enough to accommodate migratory fish up to 200 mm in size (which
will include most indigenous adult fish) without compromising the passage of small fish.
Stevenson and Baker (2009) recommended using alternate rows of 3 and 4 baffles for culverts 1.3 m
in diameter, and rows of 5 and 6 baffles for culverts of 2 m in diameter. It is recommended that
alternate rows of 5 and 6 baffles be installed on the culvert apron at Upper Kingston because the
apron has less curvature and therefore more wetted width than the 1.5 m culvert. This arrangement
is supported by measurements taken after baffling the apron with boulders as the wetted width of
the channel increased approximately three-fold to 1.6 m (Figure 6-14). The recommended
configuration and spacing of the spoiler baffles is depicted in Figure 6-15. Each baffle should measure
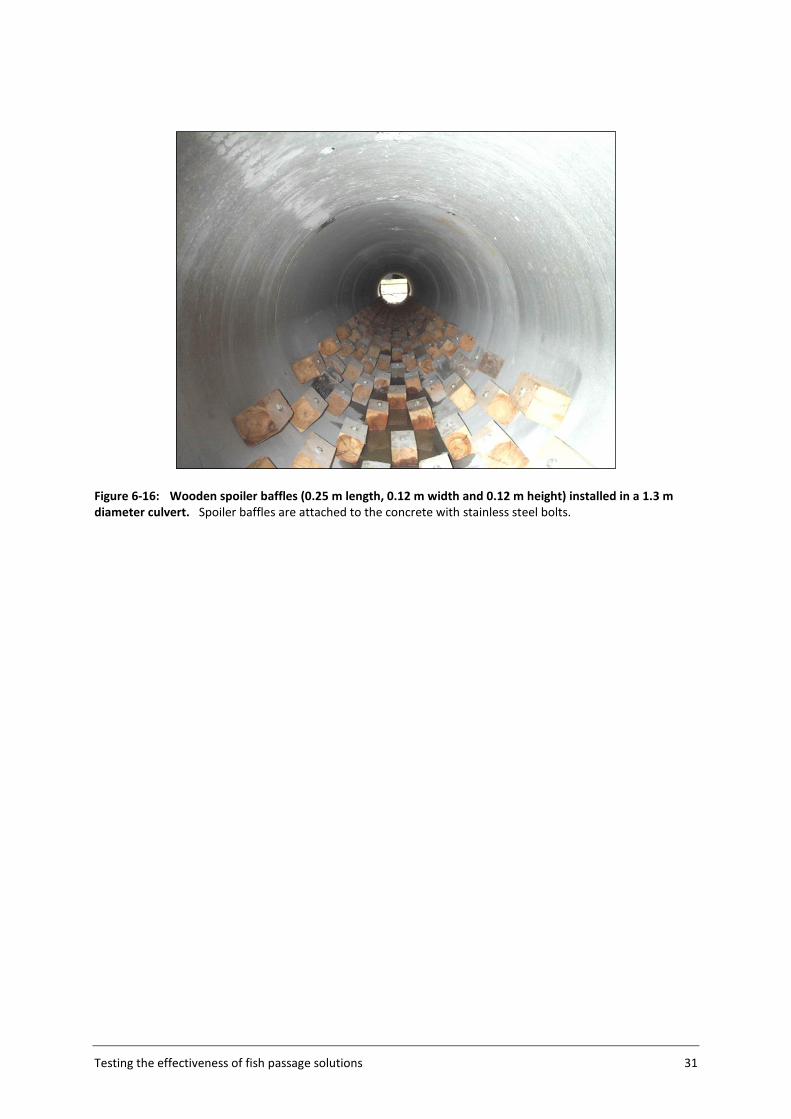
0.25 m in length, 0.12 m in width and 0.12 m in height. Baffles should be secured to the apron using
stainless steel anchor bolts (Figure 6-16).
It is recommended that the first row of baffles contains 5 spoilers and is set up against the culvert
outlet. Either 4 or 5 rows of baffles will be able to be installed down the apron before reaching the
top of the rock-ramp.
Figure 6-13: Side view (top section of diagram) and plan view (bottom section of diagram) of modelled water velocities in a culvert fitted with alternating rows of rectangular spoiler blocks (0.25 m length, 0.12 m width and 0.12 m height), spaced 0.20 m apart at a flow of 0.11 m
3 s
-1. Arrows indicate the direction of flow.
Culvert diameter = 1.35. The coloured band at the top of the figure gives the water velocity range (red = 1.30 m s
-1, blue = 0 m s
-1).
0.00 0.32 0.65 0.97 1.30
Water velocity (m s-1)

30 Testing the effectiveness of fish passage solutions
Figure 6-14: Wetted widths measured across the culvert apron after installing boulder baffles. Flow was approximately 0.015 m
3 s
-1.
Figure 6-15: Plan view of spoiler baffle arrangement within a 1.35 m culvert. Rectangles represent wooden spoiler baffles (0.25 m length, 0.12 m width and 0.12 m height). Dotted lines signify the culvert edges where the array was installed to (1.32 m). Rows of baffles are staggered and alternate in rows of five and six spoilers. All dimensions are in metres.
0.12
0.12
0.12
0.12
0.12
0.12
0.12
0.25 0.20
0.45
1.3
2
Testing the effectiveness of fish passage solutions 31
Figure 6-16: Wooden spoiler baffles (0.25 m length, 0.12 m width and 0.12 m height) installed in a 1.3 m diameter culvert. Spoiler baffles are attached to the concrete with stainless steel bolts.
32 Testing the effectiveness of fish passage solutions
7 Conclusions and recommendations Effective retrofit fish passes at low-head obstacles requires the transfer of scientific knowledge into
practical engineering solutions. There are a wide range of innovative and cost-effective solutions
being developed and implemented, but with little monitoring or testing to ensure that they meet
best practice guidelines. The present case study at Upper Kingston has highlighted how bottlenecks
to fish passage can still develop even when best practice guidelines are followed. It is therefore
advisable to carry out robust testing of retrofit solutions to ensure they are fit for purpose prior to
widespread installation. This will improve the confidence in the effectiveness of different solutions,
and stakeholders will be more willing to invest in implementing solutions for restoring fish passage.
7.1 Recommendations for Upper Kingston
7.1.1 Maintenance
After retrofitting the culvert apron at Upper Kingston, it is advisable to monitor the baffles to ensure
that waterborne debris or large bedload movements don’t build up between the baffles. Both debris
and sediment could reduce spoiler baffle efficacy by becoming trapped between spoilers and
preventing water velocities from being reduced, as well as reducing the physical resting area
available for fish. It is anticipated that any sediment deposition will be transient and removed in
subsequent flood waters, however, stubborn debris may require occasional removal.
7.1.2 Monitoring
As Upper Kingston culvert has been used as a case-study for examining the effectiveness of rock-
ramp retrofits in promoting passage of inanga, it provides an opportunity to fully document the
success of the fish passage solution. The combined approach of BACI surveys and mark and recapture
trials would provide the most comprehensive assessment of fish passage success. After retrofitting
spoiler baffles to the culvert apron, carrying out a further mark and recapture trial to assess the
effectiveness of the final solution is recommended. As electric-fishing surveys were carried out below
and above the culvert prior to remediation, completion of the BACI surveys can then be undertaken
to document changes to the fish community upstream of the remediated structure and therefore
assess the effectiveness of the solution across a range of fish species. Ideally, electric-fishing surveys
above and below the culvert should be carried out annually in January until changes to the upstream
fish community are clear. If feasible, carrying out the first electric-fishing surveys upstream and
downstream of the structure in January 2015, prior to retrofitting the apron, would provide
additional information on fish passage success during spring/summer 2014/15.
If time or cost prohibits a complete monitoring approach, then carrying out electric-fishing surveys
above and below the culvert in summer 2016 (after retrofitting the culvert apron) would be
recommended as the minimum method for assessing the effectiveness of the final fish passage
solution.

Testing the effectiveness of fish passage solutions 33
8 Acknowledgements I wish to thank NIWA staff Joshua Smith for assistance with the field work and Kathryn Reeve for
assistance with data entry. I also wish to thank Horizons staff, in particular, Lucy Ferguson, Toni Shell,
Anna Deverall and Michael Patterson for assistance with fish collection and field trials.
9 References Cowx, I.G. (1983) Review of the methods for estimating fish population size from survey
removal data. Fisheries Management, 14: 67-82.
Crow, S., Jellyman, P. (2014) Temporal variability in electric-fishing catch and differences
between population estimates generated with and without stop-nets. Integration: the
final frontier: 2014 Water Symposium, Blenheim 24-28 November 2014.
Goodman, J.M., Dunn, N.R., Ravenscroft, P.J., Allibone, R.M., Boubée, J., David, B., Griffiths,
M., Ling, N., Hitchmough, R.A., Rolfe, J.R. (2014) Conservation status of New Zealand
freshwater fish, 2013. New Zealand Threat Classification Series 7. Department of
Conservation, Wellington.
Stevenson, C., Baker, C.F. (2009) Fish passage guidelines for the Auckland region – 2009.
Prepared by NIWA for Auckland Regional Council. Auckland Regional Council Technical
Publication 2009-084: 81.
Stevenson, C., Kopeinig, T., Feurich, R., Boubée, J. (2006) Culvert barrel design to facilitate
the upstream passage of small fish. Prepared by NIWA for Auckland Regional Council.
Auckland Regional Council Technical Publication 2008-366: 44.
34 Testing the effectiveness of fish passage solutions
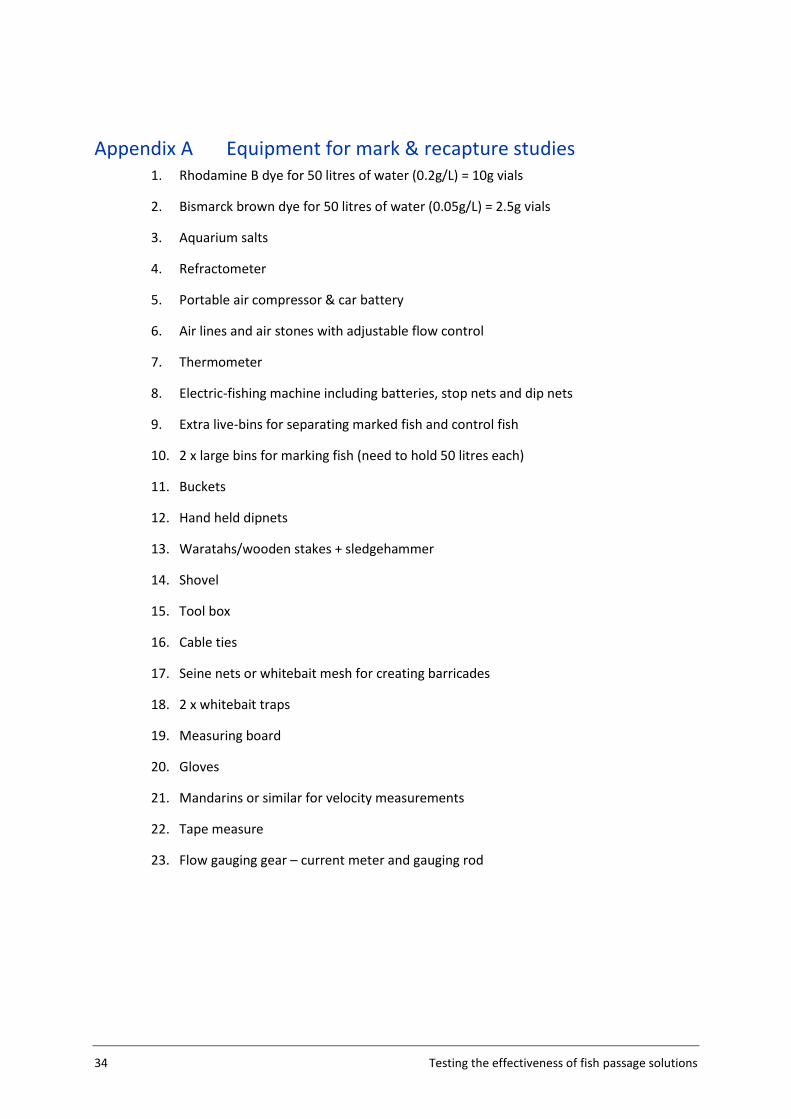
Appendix A Equipment for mark & recapture studies 1. Rhodamine B dye for 50 litres of water (0.2g/L) = 10g vials
2. Bismarck brown dye for 50 litres of water (0.05g/L) = 2.5g vials
3. Aquarium salts
4. Refractometer
5. Portable air compressor & car battery
6. Air lines and air stones with adjustable flow control
7. Thermometer
8. Electric-fishing machine including batteries, stop nets and dip nets
9. Extra live-bins for separating marked fish and control fish
10. 2 x large bins for marking fish (need to hold 50 litres each)
11. Buckets
12. Hand held dipnets
13. Waratahs/wooden stakes + sledgehammer
14. Shovel
15. Tool box
16. Cable ties
17. Seine nets or whitebait mesh for creating barricades
18. 2 x whitebait traps
19. Measuring board
20. Gloves
21. Mandarins or similar for velocity measurements
22. Tape measure
23. Flow gauging gear – current meter and gauging rod


Recommended