Supplementary Material Prasad et al.
1
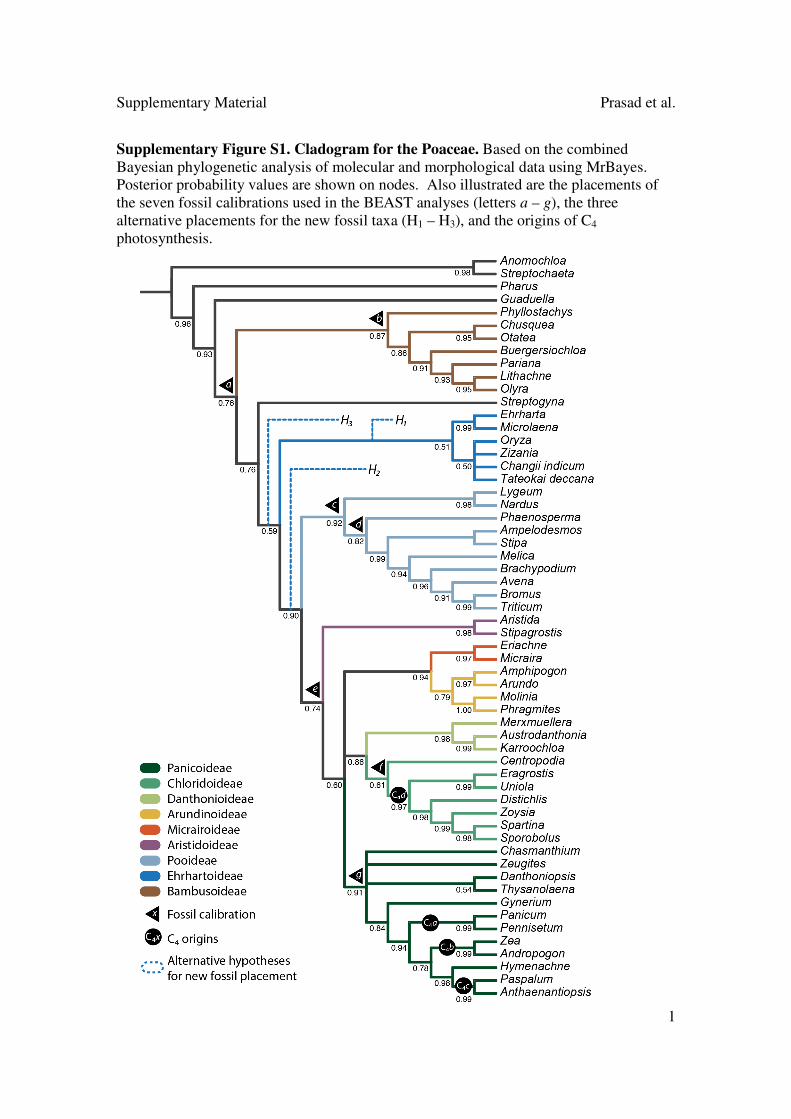
Supplementary Figure S1. Cladogram for the Poaceae. Based on the combined
Bayesian phylogenetic analysis of molecular and morphological data using MrBayes.
Posterior probability values are shown on nodes. Also illustrated are the placements of
the seven fossil calibrations used in the BEAST analyses (letters a – g), the three
alternative placements for the new fossil taxa (H1 – H3), and the origins of C4
photosynthesis.

Supplementary Material Prasad et al.
2
Supplementary Figure S2. Posterior probability distributions for divergence times estimated in BEAST v1.6.1. Distributions change significantly with the inclusion of the
new fossil taxa.
Supplementary Material Prasad et al.
3
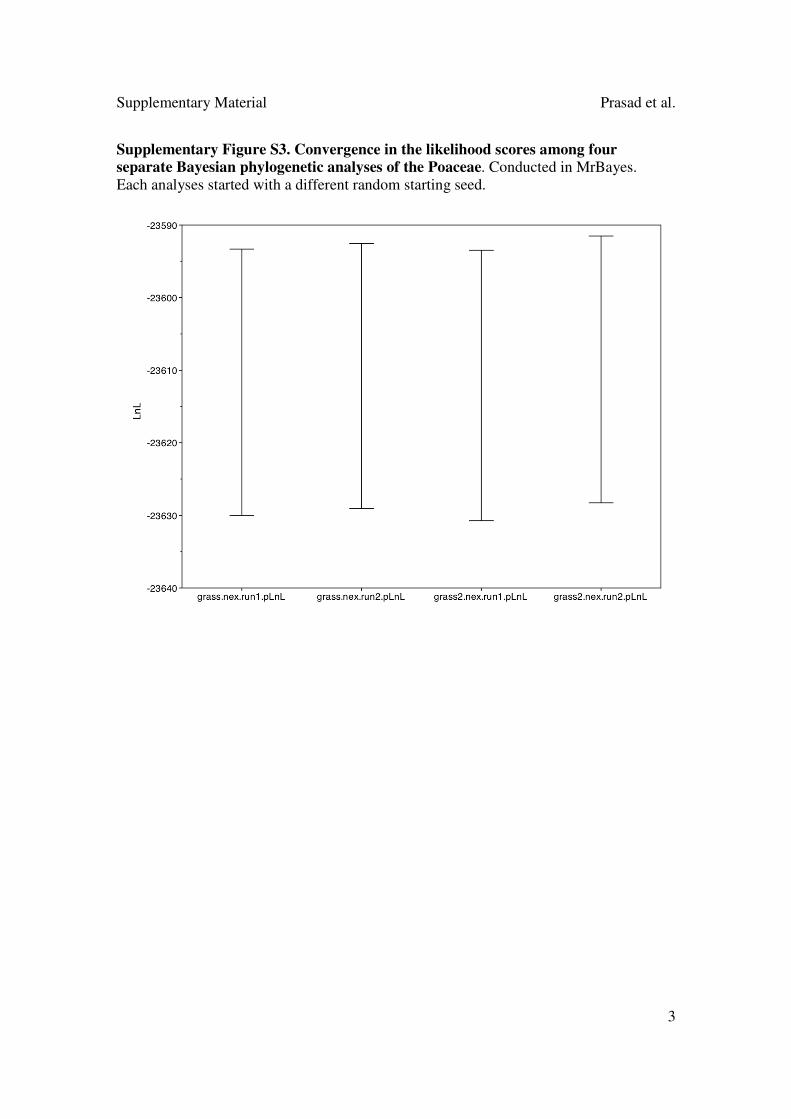
Supplementary Figure S3. Convergence in the likelihood scores among four
separate Bayesian phylogenetic analyses of the Poaceae. Conducted in MrBayes.
Each analyses started with a different random starting seed.

Supplementary Material Prasad et al.
4
Supplementary Figure S4. Frequency distribution of likelihood scores for trees
combined from four separate Bayesian phylogenetic analyses of the Poaceae.
Supplementary Material Prasad et al.
5
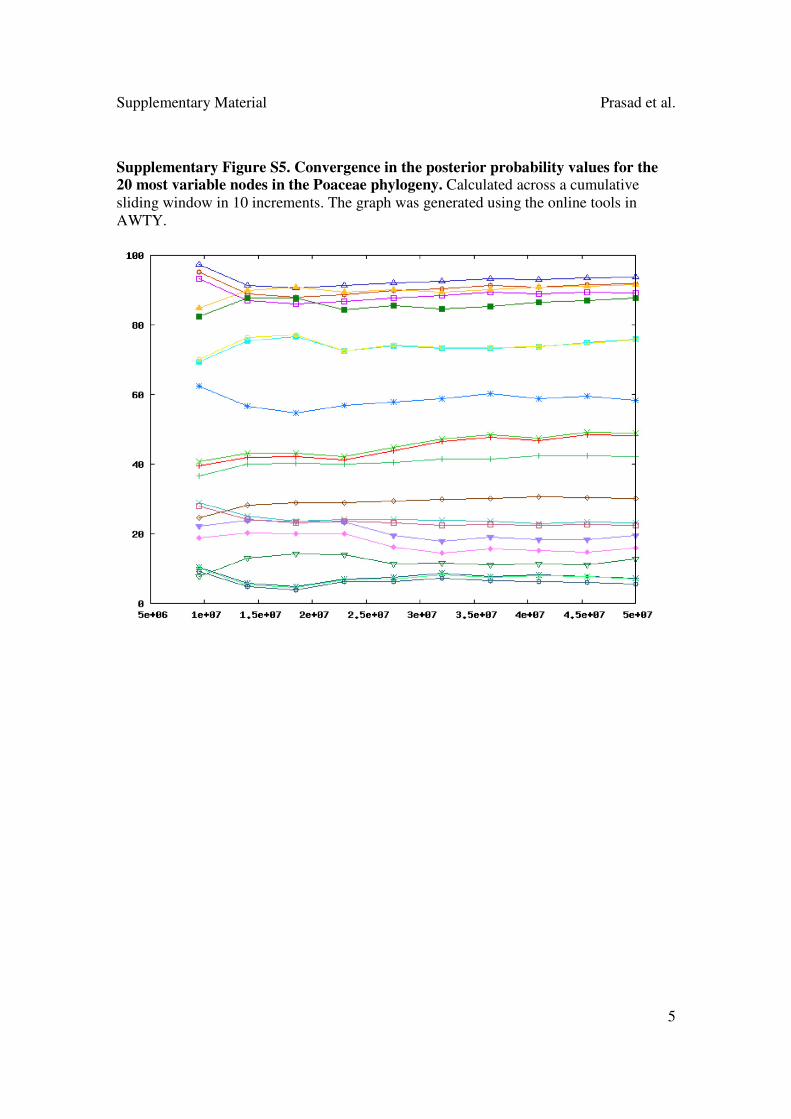
Supplementary Figure S5. Convergence in the posterior probability values for the 20 most variable nodes in the Poaceae phylogeny. Calculated across a cumulative
sliding window in 10 increments. The graph was generated using the online tools in
AWTY.
Supplementary Material Prasad et al.
6
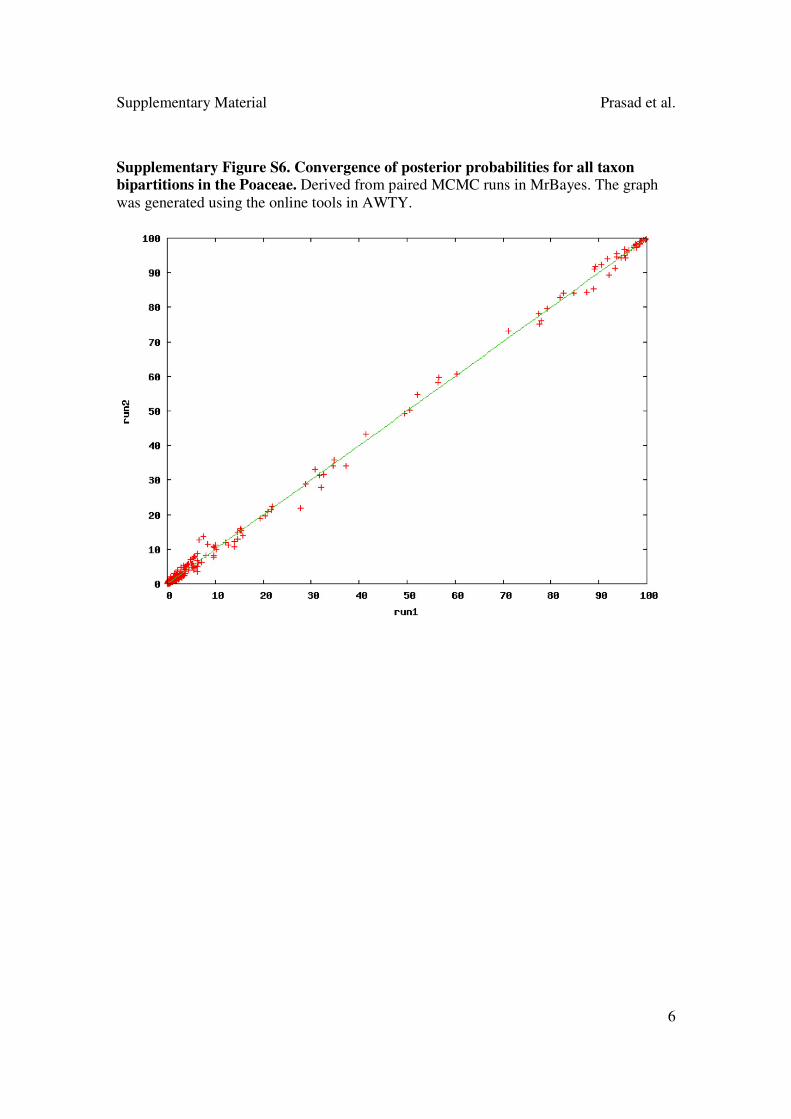
Supplementary Figure S6. Convergence of posterior probabilities for all taxon bipartitions in the Poaceae. Derived from paired MCMC runs in MrBayes. The graph
was generated using the online tools in AWTY.
Supplementary Material Prasad et al.
7
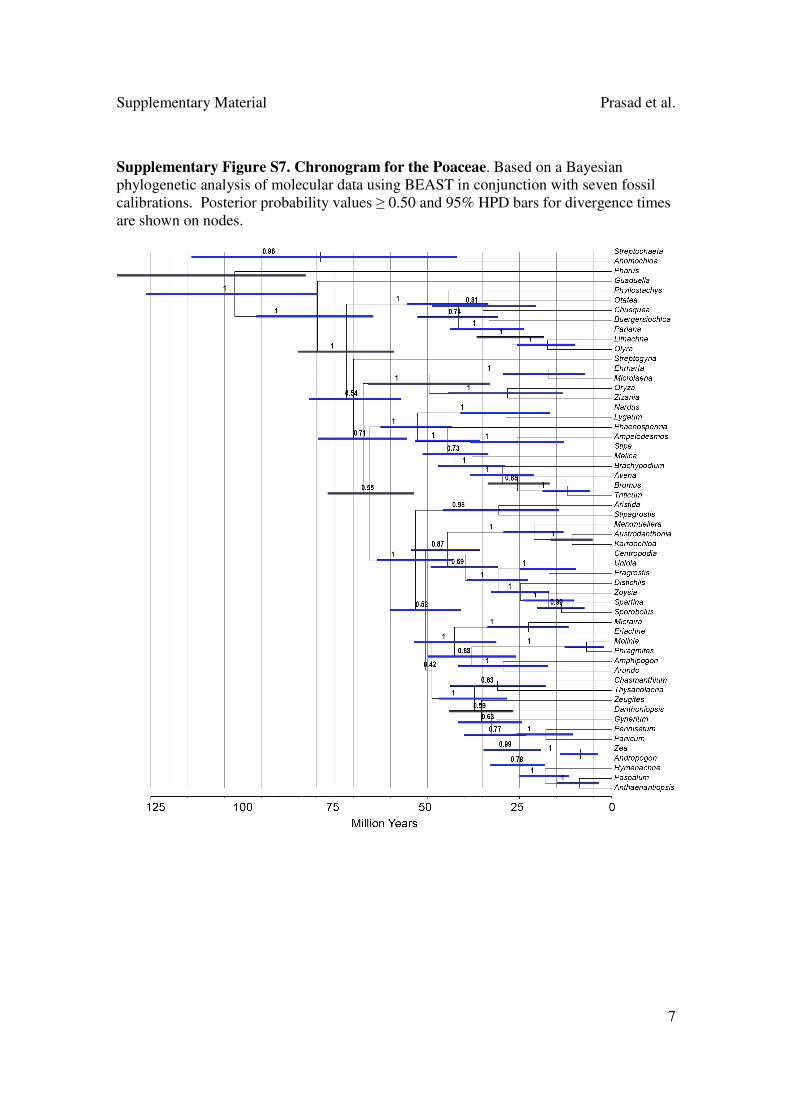
Supplementary Figure S7. Chronogram for the Poaceae. Based on a Bayesian
phylogenetic analysis of molecular data using BEAST in conjunction with seven fossil
calibrations. Posterior probability values ≥ 0.50 and 95% HPD bars for divergence times
are shown on nodes.
Supplementary Material Prasad et al.
8
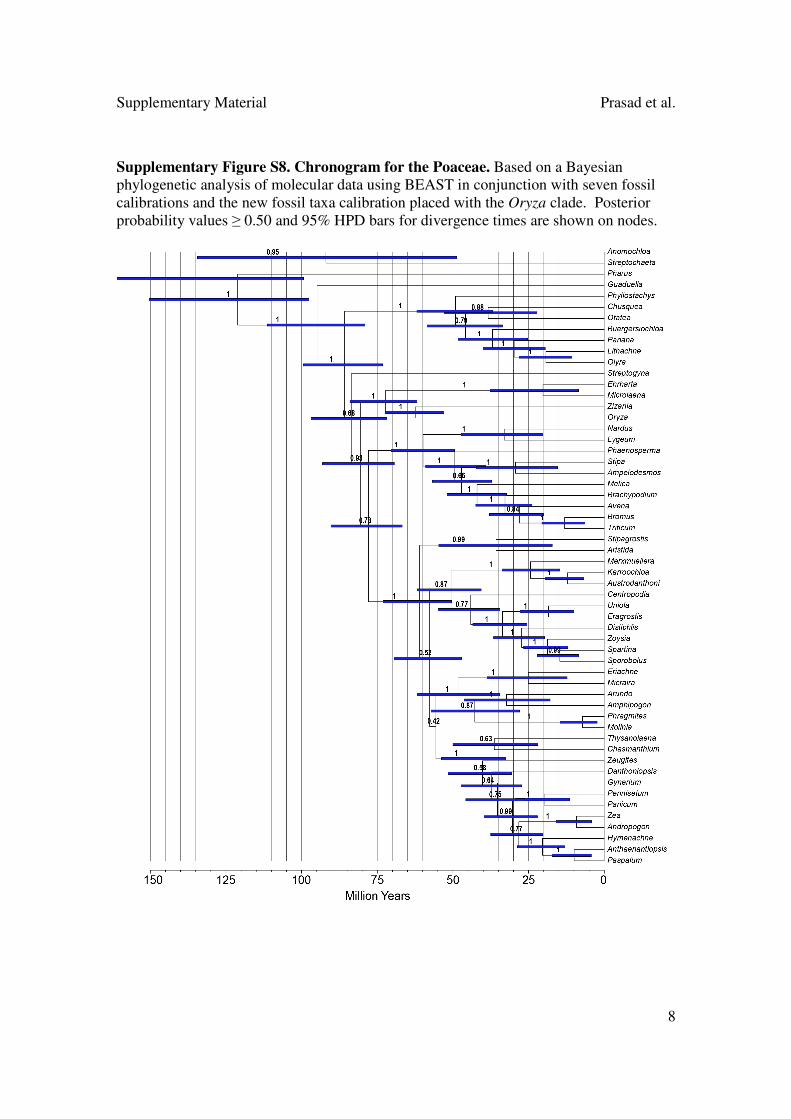
Supplementary Figure S8. Chronogram for the Poaceae. Based on a Bayesian
phylogenetic analysis of molecular data using BEAST in conjunction with seven fossil
calibrations and the new fossil taxa calibration placed with the Oryza clade. Posterior
probability values ≥ 0.50 and 95% HPD bars for divergence times are shown on nodes.
Supplementary Material Prasad et al.
9
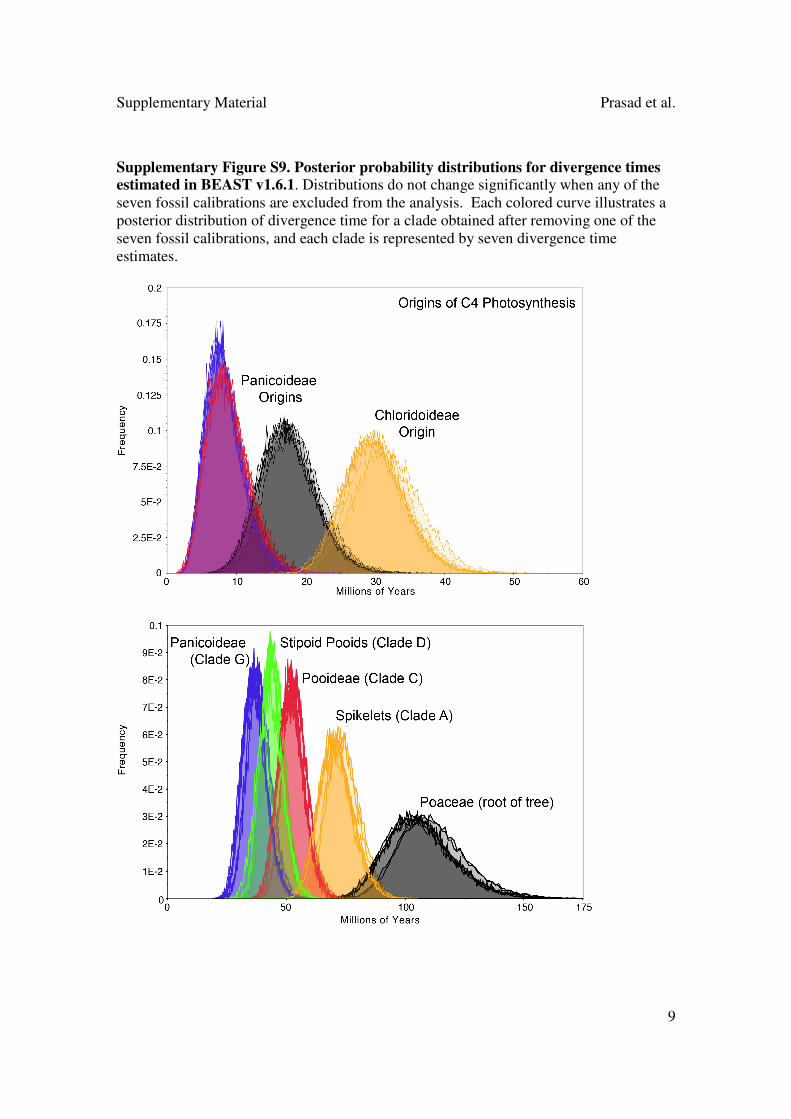
Supplementary Figure S9. Posterior probability distributions for divergence times estimated in BEAST v1.6.1. Distributions do not change significantly when any of the
seven fossil calibrations are excluded from the analysis. Each colored curve illustrates a
posterior distribution of divergence time for a clade obtained after removing one of the
seven fossil calibrations, and each clade is represented by seven divergence time
estimates.

Supplementary Material Prasad et al.
10
Supplementary Table S1. Morphological character matrix.*
Supplementary Material Prasad et al.
11
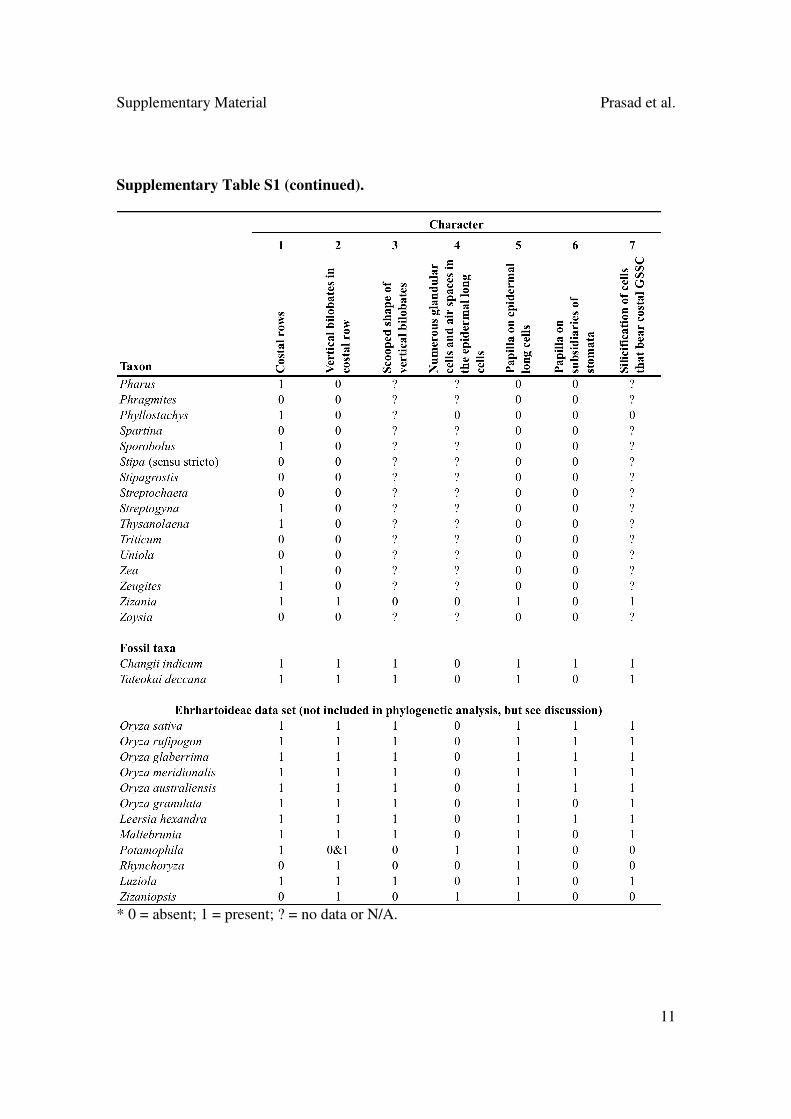
Supplementary Table S1 (continued).
* 0 = absent; 1 = present; ? = no data or N/A.
Supplementary Material Prasad et al.
12
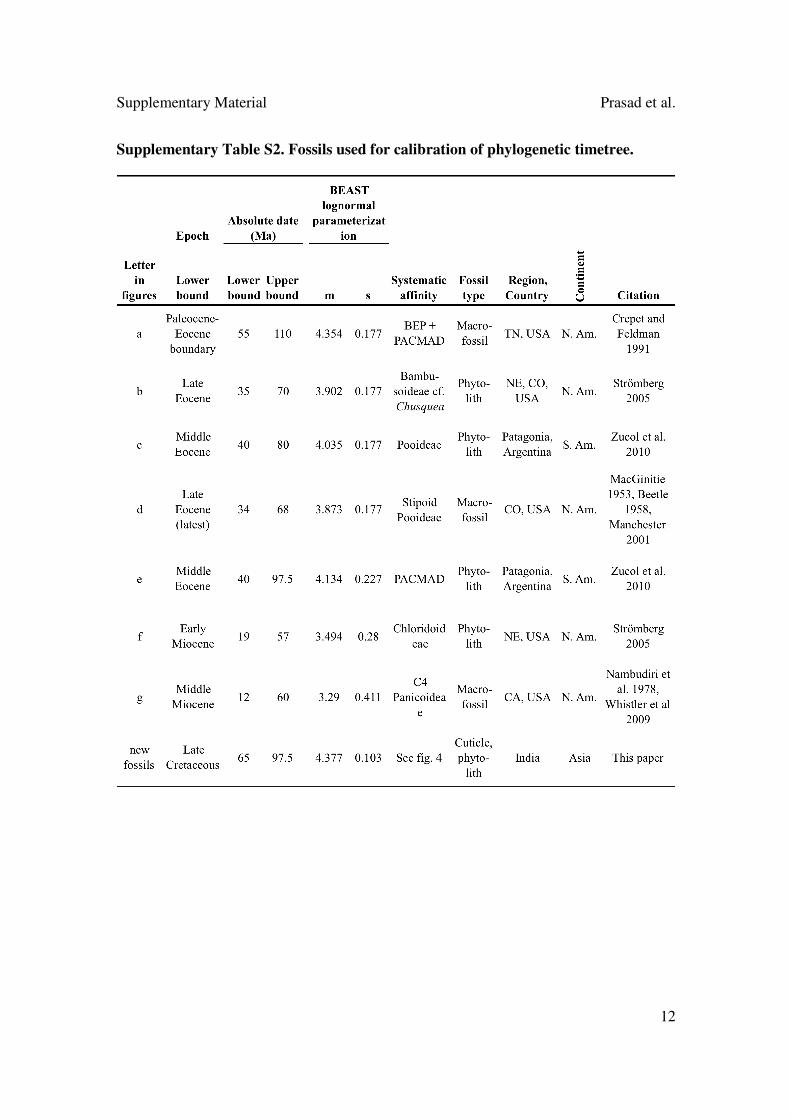
Supplementary Table S2. Fossils used for calibration of phylogenetic timetree.
Supplementary Material Prasad et al.
13
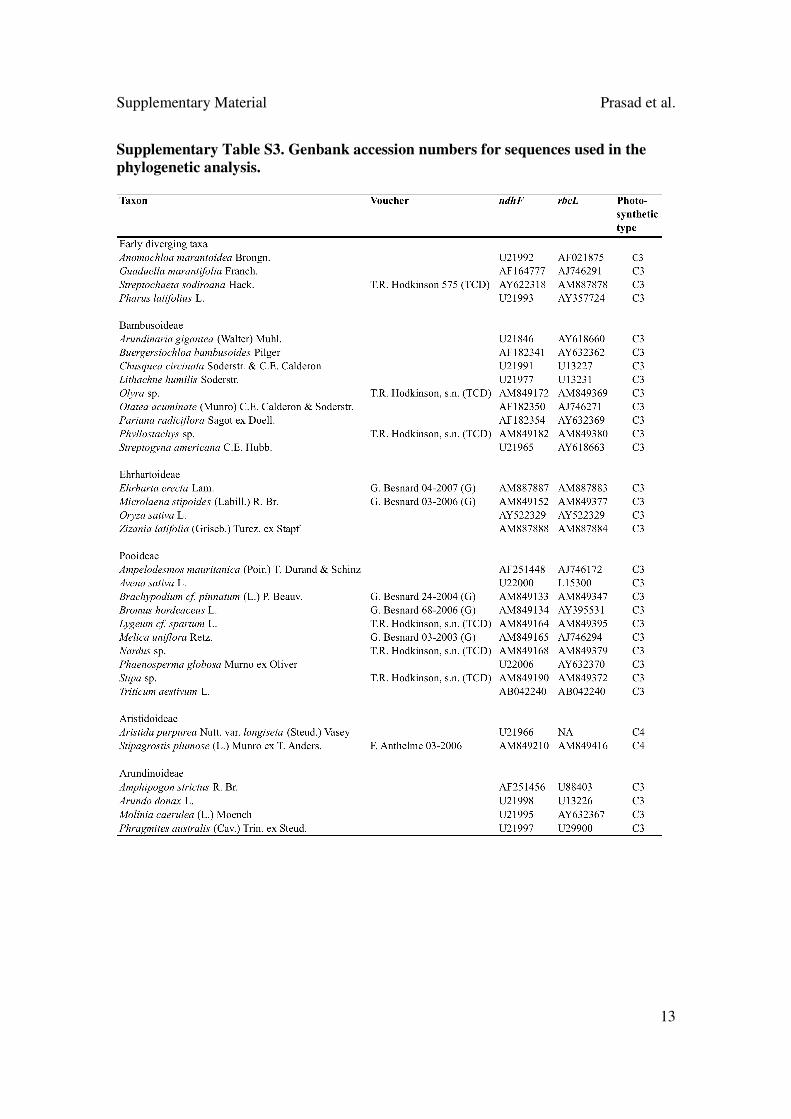
Supplementary Table S3. Genbank accession numbers for sequences used in the
phylogenetic analysis.

Supplementary Material Prasad et al.
14
Supplementary Table S3 (continued).

Supplementary Material Prasad et al.
15
Supplementary Table S4. Marginal posterior probability distributions for ancestral
state estimates.*
* In cells with two numbers: regular = without fossils; bold = with fossils. All other cells:
posterior probability identical whether fossils included or not. Character states: 0 =
absent; 1 = present.
Recommended