0
FTF Niche Project No. 1071-20-505-1
2012
Iowa State University Submitted by, Margaret Smith and Linda Naeve
Strengthening Value Chains for Maize and Soybeans for Ugandan Women Farmers
Final Report
1
Strengthening Value Chains for Maize and Soybeans for Ugandan Women Farmers
FTF Niche Project No. 1071-20-505-1
Iowa State University
Final Report
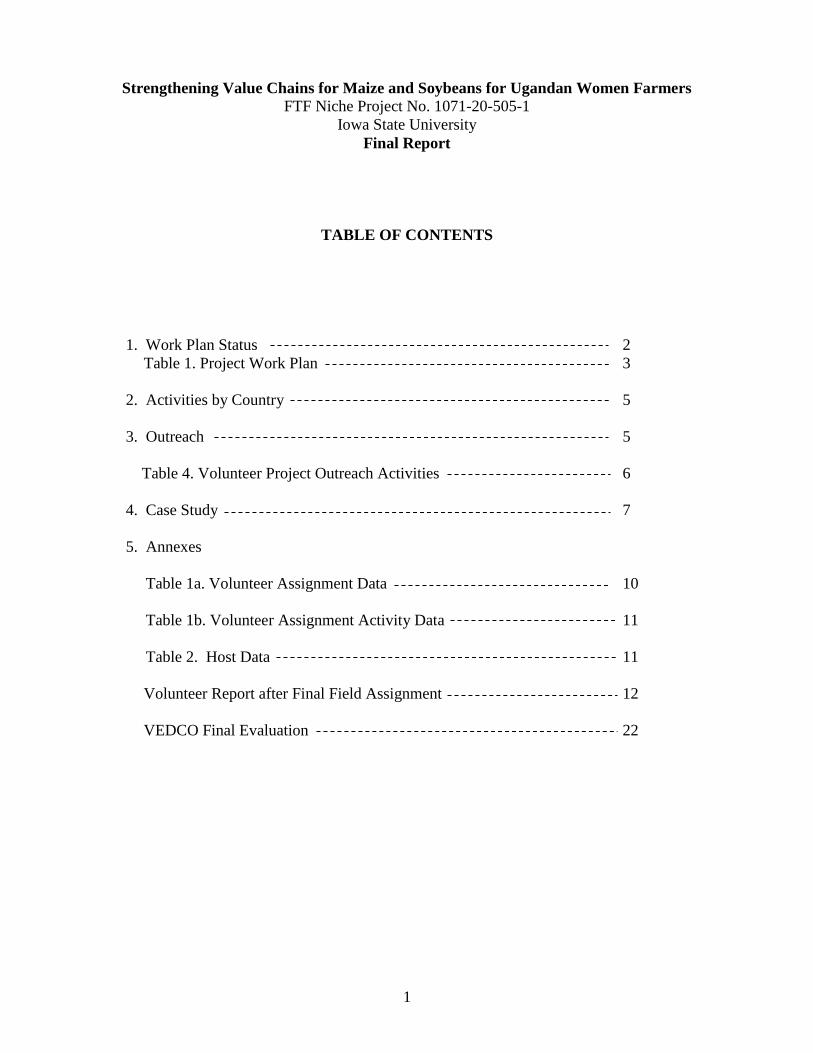
TABLE OF CONTENTS
1. Work Plan Status 2
Table 1. Project Work Plan 3
2. Activities by Country 5
3. Outreach 5
Table 4. Volunteer Project Outreach Activities 6
4. Case Study 7
5. Annexes
Table 1a. Volunteer Assignment Data 10
Table 1b. Volunteer Assignment Activity Data 11
Table 2. Host Data 11
Volunteer Report after Final Field Assignment 12
VEDCO Final Evaluation 22
2
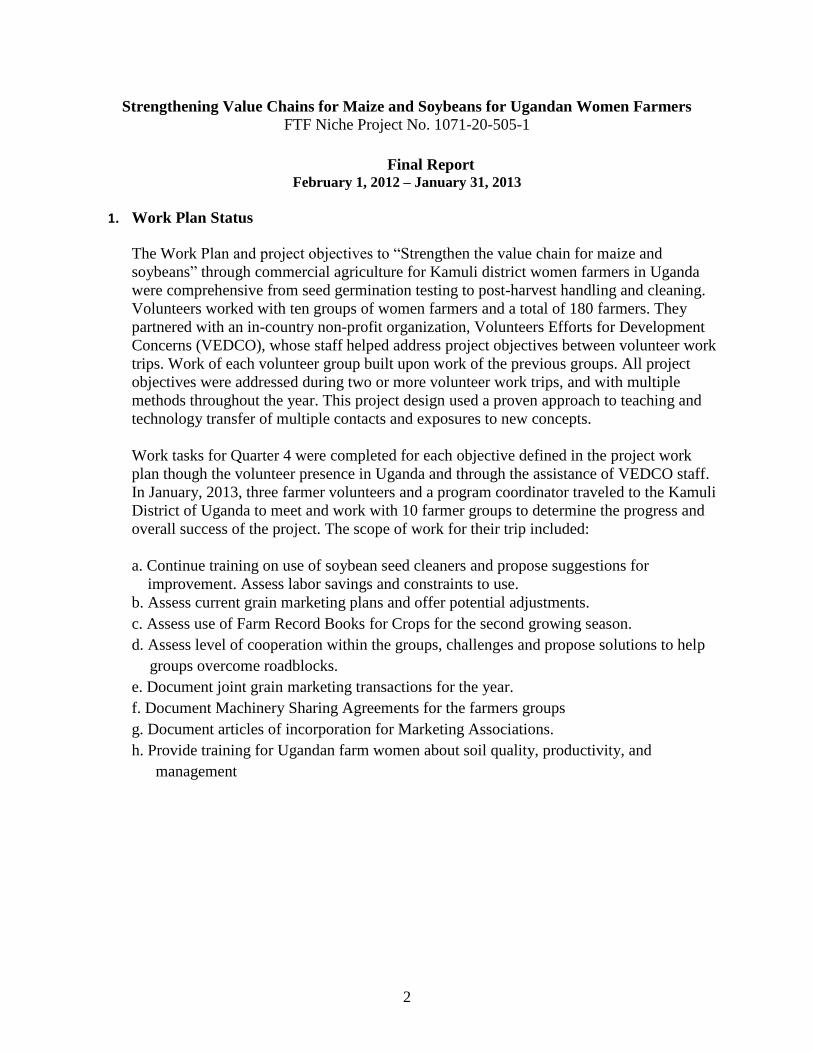
Strengthening Value Chains for Maize and Soybeans for Ugandan Women Farmers
FTF Niche Project No. 1071-20-505-1
Final Report
February 1, 2012 – January 31, 2013
1. Work Plan Status The Work Plan and project objectives to “Strengthen the value chain for maize and
soybeans” through commercial agriculture for Kamuli district women farmers in Uganda
were comprehensive from seed germination testing to post-harvest handling and cleaning.
Volunteers worked with ten groups of women farmers and a total of 180 farmers. They
partnered with an in-country non-profit organization, Volunteers Efforts for Development
Concerns (VEDCO), whose staff helped address project objectives between volunteer work
trips. Work of each volunteer group built upon work of the previous groups. All project
objectives were addressed during two or more volunteer work trips, and with multiple
methods throughout the year. This project design used a proven approach to teaching and
technology transfer of multiple contacts and exposures to new concepts.
Work tasks for Quarter 4 were completed for each objective defined in the project work
plan though the volunteer presence in Uganda and through the assistance of VEDCO staff.
In January, 2013, three farmer volunteers and a program coordinator traveled to the Kamuli
District of Uganda to meet and work with 10 farmer groups to determine the progress and
overall success of the project. The scope of work for their trip included:
a. Continue training on use of soybean seed cleaners and propose suggestions for
improvement. Assess labor savings and constraints to use.
b. Assess current grain marketing plans and offer potential adjustments.
c. Assess use of Farm Record Books for Crops for the second growing season.
d. Assess level of cooperation within the groups, challenges and propose solutions to help
groups overcome roadblocks.
e. Document joint grain marketing transactions for the year.
f. Document Machinery Sharing Agreements for the farmers groups
g. Document articles of incorporation for Marketing Associations.
h. Provide training for Ugandan farm women about soil quality, productivity, and
management
3
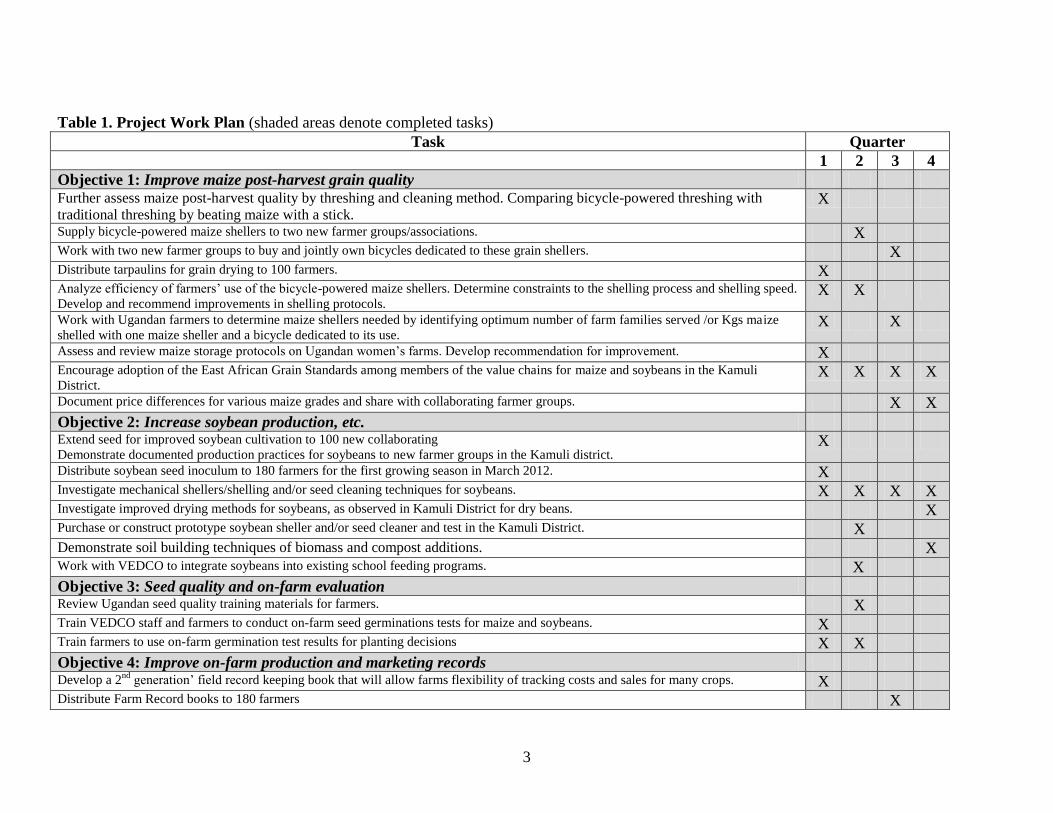
Table 1. Project Work Plan (shaded areas denote completed tasks)
Task Quarter
1 2 3 4
Objective 1: Improve maize post-harvest grain quality Further assess maize post-harvest quality by threshing and cleaning method. Comparing bicycle-powered threshing with
traditional threshing by beating maize with a stick. X
Supply bicycle-powered maize shellers to two new farmer groups/associations. X Work with two new farmer groups to buy and jointly own bicycles dedicated to these grain shellers. X Distribute tarpaulins for grain drying to 100 farmers. X Analyze efficiency of farmers’ use of the bicycle-powered maize shellers. Determine constraints to the shelling process and shelling speed.
Develop and recommend improvements in shelling protocols. X X
Work with Ugandan farmers to determine maize shellers needed by identifying optimum number of farm families served /or Kgs maize
shelled with one maize sheller and a bicycle dedicated to its use. X X
Assess and review maize storage protocols on Ugandan women’s farms. Develop recommendation for improvement. X Encourage adoption of the East African Grain Standards among members of the value chains for maize and soybeans in the Kamuli
District. X X X X
Document price differences for various maize grades and share with collaborating farmer groups. X X
Objective 2: Increase soybean production, etc. Extend seed for improved soybean cultivation to 100 new collaborating
Demonstrate documented production practices for soybeans to new farmer groups in the Kamuli district. X
Distribute soybean seed inoculum to 180 farmers for the first growing season in March 2012. X Investigate mechanical shellers/shelling and/or seed cleaning techniques for soybeans. X X X X Investigate improved drying methods for soybeans, as observed in Kamuli District for dry beans. X Purchase or construct prototype soybean sheller and/or seed cleaner and test in the Kamuli District. X Demonstrate soil building techniques of biomass and compost additions. X Work with VEDCO to integrate soybeans into existing school feeding programs. X
Objective 3: Seed quality and on-farm evaluation Review Ugandan seed quality training materials for farmers. X Train VEDCO staff and farmers to conduct on-farm seed germinations tests for maize and soybeans. X Train farmers to use on-farm germination test results for planting decisions X X
Objective 4: Improve on-farm production and marketing records Develop a 2
nd generation’ field record keeping book that will allow farms flexibility of tracking costs and sales for many crops. X
Distribute Farm Record books to 180 farmers X
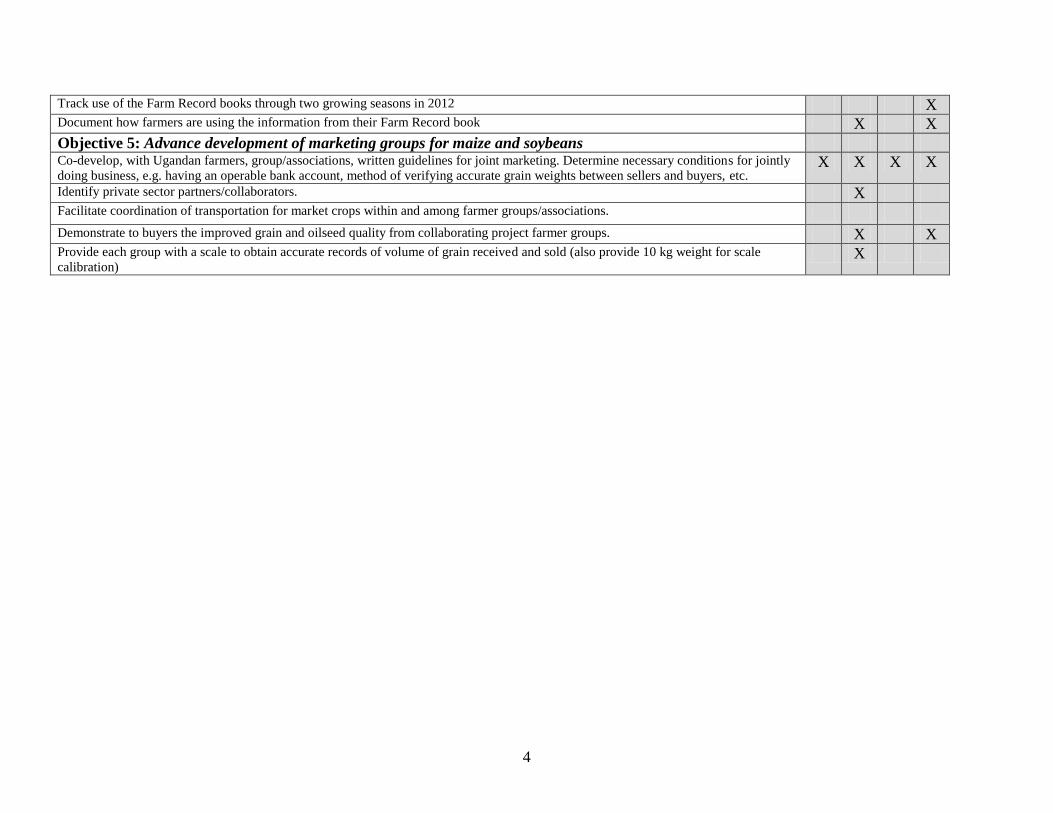
4
Track use of the Farm Record books through two growing seasons in 2012 X Document how farmers are using the information from their Farm Record book X X
Objective 5: Advance development of marketing groups for maize and soybeans Co-develop, with Ugandan farmers, group/associations, written guidelines for joint marketing. Determine necessary conditions for jointly
doing business, e.g. having an operable bank account, method of verifying accurate grain weights between sellers and buyers, etc. X X X X
Identify private sector partners/collaborators. X Facilitate coordination of transportation for market crops within and among farmer groups/associations.
Demonstrate to buyers the improved grain and oilseed quality from collaborating project farmer groups. X X Provide each group with a scale to obtain accurate records of volume of grain received and sold (also provide 10 kg weight for scale
calibration) X

5
2. Activities by Country
All project activities were conducted in the Kamuli District of Uganda.
3. Outreach
Iowa women Farmer-to-Farmer volunteers were featured in local newspapers and
newsletter articles in 2012, sharing their volunteer experiences and the work they
conducted while in Uganda. During two trips, volunteers posted blogs discussing their
daily activities in Uganda.
Volunteers also gave 14 face-to-face presentations to community service groups, women in
agriculture and beginning farmer conferences, church groups, school groups, US Senate
Agriculture Committee, and to family and friends.
Other outreach included:
an interview about the project with volunteer, April Hemmes, that appeared online
at www.americasfarmers.com. She also wrote a blog during her work trip in
August, 2012, that was carried on the same website.
Volunteers Jenny Thomas, Paul Mugge and Connie Tjelmeland wrote a daily blog
during their volunteer service that was posted on the Extension Value Added
Agriculture website (http://www.extension.iastate.edu/valueaddedag/international-
agriculture).
An article, PFI Members help Women Farmers in Uganda, was published in the
Practical Farmers of Iowa (PFI) spring, 2013 quarterly news magazine. The
magazine is distributed to 2,100 members of this sustainable agriculture
organization. Available online at: http://www.practicalfarmers.org/news/index.html
Four volunteers also posted about their experiences on Facebook. They reached
over 1,000 people through their outreach efforts (Table 2). Additional presentations
are scheduled for later in 2013.
6
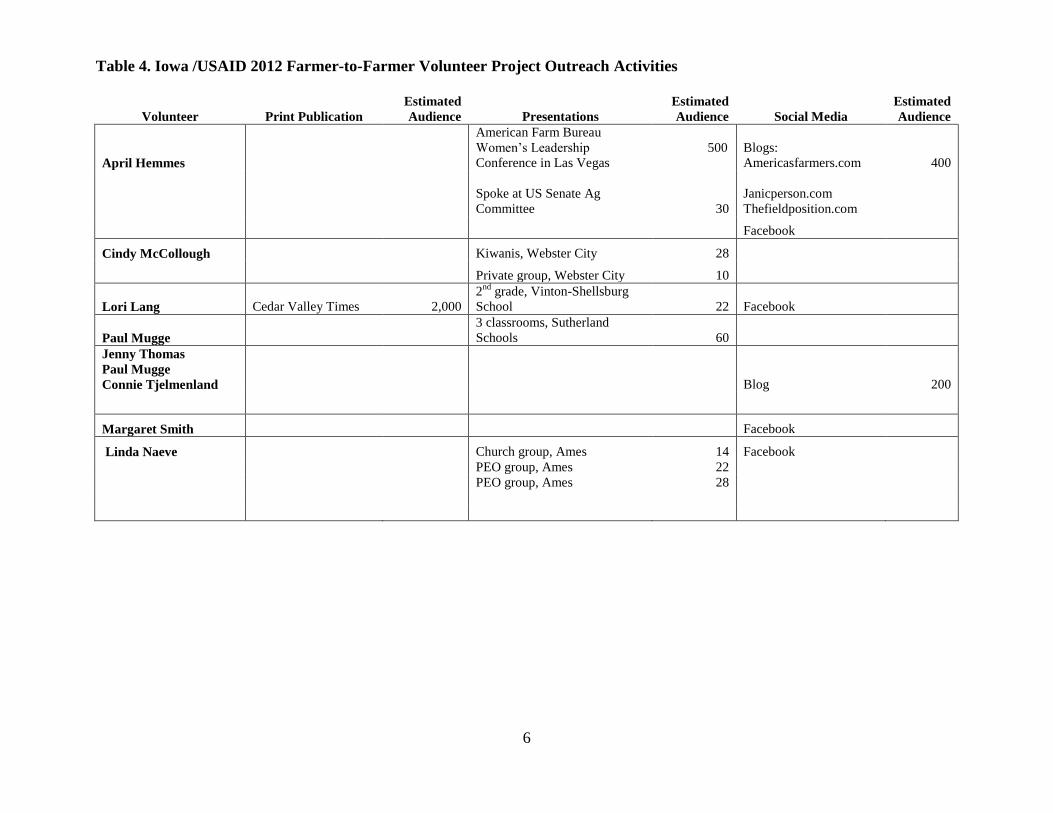
Table 4. Iowa /USAID 2012 Farmer-to-Farmer Volunteer Project Outreach Activities
Volunteer Print Publication
Estimated
Audience Presentations
Estimated
Audience Social Media
Estimated
Audience
April Hemmes
American Farm Bureau
Women’s Leadership
Conference in Las Vegas
500
Blogs:
Americasfarmers.com 400
Spoke at US Senate Ag
Committee 30
Janicperson.com
Thefieldposition.com
Cindy McCollough Kiwanis, Webster City 28
Private group, Webster City 10
Lori Lang Cedar Valley Times 2,000
2nd
grade, Vinton-Shellsburg
School 22 Facebook
Paul Mugge
3 classrooms, Sutherland
Schools 60
Jenny Thomas
Paul Mugge
Connie Tjelmenland Blog 200
Margaret Smith Facebook
Linda Naeve Church group, Ames 14 Facebook
PEO group, Ames 22
PEO group, Ames 28
7
4. Case Study
a. Challenge
Ugandan women farmers in the Kamuli district of Uganda face several challenges
growing, harvesting, cleaning and marketing their grain and oilseed crops. These include:
The farmers lose a significant amount of their crops due to improper post-harvest
handling and storage
Effective resources and equipment are yet available to the farmers to efficiently
clean soybeans and field beans for home consumption or commercial sales.
Manual winnowing of soybeans causes respiratory problems and allergic skin
reactions due to the dust and particle fragments.
Although the women farmers understand the basics of soybean production, they
were unfamiliar with the importance of seed germination testing and strategies to
improve soil quality.
The farmers’ limited business skills reduce their ability to access better markets
and profitability. They need additional training and understanding of record
keeping and have had minimal negotiating power with “middlemen” buyers to
obtain a fair price for their crops.
b. Initiative
Farmer-to-farmer volunteers from Iowa, working in the Kamuli district of Uganda,
focused on improving crop management and marketing skills with 180 Ugandan women
farmers through five objectives:
Improve maize grain quality, storage, and economic value in the marketplace
Increase production of, and improve soil management, harvest, drying, and
threshing techniques for soybeans
Provide education about seed quality and encourage adoption of on-farm
evaluation of open- pollinated maize and soybean seed before planting
Improve on-farm production and marketing written record keeping
Advance development of female-directed marketing groups/associations for
marketing maize and soybeans.
Volunteers provided training on post-harvest grain handling techniques for maize and
soybeans and demonstrated a hand-operated seed cleaner for soybeans and dry beans.
Project coordinators developed a simple farm record book and taught farmers to track
their production, input and marketing expenses to determine profitability for specific
crops. Volunteers also provided training on field mapping and soil quality factors.
c. Results: As a result of the USAID Farmer to Farmer Project:
90% of participating farmers in the Kamuli District dried their grain crops on
tarpaulins, rather than on the ground.
88% of project farmers kept written farm records in 2012. 96% of the farmers want
to continue keeping written records, are willing to pay 1,000 UGX for a Record Book
and requested more training in recordkeeping.
8
23% of project farmers collectively marketed grains in 2012 and received a 25%
higher price than for grain sold individually. 83% of farmers are interested in
collective grain marketing for 2013.
All project farmers planted soybeans in 2012 compared to less than 5% in 2010.
92% plan to grow soybeans in 2013. Farmers sold 36% of their soybeans and kept
the remainder for seed and family consumption.
96% of farmers reported increased household incomes due to participation in this
project, enabling them to pay school and medical bills, lease additional land and
purchase additional agro-inputs.
d. Knowledge generation and sharing
Iowa farmer volunteers, participating Ugandan farmers and VEDCO staff members
worked to capture and disseminate the knowledge developed during this project through:
their reports, newspaper interviews, presentations, and blog.
the Farm Record Books for Crops that was revised with input and advice from our
Ugandan collaborating farmers. This record book will be shared and its use taught
to other Ugandan farmers participating in VEDCO project.
one-on-one advice that FtF participants shared verbally with other Kamuli district
farmers about post-harvest grain handling, soybean production, written farm
recordkeeping, and collaborative grain marketing.
Indications of dissemination included the expansion of the number of farmers growing
soybeans in the second cropping season of 2012. Project farmers sold, and/or shared seed
from the improved soybean cultivar with neighboring farmers who then planted them in
the second growing season.
Information on this Farmer to Farmer project was shared with the public through:
websites and blogs
print media-----newspapers, newsletters, and a national agricultural magazine
oral and visual presentations by volunteers to Iowa farm, church, and service
groups. Presentations included still photos and video
one-on-one communication among Ugandan farmers
group communication from VEDCO staff to additional non-project farmers
conversations among Uganda farmers in the Kamuli district
9
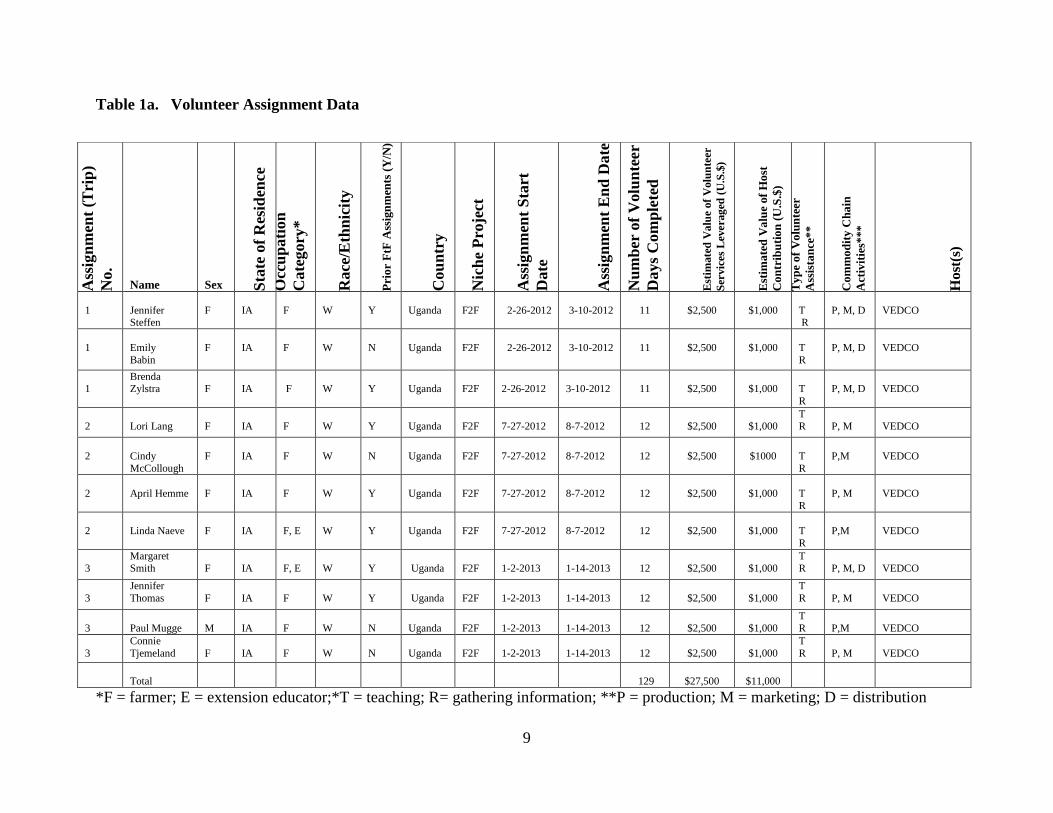
Table 1a. Volunteer Assignment Data
*F = farmer; E = extension educator;*T = teaching; R= gathering information; **P = production; M = marketing; D = distribution
Ass
ign
men
t (T
rip
)
No.
Name Sex Sta
te o
f R
esid
ence
Occ
up
ati
on
Cate
gory
*
Race
/Eth
nic
ity
Pri
or
FtF
Ass
ign
men
ts (
Y/N
)
Cou
ntr
y
Nic
he
Pro
ject
Ass
ign
men
t S
tart
Date
Ass
ign
men
t E
nd
Date
Nu
mb
er o
f V
olu
nte
er
Days
Com
ple
ted
Est
imate
d V
alu
e of
Volu
nte
er
Ser
vic
es
Levera
ged
(U
.S.$
)
Est
ima
ted
Va
lue
of
Ho
st
Co
ntr
ibu
tio
n (
U.S
.$)
Ty
pe
of
Vo
lun
teer
Ass
ista
nce
**
Co
mm
od
ity
Ch
ain
Act
ivit
ies*
**
Host
(s)
1
Jennifer Steffen
F
IA
F
W
Y
Uganda
F2F
2-26-2012
3-10-2012
11
$2,500
$1,000
T R
P, M, D
VEDCO
1
Emily
Babin
F
IA
F
W
N
Uganda
F2F
2-26-2012
3-10-2012
11
$2,500
$1,000
T
R
P, M, D
VEDCO
1
Brenda Zylstra
F
IA
F
W
Y
Uganda
F2F
2-26-2012
3-10-2012
11
$2,500
$1,000
T
R
P, M, D
VEDCO
2
Lori Lang
F
IA
F
W
Y
Uganda
F2F
7-27-2012
8-7-2012
12
$2,500
$1,000
T
R
P, M
VEDCO
2
Cindy
McCollough
F
IA
F
W
N
Uganda
F2F
7-27-2012
8-7-2012
12
$2,500
$1000
T
R
P,M
VEDCO
2
April Hemme
F
IA
F
W
Y
Uganda
F2F
7-27-2012
8-7-2012
12
$2,500
$1,000
T
R
P, M
VEDCO
2
Linda Naeve
F
IA
F, E
W
Y
Uganda
F2F
7-27-2012
8-7-2012
12
$2,500
$1,000
T
R
P,M
VEDCO
3
Margaret
Smith
F
IA
F, E
W
Y
Uganda
F2F
1-2-2013
1-14-2013
12
$2,500
$1,000
T
R
P, M, D
VEDCO
3
Jennifer
Thomas
F
IA
F
W
Y
Uganda
F2F
1-2-2013
1-14-2013
12
$2,500
$1,000
T
R
P, M
VEDCO
3
Paul Mugge
M
IA
F
W
N
Uganda
F2F
1-2-2013
1-14-2013
12
$2,500
$1,000
T
R
P,M
VEDCO
3
Connie
Tjemeland
F
IA
F
W
N
Uganda
F2F
1-2-2013
1-14-2013
12
$2,500
$1,000
T
R
P, M
VEDCO
Total 129
$27,500
$11,000
10
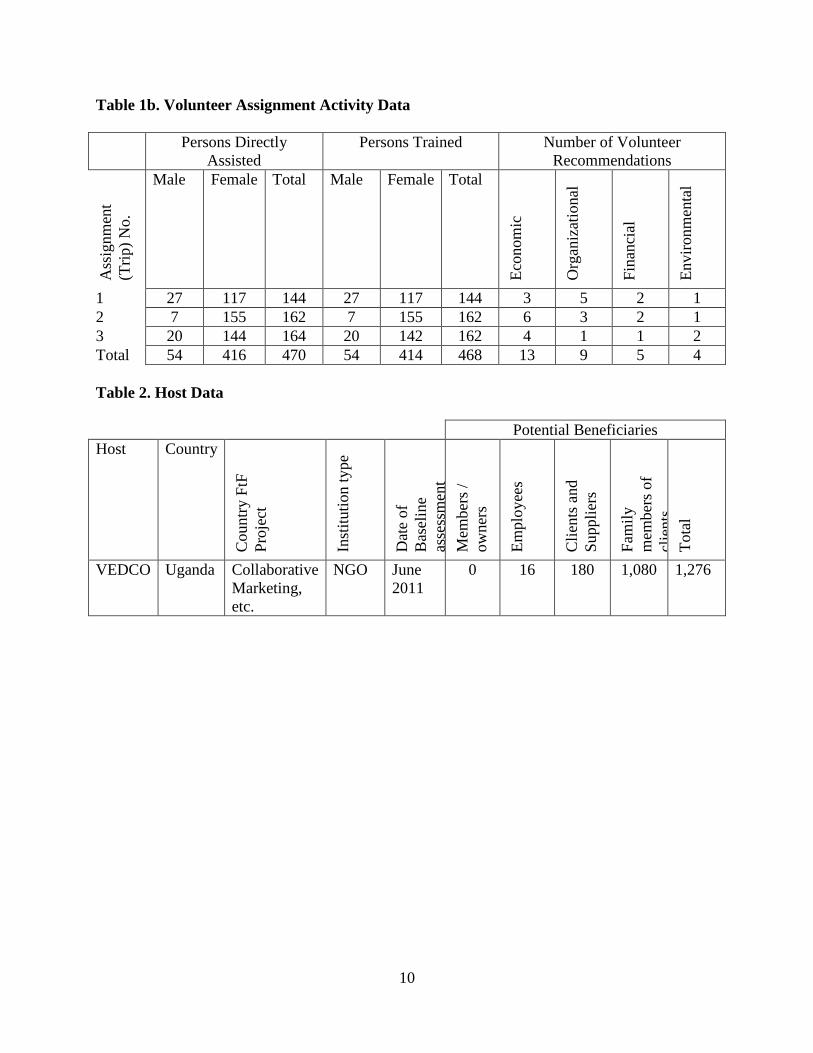
Table 1b. Volunteer Assignment Activity Data
Persons Directly
Assisted
Persons Trained Number of Volunteer
Recommendations
Ass
ignm
ent
(Tri
p)
No.
Male Female Total Male Female Total
Eco
nom
ic
Org
aniz
atio
nal
Fin
anci
al
Envir
onm
enta
l
1 27 117 144 27 117 144 3 5 2 1
2 7 155 162 7 155 162 6 3 2 1
3 20 144 164 20 142 162 4 1 1 2
Total 54 416 470 54 414 468 13 9 5 4
Table 2. Host Data
Potential Beneficiaries
Host Country
Countr
y F
tF
Pro
ject
Inst
ituti
on t
ype
Dat
e of
Bas
elin
e
asse
ssm
ent
Mem
ber
s /
ow
ner
s
Em
plo
yee
s
Cli
ents
and
Suppli
ers
Fam
ily
mem
ber
s of
clie
nts
Tota
l
VEDCO Uganda Collaborative
Marketing,
etc.
NGO June
2011
0 16 180 1,080 1,276

11
ANNEX: Volunteer Report for Final Field Assignment
Strengthening Value Chains for Maize and Soybeans for
Ugandan Women Farmers January 3 – 14, 2013
Submitted by:
Jenny Thomas, Humboldt, IA
Paul Mugge, Sutherland, IA
Connie Tjelmeland, McCallsburg, IA
Margaret Smith, Iowa State University
The Iowa/Uganda Farmer-to-Farmer project has been working with Ugandan women farmers for
the past two years. One hundred and eighty farmers, in groups of 12 to 27 members each, have
worked to improve their farm business management skills and incomes. With our teams’ visits,
the project came to a close. Our role was to tie up some loose ends as best we could. We also
reviewed the practices and tools introduced by the project and asked the farmers to evaluate
them.
Project Objectives
Objective 1: Improve maize grain quality, storage, and economic value in the marketplace
Examine maize shellers and bicycles for wear
Examine tarps for wear
Focus group questions
Does any group want to purchase another sheller?
Update documentation for groups who now have written machinery sharing agreements
These points are addressed in the final report for the entire project.
Objective 2: Increase production of, and improve soil management, harvest, drying, and
threshing techniques for soybeans
In year one of the project, 2011, seed was provided to farmers of an improved soybean variety
from a breeding program in Uganda. Only a very few of the farmers had ever grown soybeans,
even though their diets provide minimal protein and fat. This new variety, Maksoy 1N, grew well
in the district and farmers immediately began integrating soybeans into their family meals and
selling excess for cash. Farmers continued to plant soybeans each season (there are two rainy
seasons, therefore, two crop growing seasons per year in the Kamuli district). Soybeans on
small-holder farms are harvested by pulling the plants or by cutting them at the ground surface,
then taking them back to the farmstead. The plants are further dried on the ground or on
tarpaulins (in our case, these were provided by the project), then threshed by hitting the plants
with a stick. This threshing technique results in a lot of trash and chaff mixed in with the

12
Though previous volunteer
teams had reported this
threshing process as a
gentle ‘tapping’ on the
plants, this farmer wasn’t
doing any ‘tapping’!
soybeans that must be removed before cooking or selling the
soybeans. The great challenge to the women was cleaning their
threshed beans.
Although the harvesting, drying, and threshing of the soybeans
appear very inefficient by Western standards, those things didn’t
seem to be big concerns for the Kamuli district women farmers
on the scale that they are working. The real issue, for them, is
separating the beans from the chaff, dust, and dirt. Their current
winnowing process involves throwing the chaff/bean mixture in
the air a foot or so while blowing through it to remove the lighter
chaff. The most serious issue with this process is the inhalation of
dust – it makes the women sick. Therefore, the impetus of our
effort was, and is, to keep the women away from the dust while
cleaning their soybeans.
Seed cleaner
The previous team of volunteers developed and built a small,
wooden, manually powered fanning mill to address this issue.
St. Joseph’s Vocational Technical Institute in Kamuli was
charged with building a metal prototype, similar to the wooden
cleaner, which our team could demonstrate to the various
women’s groups. The hope was that a suitably designed cleaner
could then be manufactured and made available to the women at a price they could justify.
Unfortunately, the cleaner built at St. Joseph’s was deficient in many respects:
The air inlets were seriously insufficient
The impeller blades were angled incorrectly
The fan shroud was too far away from the fan blades
The agitation of the uncleaned product was inadequate
Clean soybeans would bounce all over
It is impossible to repair in the field
It is probably too heavy
It is possibly too expensive
The workmanship is very poor
A volunteer, Paul Mugge, spent most of a day
with St. Joseph’s instructors and students trying
to address the deficiencies that were amenable.
Our effort were doomed from the beginning
because the machine was welded together
everywhere and could not easily be modified.
In retrospect, our time would have been better
spent modifying the original wooden cleaner.
We did take the metal cleaner to one group of
farmers, but it was immediately apparent that it
was not up to the task. We decided that it was
better to not bring anything than to demonstrate
a piece of equipment that performed so poorly.
13
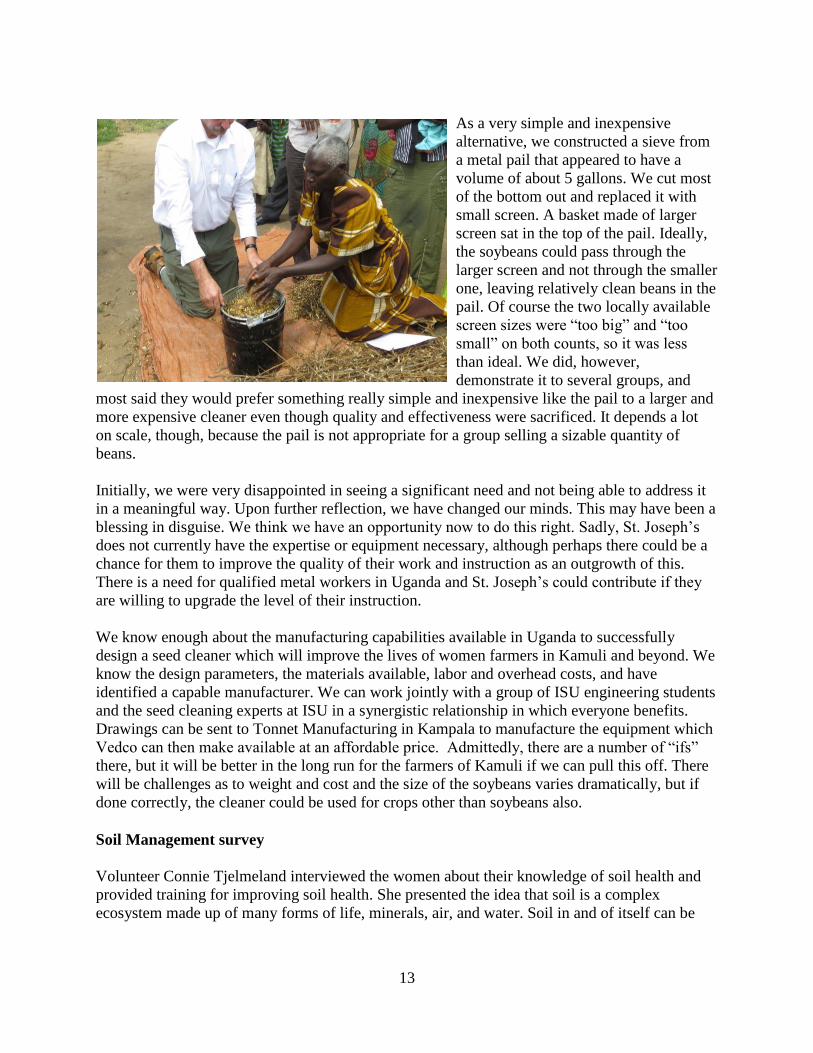
As a very simple and inexpensive
alternative, we constructed a sieve from
a metal pail that appeared to have a
volume of about 5 gallons. We cut most
of the bottom out and replaced it with
small screen. A basket made of larger
screen sat in the top of the pail. Ideally,
the soybeans could pass through the
larger screen and not through the smaller
one, leaving relatively clean beans in the
pail. Of course the two locally available
screen sizes were “too big” and “too
small” on both counts, so it was less
than ideal. We did, however,
demonstrate it to several groups, and
most said they would prefer something really simple and inexpensive like the pail to a larger and
more expensive cleaner even though quality and effectiveness were sacrificed. It depends a lot
on scale, though, because the pail is not appropriate for a group selling a sizable quantity of
beans.
Initially, we were very disappointed in seeing a significant need and not being able to address it
in a meaningful way. Upon further reflection, we have changed our minds. This may have been a
blessing in disguise. We think we have an opportunity now to do this right. Sadly, St. Joseph’s
does not currently have the expertise or equipment necessary, although perhaps there could be a
chance for them to improve the quality of their work and instruction as an outgrowth of this.
There is a need for qualified metal workers in Uganda and St. Joseph’s could contribute if they
are willing to upgrade the level of their instruction.
We know enough about the manufacturing capabilities available in Uganda to successfully
design a seed cleaner which will improve the lives of women farmers in Kamuli and beyond. We
know the design parameters, the materials available, labor and overhead costs, and have
identified a capable manufacturer. We can work jointly with a group of ISU engineering students
and the seed cleaning experts at ISU in a synergistic relationship in which everyone benefits.
Drawings can be sent to Tonnet Manufacturing in Kampala to manufacture the equipment which
Vedco can then make available at an affordable price. Admittedly, there are a number of “ifs”
there, but it will be better in the long run for the farmers of Kamuli if we can pull this off. There
will be challenges as to weight and cost and the size of the soybeans varies dramatically, but if
done correctly, the cleaner could be used for crops other than soybeans also.
Soil Management survey
Volunteer Connie Tjelmeland interviewed the women about their knowledge of soil health and
provided training for improving soil health. She presented the idea that soil is a complex
ecosystem made up of many forms of life, minerals, air, and water. Soil in and of itself can be

14
healthy or unhealthy and that impacts the crops growing in it. To the question of what they look
for in a healthy soil, they responded:
dark soil color (not red) because it has more nutrients;
soil that is heavy and holds water (not sandy) because it won’t dry out so fast;
soil that is ‘soft’ when dry and not sticky when wet (not too much clay) because it has
more air in it and tills more easily;
soil that has not been cropped for a while or virgin soil; and finally,
soil that grows certain weeds that indicate health. (They also listed a number of weeds
that indicate a poor soil.)
A glaring factor affecting yields is the overall poor
quality of the soil. The women said that soil
productivity has been declining over their years of
farming. I emphasized that soil heaIth depends on
protecting, maintaining, and increasing the soil’s
organic matter which is made up of living organisms,
detritus, and humus. By examining several soils, the
women learned that organic matter affects soil fertility,
tilth, water holding capacity, and aeration. We
discussed practices like leaving crop roots in the
ground, mulching to preserve moisture and reduce
erosion, planting cover crops, interplanting legumes,
and adding manure and compost. All of these are
practices which increase soil organisms and, therefore,
soil health.
The farmers know about a number of these practices. We were not able to fully assess, though,
how many of these are commonly used. The farmers are limited by time in their busy day to do
improvements on all their fields. Many women lack the simple means of moving heavy loads of
manure or compost very far. Although most everyone has free ranging, indigenous chickens,
only a few women have larger livestock to supply manure for their crop fields. Just as in Iowa,
land tenure affects farmers’ commitment and ability to improving soil quality. On rented land,
the women are reluctant to implement long term soil health measures, because they may not be
farming those fields the next year.
In spite of these limitations, for crops grown on land that is owned and/or close to their
homesteads such as bananas, coffee, tomatoes, and maize, they concentrated their efforts to
improve the soil. Contour planting and use of terraces on slopes slowed soil movement and
allowed better infiltration of rain. We saw only one farm with terraces. These were two-foot
wide, one-foot deep trenches with the soil piled on the uphill side of the trench. Planting trees,
like Eucalyptus, near fields was also used to reduce erosion.
The Kamuli district farmers have several means of replenishing nutrients in the soil. To build the
two-foot-high mounds in which sweet potatoes are planted, they hoe very deeply and bring
nutrients to the surface. Some women plant leguminous shrubs, such as the shrub-like legume,
15
Sesbania, around their fields. Using weeds to mulch around plants, or leaving crop residue in the
fields provides organic material that can be worked in before the next crop is planted. Crop
rotation and intercropping with legumes is used to reduce pest problems and fix nitrogen.
Because of the number of crops grown and the complexity of their farming systems, crop
rotations are not standard. Examples of intercropping patterns are maize intercropped (planted
together in the same field) with soybeans, fields beans, or groundnuts (peanuts) and cassava
planted with sweet potatoes, beans or groundnuts. Maize, tomatoes, and other vegetables are
often intercropped around the perennials bananas, coffee, and cassava.
Some members in each of the groups made and used compost and applied manure to their crop
fields. They understood the value of these soil amendments but said the labor involved in digging
compost pits with hoes, turning the compost by hand and hauling compost and manure in baskets
was not possible to do for all their crop fields.
It was evident to us that knowledge and acceptance of practices to build healthy soils is not a
significant barrier for the Kamuli farmer groups. However, money to purchase livestock or labor-
saving devices to extend the practices to more fields is, apparently, a big problem. Also, lack of
land ownership or long term rental agreements discourages their general use.
Soy Consumption
Soybeans are a huge hit with the Kamuli women farmers. There remain some challenges with
production, harvest, cleaning/processing and marketing, but they definitely plan to continue
producing soybeans for both household consumption and for sale.
All of the women feel that their families are healthier and they report that their children love
soybeans. Soybeans are prepared in several ways, including:
pounded into flour, then cooked as a sauce (to eat with sweet potatoes or posho - a stiff, corn
meal mush that is also a dietary staple)
roasted (which provides a portable snack to send with the children to school)
as a hot beverage - soy ‘coffee’
processed into soy milk
cooked with water to make porridge,
mixed with other flours and made into pancakes.
Growing soybeans to make into these food supplements has enriched the diet with high quality
soy protein, high energy vegetable oil, and an excellent source of vitamin E.
During the course of our two-year project, farmers have sold whole soybeans - like we do in the
U.S. - or have had them milled and sold as full-fat flour. Money from the sale of soybeans has
made positive differences in the farmers’ households. They report using funds for school fees for
their children, to buy other household staples, and to buy livestock.
Constraints to soy culture and marketing
Doves and weaver birds have been a problem because they eat germinating seedlings.
Fortunately, the vulnerable period is only about a week, so the farmer can, as they say, ‘be
diligent’ during that short period keeping the birds away. A larger problem is monkeys. They eat

16
soybeans as the seeds in the pod begin to ripen. Farmers in the Namasagali subdistrict have
experienced considerable yield loss to monkeys. The farmers try to scare them away, but they
sneak into fields at night. The farmers have sometimes resorted to hiring someone to hunt and
kill the monkeys.
We have not measured soybeans yields among our project farms, because we have been in the
very early experimental stages of evaluating this crop. The irregularity of field shapes and sizes
makes the determination of acreage difficult and soybeans are intercropped in many fields with
maize, cassava, or plantain bananas. In one field demonstration conducted during our project,
soybean variety Maksoy 1N yielded 15 bu/A. This seems low, but the women have only been
growing soybeans for four seasons and there is much yet to learn. At this point, inoculation of
the seed with Rhizobium bacteria has not been successful. In 2012, too much rain during one
season and the delay of the rain in another caused poor yields.
Objective 3: Improve on-farm production and marketing written record keeping
Jenny Thomas participated in the Farmer-to-Farmer project to Uganda with the second group in
May, 2011, when Field Record Books for Crops had just been introduced to the women groups
and training had been implemented to help participating farmers use this template. There are two
growing seasons per year, so twice as much record keeping as we have at home! Since then, our
VEDCO partners and subsequent Iowa teams provided ongoing training, oversight and feedback
to our collaborating farmers. Our (second) group reviewed each book entry and discussed how
the record books were working for the groups. The farmers said the books helped them manage
their farms better. A few of the comments they shared were:
They now know what crops make money.
They can keep track of when they planted and use this to estimate harvest dates and plan
other field activities.
They can keep track of how much crop was produced, used for food, or used for seed, and
written records also help to plan for marketing together as a group.
The farmers repeated similar comments on this final trip. When asked whether they saw value in
continuing the record books one group spokesperson simply replied “obviously”. Several groups
suggested that we also include livestock pages in the next book. Over the course of the project,
they have expanded the number of crops they are recording and have suggested improvements
such as combining two seasons per book.
Early in the project, soybean fields
were measured in a unit called an
emigo. The emigo is a stick cut to
approximately 10 feet in length. Fields
are measured by turning the emigo end
over end all around the field perimeter.
The shape (map) of the field is drawn
by hand and the measurements are
recorded on the map and also on a
production page in the record book.
17
A later team photographed each page of the first books to help understand how the books were
being used, to evaluate the completeness of records, and to identify problems with using the
template pages. They found that the record books were widely and readily accepted.
Before this final trip, diagrams were developed from the photographed soybean field maps by
using the women’s hand drawn maps and measurements and converting them to scale on graph
paper. Area calculations were attempted so that yields per acre could eventually be determined.
The scaled diagrams were brought along and distributed to the participants when we met with the
groups.
There were difficulties with calculating field areas based on the measurements collected. They
were more often than not, irregularly shaped fields. Also, the measurements weren’t always
made all around the perimeter of the field. For instance sometimes only two ends or two sides
were measured. Things didn’t always add up! It appears that graphic math skills among many of
the women are at a beginner level or perhaps had gotten “rusty” over the years.
This exercise turned out to be a useful guide to better understand the range of book keeping
abilities of individual participants within the groups. Seventy-two percent of participants were
successfully using the record books, that is, tracking at least one crop for an entire season. At the
other end of the spectrum were participants who brought their book to the meeting, but the name
was not printed on the front, and nothing was recorded inside.
We learned that our collaborating women farmers have education levels ranging from no
schooling to seven years of primary school. In perspective, their graphic skills are probably right
on par for this level of formal schooling.
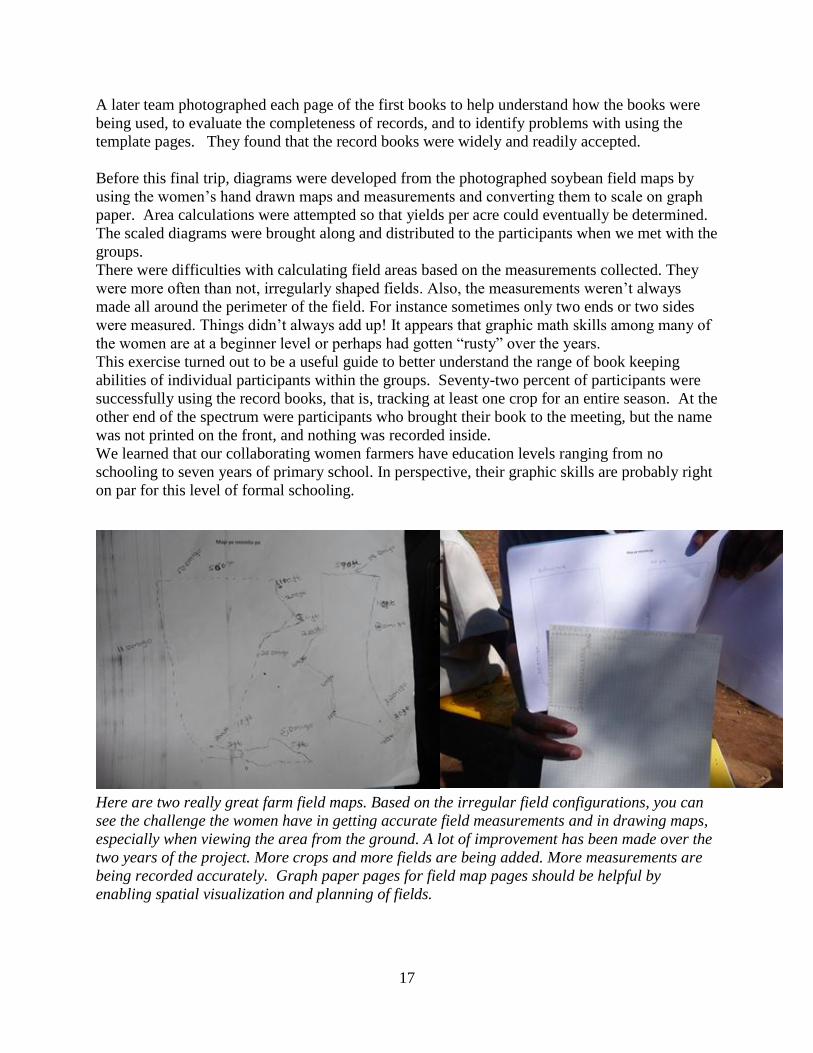
Here are two really great farm field maps. Based on the irregular field configurations, you can
see the challenge the women have in getting accurate field measurements and in drawing maps,
especially when viewing the area from the ground. A lot of improvement has been made over the
two years of the project. More crops and more fields are being added. More measurements are
being recorded accurately. Graph paper pages for field map pages should be helpful by
enabling spatial visualization and planning of fields.
18
Once in Kamuli, with the help of Michael Nabugere, a VEDCO volunteer, we used the scaled
drawings to explain to the women the concept of using graph paper to draw maps, and enable
them to check to see if their measurements made sense. Maps were scaled one emigo (10 feet)
per square to allow use of simple addition of squares.
The next step was to teach farmers to count the squares to determine acreage. For example, 44
squares equals about one-tenth of an acre. Once they know how to determine area, they can start
comparing yield information from farm to farm and year to year to improve their production
practices. However, determining field areas, yields per land unit, and adding livestock record
keeping will likely require additional outside support.
The numbers collected during our training sessions with the farmers groups support that at least
129 out of 180 women in the project have used the Farm Record Books for Crops or 72%
participation. Before the project, my understanding is that none had access to record books.
Farmers reported that they are now providing neighbors with book pages by having the books
photocopied locally.
VEDCO will take over the printing and distribution of the Farm Record Books for 2013 Crops.
Farmers will have to pay for the books, which will be a good indicator of how valuable they
view record keeping for their farm businesses. In general, participants appeared willing and able
to pay the cost of replacement record book pages for the next season. There were group
discussions about printing pages locally.
The cost of a semi-permanent cover/record book binder sounded prohibitive for most of the
participants. Our team applied remaining project funds to purchase ringed binders that will
protect several years of record book pages. The objective of this purchase is to enable multi-year
analysis of farm production and marketing outcomes by protecting paper pages.
Other areas of need are determining why some members aren’t using the books and seeing if we
can brainstorm with the groups to generate solutions to bring participation up over 90%. Perhaps
a mentoring program, involving an older child with the project, working with local educators, or
some other idea will surface to include current non-participants.
We were pleased to learn that VEDCO is planning to use the record books with farmer groups in
other areas of Uganda.
Objective 4: Advance development of female-directed marketing groups/associations for
marketing maize and soybeans
Joint marketing in 2012
Group marketing of maize and soybeans was implemented by about half the groups this year.
Because the first growing season (February through July) had low and irregular rainfall, crop
yields were poor. Maize and soybeans that were produced on many farms were used mostly for
family consumption and saved for seed for the second growing season. Farmers who did have
some grain to sell often sold small amounts individually. Soybeans grown during the second
growing season have recently been harvested, threshed and need to be cleaned before marketing
can begin.
19
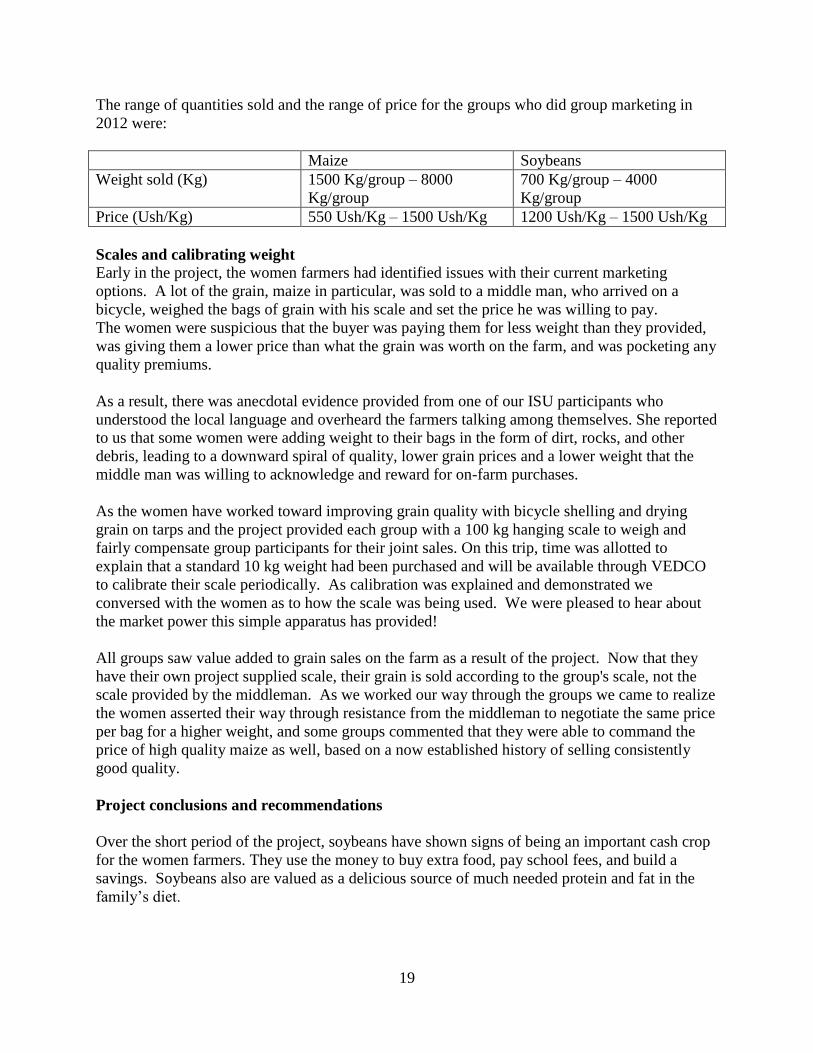
The range of quantities sold and the range of price for the groups who did group marketing in
2012 were:
Maize Soybeans
Weight sold (Kg) 1500 Kg/group – 8000
Kg/group
700 Kg/group – 4000
Kg/group
Price (Ush/Kg) 550 Ush/Kg – 1500 Ush/Kg 1200 Ush/Kg – 1500 Ush/Kg
Scales and calibrating weight
Early in the project, the women farmers had identified issues with their current marketing
options. A lot of the grain, maize in particular, was sold to a middle man, who arrived on a
bicycle, weighed the bags of grain with his scale and set the price he was willing to pay.
The women were suspicious that the buyer was paying them for less weight than they provided,
was giving them a lower price than what the grain was worth on the farm, and was pocketing any
quality premiums.
As a result, there was anecdotal evidence provided from one of our ISU participants who
understood the local language and overheard the farmers talking among themselves. She reported
to us that some women were adding weight to their bags in the form of dirt, rocks, and other
debris, leading to a downward spiral of quality, lower grain prices and a lower weight that the
middle man was willing to acknowledge and reward for on-farm purchases.
As the women have worked toward improving grain quality with bicycle shelling and drying
grain on tarps and the project provided each group with a 100 kg hanging scale to weigh and
fairly compensate group participants for their joint sales. On this trip, time was allotted to
explain that a standard 10 kg weight had been purchased and will be available through VEDCO
to calibrate their scale periodically. As calibration was explained and demonstrated we
conversed with the women as to how the scale was being used. We were pleased to hear about
the market power this simple apparatus has provided!
All groups saw value added to grain sales on the farm as a result of the project. Now that they
have their own project supplied scale, their grain is sold according to the group's scale, not the
scale provided by the middleman. As we worked our way through the groups we came to realize
the women asserted their way through resistance from the middleman to negotiate the same price
per bag for a higher weight, and some groups commented that they were able to command the
price of high quality maize as well, based on a now established history of selling consistently
good quality.
Project conclusions and recommendations
Over the short period of the project, soybeans have shown signs of being an important cash crop
for the women farmers. They use the money to buy extra food, pay school fees, and build a
savings. Soybeans also are valued as a delicious source of much needed protein and fat in the
family’s diet.
20
Although the winnowing process has yet to be resolved, the stage is set for progress in the future.
During this visit we learned more about manufacturing capabilities for grain cleaners, available
materials and costs, design parameters and a possible manufacturer. All this makes it easier to
design a cleaner appropriate for the Kamuli farmers.
The use of their own, calibrated scales has given the women the confidence to work out more
favorable marketing agreements. This, coupled with the knowledge that their grain is of higher
quality than in the past due to the use of tarpaulins and corn shellers, significantly improves the
women’s negotiating skills.
Barriers to healthier soils seems to be lack of long term land tenure arrangements and money to
purchase the means and material (animals to produce manure, and labor saving tools) to extend
soil building measures to more fields.
Recommendations for future work
Document cropping patterns and soil improvement practices
Collect soil samples for testing
Survey land tenure – ownership or rental or other arrangements
Work with Iowa State University grain cleaner experts and engineering students to
develop a seed cleaner
Evaluate current methods of assessing production level and production efficiency within
and among the groups. Continue to work on accurately assessing yields in bushels per
acre, or determine an easier standard or method to assess crop production level and
production efficiency.
Determine why some members aren’t participating in using the record books provided,
and brainstorm how the level of participation might be increased.
Develop a better sense of how men’s farming and marketing decisions impact the
decisions women make in their farm business practices
Integrate a livestock (chickens in particular) component into the research
21
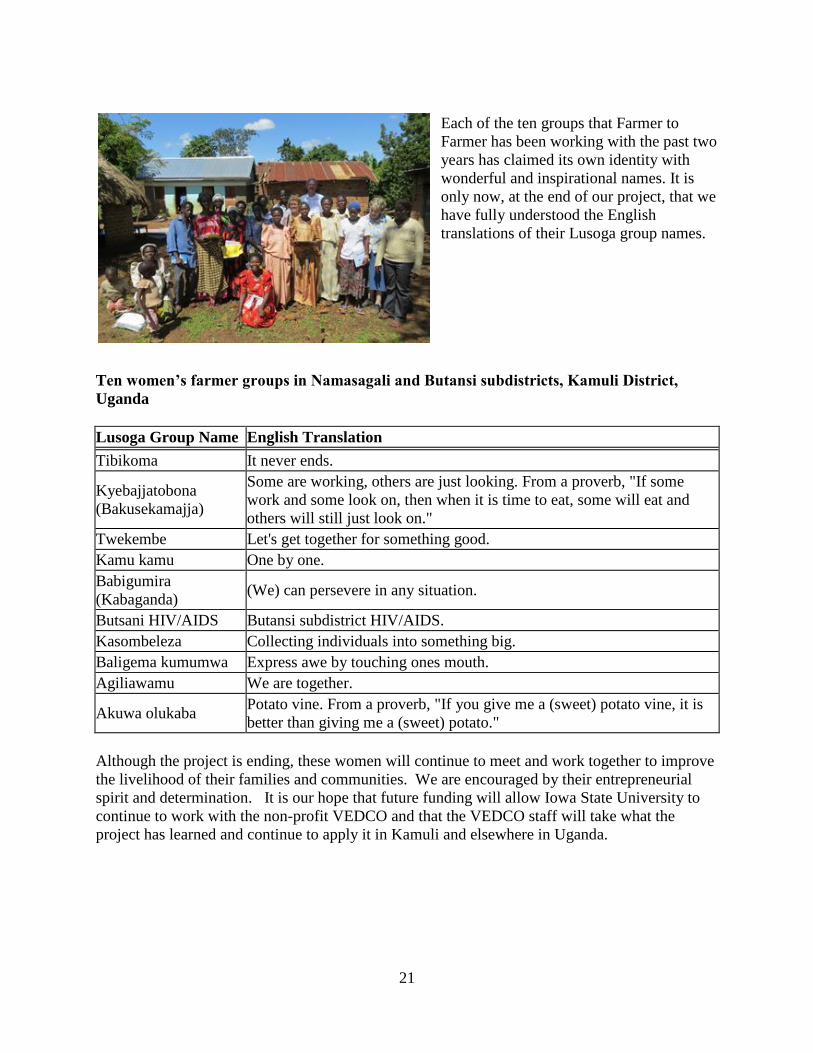
Each of the ten groups that Farmer to
Farmer has been working with the past two
years has claimed its own identity with
wonderful and inspirational names. It is
only now, at the end of our project, that we
have fully understood the English
translations of their Lusoga group names.
Ten women’s farmer groups in Namasagali and Butansi subdistricts, Kamuli District,
Uganda
Lusoga Group Name English Translation
Tibikoma It never ends.
Kyebajjatobona
(Bakusekamajja)
Some are working, others are just looking. From a proverb, "If some
work and some look on, then when it is time to eat, some will eat and
others will still just look on."
Twekembe Let's get together for something good.
Kamu kamu One by one.
Babigumira
(Kabaganda) (We) can persevere in any situation.
Butsani HIV/AIDS Butansi subdistrict HIV/AIDS.
Kasombeleza Collecting individuals into something big.
Baligema kumumwa Express awe by touching ones mouth.
Agiliawamu We are together.
Akuwa olukaba Potato vine. From a proverb, "If you give me a (sweet) potato vine, it is
better than giving me a (sweet) potato."
Although the project is ending, these women will continue to meet and work together to improve
the livelihood of their families and communities. We are encouraged by their entrepreneurial
spirit and determination. It is our hope that future funding will allow Iowa State University to
continue to work with the non-profit VEDCO and that the VEDCO staff will take what the
project has learned and continue to apply it in Kamuli and elsewhere in Uganda.

22
VEDCO/USAID FARMER TO FARMER
PROJECT NAME: INCREASING THE COMPETITIVNESS OF UGANDAN WOMEN
FARMERS IN THE MARKET PLACE.
APRIL 2013
Compiled by the Monitoring and Evaluation Department & Project Staff
23
I. EXECUTIVE SUMMARY
VEDCO in partnership with IOWA state University Global extension department reached an
agreement to implement a 1 years project (Jan 2011- Dec 2011) but it was extended to April
2013 in the communities of Butansi and Namasagali Sub counties, Kamuli District. The project
is Agric Trade based and is intended to promote sustainable livelihoods of small landholder
women farmers by strengthening their capacity for market oriented farming and establishing
associations of such farmers to share knowledge, experience and market bases. The Niche
project intends to outreach more 100 farmers organized in 10 farmer groups in addition to the 80
farmers in the first phase of implementation which are also hoped to later form viable marketing
associations to be able to achieve the project objectives.
At the inception of the project it was pertinent to establish the current status of households,
farmer groups and communities and their farming practices to enable the project efforts be
evaluated after implementation. This would also work as a decision making report as far as
implementation of the project is concerned. In regard to establishing the above, an evaluation
survey was conducted in the communities of Butansi and Namasagali sub counties.
All 138 farmers, ((119)86.2% females and (19)13.8% males directly outreached by the program
were sampled for the study thus 17 (17.2%) males, 82 (82.8%) females came from Butansi and 2
(5.1%) males, 37 (94.9%) females from Namasagali sub counties. The data was analyzed using
SPSS software and presented as frequencies and percentages in tables, graphs and charts.
Thus the farmers (both new and old) adopted most of the recommended practices through their
farmer groups. They have also strengthened their farmer groups through the support inform of
inputs, trainings they have received from the project to enable them benefit from their
agriculture. Farmer groups which were formed and well managed, have efficiently handled their
post harvesting, marketing and record keeping. The project has achieved its major focus of
greatly contributing to improved livelihoods of farmers in the intervention areas through
increasing the competitiveness of women farmers in the market place.
24
INTRODUCTION
Background
VEDCO in partnership with Iowa State University College of Agriculture implemented a one-
year project in the two communities of Butansi and Namasagali sub-counties in Kamuli district.
The increasing the competitiveness of Ugandan Women Farmers in the market place commenced
in Jan 2011 and was extended to April 2013.
The project was intended to promote sustainable livelihoods of small landholder women farmers
by strengthening their capacity for market oriented farming and establishing associations of such
farmers to share knowledge, experience and market bases. The second phase was focusing on
mainly providing education about seed quality and encouraging adoption of on- farm evaluation
of open pollinated maize and soya bean seed before planting, improve on farm production and
marketing record keeping and lastly advance development of female- directed marketing groups
for marketing maize and soybeans. This was to be done through training them in seed
germination testing and evaluation, training sessions on the use of the new 2012 Farm Record
book for crops and investigating options for market associations through providing them with
inputs and linking them to buyers.
Project Outreach
The project was intended to outreach 180 farmers organized in 18 groups in the communities of
Butansi and Namasagali. The project was implemented in five parishes of Namasagali, Bwiiza in
Namasagali Sub County while in Butansi Sub County; the project was in Naluwoli, Bugeywa
and Butansi parishes.
Project Major Objectives
The project was focused on four major objectives of operation which included;
Improve maize grain quality by implementing better post-harvest handling strategies
Increase soybean production among women farmers in the Kamuli District
Improve on-farm production and marketing and record keeping.
Develop pilot joint maize marketing effort among farm women’s groups.
Before the start of the second year of the project, there was a baseline survey on the new farmers
on the project which was conducted to establish the current status and practices of individual
farmers and their groups. This formed a basis for monitoring the progress of the project in the set
targets as well as reviews the planning to ensure positive outcomes.

25
Objectives of the Evaluation
The general objective of the evaluation was to establish their household status (project impact)
and level of adoption of the practices which the project has been promoting to the various farmer
groups.
Specific objectives of the evaluation are;
To know the socio-demographic characteristics of the farmers
To establish the farming practices of the farmers.
To know the farmer’s marketing behaviors and how they have accessed market
information.
To know the farmers’ Post Harvest Handling practices adopted.
To establish farmers’ level of keeping written farm records.
To know whether the project has caused any impact in their households.
SURVEY METHODOLOGY
Data collection tools
The evaluation data was collected using structured questionnaires comprising of questions on
socio – demographic information; current farming practices, marketing behavior, market
Information access, post- harvest handling practices, written record keeping of farm activities,
access to extension services and project impact. The household interviews were conducted by 8
research assistants who were trained and facilitated. Each interview would take an average of 25
minutes. The survey tool was then pre-tested by the research assistants to find out whether the
tool was achieving the intended purpose so that accuracy and efficiency are achieved during the
actual data collection.
Data management, analysis and Presentation
After data collection, the questionnaires were checked for completeness to ensure accuracy of the
data collected. The data was coded and entered into computer software- SPSS. After entry, the
data was analyzed still using Statistical Package for Social Scientists (SPSS) to generate simple
frequency tables, percentages, charts, descriptive statistics and cross tabulations were used to
present the data findings as shown in subsequent pages.
THE FINDINGS OF THE STUDY
Social demographic characteristic of the Respondents.
The study was carried out in the two sub counties of Butansi and Namasagali, Kamuli District.
Out of the 138 respondents, 99 were from Butansi and the rest (39) were from Namasagali Sub
County.
26
Gender of respondent
The pie-chart below shows the percentage distribution of respondents by gender from the two
sub counties of Namasagali and Butansi where the survey was conducted.
Figure 1: Gender of Respondents
From the pie chart above, the majority of the respondents were female, 119 (86%) whereas 19
(13.8%) of respondents were males.
The study went ahead to establish the percentage of the age distribution of households in both
sub counties. According to the findings, it was established that majority of the households were
between 50-59(23.9%), and very few households surveyed were between 80-89, (1.4%) as
shown in the details below.
Table 1: Age Distribution of Respondents
Age Distribution Frequency Percent
20-29 23 16.7
30-39 31 22.5
40-49 30 21.7
50-59 33 23.9
60-69 14 10.1
70-79 5 3.6
80-89 2 1.4
Total 138 100
Type of Farmer Group
The project evaluation survey went ahead to obtain information concerning the type of farmer
group each project beneficiary belonged to. The findings from the survey revealed that majority
of the farmers belonged to mixed groups 100(72.5%) and those who belonged to women groups
were 38 (27.5%). These are indicated in the frequency table below;
14%
86%
Male Female
27
Table 2: Type of Farmer Group
Type Frequency Percent
Women 38 27.5
Mixed 100 72.5
Total N=138 100
Respondents Education level
The findings from respondents’ education level revealed that 85 of respondents had attained
primary education (61.6%), 27 attained secondary education (19.6%), 2 had attained tertiary
education (1.4%), and 24(17.4%) had not gone to school at al. The frequency below illustrates
the details.
Table 3: Respondents education level
Education level Frequency Percentage
Primary 85 61.6
Secondary 27 19.6
Tertiary 2 1.4
None 24 17.4
Total 138 100
Respondents Relationship to Household Head
The survey elicited information on the relationship of the different households to their household
heads. The findings revealed that 86 (62.3%) respondents were spouses, 1 respondent was
son/daughter, self were 49 (35.5%) and the rest had no relation at all, 2(1.4%). The details are
shown in the frequency table below.
Table 4: Relation to Household Head
Relationship to HHd head Frequency Percent
Spouse 86 62.3
Son/Daughter 1 0.7
Self 49 35.5
Others 2 1.4
Total 138 100
Household agricultural implements
All the 138 surveyed households had at least a hoe. Over 80 households were in a possession of
the mobile phones. This conclusively indicated that these 80 households would easily access
market information directly via SMS in case of any. The table below shows summary of
agricultural implement possessions by the households.
28
Table 5: Household Agricultural Implements
Agriculture Implements N Mean
Number of Hoes 557 4.04
Number of Pangas
135
0.98
Number of Rakes 14 0.1
Number of Spades 53
0.38
Number of Axes 108 0.79
Number of Slashers 98 0.71
Number of Sickles 23 0.17
Number of Wheelbarrows 15 0.11
Number of ox-plough 8 0.06
Number of mobile phones 102 0.74
Bicycle ownership
The survey went to find out whether the household owned a bicycle. 116 households (84.1%)
owned a bicycle and only 22 households (15.9%) do not own a bicycle. Of the 116 HHs which
owned a bicycle, 50.7 percent (70) owned bicycle individually whereas 34.8 percent (48)
respondents revealed that the bicycle is jointly owned by the household. The rest of the
respondents did not own a bicycle at all (14.5%). Those who do not own bicycles mainly access
them mainly on request; others pay fees and even trade labor.
Table 6: Bicycle Ownership
Ownership Frequency Percentage
Owned by individual 70 50.7
Jointly owned 48 34.8
Non Applicable 20 14.5
Total 138 100
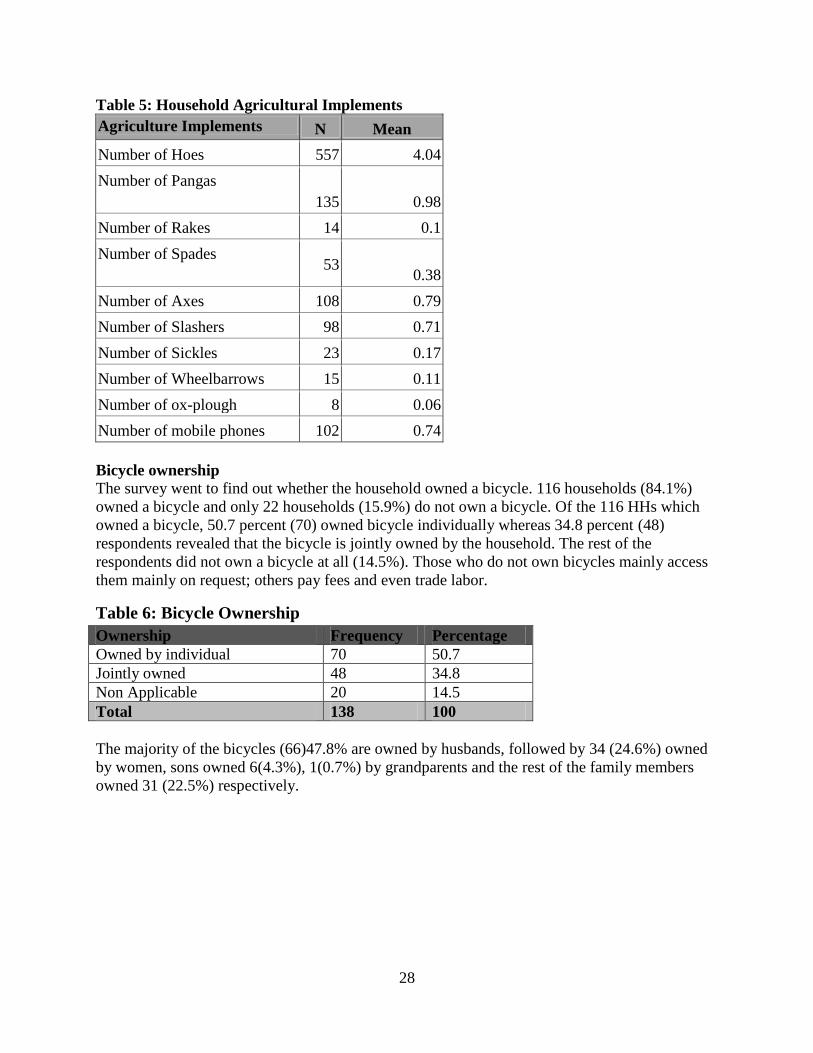
The majority of the bicycles (66)47.8% are owned by husbands, followed by 34 (24.6%) owned
by women, sons owned 6(4.3%), 1(0.7%) by grandparents and the rest of the family members
owned 31 (22.5%) respectively.
29
Figure 2: Individual Ownership of Bicycle
Bicycle Purchase by Group
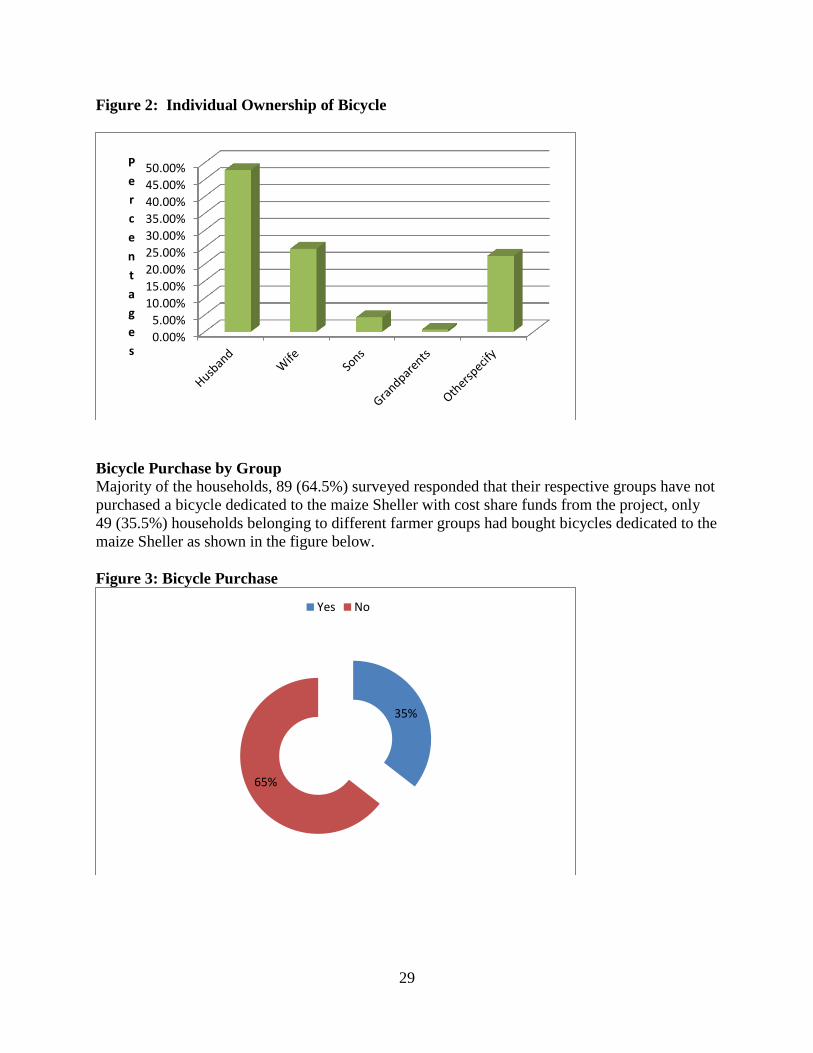
Majority of the households, 89 (64.5%) surveyed responded that their respective groups have not
purchased a bicycle dedicated to the maize Sheller with cost share funds from the project, only
49 (35.5%) households belonging to different farmer groups had bought bicycles dedicated to the
maize Sheller as shown in the figure below.
Figure 3: Bicycle Purchase
0.00%
5.00%
10.00%
15.00%
20.00%
25.00%
30.00%
35.00%
40.00%
45.00%
50.00%P
e
r
c
e
n
t
a
g
e
s
35%
65%
Yes No

30
A majority of the farmers who have not purchased the bicycles dedicated to the maize shellers
had collected a maximum of Shs. 100,000 from their respective members towards the purchase
of the bicycles, and those groups with less than Shs. 100,000 hope to complete their savings
needed within a period of one month.
Land ownership, Usage and production
The evaluation survey collected information on land ownership, acreages used in farming and if
the land used for production is borrowed, hired or rented for production, changes in the land
farmed/hired ever since farmers started growing soy bean.
On average, a household has 4.899 acres of land available for farming and other activities, and
on average 2.35 acres are only used for agricultural purposes in most of the households.
Majority of the households do not borrow or hire land, 70 (50.7%), only 68 (49.2%) households
do borrow their land to other households and on average of 1 acre is borrowed/hired/rented per
season by most of the households surveyed.
82(59.4%) farmers who participated in the exercise confessed that their amounts of land had
changed greatly on average by 1.41 acres ever since they began growing soybean and only 56
(40.6%) farmers who were mainly the new farmers on the project said that the amounts of their
land had not changed greatly but they hoped they will change this season.
Those who have tried to borrow/hire their land to other households said that there was no
significant changes in the amounts of their land since majority have been farming on their own
lands. The few who tried to borrow 25(18.1%), the e amounts of their land changed on the
average of 1.82 acres.
Farming Practices
The survey included questions to establish whether farmers were involved in cultivation of either
maize or soya bean both seasons by looking at the different sources of planting materials, size of
plots planted, production in Kilograms, whether sold or not and the source of labor as shown in
the discussions below.
Source of Maize Planting Materials
The majority of the farmers 88 (63.8%) who planted maize in the first season used the seed they
had saved from the previous season which indicated that farmers heeded to the advice of the
extension workers during the trainings on seed which were conducted, 20 (14.5%) bought seed
from the suppliers, 17(12.3%) got their seed from VEDCO, 7 (5.1%) farmers got the seed from
NAADS, 1 (0.7%) farmer got seed PLAN and the rest 5 (3.6%) could not specify the sources for
their seed they planted last season. The table below shows details of farmer seed source.

31
Table 7: Source of Maize Planting Materials
Source Frequency Percent
VEDCO 17 12.3
NAADS 7 5.1
PLAN 1 0.7
Buying from Suppliers 20 14.5
Saving Seed 88 63.8
Others 5 3.6
TOTAL 138 100
For soybean in the first season, the many farmers,105 (76.1%), got their seed from VEDCO, 22
(15.9%) farmers used seed saved from the previous season, 2 (1.4%) farmers bought from
suppliers, 1 farmer got the seed from NAADS and 8 (5.8%) farmers received seed from other
sources they could not specify.
Table 8: Source of Soybean Planting Materials
Source Frequency Percent
VEDCO 105 76.1
NAADS 1 0.7
Buying from Suppliers 2 1.4
Saving Seed 22 15.9
Others 8 5.8
TOTAL 138 100
Agricultural Production among Households
During the evaluation survey, there was a need to establish the average acreage of land farmers
had under production for both crops in the first season. Thus on average, 1.38 acres and 0.61
acres of maize and soybean, respectively, were planted in the first season. On average, farmers
also managed to produce 645.04 Kgs and 72.69 Kgs of maize and soybean, respectively, in the
first season. The results are elaborated in the table below.
Table 9: Agricultural Production and Acreage in the First Season
Crops Mean acreage Mean yield (Kgs)
Maize 1.38 645.04
Soybean 0.61 72.69
In the first season, many maize farmers, 104 (75.4%) surveyed, sold their produce and only 34
(24.6%) did not sell their produce in the first season.
For soybean, majority of the farmers 70 (50.7%) did not sell their soybeans, whereas only 68
(49.3%) managed to sell their produce to the different buyers.
32
The survey also went ahead to find out the main sources of labor for both crops. It was revealed
that the main source of labor for maize and soybean was mainly the family (52.9% and 53.6%),
respectively, and very few farmers used hired labor because of the high costs involved.
In the second season, the main source of maize seed was still from seed saved from the previous
season as shown in the table below.
Table 10: Source of Maize Planting Materials in Second Season
Source Frequency Percent
VEDCO 3 2.2
SELF HELP AFRICA 14 10.1
Buying from suppliers 5 5.8
Saved seed 92 66.7
Others 20 14.5
TOTAL 138 100
For soybean in the second planting season, the main source of planting materials was still the
seed saved from the previous season as shown below.
Table 11: Source of Soybean Planting Materials in Second Season
Source Frequency Percent
VEDCO 29 21
Buying from suppliers 1 0.7
Saved seed 67 48.6
Others 41 29.7
TOTAL 138 100
On the side of acreages planted and productions realized in the second planting season for both
crops, on average, 1.23 acres and 0.5 acres of maize and soy bean respectively were planted, the
realizing 423.17Kgs and 63.22Kgs of maize and soy bean respectively as summarized below.
Table 12: Agricultural Production and Acreage in the Second Season
Crops Mean acreage Mean yield (Kgs)
Maize 1.23 423.17
Soybean 0.50 63.22
It was also discovered that in the second season, 69 (50%) and 36 (26.2%) did sell their maize
and soybean, respectively, while 69 (50%) and 102 (73.9%) did not sell their maize and soybean,
respectively, citing different reasons like lack of market to offer good prices, low yields as a
result of the bad weather, and other farmers kept the soybeans mainly for household
consumption.

33
The main source of labor for both crops was still the family that is (47.1% and 39.1%),
respectively, for maize and soybean in the second season. Some households could use both hired
and family in case they could afford the costs involved.
Intercropping
One hundred two (102) farmers reported to have intercropped soybean with different types of
crops whereas 36 (26.1%) farmer s had not practiced intercropping. The most common crops
which were intercropped with soy bean included; maize, ground nuts, beans, cassava and
cassava.
Soybean Consumption
Much of the soybean harvested by the different families in the different areas of operation is
being consumed by mainly children as porridge, adults and other family members as snacks and
to prepare source to escort meals. It was also discovered that on average, family members often
consume the soybean twice a day, though some families go beyond the two times depending on
the need.
Soybean planting in 2013
Majority of the farmers who participated in the survey, 127 (92%) were planning to plant
soybean in 2013 and they prepared their fields for the first planting season. Only 11 (8%)
farmers of the surveyed were not planning to plant soybean in 2013 as shown in the figure
below.
Figure 4: Soybean Planting
On average, they plan to plant 0.66 acres of land for soybean this year using mainly the seed
saved from the previous season. It was also discovered that many farmers performed germination
tests on different crops in the first and second growing seasons of 2012 which included; maize,
beans and soybeans.
92%
8%
Yes No
34
Agricultural Trade, Planning and Marketing
This section mainly looks at collective/group production planning, individual marketing of maize
and soybean in the first and second season, participation in collective marketing in both seasons,
costs incurred, bulking and selling, quality of both maize and soybean and where they sold their
produce both individually and collectively.
Individual Marketing.
On average, maize farmers who participated in individual marketing planted 1.34 acres realizing
production of 620.62 Kgs on average in the first season. On average, they managed to sell
431.01Kgs at an estimated cost per kilogram of Shs.366 realizing estimated earnings of Shs.
20,3170.
For soybean farmers who participated in individual marketing, on average they managed to plant
0.49 acres realizing a production of 65.33Kgs on average in the first season. They also managed
to sell on average 24.87Kgs at an estimated cost of Shs.518 realizing estimated earnings of
Shs.29,837.
Table 13: Individual Acreage, Production and Sales
Crops Mean
Acreage
Average
production
Average
Kgs sold
Average
cost/kg
Average
earnings
Maize 1.34 620.62 431.10 366 203170
Soybean 0.49 65.33 24.87 518 29837
Market Sources for Individual Marketing
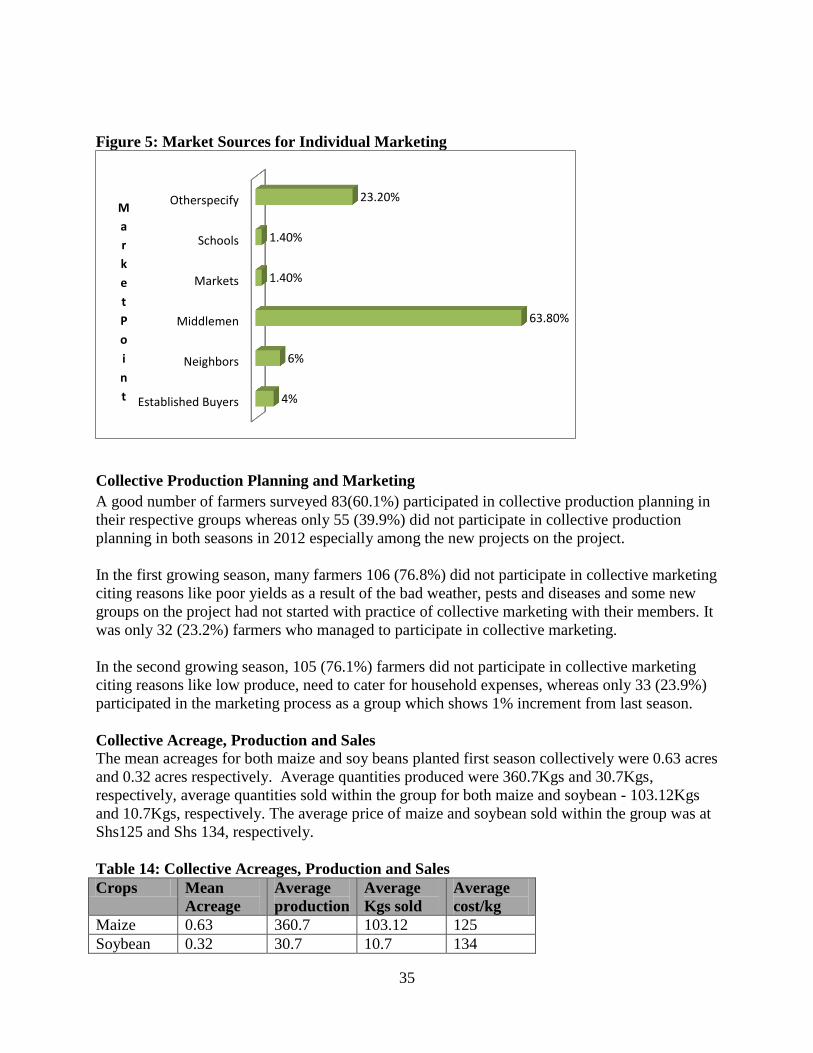
The survey also discovered that majority of the farmers, 88(63.8%) still sell their produce
individually to middlemen, 32 (23.2%) to other buyers in the community, 8 (5.8%) sold to their
neighbors, 6(4.3%) to established buyers and 4 (2.8%) sold to both schools and established
markets as shown in the figure below.
35
Figure 5: Market Sources for Individual Marketing
Collective Production Planning and Marketing
A good number of farmers surveyed 83(60.1%) participated in collective production planning in
their respective groups whereas only 55 (39.9%) did not participate in collective production
planning in both seasons in 2012 especially among the new projects on the project.
In the first growing season, many farmers 106 (76.8%) did not participate in collective marketing
citing reasons like poor yields as a result of the bad weather, pests and diseases and some new
groups on the project had not started with practice of collective marketing with their members. It
was only 32 (23.2%) farmers who managed to participate in collective marketing.
In the second growing season, 105 (76.1%) farmers did not participate in collective marketing
citing reasons like low produce, need to cater for household expenses, whereas only 33 (23.9%)
participated in the marketing process as a group which shows 1% increment from last season.
Collective Acreage, Production and Sales
The mean acreages for both maize and soy beans planted first season collectively were 0.63 acres
and 0.32 acres respectively. Average quantities produced were 360.7Kgs and 30.7Kgs,
respectively, average quantities sold within the group for both maize and soybean - 103.12Kgs
and 10.7Kgs, respectively. The average price of maize and soybean sold within the group was at
Shs125 and Shs 134, respectively.
Table 14: Collective Acreages, Production and Sales
Crops Mean
Acreage
Average
production
Average
Kgs sold
Average
cost/kg
Maize 0.63 360.7 103.12 125
Soybean 0.32 30.7 10.7 134
Established Buyers
Neighbors
Middlemen
Markets
Schools
Otherspecify
4%
6%
63.80%
1.40%
1.40%
23.20% M
a
r
k
e
t
P
o
i
n
t
36
Farmers who participated in collective marketing sold their produce to mainly(17) middlemen,
(10) established buyers like Agridec Premier Seed Uganda Limited through VEDCO which
bought soybean from the farmers at relatively higher price compared to schools (1),
neighbors(3), markets (1) and the rest (106) sold to other buyers on the market.
The farmers who participated in joint marketing of their maize and soybeans, majority of the
farmers 100(72.5%) did not incur any costs, those who incurred costs were 38 (27.5%) as a result
of joint marketing of the produce, the cost was shs151,100 on mainly payment for bags, truck
rental and hired labor.
The survey also sought to find out if farmers made more money from joint marketing than
individual marketing and what they used the money for. Thus, many farmers responded that they
used the money to prepare their fields, cater for household expenditures and purchase
agricultural inputs for the next planting season.
Bulking and Selling Collectively
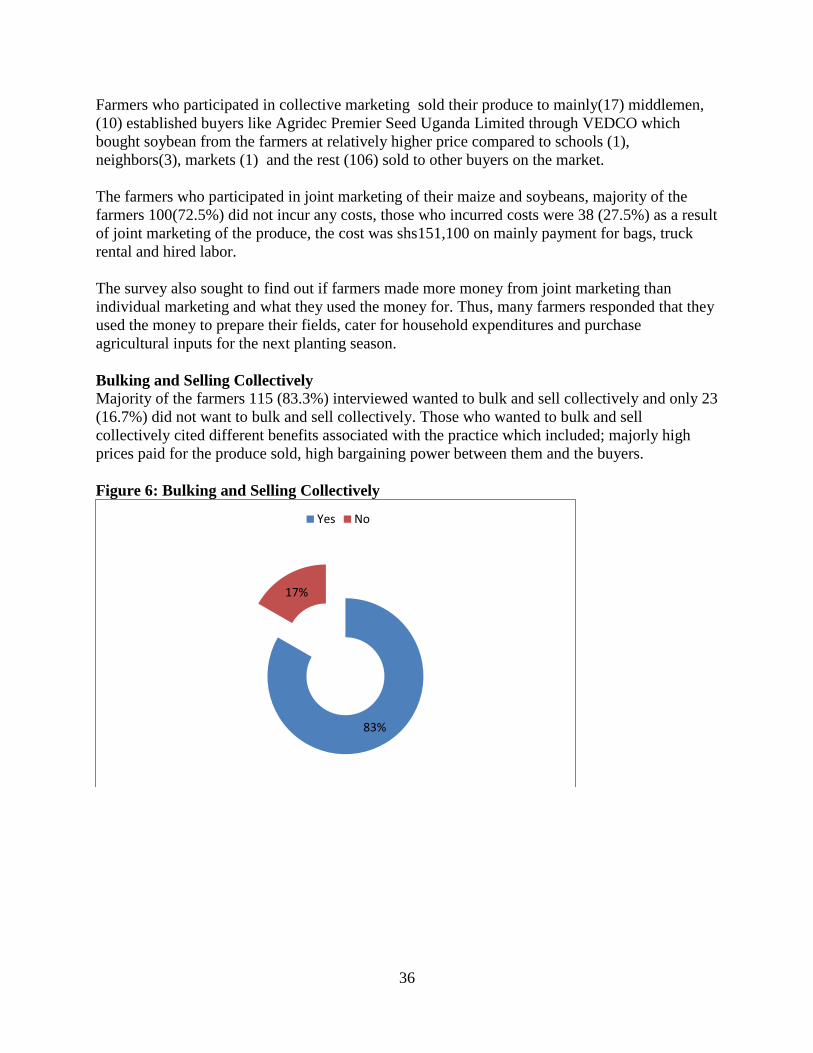
Majority of the farmers 115 (83.3%) interviewed wanted to bulk and sell collectively and only 23
(16.7%) did not want to bulk and sell collectively. Those who wanted to bulk and sell
collectively cited different benefits associated with the practice which included; majorly high
prices paid for the produce sold, high bargaining power between them and the buyers.
Figure 6: Bulking and Selling Collectively
83%
17%
Yes No
37
Rank of Maize and Soybean Quality
The rank of maize quality was generally good 91 (65.9%) as revealed by the majority of the
farmers, thanks to the trainings on seed quality they have received from the project, 32 (23.2%)
farmers, the quality was fair and only 15 (10.9%), the quality was poor as shown in the table
below.
Table 15: Rank of Maize Quality
Rank Frequency Percent
Good 91 65.9
Fair 32 23.2
Poor 15 10.9
Total 138 100
The main reasons cited for the above ranks for maize quality were mainly the trainings on seed
quality they have received from the project, the good post-harvest handling practices they have
adopted from the project.
Rank of Soybean Quality
The rank of soybean quality was also largely good 84 (60.9%) as revealed by most of the farmers
who had planted the crop, poor quality 20 (18.1%),fair quality were 20(14.5%) and the rest
9(6.5%) were not bothered about the quality of soy bean.
Table16: Rank of Soybean Quality
Rank Frequency Percent
Good 84 60.9
Fair 20 14.5
Poor 25 18.1
Not applicable 9 6.5%
Total 138 100
This good quality was also attributed to the several trainings on seed quality, post-harvest
handling practices to be employed, clean and high quality seed they were receiving from the
project.
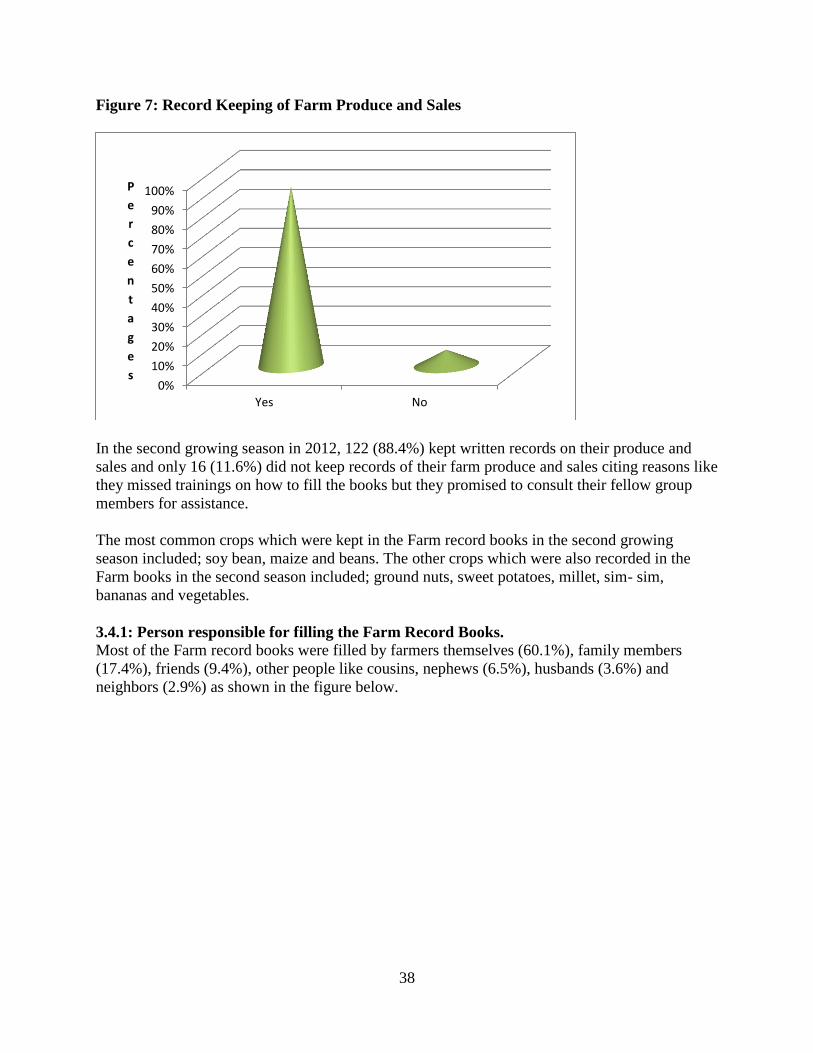
Written Record Keeping of Farm Produce and Sales Majority of the households 127(92%) interviewed revealed that they did keep written records of
the farm produce and sales before in the first growing season, only 8 farmers (8%) responded
that they were yet to keep written records on their farm produce and sales especially the new
project beneficiaries.
38
Figure 7: Record Keeping of Farm Produce and Sales
In the second growing season in 2012, 122 (88.4%) kept written records on their produce and
sales and only 16 (11.6%) did not keep records of their farm produce and sales citing reasons like
they missed trainings on how to fill the books but they promised to consult their fellow group
members for assistance.
The most common crops which were kept in the Farm record books in the second growing
season included; soy bean, maize and beans. The other crops which were also recorded in the
Farm books in the second season included; ground nuts, sweet potatoes, millet, sim- sim,
bananas and vegetables.
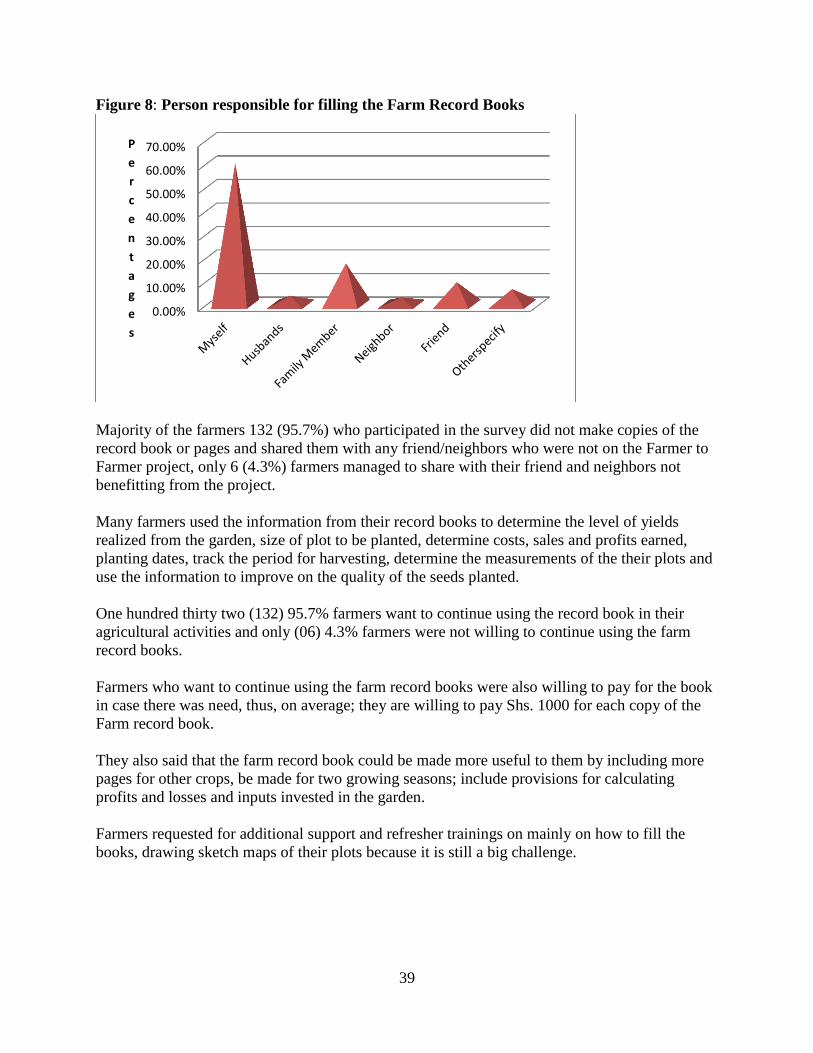
3.4.1: Person responsible for filling the Farm Record Books.
Most of the Farm record books were filled by farmers themselves (60.1%), family members
(17.4%), friends (9.4%), other people like cousins, nephews (6.5%), husbands (3.6%) and
neighbors (2.9%) as shown in the figure below.
0%
10%
20%
30%
40%
50%
60%
70%
80%
90%
100%
Yes No
P
e
r
c
e
n
t
a
g
e
s
39
Figure 8: Person responsible for filling the Farm Record Books
Majority of the farmers 132 (95.7%) who participated in the survey did not make copies of the
record book or pages and shared them with any friend/neighbors who were not on the Farmer to
Farmer project, only 6 (4.3%) farmers managed to share with their friend and neighbors not
benefitting from the project.
Many farmers used the information from their record books to determine the level of yields
realized from the garden, size of plot to be planted, determine costs, sales and profits earned,
planting dates, track the period for harvesting, determine the measurements of the their plots and
use the information to improve on the quality of the seeds planted.
One hundred thirty two (132) 95.7% farmers want to continue using the record book in their
agricultural activities and only (06) 4.3% farmers were not willing to continue using the farm
record books.
Farmers who want to continue using the farm record books were also willing to pay for the book
in case there was need, thus, on average; they are willing to pay Shs. 1000 for each copy of the
Farm record book.
They also said that the farm record book could be made more useful to them by including more
pages for other crops, be made for two growing seasons; include provisions for calculating
profits and losses and inputs invested in the garden.
Farmers requested for additional support and refresher trainings on mainly on how to fill the
books, drawing sketch maps of their plots because it is still a big challenge.
0.00%
10.00%
20.00%
30.00%
40.00%
50.00%
60.00%
70.00%P
e
r
c
e
n
t
a
g
e
s
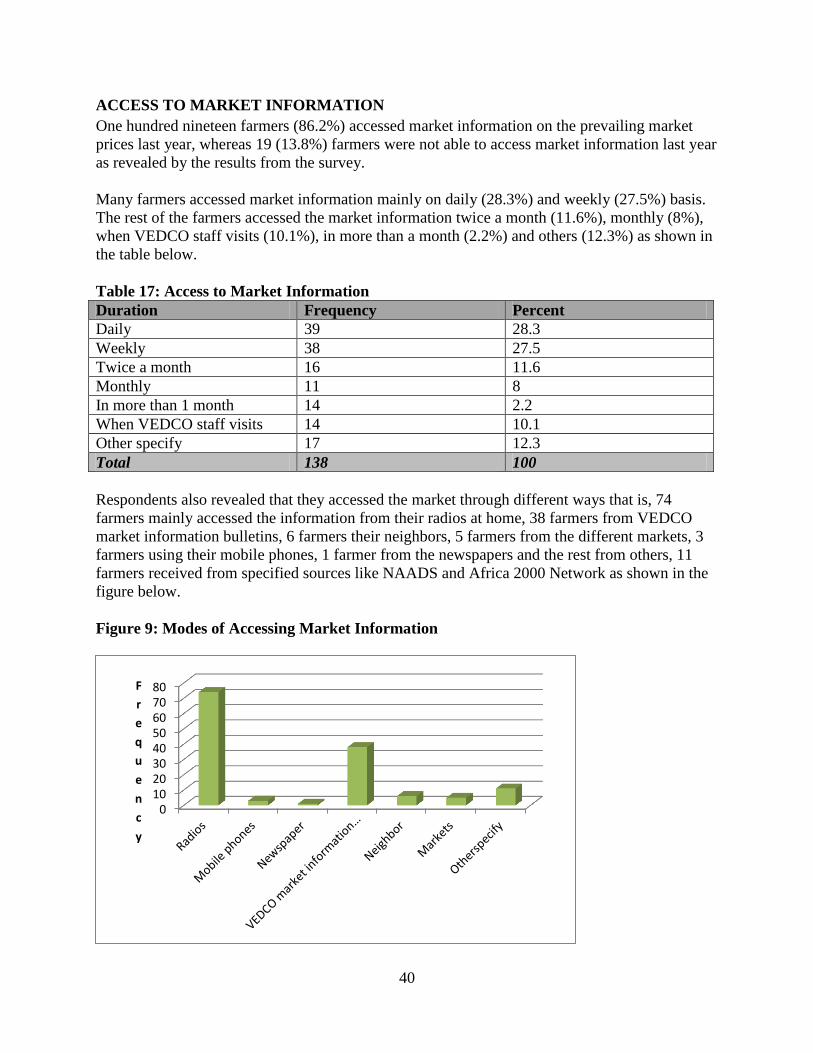
40
ACCESS TO MARKET INFORMATION
One hundred nineteen farmers (86.2%) accessed market information on the prevailing market
prices last year, whereas 19 (13.8%) farmers were not able to access market information last year
as revealed by the results from the survey.
Many farmers accessed market information mainly on daily (28.3%) and weekly (27.5%) basis.
The rest of the farmers accessed the market information twice a month (11.6%), monthly (8%),
when VEDCO staff visits (10.1%), in more than a month (2.2%) and others (12.3%) as shown in
the table below.
Table 17: Access to Market Information
Duration Frequency Percent
Daily 39 28.3
Weekly 38 27.5
Twice a month 16 11.6
Monthly 11 8
In more than 1 month 14 2.2
When VEDCO staff visits 14 10.1
Other specify 17 12.3
Total 138 100
Respondents also revealed that they accessed the market through different ways that is, 74
farmers mainly accessed the information from their radios at home, 38 farmers from VEDCO
market information bulletins, 6 farmers their neighbors, 5 farmers from the different markets, 3
farmers using their mobile phones, 1 farmer from the newspapers and the rest from others, 11
farmers received from specified sources like NAADS and Africa 2000 Network as shown in the
figure below.
Figure 9: Modes of Accessing Market Information
01020304050607080F
r
e
q
u
e
n
c
y

41
POST HARVEST HANDLING TECHNOLOGIES
A big number of farmers interviewed had received many training on post- harvest handling
practices for both maize and soy bean. These ranged from drying, sorting and grading as
revealed by the farmers during the survey.
Post-Harvest Handling Practices Used for Maize and Soybean
Majority of the farmers 124(89.9%) interviewed dried their produce and grains on tarpaulins, 11
(8%) farmers on bare ground, 2 (1.4%) farmers on iron sheets and 1 (0.7%) on cemented floors
as shown in the table below..
Table 18: Post Harvest Handling Practices used on Maize and Soybean
Practice Frequency Percent
Tarpaulins 124 89.9
Bare ground 11 8
Cemented floor 1 0.7
Iron sheet 2 1.4
Total 138 100
The survey also wanted to look at what crops were mainly dried on tarpaulins in the different
growing seasons and these included; soybean, maize, beans, ground nuts, coffee, sim-sim, millet
and grain amaranth.
Fifty four (54) farmers confessed to have used the tarpaulins for other purposes while 84 farmers
used the tarpaulins only for drying their grain and produce. Other purposes they used the
tarpaulins included; during burials, shelter and as mats for sitting on.
Majority of the farmers 99 (71.7%) were planning to use another tarpaulin in 2013, and 39
(28.3%) farmers were not planning to use another tarpaulin in 2013, since the tarpaulins from the
project where still in good condition and others could not afford the price.
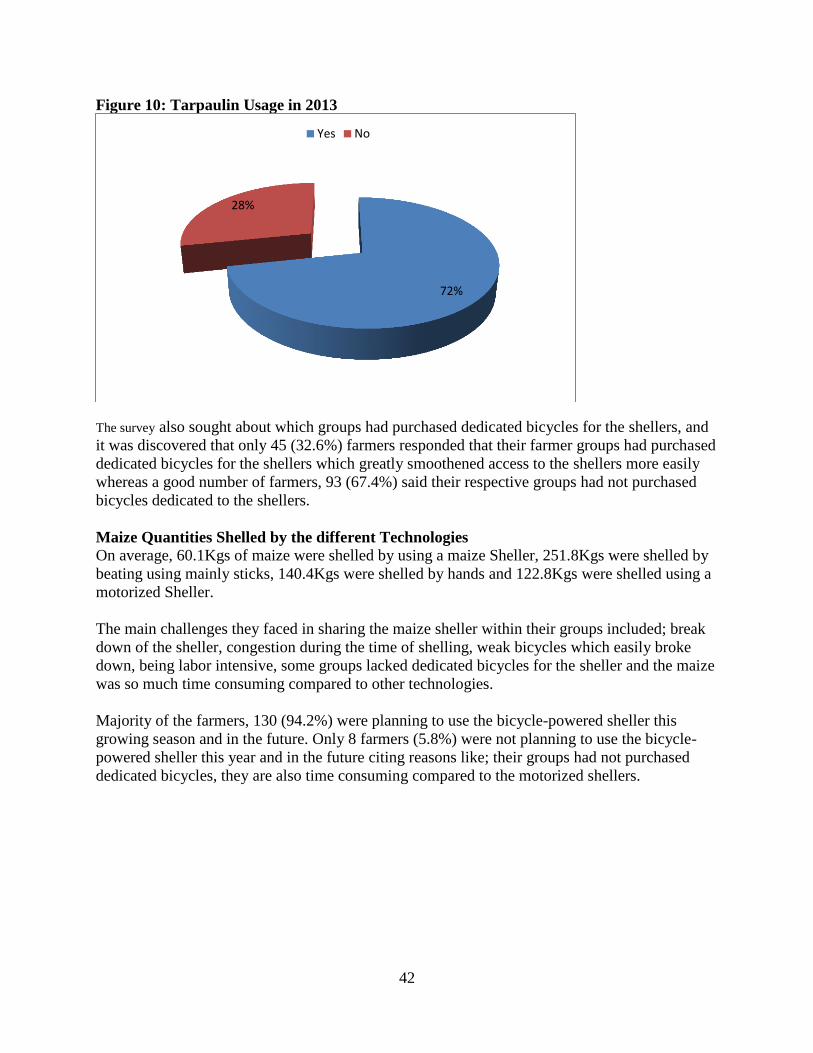
42
Figure 10: Tarpaulin Usage in 2013
The survey also sought about which groups had purchased dedicated bicycles for the shellers, and
it was discovered that only 45 (32.6%) farmers responded that their farmer groups had purchased
dedicated bicycles for the shellers which greatly smoothened access to the shellers more easily
whereas a good number of farmers, 93 (67.4%) said their respective groups had not purchased
bicycles dedicated to the shellers.
Maize Quantities Shelled by the different Technologies
On average, 60.1Kgs of maize were shelled by using a maize Sheller, 251.8Kgs were shelled by
beating using mainly sticks, 140.4Kgs were shelled by hands and 122.8Kgs were shelled using a
motorized Sheller.
The main challenges they faced in sharing the maize sheller within their groups included; break
down of the sheller, congestion during the time of shelling, weak bicycles which easily broke
down, being labor intensive, some groups lacked dedicated bicycles for the sheller and the maize
was so much time consuming compared to other technologies.
Majority of the farmers, 130 (94.2%) were planning to use the bicycle-powered sheller this
growing season and in the future. Only 8 farmers (5.8%) were not planning to use the bicycle-
powered sheller this year and in the future citing reasons like; their groups had not purchased
dedicated bicycles, they are also time consuming compared to the motorized shellers.
72%
28%
Yes No
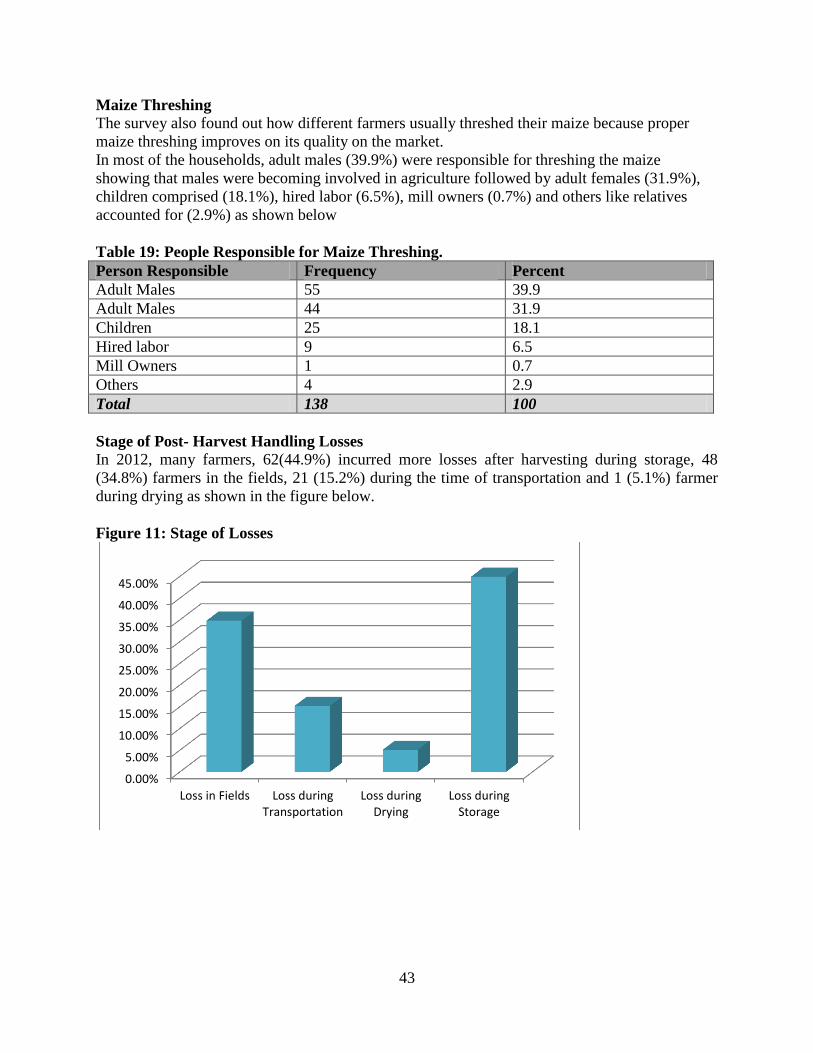
43
Maize Threshing
The survey also found out how different farmers usually threshed their maize because proper
maize threshing improves on its quality on the market.
In most of the households, adult males (39.9%) were responsible for threshing the maize
showing that males were becoming involved in agriculture followed by adult females (31.9%),
children comprised (18.1%), hired labor (6.5%), mill owners (0.7%) and others like relatives
accounted for (2.9%) as shown below
Table 19: People Responsible for Maize Threshing.
Person Responsible Frequency Percent
Adult Males 55 39.9
Adult Males 44 31.9
Children 25 18.1
Hired labor 9 6.5
Mill Owners 1 0.7
Others 4 2.9
Total 138 100
Stage of Post- Harvest Handling Losses
In 2012, many farmers, 62(44.9%) incurred more losses after harvesting during storage, 48
(34.8%) farmers in the fields, 21 (15.2%) during the time of transportation and 1 (5.1%) farmer
during drying as shown in the figure below.
Figure 11: Stage of Losses
0.00%
5.00%
10.00%
15.00%
20.00%
25.00%
30.00%
35.00%
40.00%
45.00%
Loss in Fields Loss duringTransportation
Loss duringDrying
Loss duringStorage

44
The major causes of losses as elicited by farmers included; pests attack like rats, weavils,
termites, then prolonged drought conditions, destruction by animals and thieves, heavy rainfall
experienced during the season, late planting of seeds, long distances to both the markets and
storage points, poor state of storage facilities and increased negligence by laborers during the
time of harvesting.
A huge percentage of maize (80%) was also lost/ spoiled by farmers in the first season of 2012 as
revealed by the farmers during the survey, but as a result of the Farmer to Farmer project, the
amount of spoilage of maize has tremendously lowered,thanks to the different intervetions like
trainings, technical support, input support of quality and clean maize from the project.
Farmers also suggested appropriate technologies that can reduce the above losses which
included; provision of fertilizers, provision of tarpaulins, intensify on the trainings on Post -
harvest handling, spraying during the time of planting to control pests like weevils and use of
traps to control rats.
ACCESS TO EXTENSION SERVICES
Majority of the farmers revealed that they accessed the extension services from their group
leaders mainly weekly basis (39.1%), followed by those who access them twice a month
(32.6%), (11.6%) on monthly basis, (15.9%) never accessed and on quarterly basis (0.7%) as
shown in the table below.
Table 20: ACCESS TO EXTENSION SERVICES
Time Frame Frequency Percent
Weekly 54 39.1
Twice a month 45 32.6
Never 22 15.9
Monthly 16 11.6
Quarterly 1 0.7
Total 138 100
PROJECT IMPACT
This section included the changes in incomes farmers have realized as a result of the project,
rank the importance of tarpaulins, bicycle shellers and group marketing, changes in maize quality
and changes experienced in the household as a result of the project.
Thus, farmers reported an increase in incomes from maize in 2012 as a result of the knowledge
and skills they had attained from the project mainly through the different trainings focusing on
maize agronomy, post-harvest handling, collective marketing and record keeping.
On average, farmers ranked tarpaulins the highest (2.24) of importance to them during project
implementation, followed by group marketing (1.96) of their produce and bicycle sheller (1.72)
implying not many farmers have benefited from the technology as yet compared to the practices
above.
45
Many farmers also confessed that there were changes in the maize they consume at home as a
result of the Farmer to Farmer project and these changes included: improved nutrition especially
among children inform of porridge, high price from the sales of quality maize on the market.
Project Impact in the Household
Majority of the farmers, 133 (96.4%) who participated in the survey elicited that the project has
brought about a number of changes in their households, only 5 (3.6%) responded that there has
not been great impact caused by the project in their households.
These changes which they have experienced by using the incomes they have earned from the
sales of soybean and maize include: ability to pay school fees and scholastic materials for their
children, pay medical bills, cater for household expenditures, purchase agro-inputs and livestock,
and hire additional land for increased cultivation.
Recommended