Step 1: Choose a Topic. Get a notebook to record all information
collected for your project. Do research to learn as much as you can
about the experiment topic. Ask questions about your topic that you want
to answer and make sure you can observe and measure data.
More research may be needed after you decide what to investigate in your experiment.
Try the library and the internet. Cite your sources in the Bibliography.
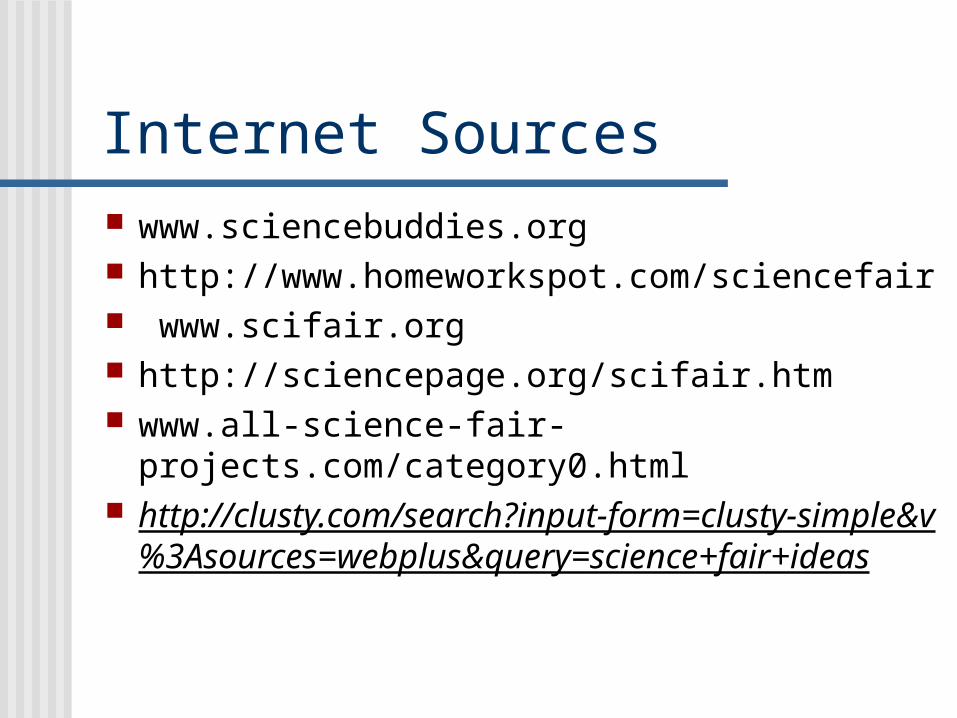
Internet Sources www.sciencebuddies.org http://www.homeworkspot.com/sciencefair www.scifair.org http://sciencepage.org/scifair.htm www.all-science-fair- projects.com/category0.html http://clusty.com/search?input-form=clusty-simple&v%3Asources=webplus&query=science+fair+ideas

Step 2 Ask a Question
Identify a question that can be answered by performing an experiment.
An experiment is a set of
steps you follow to test a hypothesis.
This question will be the Problem Statement.

Step 3: Make a Hypothesis
Look at the Problem Statement and identify the one factor that can be tested. This is the manipulated or independent variable.
Form an idea or educated prediction that can be tested by an experiment.
Write down your Hypothesis: “If …. then (this) will happen.”

Step 4: Plan the Investigation
Identify and record the factors that can affect the results of the experiment under Variables.
1. Manipulated (independent) variable or the factor that is changed in the experiment. (See previous Step 3.)
2. Controlled variables or all the factors to be kept the same in the experiment. 3. Responding (dependent) variable or the data to be collected during the experiment.
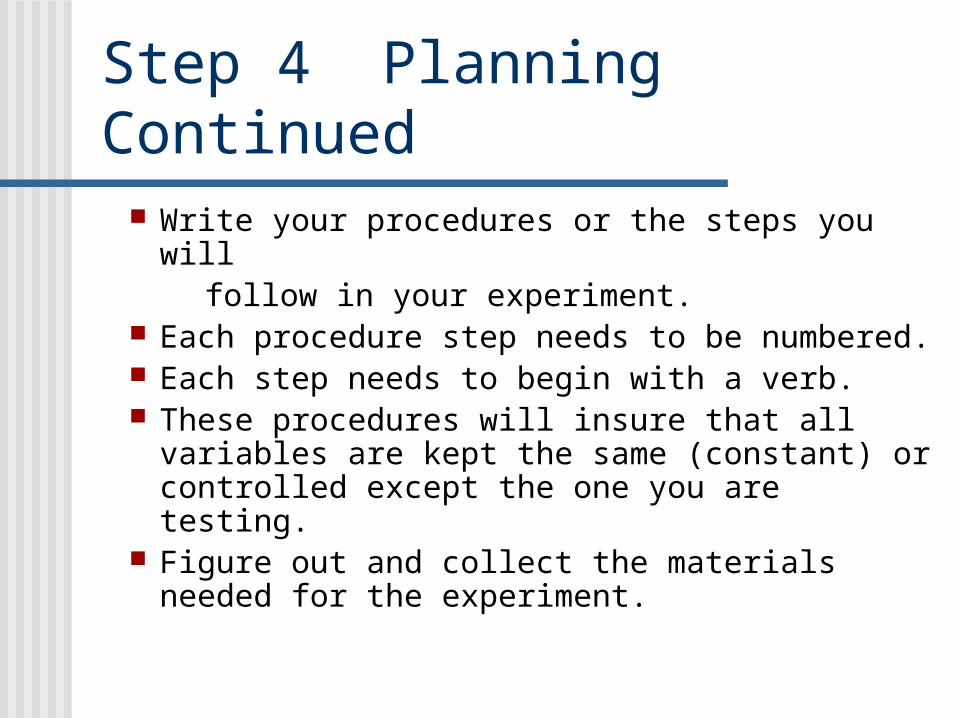
Step 4 Planning Continued Write your procedures or the steps you will follow in your experiment. Each procedure step needs to be numbered. Each step needs to begin with a verb. These procedures will insure that all variables
are kept the same (constant) or controlled except the one you are testing.
Figure out and collect the materials needed for the experiment.

Step 5: Collect, Organize, and Display Data
Start the experiment. Observe and record the quantitative data
(numbers or measurements) collected during the experiment on a data table.
Repeat the experiment three or more times to confirm results.
Graph your data from all trials. (Dry Mix) Display under Data. Restate your data in a narrative form under
Results.

Step 6: Drawing Conclusions* What was investigated? (Describe the problem
statement.) Restate your hypothesis, and tell if
it was supported(true) or not supported(false). What were the major findings? (Explain your
results.)
*Power Writing Connections Art of Scientific Conclusions

Step 7 Making Applications*
What recommendations do you have for further study and for improving the experiment?
Explain what you learned from your experiment that could be applied in real life.
List any new questions that your experiment lead you to ask that could be tested in a new investigation.
*Using Power Writing.

Step 8 Abstract and Bibliography
Describe your purpose and hypothesis. Briefly describe your procedure. Describe and explain your results and also
state if your hypothesis was supported or not by the results. Give possible reasons.
Explain your conclusion. List your bibliography of three or more sources.

Science Fair Project Template Each of the following slides are designed to
present a step in your science investigation using the Scientific Method.
Write all your project information in the corresponding slides.
Slide 9 between Data and Results contains an Excel connection to create a bar graph. You can use all, some, or replace the clip art. Delete this slide after you complete your
presentation.
Problem Statement

VariablesConstant Variables:
Manipulated Variable:
Responding Variable:
Hypothesis:
Materials

Procedures .
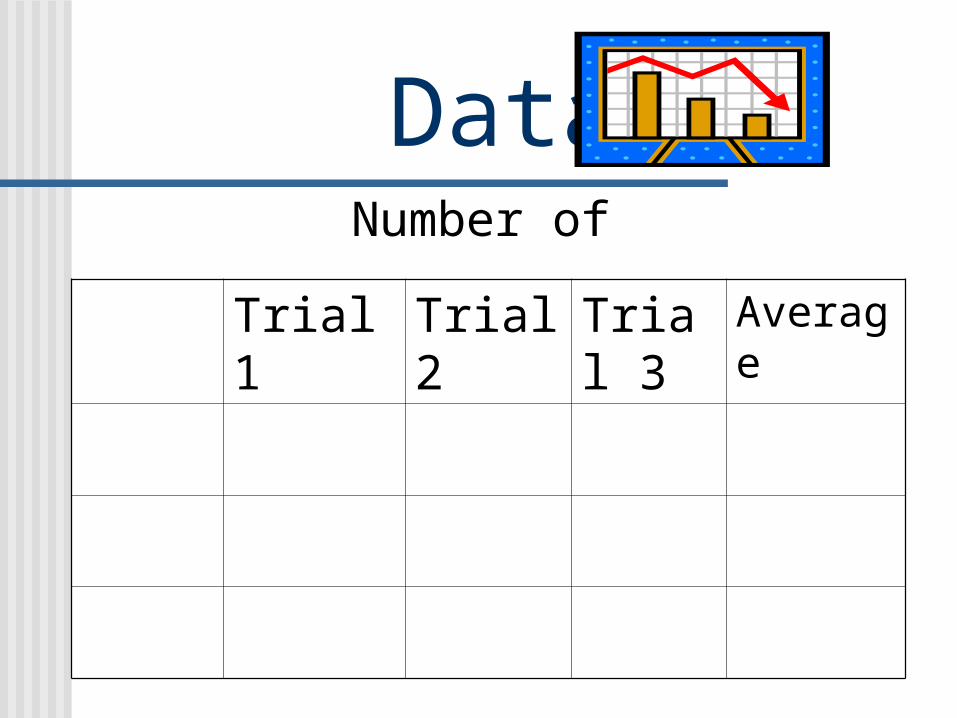
Data Number of
Trial 1 Trial 2 Trial 3 Average
Results
Data from the three trials shows that the
Data from the three trials shows that the
Data from the three trials shows that the

Conclusion
The data my hypothesis. In all three trials,

Application
The project may have been improved

Abstract & Bibliography

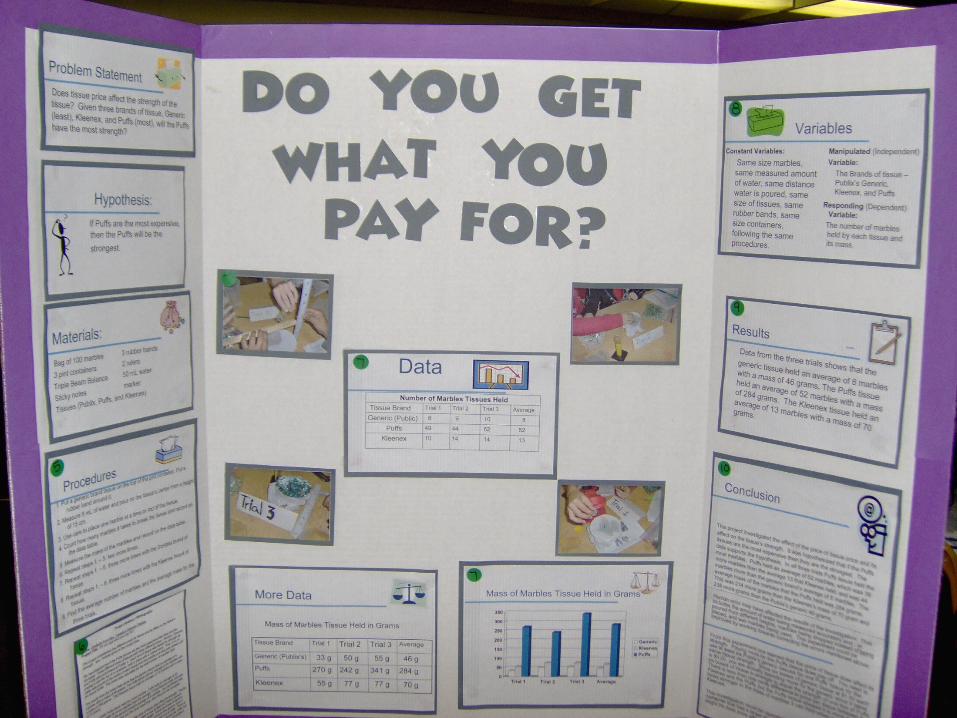
Do You Get What You Pay For?
Mrs.Tweedy’s Grade 5 Students
Winston Park K – 8 Center

Problem Statement
Does tissue price affect the strength of the tissue? Given three brands of tissue, Generic (least), Kleenex, and Puffs (most), will the Puffs have the most strength?

VariablesConstant Variables:
Same size marbles, same measured amount of water, same distance water is poured, same size of tissues, same rubber bands, same size containers, following the same procedures
Manipulated (Independent)
Variable:
The Brands of tissue – Publix’s Generic, Kleenex, and Puffs
Responding (Dependent) Variable:
The number of marbles held by each tissue and their mass.

Hypothesis: If Puffs are the most expensive,
then the Puffs will be the
strongest.

Materials:Bag of 100 marbles 2 rulers marker
3 pint containers Triple Beam Balance
50 mL water 3 rubber bands Sticky notes
Publix, Puffs, and Kleenex brand tissues

Procedures
1. Put a generic brand tissue on the top of the pint container. Put a rubber band around it.
2. Measure 5 mL of water and pour on the tissue’s center from a height of 15 cm.
3. Use care to place one marble at a time on top of the tissue.
4. Count how many marbles it takes to break the tissue and record on the data table.
5. Measure the mass of the marbles and record on the data table.
6. Repeat steps 1. – 5. two more times.
7. Repeat steps 1. – 6. three more times with the Scotties brand of tissue.
8. Repeat steps 1. – 6. three more times with the Kleenex brand of tissue.
9. Find the average number of marbles and the average mass for the
three trials.

Data Number of Marbles Tissues Held
Tissue Brand Trial 1 Trial 2 Trial 3 Average
Generic (Public) 6 9 10 8
Puffs 49 44 62 52
Kleenex 10 14 14 13
More Data
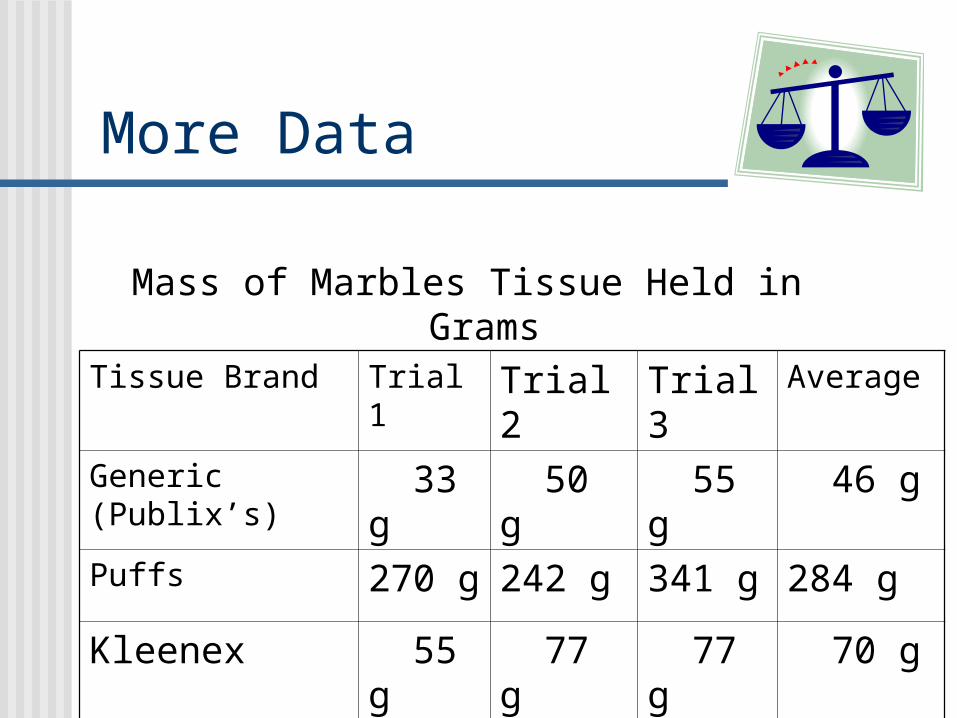
Mass of Marbles Tissue Held in Grams
Tissue Brand Trial 1 Trial 2 Trial 3 Average
Generic (Publix’s) 33 g 50 g 55 g 46 g
Puffs 270 g 242 g 341 g 284 g
Kleenex 55 g 77 g 77 g 70 g

Mass of Marbles Tissue Held in Grams
0
50
100
150
200
250
300
350
Trial 1 Trial 2 Trial 3 Average
GenericKleenexPuffs
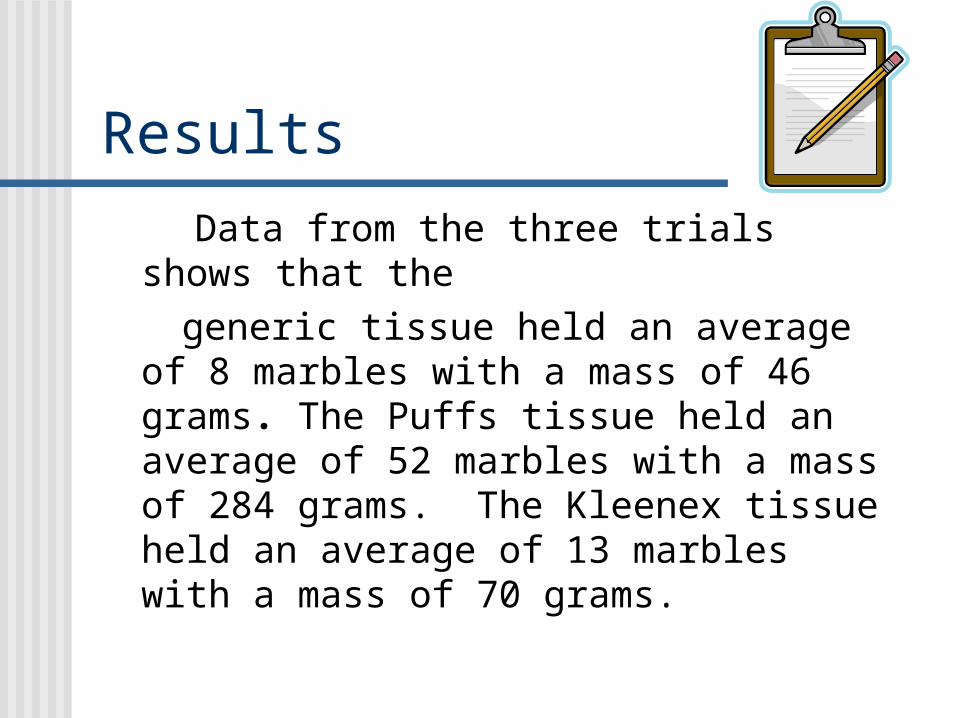
Results
Data from the three trials shows that the
generic tissue held an average of 8 marbles with a mass of 46 grams. The Puffs tissue held an average of 52 marbles with a mass of 284 grams. The Kleenex tissue held an average of 13 marbles with a mass of 70 grams.

Conclusion This project investigated the different costs for tissue and
its effect on the tissue quality of having more strength in holding marbles. It was hypothesized that if the Puffs tissues are the most expensive then they are the strongest and will hold the most marbles. The data supports the hypothesis. In all three trials Puffs tissue held the most marbles. Puffs held an average of 52 marbles, which was 39 more marbles than the average 13 that Kleenex held, and was 44 marbles more than the Publix brand’s average of 8 marbles. The average mass of the marbles that the Puffs held was 284 grams. This was 214 more grams than the Kleenex’s mass of 70 gram and 238 more grams than the Publix’s 46 grams.

Human error may have affected the results of the investigation. This includes the amount of water being measured accurately and / or poured from different heights, marbles being dropped instead of being placed, and wet marbles being used. This experiment could be improved by trying to correct the errors mentioned above. This investigation could be repeated using more or less water or with a container that had a larger diameter.
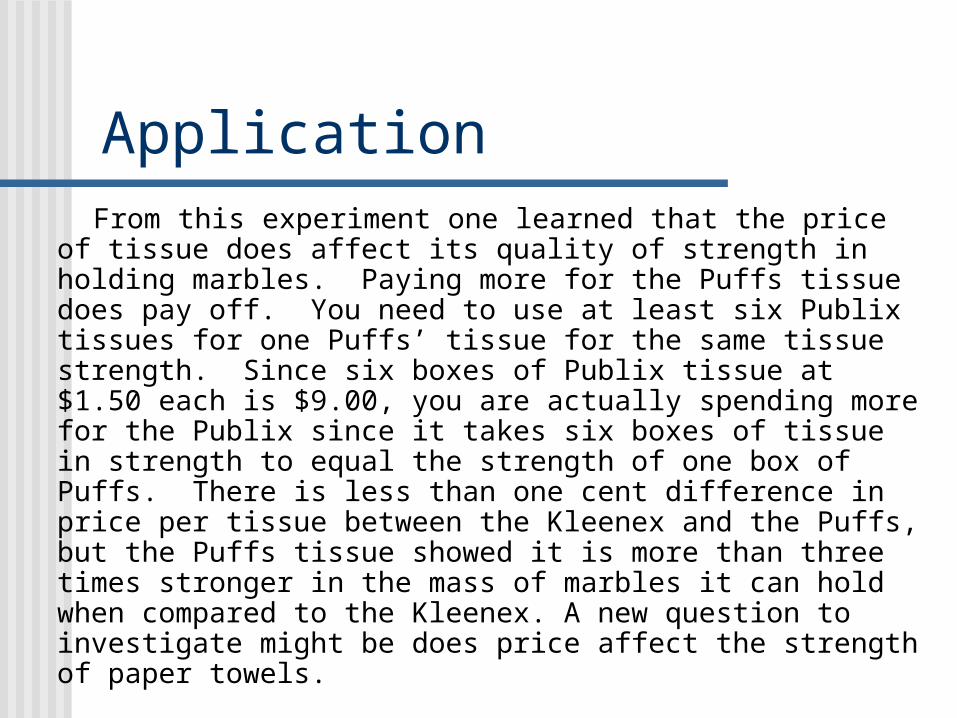
Application From this experiment one learned that the price of tissue
does affect its quality of strength in holding marbles. Paying more for the Puffs tissue does pay off. You need to use at least six Publix tissues for one Puffs’ tissue for the same tissue strength. Since six boxes of Publix tissue at $1.50 each is $9.00, you are actually spending more for the Publix since it takes six boxes of tissue in strength to equal the strength of one box of Puffs. There is less than one cent difference in price per tissue between the Kleenex and the Puffs, but the Puffs tissue showed it is more than three times stronger in the mass of marbles it can hold when compared to the Kleenex. A new question to investigate might be does price affect the strength of paper towels.

Bibliography
1. http://www.emilypost.com/newsroom/releases/puffs.pdf2. http://www.kleenex.com?USA/Home.aspx?sectionID=&s=3. Cooney, Timothy, Scott Foresman Science Gr. 2, 2007, p. 420- 421, Pearson Education, Inc.
Recommended