FINAL DRAFT
Initial National Communication under
the United Nations Framework
Convention on Climate Change
Sri Lanka
27th October, 2000

Foreword

Acknowledgements
T A B L E O F C O N T E N T S
Page
FOREWORD
ACKNOWLEDGEMENTS
CONTRIBUTORS I
LIST OF FIGURES III
LIST OF TABLES IV
ABBREVIATIONS VII
EXECUTIVE SUMMARY VIII
CHAPTER 1: INTRODUCTION 1
CHAPTER 2: NATIONAL CIRCUMSTANCES 22.1 Geography 22.2 Climate 22.3 Population and Human Settlements 82.4 The Sri Lankan Economy 102.5 Economic Activities 132.6 Energy Production and Consumption 162.7 Natural Resources 232.8 Social Profile 272.9 Political Profile 282.10 Institutional Structure 302.11 Policies Relating to Climate Change 30
CHAPTER 3: GREENHOUSE GAS INVENTORY 333.1 Energy and Transformation Industries 343.2 Manufacturing Industries and Construction 373.3 Transport 393.4 Other Sectors having Emissions from Energy Consumption 433.5 Industrial Processes 483.6 Livestock Sector 533.7 Agriculture Sector 563.8 Forestry and Land Use Sector 593.9 Waste 61
CHAPTER 4: IMPACTS AND VULNERABILITY 64Introduction 644.1 Impacts of Rise in Sea Level 644.2 Impacts of Temperature Rise 694.3 Impacts of Droughts 704.4 Impacts of High Intensity Rainfall 724.5 Impacts of Increased Thunder-Activity 744.6 Impacts of Climate Change on Human Settlements 75
CHAPTER 5: MITIGATION OPTIONS AND ADAPTATION RESPONSES 76Introduction 765.1 Mitigation Options 765.2 Adaptation Responses 78

CHAPTER 6: POLICIES AND MEASURES 846.0 Policies and Measures 846.1 General Recommendations 846.2 Specific Recommendations 846.3 Further Issues to be Considered 88
CHAPTER 7: EDUCATION, TRAINING AND AWARENESS 89Introduction 897.1 Education 897.2 Training 897.3 Awareness 907.4 Centre for Climate Change Studies 90
CHAPTER 8: RECOMMENDED RESEARCH STUDIESAND PORTFOLIO OF PROJECTS 91
Introduction 918.1 Research Studies 918.2 Projects 92
CHAPTER 9: CONSTRAINTS AND TECHNOLOGICAL NEEDS 969.1 Constraints 969.2 Technological Needs 96
BIBLIOGRAPHY 98

I
CONTRIBUTORS
Greenhouse Gas Inventory 1993-1995Prof. Noel Fernando, Faculty of Engineering, University of PeradeniyaProf. Nimal Perera, Faculty of Agriculture, University of Peradeniya
National Action Plan on Climate ChangeDr. J. Handawela - Agriculture, Forestry, Land Use & Water ResourcesMr. G.B.A. Fernando - Energy, Industry, Transport & HighwaysProf. S.S.L. Hettiarachchi & Dr. Mahesha Ranasoma – Coastal Zone, Ports & FisheriesMr. S.W.P. Bulankulame – Health, Human Settlements & Public UtilitiesDr. Mahesha Ranasoma - Lead Consultant
Energy: fossil fuelsDr. Priyantha Wijayatunga, University of Moratuwa - Team LeaderMr. Upali DaranagamaMr. Shavindranath FernandoMr. E.M. PiyasenaMs. Kiran DhanapalaMr. Sanath Ranawana
Energy: alternatives to fossil fuelsMr. P.G. Joseph, Energy Conservation Fund - Team LeaderMr. L. AriyadasaMr. Lalith GunarathneDr. Ranjith Obeysekera
Transport:Dr. Saman Bandara, University of Moratuwa - Team LeaderMr. D.S. JayaweeraMr. J. DiandasMr. Priyal de SilvaMr. Kingsley FernandoMr. D.S. Edirisinghe
Industry/Industrial and Urban WasteDr. A.M. Mubarak, Industrial Technology Institute - Team LeaderMiss Padmini BatuwitageMrs. Ramani EllepolaMr. Justin PereraMr. M.M.S.S.B. Yalegama
Agriculture:Dr. Deepthi Bandara, University of Peradeniya - Team LeaderMr. M.A. WijeratneMr. M. WatsonDr. Kapila MunasingheDr. Lionel Gunaratne
Forestry:Mr. Sarath Fernando, Forest Department - Team LeaderDr. B.M. Singha KumaraProf. Anoja WickramasingheMr. W.A.D.A. Wijesuriya

II
Water Resources:Dr. Shanthi de Silva, Open Univ. of Sri Lanka - Team LeaderMr. K.A.W. KodituwakkuMrs. G.B.U. Kamaladasa
Coastal Zones, Ports, Fisheries and Tourism:Prof. Samantha Hettiarachchi, University of Moratuwa - Team LeaderMr. Nissanka PereraMr. G. PiyasenaMr. A.A. KulatungaMr. S. Kalaichelvam
Human Health:Prof. Manel Wijesundara, University of Peradeniya - Team LeaderDr. H.M. FernandoDr. Lalani RajapakseDr. H.M.S.S.D. HerathDr. Ranjit Alwis
Human Settlements and Public UtilitiesMrs. Hester Basnayake, Urban Development Authority - Team LeaderMrs. Niromi NarampanawaMr. Padmasiri PereraMr. N.M.S.I. ArambepolaMr. L. HewawasamMrs. Neela P. GunasekeraMr. P.P. Noordeen
Honorary Adviser, Land Use –Dr. Percy Silva
Policies and MeasuresMrs. M.A. Kumaradasa, Director (Planning), Ministry of Forestry & Environment
Preparation of the National CommunicationDr. Percy Silva, Lead ConsultantProf. Samantha HettiarachchiDr. Priyantha WijayatungeMr. T.K. Fernando
Review of Greenhouse Gas Inventory 1993-1995Dr. A.W. MohottalaDr. B.V.R. Punyawardena
MapsSurvey Department of Sri LankaDepartment of Meteorology, Sri Lanka
Enabling Activity Project CoordinationDr. Rupa WickremaratneMrs. Swineetha Malalasekera

III
LIST OF FIGURES
Page
2.1 Relief & Drainage of Sri Lanka 4
2.2 Mean Annual Rainfall (1961-1990) 6
2.3 Mean Annual Air Temperature (1961-1990) 7
2.4 Agro-Ecological Regions 9
2.5 Population Density 11
2.6 Transport 12
2.7 Tourism 15
2.8 Primary Energy Supply in Sri Lanka (1996) 16
2.9 Growth of Electricity Sales over the period (1972-96) 17
2.10 Electrification Level in Different Districts 17
2.11 Growth of the Electricity Generation Sector (1998-2017) 19
2.12 Composition of Petroleum Product Consumption (1996) 19
2.13 Historical Growth in Petroleum Product Consumption 20
2.14 Expected Growth in Petroleum Product Consumption 20
2.15 Fuelwood Supply in the Region from Different Sources 21
2.16 Land Use 21
2.17 Mineral Resources 26
2.18 Administrative Divisions 29
4.1 The Coastal Zone of Sri Lanka as defined by theCoast Conservation Act of 1981 66

IV
LIST OF TABLESPage
2.1 National Circumstances 3
3.0 Conversion Factors and Carbon Emission Factors for different typesof Fuels in Sri Lanka 33
3.1 Carbon Emission Factors and Fraction Oxidized 34
3.2 GHG Emission Factors 34
3.3 Emissions from Power Stations – 1994 34
3.4 Consumption of Fossil Fuel by Refinery for Own Use 35
3.5 Fuel and Emissions Data 35
3.6 Emissions from Fuel Combustion within Refinery 35
3.7 Emission Factors for Bagasse 36
3.8 Emissions from Use of Bagasse 36
3.9 Production of Charcoal in Sri Lanka – 1994 36
3.10 Emissions Data for the Consumption and Manufacture of Charcoal 37
3.11 Emissions in Charcoal Production 37
3.12 Fuel Combustion Data for Industrial Sectors 38
3.13 Emission Factors Applicable to the Industrial Sector 38
3.14 Average Emission Factors for Liquid Fuel Mix for the Industrial Sector – 1994 38
3.15 Estimate of Emissions from Fuel Combustion in the Industrial Sector – 1994 39
3.16 Fuel Consumption (by Volume) in Road Transport Sector – 1994 40
3.17 Fuel Consumption (by Weight) in Road Transport Sector 40
3.18 Fuel Consumption in International Bunkers – 1994 41
3.19 Carbon Emission Factors Used 41
3.20 a Non CO2 Emission Factors for Individual Road Vehicle Types 41
3.20 b Non CO2 Emission Factors for Individual Road Vehicle Types (Diesel) 42
3.21 Non CO2 Emission Factors 42
3.22 CO2 Emission from the Transport Sector – 1994 42
3.23 Non CO2 Emissions from the Transport Sector – 1994 43
3.24 Emission Factors 43
3.25 Estimate of Emissions from the Commercial Sector – 1994 43
3.26 Fuel Consumption by the Residential Sector 44
3.27 Emission Factors for Non CO2 Gases for Residential Sector 44
3.28 Estimate of Emissions from the Residential Sector – 1994 44
3.29 Fuel Consumption by the Agricultural/Forestry Sector 45

V
3.30 Emission Factors for Non CO2 Gases for Agricultural/Forestry Sector 45
3.31 Fishing Fleet in Sri Lanka – 1994 45
3.32 Fuel Consumption by Fishing Boats – 1994 46
3.33 Emission Factors for Non CO2 Gases for Fisheries Sector 46
3.34 Emission Factors for Non CO2 Gases for Combined Agriculture,Forestry and Fisheries Sectors – 1994 46
3.35 Overall Emissions from Agriculture, Forestry and Fisheries Sectors – 1994 47
3.36 Emission Factors 47
3.37 Emissions due to Fugitive Activities – 1994 48
3.38 Clinker Production Data of the Puttalam Cement Factory – 1994 48
3.39 Emission Factors for Asphalt Roofing Production 50
3.40 Emission Factors for Asphalt Use on Roads 50
3.41 Emission Factors for Rolling Mills 51
3.42 Emission Factors for Kraft Pulping Process 51
3.43 Annual Production of NMVOC Emitting Food Industries in Sri Lanka 51
3.44 Emission Factors for NMVOC: for Food Industries in Sri Lanka 52
3.45 Summary of Emissions from the Industrial Sector Processes – 1994 52
3.46 Distribution of Livestock Population 53
3.47 Livestock Population – 1994 53
3.48 Methane Emissions from Enteric Fermentation and Manure Management 54
3.49 Methane Producing Capacity (Bo) of the Manure of Livestock Species 55
3.50 Nitrogen Excretion (Nex) by Different Livestock Species 55
3.51 Emission Factors of N2O from Different Animal Wastes ManagementSystems (AWMS) 56
3.52 Emissions from Livestock Sector – 1994 56
3.53 Harvested Extent of Field Crops – 1994 56
3.54 Dry Matter Fraction, Carbon Content and N/C Ratio of 16 Crop Residues 57
3.55 Nitrogen Excretion, Fraction of Manure Nitrogen per AWMS 57
3.56 Emissions Ratio of CH4, CO, N2O and NOx from the Residue Burning 57
3.57 Extent Rice Cultivated and Methane Emitted – 1994 58
3.58 Total Biomass Burnt, C, N and GHG Gases Released from FieldBurning of Crop Residues 58
3.59 Direct Emission of N2O from Agricultural Fields 58
3.60 Emission N2O from Histosols, Grazing Animals, Leaching 59
3.61 Total Emissions from the Agricultural Sector – 1994 59
3.62 Total Biomass Consumption from Stocks and Total Carbon UptakeIncrease in – 1994 60
VI
3.63 Carbon Release/Uptake and CO2 Emission and Removal – 1994 60
3.64 Annual Carbon and CO2 Released due to Burning and Decaying aboveGround Biomass – 1994 60
3.65 Total Carbon Emission from Agriculturally Impacted Soils (Mg/yr) – 1994 60
3.66 Total Annual CO2 Emission from Agriculturally Impacted Soils (Gg) – 1994 61
3.67 Total CO2 Emissions in 1995 from Forest and other Land Use Systems 61
3.68 Municipal Soil Waste Generation Rates, Land Fill and DegradableOrganic Carbon Fraction 61
3.69 Volume and COD for Anaerobic Waste Water Treatments 62
3.70 Total Annual MSW Disposal and Net CH4 Emission – 1994 62
3.71 Estimation of Methane Emission from Domestic Waste Water – 1994 62
3.72 Estimation of Methane Emission from Commercial Waste Water Treatment 62
3.73 Breakdown of Overall GHG Emissions in Sri Lanka – 1994 63
4.1 Land Loss of the SW Coast of Sri Lanka 66
4.2 Estimated Areas of Inundation around the Lowlands Adjacent toMarshlands, Lagoons and Estuaries of the SW Coast of Sri Lanka 67
4.3 Highest 24-Hour Rainfalls recorded over Sri Lanka 73

VII
ABBREVIATIONS
AP Agriculture PolicyAIT Asian Institute of TechnologyBD Buildings DepartmentBAP Biodiversity Action PlanCEB Ceylon Electricity BoardCoP Conference of PartiesCZMP Coastal Zone Management PlanCA2AP Clean Air 2000 Action PlanCHPB Centre for Housing, Planning & BuildingDSM Demand Side ManagementEPSL Energy Policy of Sri LankaFO Forest OrdinanceFRP Fibreglass Reinforced PlasticFMP Forestry Master PlanGHG Greenhouse GasGEF Global Environment FacilityGIS Geographical Information SystemsICTAD Institute for Construction, Training and DevelopmentIPCC Intergovernmental Panel on Climate ChangeLPG Liquid Petroleum GasMPCE Master Plan for Coastal Erosion ManagementMSL Mean Sea LevelNBRO National Building Research OrganizationNERD National Engineering & Research Development CentreNAPCC National Action Plan on Climate ChangeNEAP National Environmental Action PlanNFP National Forestry PolicyNFDP National Fisheries Development PlanNTP National Transport PolicyNPWC National Policy for Wildlife ConservationNLUP National Land Use PolicyOECD Organization for Economic Cooperation and DevelopmentPV Photo VoltaicRS Remote SensingSLT Sri Lanka TelecomSIDA Swedish International Development AgencyTOE Tonnes of Oil Equivalent

VIII
EXECUTIVE SUMMARY
The National Communication comprises, the National Circumstances; Greenhouse Gas Inventory;Impacts and Vulnerability; Mitigation Options and Adaptation Responses; Policies and Measures;Education, Training and Awareness Programmes; Constraints and Technological Needs andRecommended Research Studies and a Portfolio of Projects.
National CircumstancesSri Lanka with an areal extent of about 65,610 square kilometres lies between 6o and 10on latitude andbetween 80o and 82oe longitude. The island consists of a mountainous area in the south-central parts anda vast coastal plain, which surrounds it. Despite the relatively small size of the country, there isconsiderable variation in climate over time and space. The annual average rainfall varies from below1000mm (39”) over a small region in the arid parts of the north-west and south-east of the island to over5000mm (197”) in a few places on the south-western slopes of the central hills. There is little seasonalvariation of temperature. The mean annual temperature in the coastal areas below 150m in elevationranges from 26.0oc to 28.0oc while in the hill country above 1500m, it ranges from 15.0o c to 19.0o c.
Sri Lanka’s population which at the last census taken in 1981 was 14.8 million, is projected to reach 19.0million by the year 2001 and 23.1 million by the year 2031. The population is unevenly distributed acrossthe country. Nearly 60.0% is concentrated in the wet zone, which includes both the maritime provinceswith higher levels of economic development and the areas given over to the cultivation of plantationcrops. Over 75% of the country’s population live in rural areas.
Until the 1960’s, the Sri Lanka’s economy depended heavily on the export-oriented plantation crops oftea, rubber and coconut. By 1998 the major sector of the growing economy was the services sectorcontributing 53.0% to the Gross Domestic Product (GDP). This was followed by the agriculture,fisheries and the forestry sector with 21.3% and the manufacturing sector with 16.5%. The three majoreconomic activities in the country are agriculture and livestock, manufacturing and fishing. Together theycontribute 37.0% towards the Gross National Product and provide employment to 53.0% of the totalemployed. The agricultural sector comprises two sub-sectors, one producing mainly for the domesticmarket and the other mainly for the export market. Paddy is the main crop within the domestic sector.The export sector is dominated by tea, rubber and coconut. A variety of animals are raised in the countryincluding neat cattle, buffaloes, sheep, goats, pigs and poultry. The dairy and the poultry industriesrepresent the more prominent and organized sectors of the country’s livestock industry. Fish productionwhich includes both marine fish production (coastal, offshore and deep sea) and aqua culture fishproduction (inland, coastal brackish water prawns and cultured prawns), contributes on the average 3.0%to the Gross National Product. The manufacturing sector consists of three sub-sectors, i.e. factoryindustry, processing of plantation crops and small industries. Together they contributed 17.1% of theG.N.P. in 1998. Factory industry is the most important of the three sub-sectors accounting for 78.0% ofthe value added in the manufacturing sector in 1997. The tourism sector makes a significant contributionto the national economy, by earning valuable foreign exchange, functioning as a source of revenue to thegovernment and generating both direct and indirect employment. The income distribution in the countryremains uneven. The lowest 30.0% of the households receive less than 10.0% of the household incomewhile the highest 30% receive 65.0%.
Energy supply in Sri Lanka is mainly based on three primary sources, namely hydroelectricity, biomassand petroleum. In 1996, hydro-electricity accounted for approximately 780 thousand Tonnes of OilEquivalent (TOE) (11.4%), biomass for 3,930 thousand TOE (57.1%) and petroleum and crude oilproducts for 2,169 thousand TOE (31.5%) giving an aggregate primary energy supply of approximately6880 thousand TOE. The other energy sources include wind energy, micro hydro power and solar power.The contribution from these sources is negligible. The energy supply is expected to increase toapproximately 11.5 million TOE by year 2010 at an annual growth rate ranging from 4% to 8% indifferent sub-sectors.

IX
The climate of Sri Lanka is conducive to forest growth and the entire land area with a few exceptions wasonce covered with forests. Over the last century much of this forest cover, rich in diversity, has beendestroyed and today less than 1/3 of the area is under forest. Deforestation has seriously diminishedtimber supplies, made soils less productive and affected the natural water supply.
Sri Lanka has reasonable endowments of mineral resources in relation to its size. The most economicallyvaluable are the gemstones, which accounted for more than 90% of all mineral exports in 1994.
Surface water from the high watersheds is transported by 103 distinct natural river basins that cover 90%of the island; the remaining 94 small coastal basins contribute only marginally to water resources. Riverbasins originating in the wetter parts of the hill country are perennial while the majority of those in the dryzone are seasonal. Annual surface water estimates vary from 4.0 to 5.13 million hectare metres. A part ofthis is used for irrigation and hydropower projects, and the balance discharged to the sea.
The education system in Sri Lanka comprises three sub-systems, i.e. (i) General Education, (ii) HigherEducation, and (iii) Technical and Vocational Education. General education is provided by over 10,000government schools and by a number of officially approved private schools, private tutories and pirivenasor temple schools. At present, higher education is provided by 12 national universities, 6 post-graduateinstitutes and 5 other institutions. Technical education and vocational training which caters directly to thelabour market is handled by the Department of Technical Education and Training and other similarinstitutions.
Health care is provided by both the public and private sectors. The public sector provides preventive,curative and rehabilitation health care for nearly 60% of the population. The private sector providesmainly curative care, which accounts for nearly 50% of the out-patient care of the population and islargely concentrated in the urban and sub-urban areas. Ninety five percent of in-patient care is providedby the public sector.
The Democratic Socialist Republic of Sri Lanka is a unitary state whose legal and administrative structureis based on its republican constitution. The national constitution of 1978 forms the supreme law underthe Executive Presidency and a single House of Parliament. At present there are 33 Ministries eachheaded by a Minister and assisted by one or more Deputy Ministers. The country is divided foradministrative purposes into nine provinces. The provinces are divided into 25 districts, each headed by aGovernment Agent and districts are divided into 280 divisions each headed by a Divisional Secretary. The13th amendment to the Constitution in 1987 provided for the devolution of power to the provinces andprovinces are now the fundamental administrative units of regional governance. Local government is inthe hands of Municipal Councils, Urban Councils in urban areas and the Pradeshiya Sabhas at theDivisional level.
The subject of climate change has not been directly addressed in almost all the existing policies. However,there are a number of environmental policies, legal enactments and plans that contain provisions thatcould contribute in reducing or mitigating the effects of climate change. There are also many acts whichdeals with the subject areas dealing with climate change. These however have not been effectivelyimplemented due to enforcement weaknesses.
Greenhouse Gas InventoryGreenhouse gases are found naturally in the atmosphere in trace quantities. These contribute significantlyto global warming through their accelerated generation as a result of anthropogenic activities. The mainareas of greenhouse gas generation are energy industries, livestock, agriculture, forestry and waste. Thegases comprise Methane, Nitrous Oxides, Carbon Monoxides and Carbon Dioxide.
The largest contribution to GHG emissions in Sri Lanka is through the change in forest and woodybiomass stocks, forest grassland conversion, liming and organically amended soils.
X
Domestic livestock are diverse and some fall into the category of ruminants, which mainly depend onroughage diets. When such diets are ingested by ruminants, methane is produced. In addition,microbiological activity on the stockpiled animal waste, submerged rice soils and field burning of cropresidues also result in methane emissions. The largest source of methane is from treatment and handlingof waste while energy sector also contributes in a small scale through incomplete burning of fossil fuel.
Fuel combustion in energy industries, manufacturing industries and construction, transport and othersectors is also another large contributor to GHG emissions in the country.
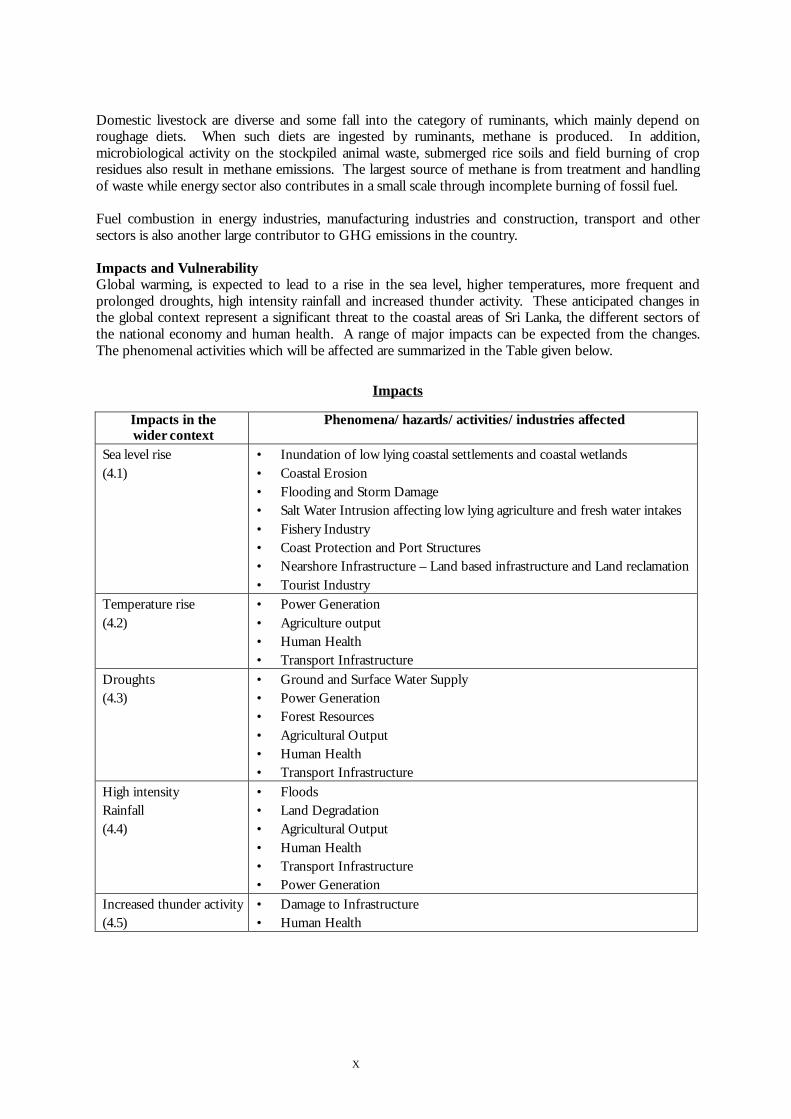
Impacts and VulnerabilityGlobal warming, is expected to lead to a rise in the sea level, higher temperatures, more frequent andprolonged droughts, high intensity rainfall and increased thunder activity. These anticipated changes inthe global context represent a significant threat to the coastal areas of Sri Lanka, the different sectors ofthe national economy and human health. A range of major impacts can be expected from the changes.The phenomenal activities which will be affected are summarized in the Table given below.
Impacts
Impacts in thewider context
Phenomena/hazards/activities/industries affected
Sea level rise(4.1)
• Inundation of low lying coastal settlements and coastal wetlands• Coastal Erosion• Flooding and Storm Damage• Salt Water Intrusion affecting low lying agriculture and fresh water intakes• Fishery Industry• Coast Protection and Port Structures• Nearshore Infrastructure – Land based infrastructure and Land reclamation• Tourist Industry
Temperature rise(4.2)
• Power Generation• Agriculture output• Human Health• Transport Infrastructure
Droughts(4.3)
• Ground and Surface Water Supply• Power Generation• Forest Resources• Agricultural Output• Human Health• Transport Infrastructure
High intensityRainfall(4.4)
• Floods• Land Degradation• Agricultural Output• Human Health• Transport Infrastructure• Power Generation
Increased thunder activity(4.5)
• Damage to Infrastructure• Human Health

XI
Mitigation Options and Adaptation ResponsesSri Lanka’s response strategy to anticipated climate changes includes the implementation of bothmitigation and adaptation measures. The country’s contribution to the emission of greenhouse gases isconsidered negligible. Even so, every effort has to be made to maximize the country’s potentialcontribution towards controlling the amount of gases being emitted to the atmosphere. Adaptationmeasures are required to address the potential impacts of climate change. A few measures have alreadybeen adapted in some sectors such as agriculture and energy to promote improved environmentalmanagement. The Mitigation Options and Adaptation Measures recommended for the different sectorsare summarized in the Table given below. Detailed descriptions are made available in sections 5.1 and 5.2in Chapter 5.
Relevant Sector Recommendation ofMitigation Options
Recommendation ofAdaptation Measures
Energy Sector ü (5.1.1)Industrial Sector ü (5.1.2)Transport Sector ü (5.1.3) ü (5.2.2)Agricultural Sector ü (5.1.4) ü (5.2.3)Forestry Sector ü (5.2.4)Water Resource Sector ü (5.2.5)Coastal Zone ü (5.2.1)Health Sector ü (5.2.6)Human Settlement andPublic Utilities Sector
ü (5.2.7)
Policies and MeasuresGeneral measures that would increase resilience to climate change include - the protection of arable soil,improvement of water management, enhancement of agro-technology, formulation of land use policies,maintenance of food reserves and provision of emergency disaster relief. Several major policies have beenformulated up to date. These are the Agricultural Policy, National Land Use Policy (Draft), TransportPolicy, Forestry Policy, and Energy Policy. There is a need for revising these policies taking into accountthe climate change impacts. When strengthening the policies and preparing new policies it is important tobear in mind - the need for (a) building up a database, (b) to provide incentives/disincentives, (c) toconsider the cost-effectiveness of policies, (d) need to adopt an integrated approach, (e) to promotestakeholder collaboration and (f) to increase the awareness of climate change.
Education Training and AwarenessSri Lanka has already launched a number of programmes to educate, train and promote awareness onclimate change and related issues. At school level, basic concepts of meteorology, climatology,environment, biodiversity and climate change have been included into the respective curricula. At theuniversity under-graduate level, climate change has been included as one of the subjects in the field ofclimatology whereas special subjects in post-graduate courses include environment, oceanography andclimatology.
A number of training workshops and seminars have been conducted by the Ministry of Forestry andEnvironment and the Department of Meteorology with the assistance and cooperation of the NationalInstitute of Education to train master teachers. Sri Lanka also hopes to undertake capacity buildingprogrammes to train scientists from the universities, research institutions and implementing agencies to (a)undertake relevant research and (b) to formulate and implement projects and research programmes on apriority basis. These programmes will be coordinated by the recently established Centre for ClimateChange Studies with the assistance and cooperation of the Ministry of Environment and other relevantinstitutions.

XII
Since the early 1990’s, Sri Lanka has also been conducting awareness programmes on climate change andrelated issues for the benefit of school children, teachers and others. These have been sponsored by theMinistry of Forestry and Environment and organized by the Department of Meteorology.
Recommended Research Studies and Portfolio of ProjectsA detailed list of research studies and a portfolio of project proposals is given in Chapter 7 of the report.Some of the important research studies and projects suggested are:
Research StudiesCoastal ZonePreparation of a coastal data base both referral and relational at a suitable resolution and linking the samewith an appropriate environmental monitoring system.
Undertake studies on the impact of rise in temperature and sea level on coral reefs and marine species.
Energy SectorConducting a study on the use of Natural Gas as an option for the future plants as well as the conversionof existing plants especially the large number of combustion turbines that will be in the system andundertaking in-depth Integrated Resource Planning study on Energy Conservation and other DemandSide Management (DSM) measures.
Industrial and Transport SectorsDeveloping and enforcing emission standards related to GHGs in the industrial sector and representativeemission factors for different fuel and vehicle types.
Agricultural SectorEstimating the change in production rates with carbon dioxide fertilization of different crops – rice, fieldcrops, vegetables, plantation crops and identifying agro-ecological zones particularly sensitive to climatechange impacts.
Forestry SectorExamining the potential for Carbon sequestration and evaluating socio-economic benefits form Carbonoffset projects.
Water Resources SectorStudying by hydraulic monitoring the extent of intrusion of salinity wedge along waterways for differentscenarios of sea level rise and the impact of climate variability and climate change on river flow regimes inSri Lanka.
Health SectorConducting studies on epidemiological forecasting and early warning systems using RS/GIS technologyapplicable in high risk areas for malaria, dengue, Japanese Encephalitis, diarrhoeal disease and nutritionaldisorders and undertaking prospective and retrospective studies on identified disease patterns such as eyeand skin disorders relevant to climatic change in sentinel stations.
Human SettlementsStudying the impact of climate change on existing sewerage and drainage systems and urban water supplyschemes, including reservoirs and developing, storm, wind and cyclone resistant building standards andguidelines for different building categories (NBRO, CHPB, ICTAD, BD, NERD, SLT, CEB).
OthersDeveloping rainfall and temperature scenarios for Sri Lanka.

XIII
ProjectsCoastal ZoneStudying the influence of increased salt water intrusion in a selected river estuary and undertaking avulnerability assessment in a selected region along the coast.
Investigating the impacts of sea level rise and temperature rise on coral reef systems around the coastalbelt.
Energy SectorHarnessing the total maximum identified potential of hydropower, based on a study of the economic andenvironmental impacts and introducing DSM measures such as luminairs, refrigerators, air-conditionersand motors, etc.
Industry SectorAdopting energy efficient building codes and standardization and labeling of energy consuming end useequipment and promoting proper solid waste management with methane recovery.
Transport SectorImproving traffic management systems and integrating bus-rail operation through proper networkplanning.
Agricultural SectorPromoting rainfed farming and the efficient utilization/conservation of water and developing integratedfarming systems in relation to climatic change.
Forestry SectorPreparing a database to achieve a greater understanding of the linkages between climate change and foresteco-systems and quantifying the role of forests, forest soils and reservoirs, sinks and sources of Carbon.
Water Resources SectorIntroducing permit/monitoring systems for groundwater extraction and water quality assessment invulnerable areas and assessing extent of land that will be affected by sea level rise.
Health SectorEstablishing work environment standards for local conditions.
Human SettlementsMapping flood plain and flood hazards, especially for Kelani Ganga, Kalu Ganga, Gin Ganga, NilwalaGanga, Attanagalu Oya, Mahaweli Oya, Heda Oya and Lunu Oya and identifying the prioritize vulnerableareas for human settlements.
Constraints and Technological NeedsThe major constraints faced by the project were: (1) the inability to recruit experts on a full time basis, (2)the limited availability of specific studies and relevant research and (3) the inadequate time available forundertaking specific studies and research on impacts of climate change. The major technological needsinclude, the assessment of vulnerability of the different sectors to climate change impacts, adaptation ofmeasures to reduce GHG emissions in the industrial, transport and agricultural sectors and introducingthe adaptation measures that have been identified.

1
C H A P T E R 1
INTRODUCTION
The United Nations Framework Convention on Climate Change (UNFCCC) was ratified by Sri Lanka on23 November 1993 and entered into force on 21 March 1994. Sri Lanka, being a developing country anda non-annex 1 country party to the UNFCCC, has to prepare a National Communication to theConference of Parties (CoP) within three years of the entry into force of the Convention or of theavailability of financial resources in accordance with article 4 paragraph 3 of the Convention. TheNational Communication has been prepared in response to this obligation.
The guidelines for the communications of non-annex I countries were adopted by the CoP in July 1996.In accordance with the Article 12 of the UNFCCC, detailed guidelines for the preparation ofcommunications were presented in the document FCCC/CP/1996/L.12, to parties not included inAnnex I. These guidelines have been followed in the preparation of the National Communication.
Global Environmental Facility (GEF) made available to Sri Lanka a grant of US $110,000 through UNDPto prepare its National Communication on Climate Change in 1997. The Enabling Activity Project onClimate Change commenced its activities in February 1998 under the Ministry of Forestry &Environment. A Steering Committee comprising of experts from different fields was appointed toprovide the necessary guidance and direction to the project.
Sri Lanka’s contribution to the emission of green house gases is considered negligible. Nonetheless theadverse impacts of the anticipated changes arising out of global warming are likely to be significant. Themost affected areas are agriculture, coastal regions and hydro-electricity supplies.
The National Communication incorporates the updated (1994) inventory of greenhouse gases in SriLanka and the potential measures to abate the increase and, the national action plan to address ClimateChange. As a prelude to the preparation of the National Action Plan on Climate Change (NAPCC), thenecessary background information was collected on the four major sectors, i.e. (i) Energy, Industry,Transport and Highways (ii) Agriculture, Forestry, Land Use and Water Resources (iii) Coastal Zone,Ports and Fisheries and (iv) Human Health, Human Settlements and Public Utilities. Ten core teamsprepared the initial sectoral drafts of the NAPCC and these were consolidated at a workshop held in1999. This formed the basis of the draft NAPCC which was presented at a series of participatoryworkshops.
The National Communication has been based on the guidelines provided by the Conference of Parties. Itpresents in several chapters, the National Circumstances; Greenhouse Gas Inventory; Impacts andVulnerability; Mitigation Options and Adaptation Responses; Policies and Measures; RecommendedEducation, Training and Awareness Programmes and Constraints and Technological Needs. ResearchStudies and a Portfolio of Projects have also been identified.

2
CHAPTER 2
NATIONAL CIRCUMSTANCES
2.1 GEOGRAPHYSri Lanka is a tropical island situated to the south of the southern tip of India. It lies between 6º
and 10º N latitude and between 80º and 82º E longitude and has an areal extent of about 65,610square kilometres. The maximum length of the island is about 435 km and the maximum widthis about 240 km. The coastline, which is about 1,585 km in length, is irregular, comprising sandybeaches, extensive lagoons and estuaries, mangroves, coastal marshes and dunes. Thecontinental shelf, 26,000 sq.km in extent, is on average 20 km wide and 20 to 65 metres deep. Itis narrowest at Kalpitiya, in the north-western province, where the width is only 2 km, while onthe north-east, it is continuous with peninsular India. The near-shore zone is characterized bythe occurrence of reefs, which are of three types, namely, coral, sandstone and crystalline rock(boulder).
Aligned with the UN Convention on the Law of the Sea which was ratified by Sri Lanka in July1994, the country enjoys a total extent of approximately 489,000 square kilometres of maritimewaters. The maritime zones consist of Internal waters, Historic waters, Territorial Sea,Contiguous Zone and an Exclusive Economic Zone (EEZ). A greater part of this area (437,000square kilometres) belongs to the EEZ.
The island consists of a mountainous area in the south-central parts and a vast coastal plain,which surrounds it. The central mountainous region, rising to an elevation of 2,524 metres is thesource of the major rivers of the country, numbering over a hundred, which flow across thelowlands into the Indian Ocean. Long parallel ridges cut by these rivers, their height increasinggradually from the coast, characterize the topography of the south-west. The northern andnorth-central parts of the island form one great plain and the maritime districts consist of similarlevel or undulating stretches (Fig. 2.1).
2.2 CLIMATEFor the most part, Sri Lanka is hot and humid. Despite the relatively small size of the country,there is considerable variation in climate over time and space.

3
Information regarding the National Circumstances is given in Table 2.1.
TABLE 2.1: NATIONAL CIRCUMSTANCESCriteria 1994
Population (million) 17.90Area (thousands of square kilometres) 65.6GDP (US$ billion) 11.7GDP per capita (US$) 656Estimated share of the informal sector in theeconomy in GDP (percentage) 10Sectoral shares in GDP % - Agriculture - Mining & quarrying - Manufacturing - Construction - Services
20.52.519.76.950.4
Land area used for agricultural purposes(thousands of square kilometres) - Paddy
- Coconut- Tea- Rubber- Others
16.07.34.41.91.60.8
Urban population as a percentage of totalpopulation
22.4in 1981
Livestock population (million)- Cattle- Buffaloes- Goats- Sheep- Swine
3.22
1.700.800.600.020.10
Forest area (thousands of square kilometres)- Montane Forest- Rain Forest- Monsoon Forests- Others
2.0
0.10.21.30.4
Population in absolute poverty (million) 4Life expectancy at birth (years) 72.5Literacy rate (percentage) 91.8

4
Figure 2.1SOURCE: NATIONAL ATLAS OF SRI LANKA

5
2.2.1 RainfallThe annual average rainfall varies from below 1000 mm (39”) over a small region in the semi-aridparts of the north-west and south-east of the island to over 5000 mm (197”) at a few places onthe south-western slopes of the central hills (Fig. 2.2).
There are four rainfall seasons during the year. These are:
1. The south-west monsoon period (May to September)2. The inter-monsoon period following the south-west monsoon (October to November)3. The north-east monsoon period (December to February)4. The inter-monsoon period following the north-east monsoon (March to April)
Rainfall is of three types – monsoonal, convectional and depressional. Rain during the south-west and north-east monsoon periods accounts for nearly 55% of the annual precipitation.Rainfall during the south-west monsoon is mostly over the south-western parts of the islandwhile during the north-east monsoon, it is mostly over the eastern half of the island. South-westmonsoon rainfall exceeds 3000 mm (118”) on the south-western slopes of the hill country andduring the north-east monsoon, the eastern half of the island receives about 200 mm (8”) to over1200 mm (47”) of rain. Convectional rain occurs during the inter-monsoon periods, mainly inthe afternoon or evening and is likely to be experienced anywhere over the island. Depressionalrain occurs during the inter-monsoon period (October to November) and sometimes during thesouth-west monsoon. Rainfall during the period October to November is widespread andexceeds 500 mm (20”) at many places. Taking the island as a whole, this is the rainiest period ofthe year.
2.2.2 TemperatureThere is little seasonal variation of temperature in Sri Lanka. The mean annual temperature inthe coastal areas below 150 m in elevation ranges from 26.0ºC to 28.0ºC while in the hill countryabove 1500 m, it ranges from 15.0ºC to 19.0ºC (Fig. 2.3).
A noteworthy feature in many parts of Sri Lanka is the small variation in the mean monthlytemperatures throughout the year. On average, the mean temperature of 25.0ºC during thecoolest months from November to February, is only 2.4ºC lower than that during the warmestmonths, April to May. Higher temperatures are generally experienced in the northern, north-central and eastern regions of the island and range on the average between 33.3ºC and 34.7ºC.
The diurnal variation of temperature is well marked, its magnitude depending on the season.There is a gradual increase in the range with altitude as well as with distance from the sea.
2.2.3 Relative humidityRelative humidity generally varies from about 70% during the day to about 90 to 95% at night.In the dry zone, however, these values are lower by about 5%. In the driest areas in the north-west and south-east, relative humidity drops to about 60%.
2.2.4 HailHail is experienced occasionally during intense thunderstorms. It occurs mainly in the hillcountry but there have been reports on the occurrence of hail in low country stations too.
2.2.5 Ground frostGround frost occurs in hilly areas over 2000 m on a few days of the year during the months ofJanuary and February.

6
Figure 2.2SOURCE: DEPT. OF METEOROLOGY

7
Figure 2.3SOURCE: DEPT. OF METEOROLOGY

8
2.2.6 Climate changeTemperature, rainfall and other meteorological data have been collected by the Department ofMeteorology over a period of more than 100 years. Statistical analyses of the temperature datahave shown an increasing trend in the annual mean air temperature over the entire island,particularly during the period 1961-1990. This increase was found to be approximately 0.16ºCper decade. Rainfall trends were found to be complex. During the period 1961-1990, adecreasing trend was evident over most of the island except in some isolated areas in the north-west, where an increasing trend was indicated. Thunder activity, which showed an increasingtrend, was found to be positively correlated with air temperature.
2.2.7 Agro ecological regionsSri Lanka has been traditionally divided into three zones, namely (a) the Wet Zone, (b) theIntermediate Zone and (c) the Dry Zone. The Wet Zone receives a mean annual rainfall of over2500 mm (98”) and comprises the south-west quadrant of the island whereas the Dry Zonereceives a mean annual rainfall of less than 1750 mm (69”) and comprises mainly the Northernand Eastern sectors of the island. The Intermediate Zone receives a mean annual rainfallbetween 1750 mm and 2500 mm.
For agro ecological purposes the country is divided into three sub-divisions based on elevation,i.e. Low country (below 300 metres), Mid country (between 300 and 900 metres) and Up country(above 900 metres). The Dry Zone falls wholly within the low country, whereas the Wet andIntermediate Zones fall within all three sub-divisions.
24 Agro ecological regions have been identified based on climate, soils, land forms andagricultural practices. Ten of these regions are in the Wet Zone while 9 are in the IntermediateZone and 5 are in the Dry Zone (Fig. 2.4).
2.3 POPULATION AND HUMAN SETTLEMENTSSri Lanka’s population at the last census taken in 1981 was 14.8 million. Island-wide censuseshave not been undertaken since then due to civil disturbances, but according to mid-yearestimates, the population had increased to 18.8 million by mid-1998. Population growth duringthe eighties was at an average annual rate of 1.5%, but this has declined slowly and now stands at1.2%. The population is projected to reach 19.0 million by the year 2001 and 23.1 million by theyear 2031.
The population is unevenly distributed across the country. Nearly 60.0% is concentrated in theWet Zone, which includes both the maritime provinces with higher levels of economicdevelopment and the areas given over to the cultivation of plantation crops.
Sri Lanka is one of the world’s most densely populated countries. The population density on thebasis of the current estimated population is nearly 300 persons per square kilometre. Regionalvariations however are quite marked, with the Wet zone having a density of nearly 650 personsper square kilometre compared to 175 persons per square kilometre in the Dry zone.
Over 75% of the country’s population live in rural areas in settlements ranging in size from smallhamlets with a population of less than 1250 persons to large villages with over 4000 persons.Rural settlements comprise traditional villages distributed throughout the country where themajority of the inhabitants depend on farming, fishing and animal husbandry; agriculturalsettlements in the Dry zone based on irrigation works; plantation settlements in areas of tea andrubber cultivation and unplanned settlements where landless persons have encroached on stateland. A number of rural settlements also function as small service centres providing goods andperforming services to the resident population as well as to the population in adjacent areas.

9
Figure 2.4SOURCE: NATIONAL ATLAS OF SRI LANKA

10
Less than 25% of the population live in urban areas. Not only is the urban population low but itis also very unevenly distributed. Over 75.0% of the urban population is to be found within theWet Zone and of this nearly half is concentrated within the city of Colombo and its immediatehinterland. There are approximately three hundred urban settlements in the country where theeconomically active resident population is engaged predominantly in secondary and tertiaryoccupations. These settlements range in size from small towns with a population of less than20,000 to large towns with a population of over 100,000 (Fig. 2.5).
The urban and rural settlements are linked by a network of roads with a total length ofaround 100,000 km providing 90% of the demand for transportation and railway lines witha total length of about 1500 km. While Sri Lanka Railways maintains the railway network,Road Development Authority is responsible for maintenance and development of nationalhighways of class A and class B totalling about 11,300 km of road length while ProvincialCouncils are responsible for 15,000 km of class C and class D roads. The remaining roadlength comprising local roads, estate roads and agricultural roads is under the localgovernments and other public and private institutions (Fig. 2.6).
2.4 THE SRI LANKAN ECONOMYUntil the 1960’s, the Sri Lankan economy depended heavily on the export-oriented plantationcrops of tea, rubber and coconut. The manufacturing sector was relatively weak and most of theindustries were government operated monopolies. The adoption of open economic policies inthe 1970’s and the liberalization programme started in the late 1980’s increased the marketorientation of the economy emphasizing export led growth and the development of the privatesector. Despite the severe civil strife, these economic reforms have resulted in an average annualgrowth rate of around 5.0% since 1990. Per capita income has reached US dollars 837 and SriLanka is now recognized as a “lower middle-income” country moving up from the “low income”group.
By 1998 the major sector of the growing economy was the services sector contributing 53.0% tothe Gross Domestic Product (GDP). This was followed by the agriculture, fisheries and theforestry sector with 21.3% and the manufacturing sector with 16.5%.
The volume and value of exports have increased rapidly in recent years and export earningsreached US dollars 4639 million in 1998. The composition of exports has also changed.Agricultural exports have declined in relative importance and in 1998 contributed only 22.0%towards export earnings compared to 79.9% in 1978. Industrial exports on the other hand led bytextiles and garments have increased in importance accounting for 75.0% of the total value ofexports in 1998 as against 14.0% in 1978.
There has been a declining trend in unemployment with the unemployment rate falling from16.0% of the labour force in the early 1990’s to 9.1% by the end of 1998. The key areas ofemployment generation have been manufacturing, construction and services. The average annualinflation rate has also continued to decline and stood at 8.6% in 1998 as against 11.7% in 1993.The domestic savings rate has increased steadily from 16.0% in 1993 to 18.9% in 1998, reflectingthe country’s growing ability to finance a higher level of investment out of its own resources.
Despite the positive developments the income distribution in the country remains uneven. Thelowest 30.0% of the households receive less than 10.0% of the household income while thehighest 30% receive 65.0%. Nearly 40.0% of the population was below the poverty line in 1996.It is estimated that 20.0% live in absolute poverty.

11
Figure 2.5SOURCE: NATIONAL ATLAS OF SRI LANKA

12
Figure 2.6SOURCE: NATIONAL ATLAS OF SRI LANKA

13
2.5 ECONOMIC ACTIVITIESThe three major economic activities in the country are agriculture and livestock, manufacturingand fishing. Together they contribute 37.0% towards the Gross National Product and provideemployment to 53.0% of the total employed.
2.5.1 AgricultureThe agricultural sector comprises two sub-sectors, one producing mainly for the domestic marketand the other mainly for the export market.
(i) Domestic Sector:Paddy is the main crop within the domestic sector. It is also the staple carbohydrate of theSri Lankans. Cultivation is widespread and approximately 850,000 hectares are set apart forpaddy. This is surpassed in extent only by the area under coconut. Over three-fourths of thepaddy land is located in the Dry Zone.
Paddy which is essentially a small-holder’s crop is grown under irrigation as well as underrain-fed conditions. Over two-thirds of the paddy lands are irrigated and much of this landis in the Dry zone. Rain-fed cultivation on the other hand is relatively more important in theWet zone. The total production in 1998 amounted to 2,692,000 tonnes.
The domestic sector also produces other field crops, vegetables, fruits and sugar. Other fieldcrops include grain legumes, coarse grains, oil seeds and condiments grown in rain-fedupland areas and under minor irrigation schemes mainly in the Intermediate zone and in theDry zone. The total area under cultivation in 1998 amounted to approximately 131,000hectares. These generate high incomes, but profit margins have gone down in recent yearsbecause of low market prices and high input costs and labour costs. Total production in1998 amounted to 185,000 tonnes. Vegetables include both low country vegetables and upcountry vegetables. Low country vegetables are grown on un-irrigable upland areas in theDry zone as well as in the paddy fields in the Wet and Dry zones. Up country vegetables arethe temperate species grown intensively on sloping lands in the hill country. A wide varietyof fruits are also grown in different parts of the country, but fruit production largely takesplace in a non-commercial manner. Except for bananas and pineapples and to a lesser extentstrawberries, there are no organized orchards. Much of the sugar cane is grown on a fewlarge scale plantations and on small peasant sub-grown holdings in the Dry zone. Althoughsugar cane cultivation and the processing industry provides direct and indirect employmentopportunities to a large number of persons in the production areas, Sri Lankan sugarproduction is sufficient to meet only about 10-12% of the domestic consumptionrequirements.
(ii) The Export Sector:The export sector is dominated by tea, rubber and coconut. In 1998, tea and rubberaccounted for 194,736 ha and 158,140 ha respectively. The three crops accounted for 21.0%of the value of exports in that year. Much of the coconut lands are confined to the lowlandareas in the Wet and Intermediate zones while most of the rubber and tea lands are on thewetter western slopes of the hill country. Production takes place partly on large estates andpartly on small-holdings. These crops, because of their high dry matter content and long lifespan may have a role to play in carbon sequestration.
The other crops within the export sector include spices such as cloves, cardamoms,cinnamon, pepper and nutmeg, beverage crops such as cocoa and coffee and essential oilssuch as citronella. All of these crops are confined to the Wet zone, where they are grown asmixed crops on home gardens with the exception of cinnamon which is cultivated in a lessorganized manner in larger holdings. The extents cultivated are small relative to tea, rubberand coconut and hence production remains low. In 1998 their contribution to the value ofexports amounted to only 2.6%.

14
2.5.2 Animal HusbandryA variety of animals are raised in the country including neat cattle, buffaloes, sheep, goats andpigs. Cattle and buffaloes are raised for draught, dairy purposes and for slaughter. Pigs andsheep are raised exclusively for slaughter while goats are raised both for slaughter and the supplyof milk. The poultry industry is dominated by the private sector and consists of a multitude ofsmall producers and a few large producers. The dairy and the poultry industries represent themore prominent and organized sectors of the country’s livestock industry.
2.5.3 FishingThe fisheries sector contributes on the average 3.0% to the Gross National Product. Fishproduction includes both marine fish production (coastal, offshore and deep sea) and aquaculture fish production (inland, coastal brackish water prawns and cultured prawns). Marine fishproduction accounted for 89.0% of the total fish production in 1998. Both marine fishproduction and aqua culture food production has increased in recent years, the former because ofthe facilities provided to encourage and strengthen the off-shore fisheries sector and the latterbecause of the supply of inputs, better management of aquatic resources and proper monitoring.
2.5.4 ManufacturingThe manufacturing sector consists of three sub-sectors, i.e. factory industry, processing ofplantation crops and small industries. Together they contributed 17.1% to the G.N.P. in 1998.Factory industry is the most important of the three sub-sectors accounting for 78.0% of the valueadded in the manufacturing sector in 1997.
Textiles, wearing apparel and leather products, food, beverages and tobacco and chemicals,petroleum, rubber and plastic production are the more important industries today contributing83.0% to the total industrial production in 1998.
Some of the industries are domestic market oriented while others are export oriented. Industrialexports led by textiles and garments is today the largest contributor to export earnings. Theyaccounted for 75.0% of the total exports in 1998. A few of the industries are public sectorenterprises. The majority however, belong to the private sector. Private sector industriesaccounted for 93.0% of the total industrial production in 1998.
Most of the industries are concentrated in the hinterland of Colombo, the commercial capital,because of the availability of relatively better infra-structure facilities and the proximity to theharbour and the airport.
2.5.5 TourismThe tourism sector makes a significant contribution to the national economy (Fig.2.7). In 1997,the foreign exchange earnings amounted to approximately 216.0 million U.S. Dollars and therevenue from different sources such as taxes, entrance fees to tourist sites, etc., to approximately9.0 million U.S. Dollars. The tourist sector also generates both direct and indirect employment.Direct employment which is provided by tourist sector enterprises such as hotels, restaurants,airlines, tourist shops and transport agencies amounted to approximately 35,000 persons in 1998.In the same year, indirect employment which is generated in sectors supplying goods and servicesto the tourist establishments was estimated at approximately 49,000 persons.

15
Figure 2.7SOURCE: SURVEY DEPARTMENT

16
2.6 ENERGY PRODUCTION AND CONSUMPTION
2.6.1 Primary Energy SourcesEnergy supply in Sri Lanka is mainly based on three primary sources, namely hydroelectricity,biomass and petroleum. In 1996, hydro-electricity accounted for approximately 780 thousandTonnes of Oil Equivalent (TOE) (11.4%), biomass for 3,930 thousand TOE (57.1%) andpetroleum and crude oil products for 2,169 thousand TOE (31.5%), giving an aggregate primaryenergy supply of approximately 6,880 thousand TOE (Fig. 2.8). Commercial use of renewableenergy sources such as wind power and solar electricity is negligible while the import and use ofcoal accounted for only 0.54 thousand TOE of the total energy supply in 1996.
Figure 2.8: Primary Energy Supply in Sri Lanka (1996)SOURCE: SRI LANKA ENERGY BALANCE-1996, ENERGY
CONSERVATION FUND, SRI LANKA.
The energy supply is expected to increase to approximately 11.5 million TOE by the year 2010 atan annual growth rate ranging from 4% to 8% in different sub-sectors. Hydro power andbiomass based energy supply will remain virtually fixed during this period as the developmentefforts pertaining to these primary energy sources are only very modest. Petroleum oil and coalconsumption on the other hand will gradually increase necessitating a greater emphasis onmitigation of environmental impacts.
2.6.2 Electricity
DEMANDThe demand for electricity has increased over the years (Fig. 2.9). The overall annual electricitydemand grew from 823 million units in 1972 to 3,588 million units in 1996 at an annualcompound growth rate of 6.8%. The growth however has been uneven. The growth rate whichamounted to 4.7% during the period 1972-1977 rose sharply to 10% per annum in the early1980s, dropped to 4.9% between 1982-1989 and increased again to 8.9% from 1989 to 1994.
Hydro11.4%
Biomass57.1%
Petroleum31.5%

17
Figure 2.9: Growth of Electricity Sales 1972-1996SOURCE: LONG TERM GENERATION EXPANSION PLANNING STUDIES 1996-2010,
CEYLON ELECTRICITY BOARD, 1996
The countrywide electrification level stands at approximately 50% of the households with arelatively large percentage of rural households not being connected to the national grid.
Figure 2.10: Electrification Level in Different DistrictsSOURCE: PRE-ELECTRIFICATION UNIT, CEYLON ELECTRICITY BOARD, 1998
010002000
300040005000
1972
1975
1978
1981
1984
1987
1990
1993
1996
Year
Dem
and
(GW
h)
Domestic Industrial Commercial Other
0.0
20.0
40.0
60.0
80.0
100.0
Col
ombo
Gam
paha
Jaff
na
Kal
utar
a
Mat
ara
Kan
dy
Gal
le
Keg
alle
Nuw
arae
liya
Kur
uneg
ala
Rat
napu
ra
Bad
ulla
Mat
ale
Puttl
am
Ham
bant
ota
Bat
ical
oa
Am
para
Trin
com
alee
Polo
nnar
uwa
Anu
radh
apur
a
Mon
arag
ala
Oth
er D
ist.
in N
orth
District
% E
lect
rific
atio
n

18
Figure 2.10 shows the districtwise distribution of electrification level in 1998. There are wideregional variations in the distribution of electrification. In the Colombo district where thenational electricity grid has penetrated to all of the areas, the electrification level stands around98%. Rural districts such as Ampara and Monaragala are poorly electrified with less than 20% ofthe households being connected to the grid.
The per capita electricity consumption in Sri Lanka which stood at 208 units a year in 1995, isrelatively low in comparison to other countries in the region. The average annual increase in percapita consumption during the last 15 years is also the lowest in the group.
GENERATIONElectricity generation is 15–20% higher than the electricity sales figures because the generatorsalso have to meet the inevitable power losses in the transmission and the distribution ofelectricity.
The use of hydroelectricity in a given year depends entirely on the extent of effective installedcapacity and the rainfall in hydro catchment areas. At present, hydroelectricity is the primarysource and any deficit is supplied by oil-fired thermal plants.
The total hydroelectricity generation from existing power stations in 1996 amounted toapproximately 3,250 million units per annum which is equivalent to 300 thousand TOE. Thereare other potential hydroelectric sites, but their development will be constrained by economicfactors. Hence, the amount that can be added to the annual supply will be limited toapproximately 3,500 million units.
Installed capacity and energy supply from hydroelectric stations in Sri Lanka have beenprogressively increased through the commissioning of hydropower stations. The total installedcapacity of hydropower stations in 1999 was 1,135 MW providing an average generationcapability of approximately 3,500 million units. Since the demand in 1999 was for 6,481 millionunits, the shortfall of approximately 3,000 million units had to be provided by thermal powerstations.
The forecasts of Annual Electrical Energy Generation required, for the period 1998 to 2017 aregiven in Figure 2.11. The expansion of hydroelectric system during this period will be limited to70MW and 305 million units. This implies that there will be a significant gap between thedemand and hydropower output, which needs to be bridged by thermal plants. Additionalthermal electricity sources as presently planned by the Ceylon Electricity Board (CEB) are alleither oil or coal based.

19
Figure 2.11: Growth of the Electricity Generation Sector 1998-2017SOURCE: LONG TERM GENERATION EXPANSION PLANNING STUDIES 1996-2010,
CEYLON ELECTRICITY BOARD, 1996
2.6.3 PetroleumPetroleum oil products amounting to approximately 2 million TOE, contributed to 31.5% (1996)of the primary energy supply in Sri Lanka at a cost of Rs.18.3 billion. The products are suppliedeither through the output of the local refinery with an annual refining capacity of 2 milliontonnes of crude oil or from direct importation of refined products.
Figure 2.12 shows that the major user of petroleum products is the transport sector. This isfollowed by the industrial and electricity sectors.
Figure 2.12: Composition of Petroleum Product Consumption (1996)SOURCE: SRI LANKA ENERGY BALANCE-1996, ENERGY
CONSERVATION FUND, SRI LANKA.
0
5000
10000
15000
20000
25000
30000
1998
2000
2002
2004
2006
2008
2010
2012
2014
2016
Year
Ener
gy (G
Wh)
Hydro Thermal
Electricity Sector15%
Household commecial & others
4%
Industry22%
Transport59%

20
During the period 1972 to 1977, the consumption of all petroleum products except liquidpetroleum gas (LPG) and auto-diesel declined due to low economic growth coupled with thenear trebling of prices (Fig. 2.13). Since 1977, demand for most petroleum products has beenincreasing, particularly that for auto-diesel and LPG. In dry years when hydro-power generatedcapability is at its minimum, the heavy demand on thermal electricity also increases the demandfor heavy diesel and fuel oil.
Figure 2.13: Historical Growth in Petroleum Product ConsumptionSOURCE: ANNUAL REPORT 1997, CENTRAL BANK OF SRI LANKA
In the year 2000, the local annual refining capacity at the only local oil refinery is expected tosaturate at 2.2 million tonnes of crude oil. Further, the present annual consumption of 2 millionTOE of petroleum is expected to grow at an average annual growth rate of 7% up to 4.9 millionTOE by the year 2010, mainly as a result of increased direct consumption in the transport andindustrial sectors. The expected growth in consumption is shown in Figure 2.14.
Figure 2.14: Expected Growth in Petroleum Product ConsumptionSOURCE: DRAFT ENERGY POLICY FOR SRI LANKA, MINISTRY OF
IRRIGATION, POWER AND ENERGY, 1997
0
100
200
300
400
1988
1989
1990
1991
1992
1993
1994
1995
1996
1997
Year
Con
sum
ptio
n-O
ther
s(to
nnes
'000
)
0
300
600
900
1200
1500
Aut
o D
iese
l Con
sum
ptio
n(to
nnes
'000
)
LPG Gasoline Kerosene Jet A-1Furnace Oil Super Diesel Heavy Diesel Auto Diesel
0
200
400
600
800
1995
2000
2005
2010
Year
Con
sum
ptio
n-O
ther
s( T
OE
'000
)
0
750
1500
2250
3000
3750
Aut
o D
iese
l Con
sum
ptio
n(T
OE
'000
)
LPG Petrol Kerosene Jet A-1 Furnace Oil Auto Diesel

21
2.6.4 BiomassBiomass generally implies fuel-wood, agro-waste through forest and non-forest sectors includingtwigs, branches and roots. Biomass, though generally classified as “non-commercial” has amarket value and is traded freely (Fig. 2.15).
As in the case of many other developing countries, biomass is the most widely used source ofprimary energy in Sri Lanka. The total biomass consumption stood at approximately 10 millionmetric tonnes in the year 1996, the demand being shared between domestic, commercial andindustrial sectors.
Figure 2.15: Fuelwood Supply in the Region from Different SourcesSOURCE: SOURCES OF WOOD ENERGY, FAO-RWEDP, 1999
Fuelwood and other biomass such as coconut residues, paddy husk and saw dust are largely usedfor domestic cooking. Small manufacturing industries such as bakeries and tile and brick makinguse mainly fuelwood as their source of energy supply. Bagasse resulting from sugar production isalmost completely utilized for electricity generation within the sugar factories themselves. Ricehusk is being increasingly used in rice mills and in tobacco barns as a major energy source ofenergy during processing.
The annual biomass availability is estimated to be between 10,900 to 16,500 kilo tonnescorresponding to 4,142 thousand TOE and 6,270 thousand TOE respectively. Although thebiomass supply is greater than the demand for the country as a whole, nonetheless there are someregional deficits.
The Forestry Master Plan has identified 1.6 million hectares of scrub land and chena land, whichurgently need some form of “cover” to prevent further degradation. This can be done byintroducing energy plantations on some of these lands. Fuel-wood plantations on 0.5 millionhectares of this marginal land can provide 10 million tonnes of fuel-wood annually which isequivalent to 3.8 million tonnes of oil. This quantity of fuel-wood could effectively supply morethan the entire energy being supplied from oil at present.

22
Presently there are 10 experimental plots of land being cultivated by the Ministry of Science &Technology, with the assistance of the Energy Conservation Fund and the Department ofForests, under an European Commission funded Energy Forest pilot project in Sri Lanka. Thisis mainly to determine the optimum parameters such as species types and planting distancesassociated and other aspects of energy plantations. Also another study has been recentlycompleted to ascertain the feasibility of fuelwood based electricity generation and the use ofshort rotation plant species.
2.6.5 Other Energy Sources
WIND ENERGYIn Sri Lanka, systematic studies involving the development of wind energy were commenced in1988 by the CEB. These studies revealed that the southern coastal belt from Hambantota toKirinda offer an exploitable wind turbine capacity of 200 MW with an annual yield of 350 millionunits. In addition, it is expected that a substantial wind energy potential is available on the north-western coastal belt from Puttalam to Jaffna and on the east coast from Jaffna to Trincomalee.Certain areas of the hill country such as Ambewela and Uva basin also experience strong winds.
In most locations in the southern coastal belt, only an annual average wind speed of around 6m/s to 6.5 m/s is experienced. There is also a mismatch between the wind speed variation andthe daily, as well as the annual demand for additional generation.
CEB has now embarked on a pilot wind farm of 3MW capacity consisting of five 600kWturbines in Hambantota. This was commissioned in early 1999 and connected to the nationalgrid. Some private sector institutions also have already expressed their interest in establishinggrid-connected wind turbine plants in the southern coastal belt.
MICRO-HYDRO POWERThe highlands in Sri Lanka experience rain for about 9 months in the year, leading to theformation of a number of small streams. These streams join to form rivers, which are utilized forlarge scale hydropower generation. Since these small streams flow through vast areas of teacultivation, they were used in the early part of the century for power generation to fulfill theelectricity requirements of the tea industry. Later, most of these micro-hydro plants wereabandoned with grid electricity penetrating into the tea estates. The records reveal that there hadbeen around 500 micro-hydro plants with capacities varying between 10 kW to 250 kW resultingin a combined capacity of around 20MW, during this period. The exploitable capacity at thesesites can be as high as 40MW. When other possible larger scale sites are also considered, the totalexploitable small hydro potential is estimated to be around 100 MW to 120 MW with an annualenergy output of around 350 million units.
The CEB has now allowed grid connection of small hydro plants and offers to buy all the energyinjected to the system by such plants at a pre-published power purchase tariff meant for smallpower producers. Since the initial capital investment required for micro-hydro plants has nowcome down making them more competitive with conventional electricity generating systems, aconsiderable interest among private investors has been generated in this area. Presently, studiesare being carried out on the development of many identified sites. Twelve plants have alreadybeen connected to the national grid during the last three years.

23
SOLAR POWERSolar insolation in Sri Lanka is high at an average annual rate of 1.86 TWh per square km. In SriLanka, traditionally solar power has been directly used in day to day activities associated withdrying processes. The biggest users of solar drying are the various agricultural products such asrice and chilli. In recent times, solar hot water systems have also been designed to capture directsolar radiation for water heating. This has become popular among more affluent households andtourist hotels in the country mainly due to increasing electricity costs. Research and developmentactivities concerned with the use of solar thermal systems in the industrial sector as a means ofcheaper and cleaner energy supply are also being undertaken.
In 1980, with the formation of the Energy Unit at the CEB, Sri Lanka started the promotion ofsolar photovoltaic (PV) systems for rural domestic use. Since then many private sectorcompanies have been involved in assembling and marketing solar PV systems in the country.
The main solar PV applications identified for Sri Lanka are in domestic lighting and the operationof radios and television sets in remote rural areas where there is no likely access to the nationalpower grid within the foreseeable future. At present there are also about 20 solar PV basedwater-pumping schemes in the Monaragala and Badulla districts, established with grant fundingfrom the Australian Government. There are also approximately 8,000 solar home systemsinstalled in Sri Lanka.
2.7 NATURAL RESOURCES
2.7.1 Land ResourcesSri Lanka has a total land area of 65.6 thousand square kilometres, nearly 80% of which comesunder some form of state control. About a third of this area is under forest cover and anotherthird is under agriculture. Human settlements, home gardens, urban and industrial areas,transportation and a variety of other uses including undeveloped land account for the balance(Fig. 2.16).
A rough land “balance sheet” prepared in 1995 indicated that 51% was under agriculture,homesteads, pasture, chena and other sparse uses; 31% under forests and catchment areas and9% under streams and their reservations, reservoirs and infrastructure facilities. The balance 9%comprised steep lands, barren lands, lands above 5,000 ft., marshes and mangroves.

24
Figure 2.16SOURCE: NATIONAL ATLAS OF SRI LANKA

25
2.7.2 ForestsThe climate of Sri Lanka is conducive to forest growth and the entire land area with a fewexceptions was once covered with forests. Over the last century much of this forest cover, richin diversity, has been destroyed. Deforestation has seriously diminished timber supplies, madesoils less productive and affected the natural water supply.
Sri Lanka still has a variety of forest types. The wet south-western region and the centralhighlands are covered with tropical rain forests, sub-montane forests and wet evergreen forestsparticularly at higher elevations. Tropical semi-evergreen forests are present in the transitionzone between the wet zone and the dry zone. The major part of the dry zone has tropical drymixed evergreen forests. In the dry zone large-scale felling and chena cultivation has degradedthe forest cover and today scrub or low jungle and dry pastures dominated by coarse grass typesare widely present in the area. Tidal mud flats and mangrove forests are located along the coastalbelt of the country, particularly influenced by the tidal lagoon environment.
Although Sri Lanka has a long history of wildlife protection and sustainable use of forests, severedeforestation and degradation have taken place. It is estimated that deforestation has occurred atthe rate of 42,000 hectares per year over 1956-1983 increasing to 54,000 hectares per year over1984-1994. Reforestation programmes have been implemented by the Forest Department tominimize the negative impacts of deforestation, protect environmentally sensitive areas andprovide fuelwood and timber.
2.7.3 MineralsSri Lanka has reasonable endowments of mineral resources in relation to its size (Fig. 2.17 –Mineral Map). The most economically valuable are the gemstones, which accounted for morethan 90% of all mineral exports in 1994. Other important minerals include clays, vein quartz,silica sands, feldspar, apatite rock phosphate, miocene limestone, dolomite, coral, monazite,ilmenite, zirconium, graphite and granite. A number of these minerals support importantindustries.
2.7.4 Water ResourcesSri Lanka is exposed to moisture-laden winds from the south-west and the north-east but despitethis favourable position, Sri Lanka has extensive areas of water deficit. A greater part of thecountry at times experiences dry spells extending over several months.
The principal geographical determinant of water resources of the island is the highland massif inthe south central region, located across the passage of monsoonal winds. The moisture ladenmonsoonal winds are intercepted by the hills in the central region leading to a unique rainfallpattern. Surface water from the high watersheds is transported by 103 distinct natural riverbasins that cover 90% of the island; the remaining 94 small coastal basins contribute onlymarginally to water resources. River basins originating in the wetter parts of the hill country areperennial while the majority of those in the dry zone are seasonal.
Water, which remains from rainfall after accounting for evapotranspiration and infiltration losses,is identified as available surface water. Annual surface water estimates vary from 4.0 to 5.13million hectare metres. Much of this is used for hydropower projects and irrigation and thebalance is discharged to the sea. Over 60% of the water that is discharged comes from the wetzone and often leads to floods and water logged lowlands. Development of river basins in thedry zone has considerably reduced dry zone run off.

26
Figure 2.17SOURCE: NATIONAL ATLAS OF SRI LANKA

27
Information on the available ground water in different aquifer formations is incomplete. Thelargest and the most investigated aquifers lie in north and north-western regions. It has beenreported that miocene limestones of the north-west extend over 200 km in the north-western andnorthern coastal areas with aquifers becoming increasingly thick as they approach the coast. Forexample in the Vanathavillu basin, in the north-western part of the country which spreads over40 square km, the confined aquifer creates artesian conditions. Estimates of ground waterresources available in this basin vary between 5-20 million cubic metres per year with the higherfigure reflecting the maximum potential. Estimates of well yields outside the north and north-west point to relatively modest ground water potential.
2.8 SOCIAL PROFILE
2.8.1 EducationThe education system in Sri Lanka comprises three sub-systems, i.e. (i) General Education, (ii)Higher Education, and (iii) Technical and Vocational Education.
(i) General Education:General education is provided by over 10,000 government schools of which nearly 3% areNational Schools administered by the Ministry of Education and Higher Education. Thebalance comes under the jurisdiction of the Provincial Councils.
General education is also provided by a number of officially approved private schools,private tutories and pirivenas or temple schools.
(ii) Higher Education:At present, higher education is provided by 12 national universities, 6 post-graduate institutesand 5 other institutions.
All of the universities are autonomous institutions and are overseen by the University GrantsCommission established in 1978. They offer degrees in the fields of Medicine, Engineering,Dentistry, Veterinary Science, Biological Sciences, Physical Sciences, Arts, Fine Arts andLaw. The Open University established in 1980 also offers various degree courses on thebasis of distance education.
(iii) Technical Education and Vocational Training:Technical education and vocational training which caters directly to the labour market ishandled by the Department of Technical Education and Training and other similarinstitutions. At present, there are 36 technical institutions with a staff of approximately 1,500providing training to nearly 15,000 students.
2.8.2 HealthThe responsibility for the protection and promotion of people’s health lies with the Ministry ofHealth and Indigenous Medicine in the Central Government. Health care is provided by boththe public and private sectors. The public sector provides preventive, curative and rehabilitationhealth care for nearly 60% of the population. The private sector provides mainly curative care,which accounts for nearly 50% of the out-patient care of the population and is largelyconcentrated in the urban and sub-urban areas. Ninety-five percent of inpatient care is providedby the public sector.

28
Western, ayurvedic, unani, siddha and homeopathy systems are practiced in Sri Lanka. Of these,Western medicine is the main sector catering to the needs of the majority of the population. Thepublic sector comprises western and ayurvedic systems while the private sector includespractitioners in all types of medicine.
The network of curative care institutions ranges from sophisticated Teaching Hospitals withspecialized consultative services to small Central Dispensaries that provide only outpatientservices. Primary health care institutions include Central Dispensaries, Maternity Homes, RuralHospitals, Peripheral Units and District Hospitals; secondary care institutions include BaseHospitals and Provincial Hospitals, and tertiary care institutions include Teaching and SpecialHospitals.
2.9 POLITICAL PROFILE
2.9.1 Central GovernmentThe Democratic Socialist Republic of Sri Lanka is a unitary state whose legal and administrativestructure is based on its republican constitution. The national constitution of 1978 forms thesupreme law under the Executive Presidency and a single House of Parliament.
The President of the Republic is elected by the people and holds office for a term of 6 years.Parliament consists of 196 members elected by the electors of the several electoral districts inaccordance with the provisions of the constitution. Parliament continues for 6 years from thedate of appointment.
The President appoints the Prime Minster and the Cabinet of Ministers and is the Head of theCabinet. At present there are 33 Ministries each headed by a Minister and assisted by one ormore Deputy Ministers.
The hierarchy of administration of the Government consists of Ministerial Secretaries, AdditionalSecretaries, Assistant Secretaries, Heads of Departments and Heads of Corporations at theCentral Government level.
2.9.2 Provincial GovernmentThe country is divided for administrative purposes into nine provinces. The provinces aredivided into 25 districts, each headed by a Government Agent and districts are divided into 280divisions each headed by a Divisional Secretary (Fig. 2.18 – Administrative Divisions).
The 13 th amendment to the Constitution in 1987 provided for the devolution of power to theprovinces and provinces are now the fundamental administrative units of regional governance.The unit of devolution is the Provincial Council comprising a number of members elected by thevoters in each province. The province is headed by a Governor appointed by the President andthe Provincial Council by a Chief Minister appointed from amongst the elected members. TheChief Minister is assisted by a Cabinet of Ministers.

29
Figure 2.18SOURCE: NATIONAL ATLAS OF SRI LANKA

30
Under the 13th amendment, some subjects are completely devolved, e.g. Police and Public order,Planning, Education, Local Government, Provincial Housing, Social Services, Agrarian Services,minor Irrigation Services, protection of environment, etc., some are shared by the Provincialgovernment and the Central government, e.g. Plan Implementation and Progress Control, HigherEducation, Social Services, Health, Irrigation, Tourism, Drugs and Poisons, and some arehandled by the Central government, e.g. Defence and National Security, Foreign Affairs, Postsand Telecommunications, Ports and Harbours, National Transport, Immigration and Emigration,etc.
2.9.3 Local GovernmentLocal government is in the hands of Municipal Councils, Urban Councils in urban areas and thePradeshiya Sabhas at the Divisional level. Each local authority is a corporate body havingperpetual succession with a council elected for a period of 3 years and operate under powersvested in them under existing laws. At present, there are 12 Municipal Councils, 51 UrbanCouncils and 257 Pradeshiya Sabhas.
2.10 INSTITUTIONAL STRUCTUREThe present Ministry of Forestry & Environment (MFE) set up in 1997 has the mandate toprovide leadership for formulating national environmental policy and its review.
The Ministry functions under a Cabinet Minister supported by a Deputy Minister. It is headed bya Secretary who is assisted by 2 Additional Secretaries, one of whom is in charge ofEnvironmental Management and the other in charge of Forestry and Administration.
The Central Environmental Authority (CEA) was established in 1981 as the Agency responsiblefor the formulation and implementation of policies and strategies for the protection andmanagement of the environment in Sri Lanka. It now functions as the implementing agency ofthe Ministry of Forestry and Environment and has the responsibility to protect the environmentfrom air pollution, water pollution and industrial pollution. In addition to the MFE and itsagencies, there are several other ministries and their agencies also concerned with the protectionof the environment, e.g. the National Building Research Organization in the Ministry of UrbanDevelopment, Housing and Construction and the National Disaster Management Centre in theMinistry of Social Services.
Sri Lanka has an active NGO community and conservation related NGOs have existed andoperated in Sri Lanka for many years. NGOs represent an active medium to addressenvironmental problems and they perform a crucial role in ensuring effective public participationin decisions and actions that pertain to the conservation of the environment and naturalresources.
2.11 POLICIES RELATING TO CLIMATE CHANGEThe subject of climate change has not been directly addressed in almost all the existing policies.However, there are a number of environmental policies, legal enactments and plans that containprovisions that could contribute in reducing or mitigating the effects of climate change.
2.11.1 PoliciesThe National Forestry Policy of 1995 (NFP), the National Policy for Wildlife Conservation(NPWC), the Agriculture Policy of 1996 (AP), the Energy Policy of Sri Lanka of 1997 (EPSL),The National Transport Policy (NTP) and the National Policy on Air Quality Management arethe existing policies that have a direct bearing on climate change and associated impacts.

31
With the rapidly dwindling forest cover and associated issues arising as a result of excessivedependency on forest resources and its eco-systems, the objectives and strategies included in theNFP, are very important in minimizing climate change impacts. It places high emphasis onincreasing the tree cover in the country through private sector and community participation, andthe protection of bio-diversity, soils and water through the effective management of a ProtectedArea Network and a clearly defined National Forestry Estate.
With the reduction of the forest cover and the resultant losses of habitat due mainly topopulation increase, the NPWC places much importance on the conservation of bio-diversity,with special emphasis on fauna. The conservation of threatened species both in-situ and ex-situ,which may diminish as a result of climate change has been adequately addressed. The need forclearly defined management plans for the conservation of protected areas and the sharing ofbenefits with communities living around the protected areas is emphasized.
Sri Lanka is an agricultural country with nearly 40% of its land area under agriculture. Because ofthe need to have food buffer stocks in view of the possible climatic change impacts on foodproduction, the AP has made provision for conducting research on increasing farmer yieldsthrough bio-technology or genetic engineering; the supply of high quality seeds to farmers, andthe provision of credit, fiscal incentives, marketing facilities, etc., to encourage sustainableagriculture and to increase food production in the country.
The EPSL emphasizes the importance of bio-mass in meeting the demand for energy and theneed to reduce the dependency on imported energy. Promotion of energy efficiency measuresthrough introduction of new technology and correct pricing and the use of renewable energy ona large scale have also been highlighted. On the whole, the implementation of the policy wouldresult in a reduction in total emissions.
The NTP highlights the need for energy conservation through reduced use of fossil fuels, and theexpansion of mass transportation systems such as the railway services, preferably throughelectrification. A reduction in vehicle emissions through control via monitoring and surveillancemechanisms would in the long run assist in minimizing climatic change impacts.
National Policy on Air Quality Management requires to maintain good air quality in theenvironment and focuses on vehicle maintenance, fuel reformulation, pricing, emission inventoryand standard setting.
2.11.2 LegislationThere are many acts which deals with the subject areas dealing with climate change. Thesehowever have not been effectively implemented due to enforcement weaknesses.
SOIL CONSERVATIONThe Soil Conservation Act No.25 of 1951 amended in 1953, 1981 and 1996 is concerned with thecontrol and mitigation of soil erosion, protection of soils from floods, and designating, regulatingand protecting erosion prone areas. The Act empowers the Director of Agriculture to acquireenvironmentally sensitive areas which are prone to severe soil erosion, specify measures forcontrol, and to prohibit certain land use practices that contribute to soil erosion. The latestamendment to the Act provides for a Soil Conservation Board consisting of all relevant agenciesfor co-ordinating soil conservation, watershed protection, prevention of land degradation, etc.
FLORA AND FAUNA PROTECTIONThe Forest Ordinance No.16 of 1907 (FO), amended in 1966, 1979, 1982, 1988 provides for theprotection of forests from illegal operations and prescribes penalties for those who violate them.The subsequent amendments provide for village forestry, community forestry operations andbuffer zone activities in protected forests.

32
The Fauna and Flora Protection Ordinance No.2 of 1937 and amendments introduced in 1964and 1970, make provision for the protection of wildlife and flora in national reserves, andprovides for the establishment and management of National Reserves and Sanctuaries.
COASTAL RESOURCESThe Fisheries Act No.24 of 1940 provides for protection of fish in Sri Lankan waters, and theregulation of fishing.
The Coast Conservation Act No.57 of 1981 and amended in 1988, established the CoastConservation Department. The Department was made responsible for carrying out coastconservation programmes, developing a coastal zone management plan, and carrying outregulatory permit programme for the coastal zone between 300 m landward and two km seaward,and the waters of rivers, estuaries and lagoons within two km of their sea entrance.
The National Environmental Act No.47 of 1980 and amended in 1988 established the CentralEnvironmental Authority. The Authority has assisted in developing policies, setting standards,and carrying out educational programmes in relation to environment and natural resources. TheAct has paved the way for initiating many pollution prevention measures, such as EnvironmentalImpact Assessment.
WATER RESOURCESThe Water Resources Board Act No.29 of 1994 provides for integrated planning andconservation of water resources, the co-ordination of river basin surveys and studies and othermeasures to control economic uses of water.
2.11.3 PlansThe various sector plans related to the broader context of climate change acts as strategies forimplementing the related policies. In the absence of a policy, these plans provide the necessarypolicy direction to the sector. The Coastal Zone Management Plan of 1997 (CZMP), NationalEnvironmental Action Plan (NEAP), National Fisheries Development Plan (NFDP) (1999-2004), National Biodiversity Action Plan of 1998 (BAP), the Forestry Sector Master Plan of 1995(FSMP), the Master Plan for Coastal Erosion Management (MPCE) (1986) and the Clean Air2000 Action Plan (1992) (CA2AP).
The CZMP, which spells out the strategy for coastal management, is the only document whichdirectly recommends action towards minimizing climate change impacts.
The NEAP is a long term strategic plan which deals with all aspects of environmentalconservation.
The NFDP is concerned with exploitation of aquatic resources within sustainable limits and theprevention of unauthorized exploitation of resources in Sri Lanka’s exclusive economic zone.
The BAP emphasizes the need for protecting threatened forest ecosystems and species. A regularmonitoring system on forest biodiversity and necessary timely remedial action to rectify negativetrends is expected to conserve biodiversity.
The NFP is translated into action in the FSMP where eleven broad based developmentprogrammes have been suggested for implementation during a 25 year period. It has givenprominence to conservation of natural forests and forest plantations in sensitive areas.
The MPCE was developed as a long term strategy for erosion control. The plan identifiedseveral areas that are prone to severe erosion along the coast and have recommended and givenpriority to structural solutions.

33
C H A P T E R 3
GREENHOUSE GAS INVENTORY
Greenhouse gases are found naturally in the atmosphere in small quantities. These contributesignificantly to global warming through their accelerated generation as a result of anthropogenic activities.The main areas of greenhouse gas generation are energy industries, livestock, agriculture, forestry andwaste. The gases comprise Carbon Dioxide, Methane, Nitrous Oxide, Nitrogen Oxides, CarbonMonoxides.
The largest contribution to GHG emissions is through the change in forest and woody biomass stocks,forest grassland conversion, liming and organically amended soils.
Domestic livestock are diverse and some fall into the category of ruminants, which mainly depend onroughage diets. When such diets are ingested by ruminants methane is produced. In addition,microbiological activity on the stockpiled animal waste, submerged rice soils and field burning of cropresidues also result in methane emissions. The largest source of methane is from treatment and handlingof waste while energy sector also contributes in a small scale through incomplete burning of fossil fuel.
Fuel combustion, which is one of the largest contributors to GHG emissions in Sri Lanka, can be broadlycategorized into four groups for emission assessment, i.e. energy industries; manufacturing industries andconstruction, transport and other sectors having emissions from energy consumption. Emissions fromthe fuel combustion activities are estimated according to the revised procedures published in 1996 by theIntergovernmental Panel on Climate Change. Conversion factors and Carbon emission factors used in allthe calculations are given in Table 3.0.
TABLE 3.0: CONVERSION FACTORS AND CARBON EMISSION FACTORS FORDIFFERENT TYPES OF FUELS IN SRI LANKA
FUEL CARBON EMISSIONFACTOR (tC/TJ)
NET CALORIFIC VALUE(TJ/kt)
FOSSIL FULESCrude Oil 20.0 42.16Gasoline 18.9 44.80Jet Kerosene 19.5 44.59Kerosene 19.6 44.75Gas/Diesel Oil 20.2 43.33Residual Fuel Oil 21.1 40.19LPG 17.2 47.31Naphtha 20.0 45.01Bitumen 22.0 40.19Lubricant 20.0 40.19Other Oil 20.0 40.19Other Bituminous Coal 25.8 25.75SOLID BIOMASS 29.9Wood (Air dried) 29.9 15.5Charcoal 29.9 29.0Bagasse (Air dried) 29.9 16.2Agricultural Waters 29.9 15
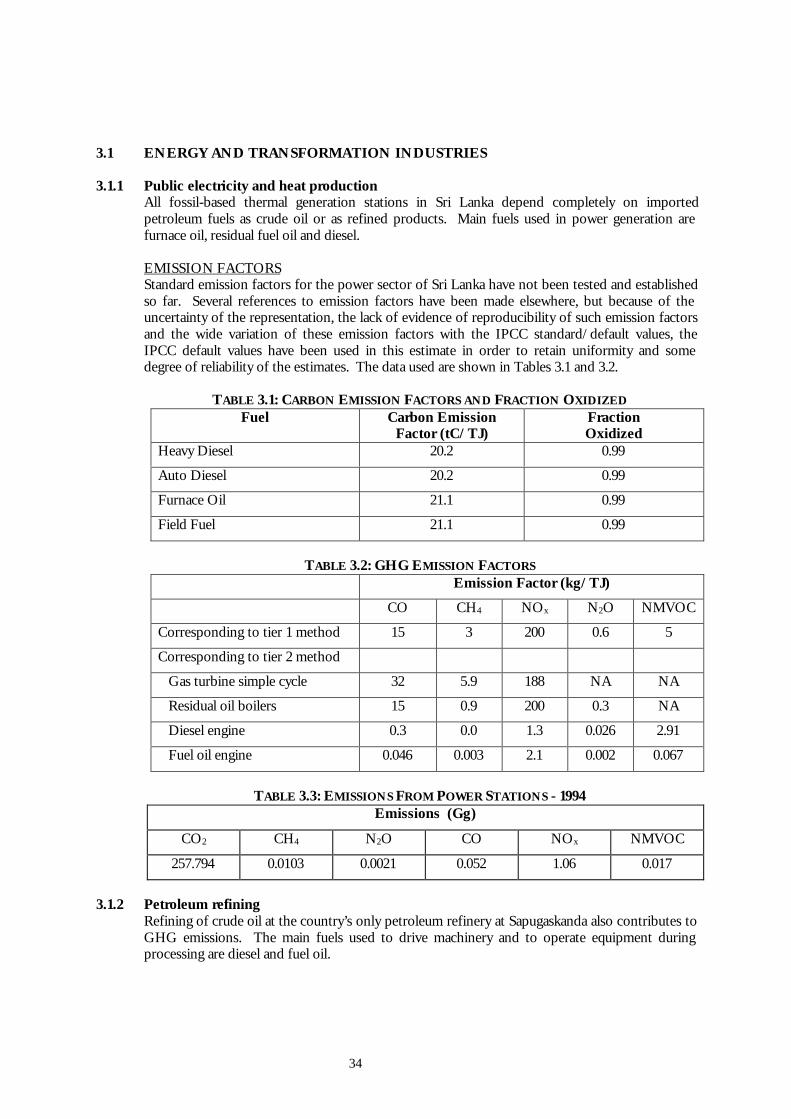
34
3.1 ENERGY AND TRANSFORMATION INDUSTRIES
3.1.1 Public electricity and heat productionAll fossil-based thermal generation stations in Sri Lanka depend completely on importedpetroleum fuels as crude oil or as refined products. Main fuels used in power generation arefurnace oil, residual fuel oil and diesel.
EMISSION FACTORSStandard emission factors for the power sector of Sri Lanka have not been tested and establishedso far. Several references to emission factors have been made elsewhere, but because of theuncertainty of the representation, the lack of evidence of reproducibility of such emission factorsand the wide variation of these emission factors with the IPCC standard/default values, theIPCC default values have been used in this estimate in order to retain uniformity and somedegree of reliability of the estimates. The data used are shown in Tables 3.1 and 3.2.
TABLE 3.1: CARBON EMISSION FACTORS AND FRACTION OXIDIZEDFuel Carbon Emission
Factor (tC/TJ)FractionOxidized
Heavy Diesel 20.2 0.99
Auto Diesel 20.2 0.99
Furnace Oil 21.1 0.99
Field Fuel 21.1 0.99
TABLE 3.2: GHG EMISSION FACTORSEmission Factor (kg/TJ)
CO CH4 NOx N2O NMVOC
Corresponding to tier 1 method 15 3 200 0.6 5
Corresponding to tier 2 method
Gas turbine simple cycle 32 5.9 188 NA NA
Residual oil boilers 15 0.9 200 0.3 NA
Diesel engine 0.3 0.0 1.3 0.026 2.91
Fuel oil engine 0.046 0.003 2.1 0.002 0.067
TABLE 3.3: EMISSIONS FROM POWER STATIONS - 1994Emissions (Gg)
CO2 CH4 N2O CO NOx NMVOC
257.794 0.0103 0.0021 0.052 1.06 0.017
3.1.2 Petroleum refiningRefining of crude oil at the country’s only petroleum refinery at Sapugaskanda also contributes toGHG emissions. The main fuels used to drive machinery and to operate equipment duringprocessing are diesel and fuel oil.

35
EMISSIONS DATAThe energy consumption data of the Ceylon Petroleum Corporation is presented in Table 3.4.
TABLE 3.4: CONSUMPTION OF FOSSIL FUEL BY REFINERY FOR OWN USEFuel Type Use Consumption (kt) – 1994
Auto Diesel Vehicles 2.771
Fuel Oil Refinery Use 34.929
Fuel Gas Refinery Use 40.348
Petrol Refinery Vehicles 0.043
Kerosene Refinery Use 0.104
LPG Refinery Use 0.014
EMISSION FACTORSThe relevant carbon emission factors and factor of Carbon Oxidized and the emission factors aregiven in Table 3.5.
TABLE 3.5: FUEL AND EMISSIONS DATAFuel Conversion
Factor(TJ/kt)
CarbonEmission
Factor(tC/TJ)
FractionOxidized
Emission Factor (kg/TJ)
NOx CH4 N2O CO NMVOC
Diesel(Vehicle)
43.33 20.2 0.99 800 5 0.6 1000 200
Diesel(Other)
200 3 0.6 15 5
FurnaceOil
40.19 21.1 0.99 200 3 0.6 15 5
FuelOil
40.19 21.1 0.99 200 3 0.6 15 5
Gasoline(Vehicle)
44.80 18.9 0.99 600 20 0.6 8000 1500
Kerosene 44.75 19.6 0.99 200 3 0.6 15 5
Fuel Gas 48.15 15.2 0.995 200 3 0.6 15 5
LPG 47.31 17.2 0.995 200 3 0.6 15 5
TABLE 3.6: EMISSIONS FROM FUEL COMBUSTION WITHIN REFINERY - 1994Emissions (Gg)
CO2 CH4 N2O CO NOx NMVOC
224.564 0.0107 0.002 0.186 1.839 0.044

36
3.1.3 Use of bagasseBagasse is widely used in sugar industries as a primary source of energy to generate electricitywhenever it is available in large quantities. The total use of bagasse (Air Dried) in 1994 was287.99kt.
Emission factors applicable to combustion of bagasse in the energy sector is shown in Table 3.7.
TABLE 3.7: EMISSIONS FACTORS FOR BAGASSECO CH4 NOx N2O NMVOC
1000 30 100 14 50
TABLE 3.8: EMISSIONS FROM USE OF BAGASSE – 1994Emission (Gg)
CO2 CO CH4 NOx N2O NMVOC
450.11 4.61 0.139 0.466 0.018 0.233
3.1.4 Manufacturing solid fuels and other energy industriesBiomass such as wood is mainly used for charcoal production in Sri Lanka. Carbonization ofthese materials is generally carried out in open pits, kilns or metal retorts. The gas and particulateemissions in the process are allowed to escape into the atmosphere or burnt. In Sri Lanka, woodcharcoal is produced by the official sector and by the State Timber Corporation. Charcoal ispreferred to wood as it is easier to use than wood. Moreover, in urban centers, it is often lessexpensive than wood. Over 50% of the charcoal production is exported and another 25% usedto produce activated carbon. The latter amount is not usually shown in the Sri Lanka Energybalance. As a result, data on production and consumption of charcoal had to be obtained fromthe data bank of the Ministry of Industrial Development. Even though the manufacture ofactivated carbon is an industry, the process itself is an energy process. Initially, coconut shells areconverted to charcoal and thereafter, the heat and gases generated used to produce activatedcarbon. The quantity of charcoal produced in Sri Lanka during 1994 is shown in Table 3.9.
TABLE 3.9: PRODUCTION OF CHARCOAL IN SRI LANKA - 1994Charcoal Consumed
In (kt)Charcoal Produced (kt)
Activated CarbonManufacture
Other Activated CarbonManufacture
TotalProduced
4.42 13.52 15.48 29.00
EMISSION FACTORSValues for fraction oxidized, and the emission factors for non CO2 gases for the manufacture ofcharcoal are presented in Table 3.10. Table 3.11 shows the emissions from this process.

37
TABLE 3.10: EMISSIONS DATA FOR THE CONSUMPTIONAND MANUFACTURE OF CHARCOAL
Conversion Factor (TJ/kt) 27.6
Carbon Emission Factor (tC/TJ) 29.9
Fraction of Carbon Oxidized 0.87
Consumption Production
CH4 kg/TJ of Charcoal consumed/produced 200 1000
NOx kg/TJ of Charcoal consumed/produced 100 10
N2O kg/TJ of Charcoal consumed/produced 4 4
CO kg/TJ of Charcoal consumed/produced 4000 7000
NMVOC kg/TJ of Charcoal consumed/produced 100 1700
TABLE 3.11: EMISSIONS IN CHARCOAL PRODUCTION – 1994Emission (Gg)
CO2 CO CH4 NOx N2O NMVOC80.22 5.89 0.841 0.008 0.003 1.429
3.2 MANUFACTURING INDUSTRIES AND CONSTRUCTIONFuel combustion in the manufacturing and construction industries also contribute to GHGemissions.
3.2.1 Iron and steelManufacture of basic iron and steel as well as casting of iron and steel.
3.2.2 Non-ferrous metalManufacture of basic precious and non-ferrous metals are taken into consideration.
3.2.3 Pulp, paper & printManufacture of pulp, paper and paper board and publishing, printing and reproduction ofrecorded media.
3.2.4 ChemicalManufacture of basic chemicals, fertilizers and nitrogen compounds, plastics of primary form,pesticides and other agro-chemicals, paints, varnishes, pharmaceuticals, detergents, perfumes,toilet preparations and other chemical products.
3.2.5 Food processing, beverages and tobaccoProduction, processing and preservation of meat, fish, fruit, vegetables, oils, fats, dairy products,grain mill products, starches and prepared animal feeds, beverages and tobacco products.
3.2.6 Other industriesIndustries not specified above are also included in this category.
The activity data for the sector concerned consists of fuel consumption by each industrial sectordiscussed above.

38
Data for each sector are available with the Department of Census and Statistics. However, dueto the varied nature of the Food Processing, Beverage and Tobacco sector, the data were noteasily available for compilation. Taking into account the total fuel consumption by the Industrialsector in Sri Lanka, it was possible to evaluate the energy consumption for the food, beverage,tobacco and all other industries as a unit sector. The fuel consumption data for 1994 for eachcategory are shown in Table 3.12.
TABLE 3.12: FUEL COMBUSTION DATA FOR INDUSTRIAL SECTORSCONSUMPTION (kt)
Fire Wood Charcoal Fuel Oil Kerosene Oil LPGIron & Steel 0.004 1.541 29.27 0.002 3.737Non Ferrous 0 0 0.223 0 0Chemicals 0 0.005 46.919 0.189 0.357Pulp & Paper 0.00345 0 31.195 0.162 0Food & Other 150 0 113.5 0 35.3Total 150 1.5461 221.0 0.353 39.42
EMISSION FACTORSEmission factors for the respective fuels shown in Table 3.13 are based on the default valuesfrom IPCC and other sources.
TABLE 3.13: EMISSION FACTORS APPLICABLE TO THE INDUSTRIAL SECTOREMISSION FCTOR (kg/TJ)
Fuel CO CH4 NOx N2O NMVOCLPG Furnace 10 1.1 47 NAV NAVKerosene Furnace 13 5 51 15.7 NAVFuel Oil Boiler/Furnace 15 3 170 0.3 NAVFuel Wood Boiler 590 15 65 NAV NAVCharcoal Kiln 211 1 35 NAV 16
The IPCC worksheets 1-3 overview estimates the emissions by considering all liquid fuels into asingle cell, and thereafter incorporating an average emission factor to cover all the liquid fuels inthis sector. As a result of the mix of liquid fuels and the different proportions of the mix foreach year, the average emission factor for the liquid mix varies with the year under consideration.
The estimated average emission factors are presented in Table 3.14.
TABLE 3.14: AVERAGE EMISSION FACTORS FOR LIQUID FUELMIX FOR THE INDUSTRIAL SECTOR - 1994
CO CH4 NOx N2O NMVOC14.13 2.67 148.52 2.72 0

39
TABLE 3.15: ESTIMATE OF EMISSIONS FROM FUEL COMBUSTIONIN THE INDUSTRIAL SECTOR - 1994
Emissions (Gg)CO2
BiomassCO2
FossilCO CH4 NOx N2O NMVOC
288.83 801.08 1.92 0.07 1.79 0.03 0.00
3.3 TRANSPORTThe transport sector of Sri Lanka, which is mainly dependent on Gasoline and Diesel, comprisesboth domestic transport and international transport. Each of these sectors could be furthersubdivided into passenger transport and freight transport. The domestic passenger transportconsists of individual transport such as cars, vans, light duty vehicles and motor cycles, whilepublic transport comprises mainly buses and railways. Domestic freight movement dependsmainly on road and rail; the extent of coastal shipping is relatively small. The road freighttransport fleet consists of trucks.
International transport comprises both air and sea transport. Air transport handles nearly all ofthe passenger transport and a relatively small amount of freight. Sea transport on the other handhandles the bulk of the freight dealing with imports and exports. A small amount of sea freightincludes transport to the northern and eastern regions of the country.
GHG emissions from mobile sources consist of the gaseous product of engine fuel combustion(exhaust emissions) and evaporation and leaks from vehicles (Fugitive emissions). Carbondioxide (CO2) and carbon monoxide (CO) emissions are due to the oxidation of fuel duringcombustion. Other emissions from the transport sector include Methane (CH4), Nitrous Oxide(N2O), Oxides of Nitrogen other than nitrous oxide (NOx), Non Methane Volatile OrganicCompounds (NMVOC). NMVOC emissions are fugitive emissions due to evaporation andleaks.
3.3.1 Civil AviationFew private sector organizations operate the local air transport, which includes both passenger,and freight transport. The energy consumption consists of aviation turbine fuel and aviationgasoline.
3.3.2 Road TransportationSri Lanka had a network of approximately 10447.61 km of metalled and bitumen surfaced roadsin 1990. Of the active road vehicle fleet only 25%comprise new imported vehicles, 75%comprise imported reconditioned vehicles. Petrol and auto diesel are the main fuels used forroad transport in Sri Lanka. Buses and trucks are the main diesel consumers. Petrol is mainlyconsumed by cars and vans.
3.3.3 RailwaysThe railway sector of Sri Lanka has about 1450 km of railway track, most of which is limited to asingle line. The 102 km of double track extends from Colombo up to Polgahawela on the mainup-country line and from Colombo up to Wadduwa on the coastal line. The effective railwayfleet of Sri Lanka consists of about 200 diesel locomotives and 46 power sets. Diesel is the majorfuel type used. A small amount of coal is also used for steam railways.
3.3.4 NavigationThe Port of Colombo which is the main marine center for navigation in Sri Lanka handles mostof the international marine transport. Two smaller ports in Galle and Trincomalee also handlesome coastal shipping and fishing boats. The energy consumed consists of marine diesel and fueloil.

40
ESTIMATION OF EMISSIONS
Tables 3.16 and 3.17 show the Fuel consumption values for the road vehicles in kilo litres andkilo tonnes respectively.
TABLE 3.16: FUEL CONSUMPTION (BY VOLUME) IN ROADTRANSPORT SECTOR - 1994
Vehicle Type Fuel Type Consumption ‘000 Lit -1994CAR PETROL 114,692
PICK UP PETROL 26,595
MINI BUS PETROL 1,250.4
MOTOR CYCLE PETROL 62,373
MOTOR TRICYCLE PETROL 7,879.9
SUB TOTAL 212,791
CAR DIESEL 17,241
MEDIUM BUS DIESEL 143,796
DUAL PURPOSE DIESEL 215,769
JEEP DIESEL 12,809
HEAVY BUS DIESEL 81,278
TRUCK DIESEL 309,436
SUB TOTAL 789,328
TABLE 3.17: FUEL CONSUMPTION (BY WEIGHT) IN ROADTRANSPORT SECTOR
Vehicle Type Fuel Type Consumption (kt) 1994CAR PETROL 84.378PICK UP PETROL 19.566MINI BUS PETROL 0.920MOTOR CYCLE PETROL 45.888MOTOR TRICYCLE PETROL 5.797SUB TOTAL 156.549
CAR DIESEL 14.751MEDIUM BUS DIESEL 123.029DUAL PURPOSE DIESEL 184.611JEEP DIESEL 10.959HEAVY BUS DIESEL 69.541TRUCK DIESEL 264.753SUB TOTAL 667.644
Fuel consumption by railways amounted to 26.97kt of Diesel/Gas Oil and 0.55kt of coal; fuelconsumption in local marine was 2.63kt of Diesel/Gas oil & 0.025kt of Fuel Oil while that in airtransport was 78.34kt of aviation turbine fuel & 0.42kt of aviation gasoline.

41
Table 3.18 shows the amounts of fuel used by international bunkers.
TABLE 3.18: FUEL CONSUMPTION IN INTERNATIONAL BUNKERS - 1994FUEL TYPE CONSUMPTION (kt)
Marine Diesel 48.83Furnace Oil 299.393Aviation Gasoline 0.130Aviation Turbine Fuel 146.9
EMISSIONS DATAStandard emission factors for the transport sector of Sri Lanka have not been tested andestablished so far. Several references to emission factors have been made elsewhere, but becauseof the uncertainty of the representation, the lack of evidence of reproducibility of such emissionfactors and the wide variation of these emission factors with the IPCC standard/default values,the IPCC default values have been used in this estimate in order to retain uniformity and betterreliability of the estimates. Default Carbon emission factors presented by the IPCC shown inTable 3.19 were used in the estimations.
TABLE 3.19: CARBON EMISSION FACTORS USEDFuel Type Carbon Emission Factor / (t C/TJ)Gasoline 18.9
Diesel 20.2Coal 25.8
Av Turbine Fuel/Jet Kerosene 19.5Fuel Oil 21.1
The emission factors for the non-CO2 emissions applicable to road vehicles are presented inTables 3.20 (A&B). As can be seen, road transport consists of different vehicles each having anindividual emission factor for a given GHG. Depending on the extent of the fuel consumptionby each vehicle category, an average emission factor for the road transport sector could beevaluated for each GHG and for each year. The values presented in the Table 3.21 under theroad transport represents the average emission factor for the GHG for the whole fleet in a givenyear.
TABLE 3.20A: NON CO2 EMISSION FACTORS FOR INDIVIDUALROAD VEHICLE TYPES
EMISSION FACTORS (t/TJ)VEHICLE TYPE CO CH4 NOx N2O NMVOCPETROLCar 13 0.02 0.6 0.001 1.5Pickup 8.3 0.02 0.7 0.001 1.4Mini Bus 7.9 0.02 0.7 0.001 0.8Motor Cycle 13 0.1 0.06 0.001 8.3Motor Tricycle 12 0.1 0.2 0.001 2.4

42
TABLE 3.20B: NON CO2 EMISSION FACTORS FOR INDIVIDUALROAD VEHICLE TYPES (DIESEL)
EMISSION FACTORS (t/TJ)VEHICLE TYPE CO CH4 NOx N2O NMVOC
DIESEL
Car 0.3 0.002 0.3 0.004 0.07Medium Bus 0.4 0.001 0.4 0.004 0.1Dual Purpose 0.4 0.001 0.4 0.004 0.1
Jeep 0.4 0.001 0.4 0.004 0.1Heavy Bus 0.9 0.006 1 0.003 0.2Truck 0.9 0.006 1 0.003 0.2
TABLE 3.21: NON CO2 EMISSION FACTORSMode of Transport CO CH4 NOx N2O NMVOC
National Navigation 1000 5 1500 0.6 200
Rail Transport a 150 1000 10 5 300 1200 1.4 0.6 20 200
Domestic Aviation 100 0.5 300 2 50
Road Transport 1993 b 8450 655 23 4 670 705 1 3.5 1140 150
Road Transport 1994 b 8550 650 24 4 660 700 1 3.5 1195 150
Road Transport 1995 b 8550 650 24 4 660 700 1 3.5 1195 150
Int. Marine Bunk. 1000 5 1500 0.6 200
Int. Av. Bunk. 100 0.5 300 2 50
Note: All the values are in kg of the gas/TJ (a) The first column represents the emission factorsfor coal and the second column the emission factors for oil. (b) The first column represents theemission factors for Gasoline and the second column the emission factors for Diesel
TABLE 3.22: CO2 EMISSIONS FROM THE TRANSPORT SECTOR - 1994Mode of Transport CO2 Emission (Gg)National Navigation 8.34
Rail Transport 87.00
Domestic Aviation 248.56
Road Transport 2602.41
Transport Total 2946.31
International Marine Bunkers 1076.76
International Aviation Bunkers 464.06
Total International Bunkers 1540.82

43
TABLE 3.23: NON-CO2 EMISSIONS FROM THE TRANSPORT SECTOR - 1994Mode ofTransport
CO CH4 NOx N2O NMVOC
NationalNavigation
114.9 0.6 172.4 0.1 23.0
RailTransport a
2.1 1168.6 0.1 5.8 4.2 1402.3 0.02 0.7 0.3 233.7
DomesticAviation
351.2 1.8 1053.6 7.0 175.6
RoadTransport b
59964.9 18803.8 147.3 115.7 4628.9 20250.2 7.0 101.3 8381.1 4339.3
Int. MarineBunk.
14148 70.7 21220 8.5 2829.7
Int. Av.Bunk.
655.6 3.3 1970 13.1 327.8
a. First Column Coal based & second Oil based b. First column Gasoline based & second diesel based
3.4 OTHER SECTORS HAVING EMISSIONS FROM ENERGY CONSUMPTION
3.4.1 Commercial and Institutional SectorThe commercial sector consists of commercial organizations such as shops, markets, banks, andhotels. Although electricity is the main energy source in the commercial sector small quantities offossil fuels and biomass are also used. Consumption of LPG, Charcoal and Fuelwood (air dried)in the commercial sector in 1994 were 11kt, 0.82kt, and 276kt respectively.
EMISSION FACTORSEmission factors shown in Table 3.24 are the default values presented by the IPCC
TABLE 3.24: EMISSION FACTORSFuel Type Emission Factor/(Gg/TJ)
CO CH4 NOX N2O NMVOC
Charcoal furnace/kiln 7000 200 100 1 100
LPG Furnace 20 10 100 0.6 5
Conventional Biomass Stove 5000 300 100 4 600
TABLE 3.25: ESTIMATE OF EMISSIONS FROM THECOMMERCIAL SECTOR - 1994
Emissions (Gg)CO2
BiofuelsCO2
FossilCO CH4 NOx N2O NMVOC
410.33 32.49 21.57 1.29 0.48 0.02 2.57
3.4.2 Residential SectorFuelwood and agricultural wastes are the traditional sources of energy used by the domesticsector of Sri Lanka. These fuels which are used as energy sources for cooking in manyhouseholds are derived from forests, tree crops, home gardens, scrubs and waste land. However,with the introduction of LPG during the last decade, it has become a popular fuel for cooking,mainly in urban areas. Today, the entirety of the LPG consumed is used for household cooking.Kerosene is a main fuel used for lighting amongst rural households. Small quantities of keroseneand electricity are also used for cooking. Fuel consumption values in the residential sector areshown in Table 3.26.

44
TABLE 3.26: FUEL CONSUMPTION BY THE RESIDENTIAL SECTORFUEL TYPE APPLIANCE CONSUMPTION (kt) - 1994
Kerosene Cooker 56.49
Lamp 156.34
LPG Cooker 53.0
Charcoal Iron 0.448
Fuelwood Stoves 8256
EMISSION FACTORSEmission Factors for non CO2 gases applicable to the residential sector are given in Table 3.27.
TABLE 3.27: EMISSION FACTORS FOR NON CO2 GASESFOR RESIDENTIAL SECTOR
EMISSION FACTOR (kg/TJ)CH4 N2O NOx CO NMVOC
Oil 10 0.6 100 20 5
Biomass 300 4 100 5000 600
Charcoal 200 1 100 7000 100
TABLE 3.28: ESTIMATE OF EMISSIONS FROM THERESIDENTIAL SECTOR - 1994
Emissions (Gg)CO2
BiomassCO2
FossilCO CH4 NOx N2O NMVOC
15671.76 834.18 640.17 38.51 14.00 0.52 76.84
3.4.3 Agriculture and forestryThe agriculture and forestry sectors of Sri Lanka employ both traditional and moderntechnologies for operations such as land clearing, land preparation, harvesting, etc. Some of theoperators depend either on cattle or manual labour. Others use tractors, water pumps andharvesters. Diesel is used for tractors and kerosene for operating water pumps.
This sector comprises of forestry, major export crops, such as tea, rubber and coconut; minorexport crops such as pepper, cloves, cinnamon etc. and; products of domestic agricultural usesuch as paddy, sugar, maize and other minor food crops. Of the above crops, paddy is mainlyresponsible for the use of fuel in crop production compared with other crops. Fuel combustionactivities in forestry have been more or less stagnant and insignificant during the years underconsideration. The average growth rate in the paddy and other sectors in the years 1993 and1994 has been 10%, 4% and 5% respectively. The fuel consumption for this sector for the year1992 was available. Due to unavailability of fuel consumption data for the 1994, the fuelconsumption values presented were estimated using the above growth figures. The fuelconsumption figures estimated are given in Table 3.29.

45
TABLE 3.29: FUEL CONSUMPTION BY THEAGRICULTURAL/FORESTRY SECTOR
FUEL TYPE APPLIANCE CONSUMPTION (kt)1992 1993 1994
Kerosene Pumps 18.03 19.83 20.62
Diesel Tractors 20.01 22.0 22,89
EMISSION FACTORSEmission factors applicable to the sector are shown in Table 3.30.
TABLE 3.30: EMISSION FACTORS FOR NON CO2 GASES FORAGRICULTURAL/FORESTRY SECTOR
EMISSION FACTOR (kg/TJ)CH4 N2O NOx CO NMVOC
Kerosene (pump) 4 0.6 100 370 160
Diesel (tractor) 4 0.6 1200 370 160
3.4.4 FisheriesAs in the case of the agricultural sector, the fisheries sector also employs both traditional andmodern methods for fishing. Traditional boats include Oru, which are outrigger canoes madeout of hollowed log and provided with mast and boom for supporting a sail, and Vallams,Teppams and Kattamarans which are constructed either as a dugout canoe from a log or fromplanks on a frame. These have an outrigger and a sail for use when fishing outside shallowwaters. Mechanical craft used include fibreglass reinforced plastic (FRP) boats, which are eitheropen decked or close decked made out of FRP material and powered by kerosene. Thetraditional craft and the small, mechanized boats are day boats with no facilities for storing fishor carrying ice for storage purposes. Eleven ton multi-day boats were introduced in the earlyeighties and several hundred of these boats are presently in use in the off shore fisheriesactivities.
Details pertaining to the fishing fleet and the fuel usage are given in Tables 3.31 and 3.32respectively.
TABLE 3.31: FISHING FLEET IN SRI LANKA - 1994TYPE OF BOAT 1994
1. Multi Day inboard engines Craft over 32 ft 1543
2. Day inboard engines 28-32 ft 1272
SUB TOTAL (Inboard) 2815
3. Traditional Motorized with outboard engine 1016
4. 17.5-32 ft FRP boats fitted with Out Board Motors 8843
5. Traditional Non Motorized fishing fleet 12462
TOTAL 25136

46
TABLE 3.32: FUEL CONSUMPTION BY FISHING BOATS- 1994TYPE OF BOAT AVERAGE FUEL
CONSUMPTION/YEAR/UNIT (kg)
ANNUALCONSUMPTION
(TONNES)1. Multi Day inboard engines2. Craft over 32 ft (DIESEL)
25380 39161.34
3. Day inboard engines4. 28-32 ft (DIESEL)
3086.2 3925.646
5. Traditional Motorized with outboardengine (KEROSENE)
2356.5 2394.2
6. 17.5-32 ft FRP boats fitted with OutBoard Motors + Traditional Out BoardEngines (KEOSENE)
2356.5 20838.57
TOTAL: Kerosene Diesel
23232.743087
EMISSION FACTORSEmission factors applicable to the fisheries sector are shown in Table 3.33.
TABLE 3.33: EMISSION FACTORS FOR NON CO2 GASESFOR FISHERIES SECTOR
EMISSION FACTOR (kg/TJ)CH4 N2O NOx CO NMVOC
Kerosene (boat) 5 2 1600 500 110
Diesel (boat) 5 2 1600 500 110
As can be seen from the above discussion, the combined Agriculture, Forestry and Fisheriessectors make use of kerosene for both stationary and mobile activities and diesel for mobileactivities only. Hence for the combined activity, the average emission factors depending on theactivity in each sector for a given year could be evaluated. The average emission factors for non-CO2 gases are given in Table 3.34 below.
TABLE 3.34: EMISSION FACTORS FOR NON CO2 GASES FOR COMBINEDAGRICULTURE, FORESTRY AND FISHERIES SECTORS - 1994
OIL EMISSION FACTOR (kg/TJ)CH4 N2O NOx CO NMVOC
Kerosene and DieselBoats and TractorsMOBILE 4.770 1.687 1508.1 470.13 121.49
KerosenePumpsSTATIC (all years) 4 0.6 1200 370 160

47
Emissions from the sector were estimated using the IPCC procedure. The results are shown inTable 3.35.
TABLE 3.35: OVERALL EMISSIONS FROM AGRICULTURE,FORESTRY AND FISHERIES SECTORS - 1994
Emissions (Gg)CO2
From mobile sourcesCO2
From static sourcesCO CH4 NOx N2O NMVOC
283.59 67.66 2.17 0.024 5.97 0.0106 0.62
3.4.5 Fugitive EmissionsIn addition to emission from the above four main groups there are fugitive emissions associatedwith fuels. These are intentional or unintentional releases of gases from anthropogenic activities.Such emissions may arise with the production, processing, transmission and storage of coal, oiland natural gas. Methane (CH4), carbon dioxide (CO2) and non methane volatile organiccompounds (NMVOC) are some of the emissions reported to be fugitive.
Crude oil is imported to the country by the Ceylon Petroleum Corporation and refined at theSapugaskanda refinery. Fugitive emissions due to the handling of crude oil are considered inorder to account for this sector. Amount of Crude oil processed in the Refinery in the year 1994was 1944.55kt.
The amount of crude oil amount shown above is generally unloaded via pipelines and transportedto the refinery for processing. The refined products are thereafter stored in Storage tanks withsecondary seals. There are no catalytic cracking or sulphur recovery plants operated during therefining process.
EMISSION FACTORSEmission factors used for the estimation of emissions from fugitive activities in Sri Lanka arepresented in Table 3.36.
TABLE 3.36: EMISSION FACTORSACTIVITY EMISSION FACTOR COMMENT
Oil Transport 745 kg CH4/PJ oil tankered Only half of this value was taken asloading of crude oil to tankers doesnot take place in Sri Lanka and henceonly half of the operation takes place.
Oil Refining 750 kg CH4/PJ oil refined
0.09 kg CO/t oil refined
0.06 kg NO x/t oil refined
0.62 kg NMVOC/t oil refined
0.93 kg SO 2/t oil refined
Oil Storage 140 kg CH 4 /PJ refined oil
Oil Storage:Secondary Seals
0.2 kg NMVOC/t crude oilthroughput

48
TABLE 3.37: EMISSIONS DUE TO FUGITIVE ACTIVITIES - 1994Emissions (Gg)
Oil Transport Oil Refining Oil Storage
CH4 CO CH4 NOx NMVOC SO2 NMVOC CH4
0.03 0.18 0.06 0.12 1.21 1.81 0.39 0.01
3.5 INDUSTRIAL PROCESSES
MINERAL PRODUCTS
CEMENT PRODUCTIONEmissions of carbon dioxide during the production of cement is one of the most importantsources of carbon dioxide emissions from the industrial sector in Sri Lanka.
Raw materials used for cement production are limestone and clay. The raw mixture is initiallyfinely ground and fed into a kiln in order to obtain clinker. The clinker is thereafter ground withapproximately 4%-5% gypsum in order to obtain finished cement. High temperatures in cementkilns chemically change raw material lime into cement clinker and thereby emit carbon dioxide.
CO2 emissions from cement production are obtained by using of an emission factor expressed intonnes of CO2 released per tonne of clinker produced. The recommended emission factor forclinker is 0.5071 tonnes of CO 2 per tonne of clinker produced.
There are five main cement factories in Sri Lanka. They are, Puttalam Cement Factory, RuhunuCement Factory, Kankasanturai Cement Factory, Mahaweli Marine Cement Co. Ltd, and theTokyo Cement Co (Lanka ) Ltd.
The Puttalam cement factory is the only clinker producer in Sri Lanka, making its own clinkerusing limestone to produce cement. The other factories such as Ruhunu Cement, use importedclinker. The other cement factories such as Tokyo Cement Co. (Lanka) Ltd and MahaweliMarine Cement Co. Ltd do not manufacture cement but repack imported cement for the localmarket. The Kankasanturai Cement factory has been closed after June 1990 due to civildisturbances in the northern province. Since direct cement imports and production of cementusing imported clinker do not contribute to the national inventory of greenhouse gas emissions,the production of clinker from the Puttalam Cement factory is considered here for thegreenhouse gas estimates. The clinker production data used in this estimation are given in Table3.38.
TABLE 3.38: CLINKER PRODUCTION DATA OFTHE PUTTALAM CEMENT FACTORY- 1994
ITEMClinker Imports (kt) 52.5
Total annual Production of cement from Clinker (kt) 478
Total Clinker used for cement (kt) 457.4
Actual Clinker Produced locally (kt) 404.9
Total annual Production of cement from locally produced Clinker (kt)* 423.12
* Cement is assumed to contain gypsum equivalent to 4.5% by weight of Clinker

49
Clinker is generally mixed with gypsum and the average clinker/lime percentage is estimated tobe 64.6%. Based on this figure, an average emission factor of 0.5071 t CO 2/tonne of clinker isrecommended. It is also recommended that SO2 emissions from the clay raw material beincluded in the estimates. S content of lime in Sri Lanka is not readily available. Hence, therecommended default value of 0.3 kg of SO2/tone of cement produce is taken for the estimates.
LIME PRODUCTIONFour main types of limestones are reported to be available in Sri Lanka. These are
Miocene Limestone (95% of CaCO3)Calcite (100% CaCO3)Coral and shells (95% CaCO3)Dolomite (CaCO3, MgCO3)
Pure limestone deposits are present only at a few locations. The magnesium varieties arereported to be more abundant . Miocene limestone is confined to the north and north-westernregions of Sri Lanka and is found along the coastal belt from Puttalam to Jaffna Peninsula.Miocene limestone is exploited by the Puttalam cement factory and emissions from its use havebeen already considered in the previous section. CO2 is a by-product of quick lime production.
The amount of lime produced is generally targeted to the demand. Therefore, the total amountof lime consumed per year could be approximated to the total annual production. The usage ofdolomite for the production of lime stood at 4.546kt in 1994.
The average composition of dolomite in Sri Lanka is reported to be 30.4%CaO, 21.7% MgO and47.9% CO2. Based on this composition, the amount of lime produced could be estimated as0.521 t lime/t of dolomite used and an emission factor of 0.919 t CO 2/ t of lime produced. Thetotal production of lime for the construction industry in Sri Lanka amounted to 2.368kt in 1994.
LIMESTONE AND DOLOMITE USEIndustries such as iron and steel, glass manufacture; agriculture; construction and environmentalpollution control make use of lime and dolomite in their processes. Use of dolomite and calcitein the ceramic, glass and other industries amounted to 2.022kt and 3.938kt respectively in 1994.
The emission factors recommended are 440fkg CO2/tonne of limestone used and 477f kgCO2/tonne of dolomite used (f -fractional purity of limestone or dolomite i.e. t CaCO3/t rawmaterial). Default value of f=1 has been used because of uncertainty of the purity of calcite anddolomite produced.
SODA ASH PRODUCTION AND USESoda Ash is not produced in Sri Lanka; the requirements are imported. The quantity of soda ashused in Sri Lanka in 1994 was 3744.66t.
The default emission factor for the emission of CO2 is 415 kg CO2 /t of Na2CO3 used.
ASPHALT ROOFINGAsphalt roofing is produced in Sri Lanka by a privately owned factory at Puttalam, based on aprocess of saturation without spray. The production of roofing was 589077kg in 1994.
The default values for the emission factors for the production of asphalt roofing used in theestimation of emissions are given in Table 3.39.

50
TABLE 3.39: EMISSION FACTORS FOR ASPHALT ROOFING PRODUCTION
Emission factors for Asphalt Roofing Production (kg/tonne of Product)Emission factor
(saturation with spray)Emission factor
(saturation without spray)NMVOC 0.13-0.16 0.046-0.049
CO NAV 0.0095
NAV= Not available
ROAD PAVING WITH ASPHALTThe default factor of 100kg asphalt/m 2 road surface was used in order to estimate the asphaltused. The total paving area and corresponding asphalt used in 1994 amounted to 339.2x10 3 m2
and 33.92kt respectively.
The default values for the emission factors for the production of asphalt and use of asphalt aregiven in Table 3.40 below.
TABLE 3.40: EMISSION FACTORS FOR ASPHALT USE ON ROADSEmission factors for Road Paving with Asphalt (kg/tonne of Asphalt)
SO2 NOx CO CO2 NMVOC
Asphalt Plant 0.12 0.084 0.035 0 0.023
Road Surface NAV NAV NAV 0 320
GLASS PRODUCTIONIndustries which manufacture glass emit NMVOC. The total production of glass in Sri Lanka in1994 was 15103 tonnes. The emission factor for the NMVOC for the glass industry is 4.5 kgMVOC/t of glass produced.
CHEMICAL INDUSTRYIn the chemical industry, the production of Ammonia, Nitric Acid, Adipic Acid, Urea, Carbides,Caprolactam and Petrochemicals generate GHG emissions during processing. Sri Lanka doesnot have a facility for producing the above chemicals except for the Ceylon PetroleumCorporation which produces petroleum products. Greenhouse gas emissions from the chemicalindustry of Sri Lanka are therefore assumed to be insignificant in this analysis.
METAL PRODUCTIONMetal production includes the production of metals like Iron and Steel, Ferroalloys, Aluminiumand others. Sri Lanka does not have a strong metal production industry. Only a moderatequantity of steel from intermediate metal is produced at the Ceylon Heavy Industries andConstruction Co. Ltd., at Athurugiriya (formerly the Ceylon Steel Corporation) and iron is notproduced at this factory. The quantity of steel produced in 1994 was 55.5kt.
Emission factors for the rolling mills used were the default values recommended by the IPCC.These are given in Table 3.41.

51
TABLE 3.41: EMISSION FACTORS FOR ROLLING MILSEmission factors for rolling mills (g/tonne of steel produced)
SO2 CO2 NOx CO NMVOC
45 1.6 40 1 30
OTHER PRODUCTION
PULP AND PAPERThe National Paper Co. Ltd., manufactures paper in Sri Lanka at the Valachchanai mills and theEmbilipitiya Mills. The total production in 1994 was 37500 tonnes. Emission factors for theprocess used were the default values given in Table 3.42.
TABLE 3.42: EMISSION FACTORS FOR KRAFT PULPING PROCESSEmission Factors for Rolling Mills (kg/Tonne of Dried Pulp)
SO2 Nox CO VOC
7 1.5 5.6 3.7
FOOD AND DRINKIt is known that emissions of NMVOC are produced in some preparations within the foodsector. Alcoholic beverages like wines, beer, spirits, production of bread, cakes and biscuits,sugar, animal feeds, meat and poultry, margarine and cooking fats etc., produce NMVOCemissions. Annual production data of these industries in Sri Lanka are presented in Table 3.43.
TABLE 3.43: ANNUAL PRODUCTION OF NMVOC EMITTING FOODINDUSTRIES IN SRI LANKA
UNIT PRODUCTION – 19941. Beer Hl 69620
2 Spirits including Arrack Hl 510881.3
3. Bread T 49097
4. Cakes and Biscuits T 30178.2
5. Meat, Fish and Poultry Kt 306.32
6. Sugar Kt 73.53
7. Margarine Kt 8.5
8. Animal Feed Kt 73.95
Emission factors applicable to the industries are given in Table 3.44.

52
TABLE 3.44: EMISSION FACTORS FOR NMVOC:FOR FOOD INDUSTRIES IN SRI LANKA
EMISSION FACTOR UNIT MEASURED1. Beer 0.035 kg/hl2 Spirits including Arrack 15 kg/hl3. Bread 8 kg/t4. Cakes and Biscuits 1 kg/t5. Meat, Fish and Poultry 0.3 kg/t6. Sugar 10 kg/t7. Margarine 10 kg/t8. Animal Feed 1 kg/t
PRODUCTION OF HALOCARBONS AND SULPHUR HEXAFLUORIDEHFC, PFC and SF6 are not produced in Sri Lanka. Emissions due to this sector are therefore notconsidered.
CONSUMPTION OF HALOCARBONS AND SULPHUR HEXAFLUORIDEIntroduction of halocarbons to Sri Lanka commenced in 1997. Hence, there are no records ofimports of these chemicals to Sri Lanka for the year 1994. A study of refrigeration and airconditioning manufacturers and repairers has revealed that HFC and PFC chemicals have notbeen used by them during the years 1993-1995. However, small quantities of SF 6, 6457kg havebeen imported to Sri Lanka in 1994.
Emissions of SF6 per year are estimated using the default method recommended by the IPCC.Due to the unavailability of data of the total stocks of Gas Insulated switchgear (GGIS), the totalemission per year is assumed to be equal to the consumption.
TABLE 3.45: SUMMARY OF EMISSIONS FROM THEINDUSTRIAL SECTOR PROCESSES - 1994
Emissions (Gg)SF6 SO2 NOx CO CO2 NMVOC
(A)Mineral Products1. Cement Production 0.13 205.322. Lime Production 2.183. Limestone And Dolomite Use 2.704. Soda Ash Use 1.555. Asphalt Roofing 0.00 0.006. Road Paving With Asphalt 10.867. Glass 0.07
(B) Chemical Industry(C)Metal Production
(Tier 1b) Iron And Steel0.002 0.002 0.000 88.80 0.002
(D) Other Production1. Pulp And Paper 0.26 0.06 0.21 0.142. Food And Drink: Beverages 7.67
Food 1.41(F)Consumption of Sulphur
Hexafluoride0.007
Total 0.007 0.392 0.062 0.21 300.55 20.02

53
3.6 LIVESTOCK SECTORFrom ancient times, the livestock industry has been in the hands of the small holder farmers.Ruminant livestock include cattle, buffalo, goat and sheep; non-ruminant livestock includespoultry and swine. In general, the ruminant livestock are freely grazed on natural pastures. Largeruminants, that is cattle and buffalo are native or introduced or they are crosses. Cattle aremainly dairy types and no beef cattle are available. The heard size of cattle and buffalo dependon the agro-ecological zone, the purpose of raring and the extent of grazing lands. Herd size canvary from 1-5 (wet areas) to >100 heads (in dry areas). The distribution of livestock populationin different agro-ecological zones is given in table 3.46.
TABLE 3.46: DISTRIBUTION OF LIVESTOCK POPULATIONAgro- ecological Zones
Wet Zone Intermediate Zone Dry ZoneSpecies
Amount % Amount % Amount %
Cattle 271,100 15.91 310,300 18.22 1,122,100 65.87
Buffalo 120,300 15.20 222,400 28.10 448,700 56.70
Sheep 500 2.48 2,100 10.40 17,600 87.12
Swine 115,300 19.65 107,800 18.36 364,300 61.99
Goat 41,700 44.46 19,000 20.26 33,100 35.28
Poultry 4,113,400 43.39 2,093,900 22.08 3,273,500 34.53
Source: Department of Census and Statistics.
Since ruminant livestock is raised under an extensive, free range system, the accumulation ofmanure is very rare. Therefore, the only enterprises that stockpile or accumulate dung are thepoultry and swine industries. The livestock population in 1994 are given in table 3.47.
TABLE 3.47: LIVESTOCK POPULATION - 1994Species 1,703,500
Buffalo 791,400
Sheep 20,200
Swine 93,800
Goat 587,800
Poultry 948,200Source: Department of Census and Statistics.
Ruminant livestock produce large quantities of CH4 through their enteric fermentation in thefore stomach called rumen. Other non-ruminant herbivores produce CH4 through their hind gutfermentation. In ruminants, for every 100g of carbohydrate fermented in the rumen, 4.5g of CH 4
is produced. In other words 8% of dietary gross energy or 12% of digestible energy is lost asCH4.
In addition to enteric fermentation in ruminants and hind gut fermentation in non-ruminant,stockpiled or accumulated animal waste (faeces, litter and bedding) when subjected to anaerobicfermentation, undergoes Methonogenesis and produce and release CH4 to the atmosphere.Therefore, the amount as well as the method of handling of livestock waste will influence the rateand release of CH4 to the atmosphere.

54
METHODOLOGYCalculations were made according to the revised guideline of IPCC (1996) and using the IPCCdata processing package. For the values that are not available locally, default values of the IPCCreference manual were used. In using these default values, the most relevant and appropriatevalues for Sri Lankan conditions were selected considering animal breeds, type of feed, level ofmanagement and body weights.
ASSUMPTIONS1. The cattle and buffalo herd (population) comprise of animals with different age groups and
different body weights. Therefore, to avoid variation, all these animals were brought to astandard unit, which is accepted universally. This is called “livestock unit” (LU; Livestockunit = mature cow = LU)Mature cow = 1 LU; Mature bull = 1.25 LU; Buffalo = 1 LU; Calves/ Heifers = 0.6 LU
2. All of cattle and buffaloes are considered as dairy animals. In Sri Lanka, there is no beefcattle operation or feed lot system. Therefore, all are considered as dairy animals.
3. Almost all the ruminant livestock are managed under a free grazing/browsing system mainlydepending on natural roughages. Concentrate feed is used in very insignificant amountscompared to the total dry matter intake.
4. Since all ruminant livestock are managed under a free grazing system, excreta (both urine anddung) are naturally disposed on the field. No stockpiling or accumulation is thereforepresent.
5. Poultry comprise ducks and chicken and other minor important domesticated avian species.All the members were taken into account if recorded.
6. Where goats and sheep are not specified individually, they are taken together (similar LUvalues).
7. All ruminant livestock spices are fed on similar diets (mainly roughages). The methaneproduction is therefore similar.
8. The ruminant livestock population in the country is found within the same temperaturerange, with the exception of cattle in the Nuwara Eliya district (<27oC). Since the latterpopulation is very insignificant, compared to the total cattle population, they were notconsidered.
The emission factors for enteric fermentation and manure management systems are scanty. Noscientific evaluation has been done locally in estimating the emission factors for entericfermentation and manure management. The recommended default values suited for Sri Lankanconditions are therefore used, and are given in table 3.48.
TABLE 3.48: METHANE EMISSIONS FROM ENTERICFERMENTATION AND MANURE MANAGEMENT
Emission factors (kg/head/yr)Livestock species Enteric Fermentation Manure Management
Dairy Cattle 56 27
Non dairy cattle 44 2
Buffaloes 55 3
Sheep 5 0.21
Goat 5 0.22
Swine 1 7
Poultry Not emitted 0.023
Source : IPCC Guideline (1996).

55
The composition of the manure depends on the livestock species, because different speciesconsume different feeds. The capacity to produce methane is determined by the C:N ratio,anerobicity and method of storage. Faeces of ruminant livestock has a high C:N ratio than non-ruminant faeces. The methane producing capacity, and animal excreta of different livestockspecies are given in table 3.49.
TABLE 3.49: METHANE PRODUCING CAPACITY (Bo)OF THE MANURE OF LIVESTOCK SPECIES
Livestock species Capacity (m3/kg, VS)
Dairy Cattle 0.13
Non dairy cattle 0.10
Buffalo 0.10
Swine 0.29
Source : IPCC Guideline (1996); VS - Volatile solid.
Nitrous oxide (N2O) is another important GHG generated in the livestock industry and releasedin to the atmosphere. N2O is produced mainly from animal excreta including dung and urine.The rate of production depends on the N content in the excreta. Once the feed is ingested, theundigested nitrogen as faecal N and metabolized N as urinary nitrogen are excreted out of thebody. Therefore, the level of N in the excreta depends on the N states of the feed and rate ofdigestion.
When these N rich excreta undergoes aerobic microbial decomposition, N is converted N2O andescape in to the atmosphere. Since diet and level of N in the diets of different species oflivestock differ, the N excretion (Nex) also varies. Table 3.50 indicates the N excretion bydifferent livestock species.
TABLE 3.50: NITROGEN EXCRETION (Nex) BYDIFFERENT LIVESTOCK SPECIES
Livestock Species Nitrogen excretion (Nex) kg/head/yr
Dairy cattle / Buffalo 60
Sheep 12
Goat 12
Poultry 0.6
Swine 16
Source: IPCC Guideline (1996).
In this analysis, all ruminant livestock are considered to be free ranging and that voided excretaare readily dispersed on the grazing fields. Therefore, no stock piling or accumulation isconsidered possible. However, swine and poultry are raised under intensive systems ofmanagement under confined housing. Therefore, only these species are considered under dry lotor solid storage waste management systems. However, since emission factors for methane, andN2O are not available. Hence, the default emission factors recommended by IPCC were used.These default values are given in table 3.51.

56
TABLE 3.51: EMISSION FACTORS OF N2O FROM DIFFERENTANIMAL WASTES MANAGEMENT SYSTEMS (AWMS)
AMWS Emission Factors (EFS) (kg N2O -N/kgN)
Solid storage and dry lot 0.02
Pasture range and paddock 0.02
Source: IPCC Guideline (1996).
TABLE 3.52: EMISSIONS FROM LIVESTOCK SECTOR – 1994Methane (Gg) Nitrogen Dioxide (Gg)
Enteric Fermentation Manure Management
135.81 46.71 0.14
3.7 AGRICULTURE SECTORRice is the major food crop grown in Sri Lanka, cultivation being confined to two major seasonsnamely Yala and Maha. During 1994 655,272 ha were cultivated under irrigation and 229,924 haunder rain-fed conditions.
In addition to rice, other short-term food crops such as pulses, oil crops, fibre crops, othercereals, yams, vegetable etc. are also grown annually. These include The extent under these cropsare not extensive as rice and mostly location specific. However, they all are grown under aerobicsoil conditions. Crop residues are produced in large quantities in this sector but these residuesare not fully utilized as manure or animal feed. Usually they are allowed to decompose or burnton site. The total extent of these crops cultivated during 1994 is given in table 3.53.
TABLE 3.53: HARVESTED EXTENT (ha) OF FIELD CROPS - 1994Type of crops Area
Other cereals 44,506
Pulses 50,546
Oil crops 19,293
Yams 49,592
Spices 44,854
Total 208,791
Source: Census and Statistics Department.
The other major agricultural crop sector is the plantation sector. This comprises of perennialssuch as tea, rubber, coconut and other export agriculture crops. These crops with other fieldcrops demand large quantities of commercial fertilisers. The major crop residues, their N:C ratio,carbon fractions are given in table 3.54.
In addition to commercial N fertilisers, animal excreta also contribute to total N2O pool fromfield disposals. The N excretion rate and fraction of N per AWMS is given in table 3.55.

57
TABLE 3.54: DRY MATTER FRACTION, CARBON CONTENTAND N/C RATIO OF SIXTEEN CROP RESIDUES
Residue Fraction of DryMatter
Carbon Fraction ofResidue
N/C ratio
Rice 0.83 0.4144 0.014Maize 0.4 0.47.9 0.02Kurakkan 0.5 0.45 0.016Sorghum 0.5 0.5 0.02Pea 0.5 0.5 0.02Soyabean 0.5 0.4 0.05Potatoes 0.4 0.4226 0.02Ground nut 0.7 0.4 0.02Cowpea 0.5 0.4 0.02Green gram 0.5 0.4 0.02Black gram 0.5 0.4 0.02Gingerly 0.5 0.4 0.02Manioc 0.5 0.45 0.02Chillies 0.5 0.45 0.02Big Onion 0.5 0.4 0.02
TABLE 3.55: NITROGEN EXCRETION, FRACTIONOF MANURE NITROGEN PER AWMS
Livestock type N2 Excretion Nex(kg/head/yr)
Fraction of Manure N perAWMS (%) (Fraction)
Non-dairy 60 29Dairy 60 24
Poultry 0.6 0Sheep 12 83Swine m 53
Other than N2O many other gases such as CH4, CO, NOx are generated during field burning ofcrop residues. As a practice many crop residues specially rice straw is burnt on site. This results ingeneration of GHGs. Emission and conversion ratio of GHGs due to field burning is given intable 3.56.
TABLE 3.56: EMISSIONS RATIO OF CH4, CO, N2O, AND NOx
FROM THE RESIDUE BURNINGEmission Ratio Conversion Ratio
CH4 0.005 16/12CO 0.6 28/12
N2O 0.007 44/28NOx 0.121 46/14
METHODOLOGYThe GHG emissions for the year 1994 were calculated by using secondary data from relevantsources. The collected information was sorted, tabulated and modified to suit IPCC (1996)software package for analysis.

58
ASSUMPTIONS1. Rice was the only crop cultivated under submerged conditions.2. Yala and Maha were taken together in every year. Even though Maha season extends to the
following year, it was included in the current year for calculations.3. Extraction rates of crop residues were taken from international references.4. Default values for emissions are not available locally; therefore, values from Indian Sub-
continent were used.5. Rice cultivation is done under single aeration method.
TABLE 3.57: EXTENT RICE CULTIVATEDAND METHANE EMITTED - 1994
Extent cultivated (ha) 885196
Methane produced (Gg) 41.96
Cultivation of other field crops does not produce CH4 since they are grown under aerobiccondition with plenty of soil aeration. However, they produce large quantities of crop residues,which are often, under utilised, except for a small quantity of rice straw. Therefore, more thantwo-thirds of these crop residues are burnt on the field. The burning generates many GHG’s(table 3.58). Of all the gases released from the field burning of crop residues, the major gas isCO. The production of CH4 and CO2 was only 9% of the total gas production, production ofN2O were very negligible.
In addition to emission from field burning, direct emission from the use of commercial Nfertilisers (FSN), application of animal wastes as manure (FAW) and through N fixing crops (FBN)also play a vital role in contributing N2O to the atmosphere. These sources are illustrated in table3.59.
TABLE 3.58: TOTAL BIOMASS BURNT, C, N AND GHG GASESRELEASED FROM FIELD BURNING OF CROP RESIDUES
Total dry matter biomass burnt (Gg) 199.98
Total Carbon released (Gg) 501.94
Total Nitrogen released (Gg) 7.52
Total gases released from field burning (Gg)
CH4 3.35
CO 70.27
N2O 0.08
NOx 2.99
TABLE 3.59: DIRECT EMISSION OF N2O FROMAGRICULTURAL FIELDS
Direct emission Gg N2O - N/yr - 1994Synthetic Fertiliser (FSN) 1.27
Animal Waste (FAW) 0.04
N– Fixing Crops (FBN) 0.03
Crop Residues (FCR) 0.50
Total 1.84

59
In addition to these direct emissions, N2O is also released to atmosphere through histosols,pasture and range paddocks (AWMS). Also indirect emission from atmosphere depositions ofNH3 and NOx. These emissions are given in table 3.60.
TABLE 3.60: EMISSION N2O FROM HISTOSOLS,GRAZING ANIMALS, LEACHING
N2O Emission (Gg)Direct from Histosols 21.32
Grazing animals/Paddocks/Range 0.13
Leaching 1.57
Total 23.02
Overall generation of CH4, CO, N2O and NOx from agriculture sector is given in table 3.61.
TABLE 3.61: TOTAL EMISSIONS FROM THEAGRICULTURAL SECTOR - 1994
Source Emission (Gg)CH4
Rice Cultivation 20.98
Field burning of crop residues 3.35
Total CH4 24.33
CO
Field burning of crop residues 70.27
N2O
Field burning of crop residues 0.08
Direct emissions 1.84
Indirect emissions 23.02
Total N2O 24.94
NOx
Field burning of crop residues 2.99
3.8 FORESTRY AND LAND USE SECTORThe forest cover in Sri Lanka has been gradually depleting and presently stands at 1.58 millionhectares or 24% of the total land area. Depletion of the forest cover contributes to the elevationof carbon dioxide concentration in the atmosphere.
METHODOLOGYThe forest cover and deforestation and reforestation data were obtained from the ForestDepartment records and reports. Data on logging and rate of extractions were obtained from theState Timber Corporation. Data on land use changes are scanty, but some data were obtainedfrom the Land Use Division of the Department of Agriculture, the Upper Mahaweli WatershedManagement Division, the Irrigation Department, the Mahaweli Authority and the Ministry ofEnvironment and Forestry.
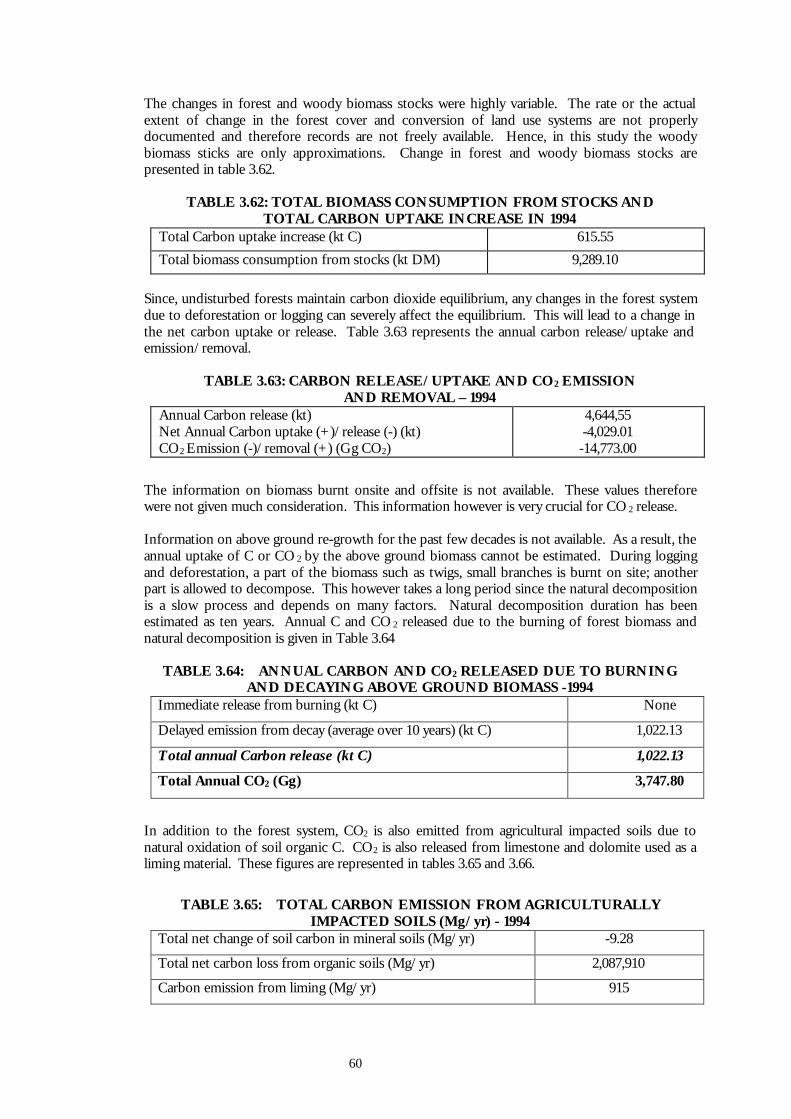
60
The changes in forest and woody biomass stocks were highly variable. The rate or the actualextent of change in the forest cover and conversion of land use systems are not properlydocumented and therefore records are not freely available. Hence, in this study the woodybiomass sticks are only approximations. Change in forest and woody biomass stocks arepresented in table 3.62.
TABLE 3.62: TOTAL BIOMASS CONSUMPTION FROM STOCKS ANDTOTAL CARBON UPTAKE INCREASE IN 1994
Total Carbon uptake increase (kt C) 615.55Total biomass consumption from stocks (kt DM) 9,289.10
Since, undisturbed forests maintain carbon dioxide equilibrium, any changes in the forest systemdue to deforestation or logging can severely affect the equilibrium. This will lead to a change inthe net carbon uptake or release. Table 3.63 represents the annual carbon release/uptake andemission/removal.
TABLE 3.63: CARBON RELEASE/UPTAKE AND CO2 EMISSIONAND REMOVAL – 1994
Annual Carbon release (kt)Net Annual Carbon uptake (+)/release (-) (kt)CO2 Emission (-)/removal (+) (Gg CO2)
4,644,55-4,029.01-14,773.00
The information on biomass burnt onsite and offsite is not available. These values thereforewere not given much consideration. This information however is very crucial for CO2 release.
Information on above ground re-growth for the past few decades is not available. As a result, theannual uptake of C or CO 2 by the above ground biomass cannot be estimated. During loggingand deforestation, a part of the biomass such as twigs, small branches is burnt on site; anotherpart is allowed to decompose. This however takes a long period since the natural decompositionis a slow process and depends on many factors. Natural decomposition duration has beenestimated as ten years. Annual C and CO 2 released due to the burning of forest biomass andnatural decomposition is given in Table 3.64
TABLE 3.64: ANNUAL CARBON AND CO2 RELEASED DUE TO BURNINGAND DECAYING ABOVE GROUND BIOMASS -1994
Immediate release from burning (kt C) None
Delayed emission from decay (average over 10 years) (kt C) 1,022.13
Total annual Carbon release (kt C) 1,022.13
Total Annual CO2 (Gg) 3,747.80
In addition to the forest system, CO2 is also emitted from agricultural impacted soils due tonatural oxidation of soil organic C. CO2 is also released from limestone and dolomite used as aliming material. These figures are represented in tables 3.65 and 3.66.
TABLE 3.65: TOTAL CARBON EMISSION FROM AGRICULTURALLYIMPACTED SOILS (Mg/yr) - 1994
Total net change of soil carbon in mineral soils (Mg/yr) -9.28
Total net carbon loss from organic soils (Mg/yr) 2,087,910
Carbon emission from liming (Mg/yr) 915
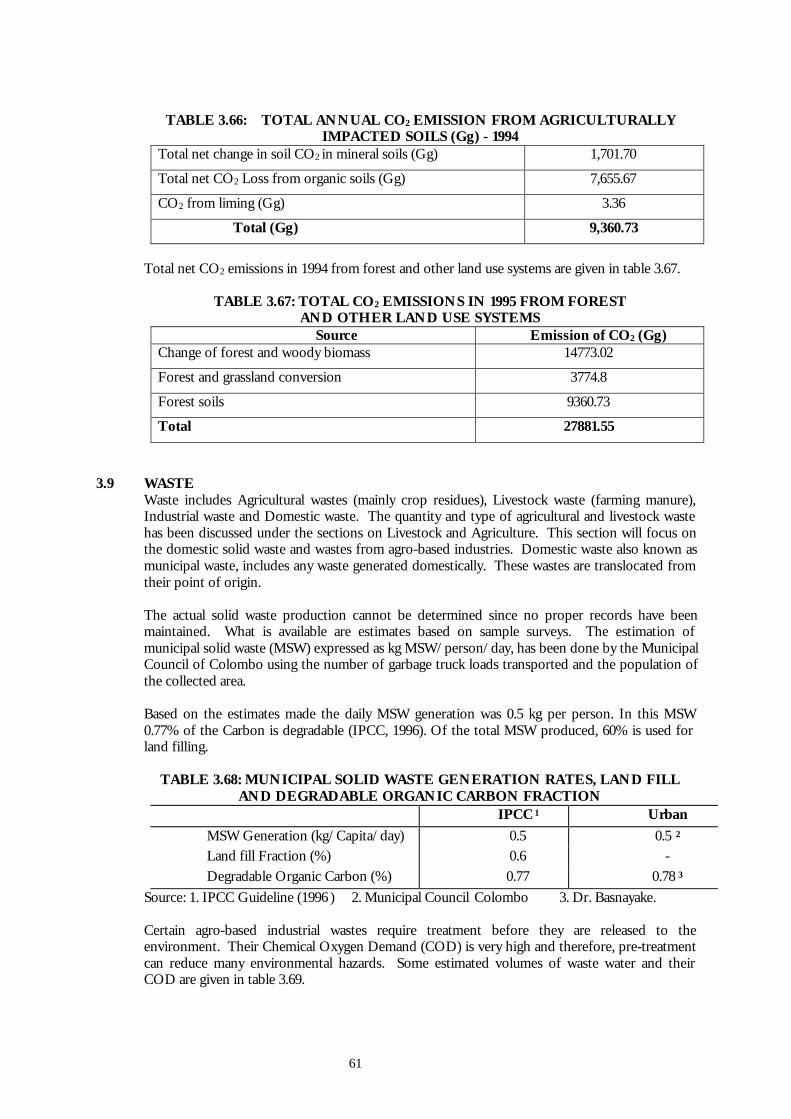
61
TABLE 3.66: TOTAL ANNUAL CO2 EMISSION FROM AGRICULTURALLYIMPACTED SOILS (Gg) - 1994
Total net change in soil CO2 in mineral soils (Gg) 1,701.70
Total net CO2 Loss from organic soils (Gg) 7,655.67
CO2 from liming (Gg) 3.36
Total (Gg) 9,360.73
Total net CO2 emissions in 1994 from forest and other land use systems are given in table 3.67.
TABLE 3.67: TOTAL CO2 EMISSIONS IN 1995 FROM FORESTAND OTHER LAND USE SYSTEMS
Source Emission of CO2 (Gg)Change of forest and woody biomass 14773.02
Forest and grassland conversion 3774.8
Forest soils 9360.73
Total 27881.55
3.9 WASTEWaste includes Agricultural wastes (mainly crop residues), Livestock waste (farming manure),Industrial waste and Domestic waste. The quantity and type of agricultural and livestock wastehas been discussed under the sections on Livestock and Agriculture. This section will focus onthe domestic solid waste and wastes from agro-based industries. Domestic waste also known asmunicipal waste, includes any waste generated domestically. These wastes are translocated fromtheir point of origin.
The actual solid waste production cannot be determined since no proper records have beenmaintained. What is available are estimates based on sample surveys. The estimation ofmunicipal solid waste (MSW) expressed as kg MSW/person/day, has been done by the MunicipalCouncil of Colombo using the number of garbage truck loads transported and the population ofthe collected area.
Based on the estimates made the daily MSW generation was 0.5 kg per person. In this MSW0.77% of the Carbon is degradable (IPCC, 1996). Of the total MSW produced, 60% is used forland filling.
TABLE 3.68: MUNICIPAL SOLID WASTE GENERATION RATES, LAND FILLAND DEGRADABLE ORGANIC CARBON FRACTION
IPCC 1 UrbanMSW Generation (kg/Capita/day) 0.5 0.5 2
Land fill Fraction (%) 0.6 -Degradable Organic Carbon (%) 0.77 0.78 3
Source: 1. IPCC Guideline (1996 ) 2. Municipal Council Colombo 3. Dr. Basnayake.
Certain agro-based industrial wastes require treatment before they are released to theenvironment. Their Chemical Oxygen Demand (COD) is very high and therefore, pre-treatmentcan reduce many environmental hazards. Some estimated volumes of waste water and theirCOD are given in table 3.69.

62
TABLE 3.69: VOLUME AND COD FOR ANAEROBICWASTE WATER TREATMENTS
Type of Industry Waste water out flower(m3 /ton of product)
Degradable organic component(kg COD / m3 waste water)1
Fertilizer 5** 0.251
Canaries 26* 0.251
Beer 5* 17 *
Meat Packing 18* 0.251
Dairy Products 2.8* 1.5*
Sugar 15** 98*Soft Drinks 2.5** 0.251
Paper 44** 3*
Petroleum Refining 3** 0.35*
Rubber 22.7 0.251
Source: 1. National GHG Inventory Australia (1988- 1990)*IPCC Guidelines (1996) ** Prof. N. Fernando.
The total annual MSW disposal and net CH4 emissions are presented in table 3.70.
TABLE 3.70: TOTAL ANNUAL MSW DISPOSAL ANDNET CH4 EMISSION - 1994
MSW disposed 1,956.22Gross Methane Generation 469.96Recovered Methane 0.0Net Annual Emission 469.96
The methane emission from domestic water is given in table 3.71.
TABLE 3.71: ESTIMATION OF METHANE EMISSIONFROM DOMESTIC WASTE WATER -1994
Total Organic Product (kg BOD/ yr) 62,232,600Total Methane Emission (kg) 592,805.63Net Methane Emission (Gg) 0.59
Table 3.72 represents the CH4 emission from treatment of industrial (commercial) waste water.
TABLE 3.72: ESTIMATION OF METHANE EMISSIONS FROMCOMMERCIAL WASTE WATER TREATMENT
Total Organic Product (kg BOD / yr) 292,058,514Total CH4 Emission (kg) 131,426,33Net CH4 Emission (Gg) 13.14
The Overall breakdown of GHG emissions in Sri Lanka in 1994 is given in Table 3.73. It can bethat the single most important source of CO2 emissions in the country is the Land Use andForestry Sector. This is followed by the Energy Sector. In terms of CH4 emissions, the EnergySector is the single largest contributor and is followed by the Agricultural Sector. It is thereforeimportant that greater attention should be focused on GHG mitigation measures and adaptationresponses within these sectors.

63
TABLE 3.73: BREAKDOWN OF OVERALL GHG EMISSIONS IN SRI LANKA – 1994
Green House Gas Source and Sink Categories CO2 (Gg) CH4 (Gg) N2O (Gg)Total (Net) National Emission (Gg per year) 33630.22 1098.375 162.86571. All Energy 5447.668 927.785 156.0257
Fuel CombustionEnergy and Transformation Industries 482.358 0.021 0.0041Industry - Contribution from Fossil fuel 801.08 1.92 0.07Transport – National navigation, Rail and road transport and Domestic aviation 2946.31 263 116.12
International Bunkers (Not included in national total) 1540.82 74 21.6Commercial and Institutional 32.49 21.57 1.29Residential- Contribution from Fossil fuel 834.18 640.17 38.51Other – Agriculture, Forestry and Fisheries Sectors 351.25 0.024 0.0106Biomass burned for energy 0.98 0.021
Fugitive emissionsOil refining, Transport and storage 0.1Coal Mining Not Applicable
2. Industrial Processes 300.553. Agriculture 156.86 3.42
Enteric Fermentation 135.86Rice cultivation 21Savanna Burning Not availableOthers – Manure management 47 3.34
Field burning of crops 0.084. Land Use Change And Forestry 27882
Changes in forest and other woody biomass 14773Forest and grassland conversion 3748Abandonment of Managed lands Not AvailableForest Soils 9361
5. Other Sources 13.73Domestic Waste Water Management 0.59Commercial Waste Water Management 13.14

64
CHAPTER 4
IMPACTS AND VULNERABILITY
INTRODUCTIONGlobal warming is expected to lead to a rise in sea level, higher temperatures, more frequent andprolonged droughts, high intensity rainfalls and increased thunder activity. These anticipated changesrepresent a significant threat to the coastal areas, the different sectors of the national economy andhuman health. The major impacts that can be expected from these changes are outlined below.
4.1 IMPACTS OF RISE IN SEA LEVELAs indicated in the IPCC Second Assessment Report (IPCC 1996, WG 1, Section 7.2):
- Global mean sea level has risen 10-25 cm over the last 100 years.- There has been no detectable acceleration of sea level rise during this century.
Studies of historical rates of relative sea level rise in the South Asia Seas region, reported byGable and Aubrey (1990), indicate an average annual relative sea level rise of 0.67 mm/year. Inaddition, during the past half-century or so, relative sea level changes in the region have rangedfrom a fall (i.e., land emergence) of 1.33 mm/year to a rise (i.e., land submergence) of 2.27mm/year (IPCC 1998).
4.1.1 The Coastal Zone – Socio Economic and Environmental PerspectiveThe coastal zone can be defined based on either one or a combination of geo physical, eco-system and human development considerations. There are 67 coastal administrative units in thecountry and if the coastal zone is defined landward by these administrative units and seawards bythe narrow continental shelf, the coastal zone will include:
a) Approximately 24% of the land area and 32% of the populationb) 65% of the urbanized land areac) Principal road and rail transport infrastructured) Principal commercial ports, fishery harbours and anchoragese) 65% of the industrial outputf) 80% of tourism related infrastructure with the majority being located in the western and
south-western coastal regions and most of them within close proximity to the shorelineg) 80% of fish productionh) A significant extent of agricultural landi) Substantial reserves of valuable mineralsj) Some of the richest areas of biodiversity including coral reefs, seagrass beds, mangroves,
lagoons, estuaries, wetlands and sanctuaries covering an extent over 160,000 hectaresk) Sizeable areas of usable land which remain undevelopedl) Areas subject to extensive water pollution associated with industrial pollution sources,
domestic waste water and sewage disposal and garbage disposalm) Many areas of cultural, historical and religious significance and scenic beauty
In Sri Lanka, the Coast Conservation Act has defined the coastal zone on geo-physicalconsiderations using linear dimensions (Fig. 4.1). This narrow and geographically defined coastalzone does not recognize the interconnections within coastal eco-systems, its resources and thehuman interactions. This limitation in the definition of the coastal zone could become a criticalconstraint when implementing action plans to respond to sea level rise.

65
4.1.2 Analyzing the Impacts of Sea Level RiseGlobal warming generates a chain of impacts of which sea level rise is one. When assessing theimpacts of global sea level rise on coastal regions, it is important to identify and understand theconnectivity of these inter-related issues, all emerging as a result of global warming. It is alsoimportant to recognize the global, regional and local scales of impacts as it would be the resultantimpacts that would finally affect a given environment.
Since the comprehensive analysis of impacts of global warming is a complex exercise, attention isusually focussed on predominant parameters. For example, the impacts of sea level rise would beanalyzed while giving due consideration to the influence of the impacts of other relatedparameters.
Sea level rise on its own would,
a) raise the mean sea level, leading to inundation of low lying coastal areas, shoreline retreat,intrusion of salinity and impacts on coastal habitats.
b) increase wave height (1) disturbing equilibrium beaches and making them more prone toerosion; (2) interfering with existing longshore sediment transport rates and distribution.
In addition, the combined effects of an increased mean sea level rise and increased wave heightswould result in further impacts such as undermining the stability of coastal structures, and thealtering of circulation patterns inside coastal embayments and estuaries. It is also recognized thata change in climate due to global warming would contribute to the reduction in the frequency ofoccurrence of extreme events thereby adding further complexity to the analysis of overallimpacts. There are several impacts due to sea level rise and these impacts were identified, basedon a survey conducted among stakeholders. The Ministry of Forestry and Environment had alsocommissioned a study on the impact on inundation of coastal land arising from sea level rise aspart of the US Country Studies Programme (USCSP).
Sri Lanka is one of the few countries which has a fully operative national Coastal ZoneManagement Plan. The Coast Conservation Department has the full responsibility for theimplementation of the plan. It is therefore necessary that the impacts of sea level rise areaddressed via the Coastal Zone Management Plan.
4.1.3 Impacts due to Sea Level Rise
INUNDATIONThe most direct impact of the rise in sea level is the inundation of areas that have been locatedjust above the water level prior to sea level rise. Low lying coastal settlements and coastalwetlands belong to this category.
(i) Coastal Settlements:Low lying coastal settlements which are highly populated will be directly affected by sea levelrise. Impacts on such land should be assessed in the context of a sea level rise of the orderof 1 m. In assessing the impacts, due consideration should be given to the combinedinfluence of coastal erosion, flooding and storm drainage.
(ii) Coastal Wetlands:Coastal wetlands are generally found at elevations just above mean sea level and below thehighest tide. These wetlands account for a significant proportion of land less than 1m abovesea level. With the rise in sea level marshes have generally kept pace by migrating inland andthis has helped the prevention of wetland loss. However, if marshes are unable to keep pacewith sea level rises, it would lead to a net loss of wetlands. Such losses would be greater ifprotection of developed areas prevents the inland migration and formation of new wetlands.

66
COASTAL EROSIONA rise in sea level would increase the present rates of erosion, thereby resulting in the loss of landand increasing the vulnerability of coastal communities. The country has been experiencing anerosion rate of 0.30–0.35 m per year for 45%-55% of its coastline. Any acceleration of erosiondue to sea level rise will contribute to an increased loss of land, thereby affecting communitiesand economic activities.
The lowering or loss of sandbars due to sea level rise would increase the tidal prism of coastalwater bodies with larger volumes of water entering during the tidal cycle. This would result inthe risk of greater inundation of coastal areas, intrusion of salt water and associatedenvironmental impacts on coastal eco-systems.
Figure 4.1: The Coastal Zone of Sri Lanka as defined by theCoast Conservation Act of 1981.
Estimates of land loss and inundation along the south-west coast of Sri Lanka has been made forthe UNCSP (1998). Table 4.1 provides the estimates of land loss on the south-west coasts of SriLanka resulting from sea level rise.
TABLE 4.1: LAND LOSS OF THE SW COAST OF SRI LANKASea Level Rise Scenario m Land Loss km2
0.301.00
6.011.5

67
Table 4.2 provides estimates of inundation around the lowlands adjacent to coastal wetlands ofthe south-west coast of Sri Lanka.
TABLE 4.2: ESTIMATED AREAS OF INUNDATION AROUND THE LOWLANDS ADJACENT TOMARSHLANDS, LAGOONS AND ESTUARIES OF THE SW COAST OF SRI LANKA
Type of Landforms Adjacent to: Area Inundated km2
Marshlands Lagoons Estuary Sea LevelRise0.3 m
Sea LevelRise1.0 m
GoyyapanaGalle-Magalle
Akurala
Ahungalle
InduruwaBentara GangaPalliyawatta-PinwattaNugape-Bopitiya
Endigastenna
Garanduwa
RatgamaHikkaduwa Ganga
MadampeRandombe Lake
Madu Ganga
Panadura GangaBaire LakeElenegoda
Negombo Lagoon
Gin Ganga*
Kelani Ganga
2.50
0.51.03.02.5
03.51.0
01.0
04.01.54.56.0
03.02.0
12.0
4.01.02.03.55.5
3.254.07.05.00.52.50.56.52.0
12.08.01.04.54.5
23.0Total 41.0 91.25
* ‘Ganga’ means River
FLOODING AND STORM DAMAGEA rise in sea level could affect flooding and storm damage in coastal areas due to two mainreasons. Firstly, higher water levels would provide storm surges with a higher base to build upon.Secondly, higher water levels would decrease natural and artificial drainage; this could also lead topollution of water bodies. It is also recognized that change in climate due to global warmingcould contribute to the reduction of the return periods of storms and floods, thus increasing thefrequency of extreme events. This will cause disasters in which there will be large losses of lives,property and infrastructure. It must be noted that in contrast to coastal erosion, flooding is asudden occurrence leaving very little time for preparation for the disaster. The relevance ofdisaster preparedness should also be given due consideration.
SALT WATER INTRUSIONThe increase in inland penetration of salt water is another major impact of sea level rise. A rise insea level increases the salinity of an estuary by altering the balance between fresh water and saltwater hydraulic regimes. The impact would be widely felt during dry weather conditions withgreater penetration of salt water.
Sea level rise will therefore cause a number of problems such as the penetration of salt water intocultivated areas, increase of saline water in aquifers, migration of fresh water fish and impacts onother habitats causing a breakage in the food chain of certain species. The entry of saline waterto fresh water intakes is also a major problem, which demands engineering interventions.Deepening of estuaries will also increase intrusion and care should be exercised in the planning ofdevelopment work which includes dredging of estuaries.

68
(i) Low Lying Agriculture:The impact of salt water intrusion on low lying agriculture should be given due considerationin analyzing the impacts of sea level rise because the implementation of mitigatory measureswould require a considerable length of time. The loss and degradation of arable lands willsignificantly lower the agricultural output. The introduction of salinity tolerant varieties ofcrops, alternative land use or engineering interventions to maintain the existing regime willrequire investment funding and also time for planning and implementation. It will benecessary to study the impact on existing irrigation structures widely used in low-lyingagricultural schemes.
(ii) Fresh Water Intakes:The prevention of salt water entering fresh water intakes could be achieved by eitherrelocation of the intake or by constructing salt-water barriers. Both options are costly andhence the long-term behaviour of the aquatic system has to be studied prior to planningengineering interventions.
FISHERY INDUSTRYThe fishery industry too would be affected by the impacts of global warming and sea level rise.The level of impact of climate change will vary widely and will also depend on attributes of thespecies. A temperature rise of about 2ºC may have substantial impacts on the distribution,growth and reproduction of fish stocks. Commercially important fish stocks may change theirspawning areas and distribution patterns. A given population within a species is adapted to ahydrodynamic environment of specific temporal and spatial characteristics. Therefore, changesin the ocean circulation may lead to the loss of a certain population or the establishment of newones, particularly at the periphery of the areas of species distribution.
Fishery activities which would be affected include, beach seine fishery, sea ranching in coastalareas, stilt fishery, boat landing sites and fisher folk settlements along the beach. Due attentionshould also be focused on shrimp fishing under coastal aquaculture.
CORAL REEFSRising ocean temperatures will systematically bleach fragile coral reef systems. Oceantemperatures calculated by model projections indicate that thermal tolerances of reef buildingcorals are likely to be exceeded within the next few decades. Increase in ocean temperatures hasimposed a severe stress on coral reefs against their tolerance levels. Damage to coral reefs willdepend very much on whether coral reef systems can adapt with the rate of change of oceantemperature.
SEA DEFENCE STRUCTURES AND BREAKWATERSSea level rise will increase the hydraulic force regime on coast protection and port structures suchas revetments, sea walls and breakwaters. These structures will become vulnerable to the impactsof increased erosion as well as the possible increase in the frequency of extreme events such asstorms and flooding. To maintain their functions efficiently, such structures will have to bereinforced; this is likely to lead to an increase in the maintenance costs. Reinforcement of thestructure may also necessitate an increase in crest levels to withstand the impacts of a higher sealevel.
Sea defence and coast protection plans which form key elements of an overall Coastal ZoneManagement Plan should be based on Policy and Management Options which have taken intoconsideration the impacts of sea level rise. The IPCC has recognized the adaptive responsestrategy classified under three categories namely, Retreat, Accommodation and Protection. Theselection of the appropriate adaptive strategy for a given area will have to be made afterconsidering the economic, social, environmental, legal and institutional implications of each ofthe responses. In order to implement the policy options, various management options areconsidered, provided they are appropriate for the coastal classification. These can be

69
summarized as, Do nothing, Reinstate, Modify and Create. By defining Policy Options andManagement Options for the entire coast, the basis of a strategic approach for achieving longterm stability is established.
NEARSHORE INFRASTRUCTURE
(i) Nearshore Land Based InfrastructureThe impacts of sea level rise should be taken into consideration in the planning ofmaintenance strategies for nearshore land based infrastructure such as highways and railtracks. Due attention should also be focussed on impacts of sea level rise in the planning ofnew infrastructure development projects for urban areas located along the coast.
(ii) Nearshore Land ReclamationIn the recent past, several proposals have been made by both the private and the publicsectors in development projects, to acquire land via reclamation. The marine highwayproject from Colombo to southern parts of the city is such an example. While appreciatingthe need for such projects, the impacts of sea level rise have to be given very highconsideration when preparing development proposals.
TOURIST INDUSTRYLoss of prime land on the shore front has had impacts on the tourist industry, particularly in thecase of beach resorts. A rapid rise in the sea level would therefore inevitably increase the cost ofcoast protection and the generation of beaches at locations where major investments have beenmade in the tourist industry. In the planning of new resorts, depending on the location, thepolicy of ‘retreat’ from the shoreline will have to be given serious considerations as opposed tothe spending of excessive amounts on protection.
4.2 IMPACTS OF TEMPERATURE RISEAnalyses of temperature data over a period of more than 100 years have indicated that the airtemperature over Sri Lanka has shown an increasing trend since the 1960s. This increase whichhas been found to be about 0.016 degrees C per year, is likely to increase in the future. A studywas done in Sri Lanka in 1997 under the US Country Studies Programme, using the fourequilibrium General Circulation Models, viz, CCC, GFDL-R30, UKMO and GISS and onetransient model GFDL 01 using monthly mean temperature data over the period 1961-1990 at 19meteorological stations scattered throughout Sri Lanka. Of these models, only GFDL-R30 andCCC were found to meet two criteria, i.e. how well the model simulates the annual cycle and theapproximate magnitude of the model estimate. The study indicated a significant equilibriumincrease of between 1.4 and 2.7 deg. C in the mean monthly temperature over Sri Lanka, due to adoubling of Carbon Dioxide.
4.2.1 PowerRise in atmospheric temperature results in a higher rate of water evaporation from the hydroreservoirs, thus reducing available reserves for power generation. The limited availability of waterin the reservoirs will require the addressing of complex water management issues in the areas ofpower generation and irrigation in multipurpose reservoirs.
The efficiencies of thermal generation plants, other industrial thermal installations and enginesused in vehicular transport are directly related to the atmospheric temperature. Therefore, anyincrease in atmospheric temperature results in lower plant efficiencies thereby affecting overallefficiency of the plants. Also, with increased atmospheric temperature, the efficiencies of coolingequipment drop affecting all forms of industrial, commercial and domestic sector installationsinvolving a cooling component. Further, there will be an increased demand for air-conditioningand ventilation due to high temperature environment. This in turn increases GHG emissions perunit of energy output.

70
4.2.2 AgricultureHigher temperatures are expected to cause heat waves leading to increased evapotranspiration,depletion of soil moisture, premature desiccation of crops and extinction of economicallyimportant crop types. Increased temperatures will also affect the yields of all crops adverselybeyond certain limits.
High daily temperatures even for a few hours duration could cause pollen sterility in crops suchas rice. It has been shown that Sri Lanka’s rice output will be reduced by 5.91% with atemperature increase of 0.5oC. Increased temperatures are also expected to negatively affect highvalue crops such as vegetables and potatoes.
With increased temperatures, pests and diseases extend their range, e.g. the flour beetle(Tribolium castaneum, Tribolium confusum) and the brown plant hopper (Nilapavata lugens).Their breeding cycles could become shorter with a consequent increase in the frequency andintensity of outbreaks.
4.2.3 HealthIn many work places such as foundries, kilns, textile and tyre industries, thermal stress willimpose an additional strain on the thermo-regulatory system of the body, particularly when thework place itself has been poorly designed. For example, excessive sweating results indehydration and loss of salt from the body. The severity of the impact would depend on the age,state of health/fitness and acclimatization which in turn determines the degree of reduction inwork output, efficiency and overall productivity.
When environmental and metabolic heat gain cannot be counteracted by adequate heat loss,there is elevation of heat storage in the body and an increase in the body temperature to a pointwhere circulatory failure can induce heat collapse or heat stroke, which can be fatal. The degreeof the impact depends on the person’s fitness, clothing worn and the degree of acclimatization.Global warming can only aggravate the above conditions.
Excessive heat can cause disorders such as heat cramps, dehydration, rashes (prickly heat) andheat oedema. Dehydration and electrolyte imbalance over a long term can also predispose tocardio-vascular and renal disorders. The poor, the aged, those involved in outdoor activity,workers in ‘hot’ working environments and pregnant women in the first trimester will facegreater risks.
4.2.4 Transport InfrastructureThe main effects of temperature rise in transport infrastructure are surface flow of asphalt carpetroads, distortion of road markings, bleeding of bitumen in bitumen surfaced roads, making oldroad surfaces brittle and rail creep due to excessive temperature.
4.3 IMPACTS OF DROUGHTSIf the rainfall received in a given district is less than 75% of the normal rainfall, then that districtis said to be affected by a drought. According to a study done in Sri Lanka under a UNDPproject, it has been found that droughts are more frequent during the ‘yala’ (April to August)agricultural season than during the ‘maha’ (September to March) agricultural season. During the‘yala’ season, some of the districts in the Dry Zone of the country experience droughts on anaverage of once in 3 to 4 years, while the other districts in the Dry Zone and the districts in theIntermediate Zone experience droughts once in 5 to 6 years. During the ‘maha’ season, many ofthe districts in the Dry Zone also experience a drought once in 5 to 6 years. Thus areas mostvulnerable to droughts are the districts in the Dry and Intermediate Zones. Within these twozones, the districts of Jaffna, Kilinochchi, Batticoloa, Polonnaruwa, Anuradhapura andKurunegala have the highest probability of experiencing droughts.

71
Some of the droughts are due to El Nino events, the severe drought during the period January toMarch 1983 being a case in point. During this period, about 55% of the land area mostly in theDry and Intermediate zones received less than 10% of the normal rainfall for that period. It islikely that Sri Lanka will experience drought situations even in the future, some of which may bedue to El Nino events. The severity of these droughts, however, cannot be predicted.
4.3.1 Ground and Surface WaterClimate change can affect groundwater and its users essentially in two ways. Firstly, it couldcause a net depletion of the groundwater recharge volumes. Secondly, groundwater resourceslocated in the coastal plains such as the miocene limestone aquifers in the northern dry zonecoastal districts could be subjected to contamination with salinity intrusion.
Since shallow groundwater is slow flowing into surface water bodies, it plays an important role inmaintaining the river flows during dry periods and protecting important environmental areassuch as wetlands and estuaries. Groundwater release helps to limit saline intrusion in the coastalriver mouths, maintain an acceptable surface water quality in the dry zone and contribute tocontinued existence of coastal aquatic ecosystems. Therefore, droughts arising from climatechange will have major impacts on the extent of groundwater release and the resulting increase ofsalinity.
The expansion of rural and urban population leads to a continuously increasing stress on thequantity and quality of water in shallow groundwater aquifers. The impacts of droughtsaggravate the problem by increasing the occurrence of drying up of domestic wells during dryperiods and the deterioration of the quality of water in wells.
Agriculture accounts for a little over 20% of GDP and provides nearly 70% of the ruralemployment. A large proportion of the food grain production is dependent on irrigatedagriculture. Irrigation is the major user of fresh water consuming over 90% of the total annualavailable water. The quantity of water available is strongly linked to the availability of water inthe source catchment. The situation could be aggravated as a result of droughts arising from theimpacts of long term climate change.
4.3.2 PowerThe design of hydropower reservoirs have been carried out using historical data and thereforetend to be heavily under-utilized as a result of possible prolonged droughts resulting from climatechange. Moreover, this will reduce the system power generation capacity affecting its ability toensure a continuous power supply to the country’s population. Prolonged droughts will alsoseriously affect the cooling water supplies to thermal plants forcing a reduction operationalcapacity and introduction of new designs involving cooling towers making these plants moreexpensive to install and operate. Further, irrigation capacity of multipurpose reservoirs alsodrops affecting the agricultural lands.
4.3.3 ForestryDrought could lead to increased fire hazard in forests. Furthermore, under extreme droughtconditions, small plants below 2 years of age could die due to water stress.
4.3.4 AgricultureA large proportion of the food grains production comes from irrigated agriculture. Paddy is themajor food grain grown under irrigation. It is the staple carbohydrate of the Sri Lankans andaccounts for 45% and 40% of the per capita calories and proteins respectively in the Sri Lankadiet. Approximately 740,000 hectares are given over to paddy cultivation and of this 44% isirrigated under major irrigation schemes and another 24% under minor irrigation schemes. Thebulk of this land is in the Dry and Intermediate Zones. In addition to paddy, a variety of grainlegumes and condiments are also grown in the Dry and Intermediate Zones partly underirrigation.

72
Prolonged and more frequent droughts would reduce the availability of water for irrigation andthis in turn could lead to a drop in crop production. It has been predicted that rice cultivation inmajor irrigation schemes based on trans-basin diversion will be substantially affected in verysevere drought years while production in other major and minor irrigation schemes will showsignificant shortfalls with greater frequency than in the past.
A number of Other Field Crops including coarse grains, grain legumes, oil seeds and condimentsare grown on rainfed upland areas in the Dry and Intermediate Zones. It has been predicted thatthe production of these crops will also be adversely affected with severe fluctuations occurring inannual production.
Prolonged droughts will also affect plantation crops such as tea, rubber and coconut and minorexport crops such as cocoa and coffee grown almost exclusively in the Wet and IntermediateZones. These two zones account for almost 100% of the extent under tea, rubber, cocoa andcoffee and 75% of the extent under coconut. Collectively, they account for a little over 700,000hectares of agricultural land in the two zones. Increase in dryness is expected to cause areduction in yields of tea, rubber and coconut due to moisture stress. It is also expected to causea greater annual variation in production of minor export crops.
4.3.5 HealthDuring drought periods, the scarcity of water would affect human health. The scarcity of waterfor drinking, washing and cooking will not only affect the hygiene of the population but it willalso lead to various diseases. The collection of water in rock pools and river beds will help tobreed mosquitoes and this will lead to the spread of vector borne diseases.
The study referred to in section 4.2 on the impact of climate change on the incidence anddistribution of malaria, has shown that, with the anticipated climate change, there will be anexpansion and shifting of the malaria transmission zone to areas that are hitherto free frommalaria. However, the vectorial capacity for malaria in the dry zone has been shown to be smalland insignificant. According to the CCC model used in the study, the seasonal pattern of malariatransmission is likely to undergo a change, from the high transmission season which now occursfrom November to February being curtailed, and the minor mid-year peak being enhanced withhigh rates of transmission occurring in September. The study has also shown that spatially, areasbordering the non-endemic wet zone of the country would very likely become highly vulnerableto malaria, with other areas being less vulnerable.
4.3.6 Transport InfrastructureDroughts could lead to a lack of suitable water for regular road construction and maintenancewithin reasonable distances, destruction of turf on road embankments and cracking of roadpavements with poor sub grade.
4.4 IMPACTS OF HIGH INTENSITY RAINFALLCyclones, depressions, mid-tropospheric circulations, monsoonal rains and severe thunderstormscause high intensity rainfall over Sri Lanka. Although cyclones do not occur frequently (only 13cyclones have crossed Sri Lanka during the period 1901-1999), the other weather systems arecommon. High intensity rainfalls can occur at any place in the island during different months.Records indicate that the highest 24-hour rainfalls have occurred mostly during the months ofOctober, November and December (Table 4.3).
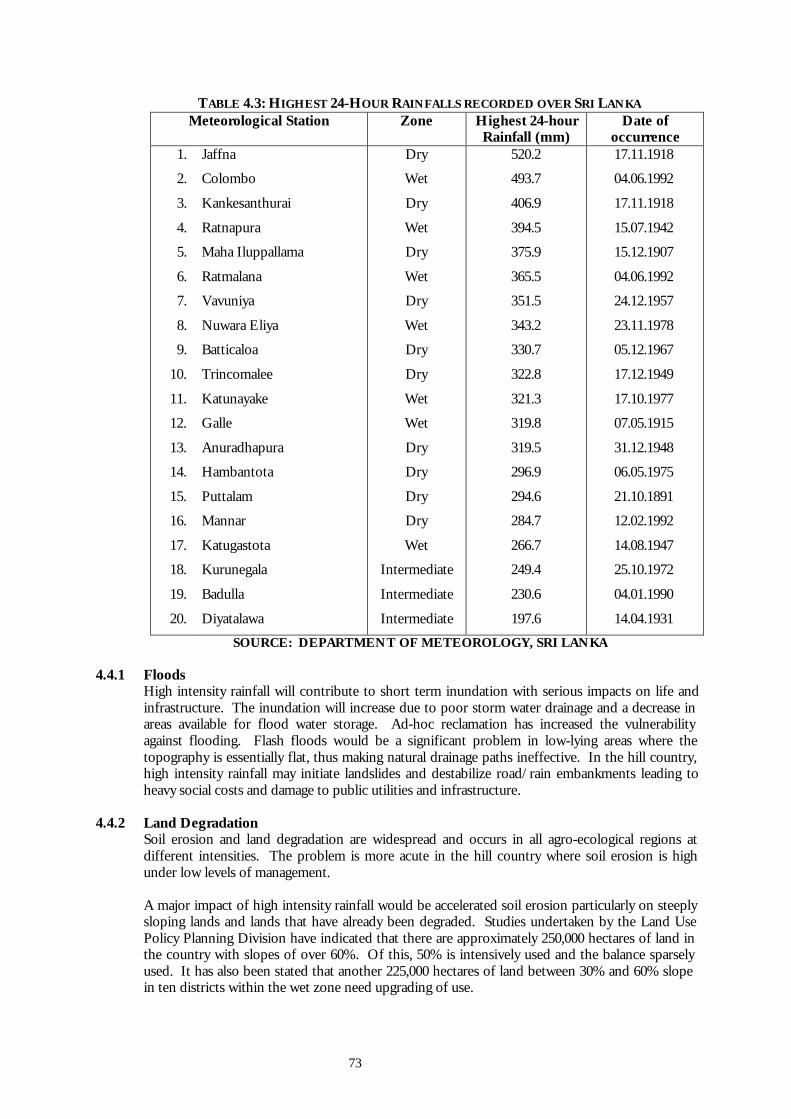
73
TABLE 4.3: HIGHEST 24-HOUR RAINFALLS RECORDED OVER SRI LANKAMeteorological Station Zone Highest 24-hour
Rainfall (mm)Date of
occurrence1.
2.
3.
4.
5.
6.
7.
8.
9.
10.
11.
12.
13.
14.
15.
16.
17.
18.
19.
20.
Jaffna
Colombo
Kankesanthurai
Ratnapura
Maha Iluppallama
Ratmalana
Vavuniya
Nuwara Eliya
Batticaloa
Trincomalee
Katunayake
Galle
Anuradhapura
Hambantota
Puttalam
Mannar
Katugastota
Kurunegala
Badulla
Diyatalawa
Dry
Wet
Dry
Wet
Dry
Wet
Dry
Wet
Dry
Dry
Wet
Wet
Dry
Dry
Dry
Dry
Wet
Intermediate
Intermediate
Intermediate
520.2
493.7
406.9
394.5
375.9
365.5
351.5
343.2
330.7
322.8
321.3
319.8
319.5
296.9
294.6
284.7
266.7
249.4
230.6
197.6
17.11.1918
04.06.1992
17.11.1918
15.07.1942
15.12.1907
04.06.1992
24.12.1957
23.11.1978
05.12.1967
17.12.1949
17.10.1977
07.05.1915
31.12.1948
06.05.1975
21.10.1891
12.02.1992
14.08.1947
25.10.1972
04.01.1990
14.04.1931
SOURCE: DEPARTMENT OF METEOROLOGY, SRI LANKA
4.4.1 FloodsHigh intensity rainfall will contribute to short term inundation with serious impacts on life andinfrastructure. The inundation will increase due to poor storm water drainage and a decrease inareas available for flood water storage. Ad-hoc reclamation has increased the vulnerabilityagainst flooding. Flash floods would be a significant problem in low-lying areas where thetopography is essentially flat, thus making natural drainage paths ineffective. In the hill country,high intensity rainfall may initiate landslides and destabilize road/rain embankments leading toheavy social costs and damage to public utilities and infrastructure.
4.4.2 Land DegradationSoil erosion and land degradation are widespread and occurs in all agro-ecological regions atdifferent intensities. The problem is more acute in the hill country where soil erosion is highunder low levels of management.
A major impact of high intensity rainfall would be accelerated soil erosion particularly on steeplysloping lands and lands that have already been degraded. Studies undertaken by the Land UsePolicy Planning Division have indicated that there are approximately 250,000 hectares of land inthe country with slopes of over 60%. Of this, 50% is intensively used and the balance sparselyused. It has also been stated that another 225,000 hectares of land between 30% and 60% slopein ten districts within the wet zone need upgrading of use.

74
High intensity rainfall may provoke landslides and erode road/rail embankments leading to heavysocial costs and physical damage to infrastructure and public utilities such as water-supply lines,electricity/telecommunication cables and storm water drains. Available evidence suggests thatthe frequency and magnitude of landslides is already on the increase. Prior to 1980, there wereonly 34 known landslides in Sri Lanka. Between 1980 and 1991, the number of known landslideshad increased to 171. According to the data available with the National Building ResearchOrganization, approximately 12,500 hectares of land in the hill country are vulnerable tolandslides.
4.4.3 AgricultureIncreased cloud cover and precipitation could decrease yields of many corps. In the case of C4plants, e.g. Sugar cane, maize, sorghum, which yield well with high light intensities, there will be areduction in yield but the reduction will be comparatively low. In the case of C3 plants, e.g. Rice,legumes and vegetables, where the yields are lower than C4 plants, the reduction in yields can besignificant.
4.4.4 HealthHigh intensity rainfall will affect human health indirectly by damaging structures and houses, andby inundating roads and compounds. At the same time, waterways and wells could get pollutedleading to an increase in bowel diseases such as diarrhoea, typhoid and dysentery. Denguemosquitoes will breed in collections of clear water leading to an increase in the incidence ofdengue hemorrhagic fever.
4.4.5 Transport InfrastructureThe major effects include severe negative impact on road surface maintenance, inundation of lowline road sections due to flooding, inadequate roadside drainage, landslides and rockslides in hillyterrain, erosion of road sides, railway track and gravel and earth roads.
4.4.6 PowerLong term high intensity rainfall is likely to affect the reservoir structures designed for historicalrainfall patterns. This will also result in more frequent unexpected heavy downstream waterflows due to water regulation in the reservoirs, exposing the population to dangers of flooding.
4.5 IMPACTS OF INCREASED THUNDER ACTIVITYAnalysis of data on the occurrence of thunder activity has shown that there has been anincreasing trend in thunder activity in the recent past, particularly during the intermonsoonmonths of March, April, October and November. This analysis has also revealed a positivecorrelation between thunder activity and air temperature, implying that there is likely to be anincrease in thunder activity in the near future.
4.5.1. InfrastructureIncreased thunder activity results in more frequent damages to infrastructure particularly thoseinvolving power, telecommunication and other industrial installations.
4.5.2 HeathSince lightning strikes cause deaths to human beings and animals and leads to property losses,this increase is likely to result in more deaths and injuries. In fact, a recent study has revealedthat damages to property and loss of life by lightning strikes are on the increase. However, thewider health implications, if any, of this climatic effect is yet to be determined.
75
4.6 IMPACTS OF CLIMATE CHANGE ON HUMAN SETTLEMENTSHuman settlements are distributed throughout the island except in protected areas such as forestreserves and wildlife reserves. The impacts of climate change on these settlements are estimatedto be high.
All natural hazards prevalent in the country, i.e. coastal erosion, coastal inundation and salinityintrusion; floods, erosion and landslides; storms, cyclones, droughts, high winds and lightning;and forest fires are likely to be aggravated by expected climatic changes. These in turn will haveadverse effects on human settlements.
Human settlements in the island fall into five broad classes according to their level ofvulnerability.
a) Settlements located within the 1.m Mean Sea Level contour and settlements encroaching on50 and 100 year flood plains. These include substantial areas of squatter settlements and lowincome housing.
b) Settlements on or including landslide prone areas and settlements on steep erodible slopes.They too include substantial squatter settlements and low income housing.
c) Settlements in cyclone prone areas; settlements in drought prone areas, and settlementsdependent on subsistence-type rainfed agriculture and on commercial fishing.
d) Settlements in or close to forest fire prone areas and settlements in storm, lightning andstrong wind prone areas.
e) Settlements under irrigation schemes.
Further assessment and mapping in suitable detail will have to be undertaken in order todetermine the vulnerability of human settlements.
76
CHAPTER 5
MITIGATION OPTIONS AND ADAPTATION RESPONSES
INTRODUCTIONSri Lanka’s response strategy to anticipated climate change includes the implementation of bothmitigation and adaptation measures.
The country’s contribution to the emission of green house gases is considered negligible. Even so, everyeffort has to be made to maximize the country’s potential contribution towards controlling the amount ofgases being emitted to the atmosphere. The mitigation options available in the major sectors of thenational economy are listed in Section 5.1.
Adaptation measures are required to address the potential impacts of climate change. A few measureshave already been adopted in some sectors such as agriculture and energy, to promote betterenvironmental management. In the agricultural sector, programmes have been developed to control soilerosion, encourage conservation farming and agro-forestry, promote better water management anddiversify agricultural production while in the energy sector, efforts have been made to increase energyefficiency, reduce energy costs and associated environmental pollution and examine available GHGmitigation options. These programmes can be strengthened and extended to include elements that couldaddress some of the impacts of anticipated climatic changes. Further action is required to address otherimpacts. The action proposed for each of the sectors is given in Section 5.2.
5.1 MITIGATION OPTIONS
5.1.1 Energy SectorEmissions from the energy sector are not significant at present. However, due to the rapidexpansion, this sector’s contribution to GHG emissions will be more significant in the future.This is particularly noticeable in the electricity generation sub-sector which has been expandingits fossil fuel based thermal generation capacity in recent times.
Certain studies and projects have been carried out in the past in the energy sector, directly orindirectly addressing impacts of climate change. They are:
v Study on GHG mitigation options in the sub-sectors of electricity generation, biomass andsmall and medium scale industries funded by the Swedish International DevelopmentAgency (SIDA) through Asian Institute of Technology (AIT), Bangkok and Sri LankaEnergy Managers Association.
v Demand Side Management Project of the Ceylon Electricity Board (CEB) funded throughEnergy Services Delivery Project of the World Bank.
v Transmission Loss Reduction Program of the CEB.
v Sri Lanka Power Technology Assessment Study carried out by International Developmentand Energy Associates Limited.
v Global Overlay Study on GHG mitigation options in the Sri Lanka power sector carried outby the Environment Department of the World Bank.
Further, there have been many other small-scale projects and studies carried out, particularly inenergy conservation, addressing climate change issues.

77
The options available for Sri Lanka in mitigating GHG emissions in the energy sector are asfollows:
v Fuel switching: Replace existing (or planned) use of fossil fuel with low GHG emitting fuels inelectricity generation and in the industrial, commercial and household sectors.
v Use of energy efficient technologies: Use new technologies such as efficient combined cycle plants,combined heat and power systems, efficient lighting and air-conditioning systems with higheroverall energy efficiency to replace the existing less efficient systems and in developing newsystems.
v Loss reduction: The average energy losses in Sri Lanka power system is around 17%. It is alsoestimated that older generation plants in this region consume 18%-44% more fuel comparedto their counterparts in OECD countries. Adoption of loss reduction measures atgeneration, transmission and distribution levels would reduce GHG emissions per unit ofenergy consumed.
v Renewable energy systems: Promote renewable energy technologies in place of fossil fuel firedplants wherever they are technologically and economically feasible.
v Energy plantations: Encourage commercial fuelwood plantations.
v Pricing: Incorporate environmental and social impact mitigation costs in pricing of electricitygenerated with different technologies. Petroleum products should also be priced at their truecosts considering environmental and social costs/benefits.
v Energy conservation: Encourage energy conservation through consumer education in industrial,commercial and domestic sectors.
v Propagate biogas technologies such as those developed by the National EngineeringResearch and Development Centre (NERD).
5.1.2 Industrial SectorIn Sri Lanka, the industrial sector is one of the major consumers of energy in different formssuch as electricity, petroleum and biomass. Therefore, adoption of any mitigation measureswithin the industrial sector such as those given below will have a significant effect in GHGreductions in the country.
v Industrial policy: Whenever possible, encourage ‘soft industries’ with a relatively low specificenergy consumption. Also locate new industries in industrial estates where feasible.
v Emissions: Develop and enforce emission standards related to GHGs in the industrial sector.
v Energy efficiency: Adopt energy efficient building codes and the standardization and labelling ofenergy consuming end use equipment. Encourage the manufacturing sector to replace highenergy consuming equipment with modern energy efficient devices.
v Pollution control: Promote proper solid waste management with methane recovery.
v Revive the programme to manufacture charcoal from wood left after harvesting timberinstead of burning on site.
v Enhance productivity in the industrial sector.

78
5.1.3 Transport SectorMuch of the petroleum consumed in Sri Lanka is in the transport sector where the use of otherforms of energy is insignificant. As a result, it is a major contributor to GHG emissions. Recenttrends in fuel switching from gasoline to L.P.G. in motor cars due to financial benefits hasalready helped to reduce GHG emissions in this sector. The mitigation measures given belowcan be adopted to reduce the contribution.
v Enforce and monitor emission standards for motor vehicles.
v Promote inter-modal transport.
v Introduce traffic management measures to minimize private and low occupancy vehicles.
v Encourage the use of railways through financial incentives.
v Offer financial and other incentives aimed at greater use of public transport systems.
5.1.4 Agricultural SectorAgriculture is an important source of carbon dioxide, methane and nitrous oxide. Net emissionscould be reduced by changing the current land uses on marginal agricultural lands and byadopting better management practices on lands given over to crop production and livestockfarming. Some of the options available are listed below:
v Establish forests or any other vegetation (perennials and grass) on degraded or non-forestedlands.
v Promote mixed cropping and agro-forestry instead of monoculture wherever possible.
v Cut down methane emissions from livestock with new feed mixtures.
v Introduce changes in irrigation and fertilizer use to reduce methane emissions from wet ricecultivation.
v Minimize nitrous oxide emissions from agriculture with new fertilizers and practices.
v Alter breeding criteria for crop varieties with high carbon dioxide sequestration.
5.1.5 Forestry Sectorv Establish forests on degraded or non-forested lands so that carbon could be stored in trees
and soils.
v Use fast-growing fuelwood in place of coal or oil to preserve the carbon reservoir containedin fossil fuels.
5.2 ADAPTATION RESPONSES
5.2.1 Proposed Action for the Coastal ZoneSea level rise which is one of the more certain responses arising from global warming willmanifest over long time scales. Comprehensive analyses on the rate of sea level rise have beencarried out and the best estimates are that by the year 2100, the rise will range from 0.31 to 1.10m, with the most likely rise being 0.66 m. Although the magnitude of future sea level rise isuncertain, knowing the order of magnitude of the likely increase and the fact that it will rise inresponse to global warming will certainly assist in planning response strategies. A primaryrequirement in conducting impact and adaptation assessment is the availability of reliable data

79
and most recent information on assets and activities at risk in the coastal zone. It is in thiscontext that the proposed actions for the coastal zone are recommended.
a) Assessment of Vulnerability and Overall ManagementØ Prepare contour maps at suitable resolution (at least 0.5m contour interval)Ø Identify human population, natural resources, infrastructure and assets in the coastal
zoneØ Assess vulnerability to sea level rise along the coastal area of the country and estimate
the economic cost of climate vulnerabilityØ Delineate critical areas and prepare special area management plansØ Monitor meteorological parameters in all coastal districtsØ Formulate coastal database for implementing integrated coastal area managementØ Incorporate greater consideration of climate change impacts in the next revision of the
Coastal Zone Management Plan (CZMP)
b) InundationØ Incorporate climate change concerns in wetland conservation programmes
c) Salt Water IntrusionØ Evaluate engineering interventions needed to counter threat
d) Fresh Water IntakesØ Review the performance of existing intakes taking sea level rise into accountØ Design new water intakes giving due consideration to climate change impacts
e) Fishery IndustryØ Conduct sectoral assessment on climate change impacts on fishery development
including fishery harbours, fishery settlements and sustainable use of fishery resource asa basis for long term planning
f) Sea Defence Structure and Nearshore InfrastructureØ Assess vulnerability and prepare emergency response/contingency plansØ Accommodate sea level rise in the design of new coastal structures
g) Nearshore Land ReclamationØ Screen nearshore reclamation against sea level rise impacts
h) TourismØ Prepare set back limits to take account of sea level riseØ Formulate tourism development guidelines to highlight for investors the potential
problems arising from climate changeØ Update/revise Master Plan on tourism to incorporate climate change concerns
5.2.2 Proposed Action for the Transport SectorTransport infrastructure is highly vulnerable to climate change impacts such as sea level rise,droughts and high-intensity rain particularly because Sri Lanka has a considerable length of themajor road and railway network along the coast and in low-lying areas. Therefore, transportsector requires an adaptation measure such as:
v Improved road/railway infrastructure design standards to incorporate climate changeconsiderations

80
5.2.3 Proposed Action for the Agriculture SectorThe climate change that is envisaged will have adverse impacts on agriculture. Since agriculture isthe main source of livelihood for the majority of the rural population in the country, strategiesare required to make the sector less vulnerable to the environment. Some of the possibleresource strategies are given below:
a) ProductivityØ Increase agricultural productivity by introducing improved varieties and improved
management practicesØ Increase productivity in the plantation and minor export crop sectors, and diversify
agricultural production and the food habits of the people
b) Cropping SystemsØ Change cropping patterns to offset any unpredicted weather changes by developing tree-
crop agriculture in the Dry Zone; promote conservation farming techniques in areasvulnerable to soil erosion; develop tree-crop agriculture on degraded agricultural landsand promote agro-forestry on lands over 60% slope
Ø Develop drought resistant rice varieties with high yields
c) Water ManagementØ Introduce better water management by strengthening the institutional base to manage
water resources economically and increase the efficiency of irrigation by adoptingsprinkler irrigation methods and drip irrigation systems
Ø Introduce and promote water harvesting techniques
d) Land UseØ Change land use patterns in landslide prone areas and other vulnerable areas and
discourage settlement in such areasØ Initiate land use planning to ensure the proper utilization of land
e) AwarenessØ Make farmers aware of climate change and instruct them in ways of adapting to it.
Special attention should be focused on the poorer sections of the farming populationbecause of their greater vulnerability to climate change impacts
5.2.4 Proposed Action for the Forestry SectorIn evaluating the impacts of climate change on forests, it is important that the manner in whichforests will respond to such change should be considered in parallel with a range of processesaffecting different parts of the total forest eco-systems. This will include responses to flora andfauna at micro level to major changes in the distribution of species over short and long-term timescales. It is by examining the integrated effects of such interrelated aspects that a meaningfulassessment could be carried out on the impacts of climate change in forests.
v Identify vulnerable areas and prepare contingency plans
v Promote use of alternative traditional timber species, e.g., rubber
v Assess vulnerability of coastal vegetation/mangroves and other ecologically critical areas andevaluate response strategies
v Promote use of alternative materials like plastic, fibre glass and steel
v Ensure conservation of natural forests and ban the clearing of natural forests for commercialpurposes

81
v Take steps to minimize deforestation
v Promote urban forestry to establish vegetation in urban and metropolitan areas
5.2.5 Proposed Action for Water Resources SectorIn developing adaptation strategies for water resources affected by the impacts of climate change,it is recognized that climate change could both decrease and increase the water resources. Hencethe need to plan adaptation strategies for both drought and flood scenarios. Within thisframework, attention should be focussed on both the impacts of climate change on the resources(supply) and demand (water uses). The vulnerability of the country could only be properlyassessed by examining supply and demand for water arising from global warming. Once a clearunderstanding on vulnerability is achieved, alternative adaptation strategies for climate changeimpacts can be developed. It is in this context that the proposed action for the water resourcessector is recommended.
a) Rainfed Water SupplyØ Encourage minor storage reservoirsØ Make allowance for re-distribution of population with respect to climate change impacts
in land use planningØ Investigate feasibility of trans-basin diversion schemes to counter climate change impactsØ Conserve in-situ seasonal water bodies having valuable biological resources
b) Storage/Diversion Water SupplyØ Rehabilitate irrigation water tank networks in dry and intermediate zonesØ Promote participatory micro-watershed management
c) GroundwaterØ Prepare groundwater extraction regulation policyØ Introduce permit/monitoring systems for groundwater extraction and water quality
assessment in vulnerable areas
5.2.6 Proposed Action for Health SectorImpacts of climate change on human health could be categorized as direct and indirect. Thedirect effects result from changes in climate characteristics or short-term weather extremes thatimpinge directly on human biology. The indirect effects are those that do not entail a directcausal connection between a climatic factor (such as heat, humidity, or extreme weather event)and human biology.
A number of adaptation measures are possible to reduce the impacts of climate change onhuman health. Some of these are given below.
One of the important adaptation measures in the health sector is the creation of awarenessamong the people in all aspects of human health affected by climate change, e.g. health risks dueto natural disasters, heat related illnesses, health effects of exposure to UV-B light, precautions tobe taken during the occurrence of lightning and thunder, spread of infectious diseases, etc.
a) GeneralØ Prepare baseline maps of disaster risk areas for specific extreme weather eventsØ Develop early warning systems (using, for instance, GIS techniques) for monitoring of
natural disastersØ Develop institutional facilities and provide the necessary financial inputs for the
implementation of Natural Disaster Management PlansØ Upgrade health facilities in vulnerable areas, especially remote areas with difficult terrain
and limited transport

82
Ø Formulate and enforce regulations to building design (public/private, households) towithstand/minimize structural damage and injury to people
Ø Motivate people to accept and heed to safety measures at individual household level byproviding (a) free engineering/architectural advice and consultations and (b) soft loansfor alterations to dwellings
Ø Establish database on health facilities at provincial level
b) Heat Stress, Heat Related Illnesses and DisordersØ Establish local standards for ‘hot’ working environments and enact laws for effective
enforcement of such safety standardsØ Encourage house/work place designs to suit hot climate; well-ventilated, good air
circulation, less glass and if cost permitting, fans and air-conditioners.Ø Create zones with shade trees, parks and fountains, etc., in urban areas.
c) Health Effects of UV-B LightØ Monitor indices of ill health, e.g. cataract, pterygium, keratitis, skin malignancies at
sentinel and control locations. Identify any shifts in age group pattern especially forincidence of cataract
Ø Promote the use of antioxidants in diet, e.g. vitamin A and vitamin CØ Promote wearing of wide brimmed hats outdoors and sunglasses conforming to effective
light filter standardsØ Promote use of sunscreen applications and limit outdoor behaviour to direct exposure to
sun in light skinned individuals
d) Spread of Infectious DiseasesØ Establish RS/GIS information systems in areas prone to outbreaks/epidemicsØ Develop baseline maps with local epidemiological information for specific diseasesØ Develop epidemiological forecasting/early warning systems using ranges of criteria
relevant to each diseaseØ Upgrade health manpower resources and facilities in high-risk areas to meet increased
needs in curative/preventive actions and control of diseaseØ Monitor specific disease patterns at Health Care Centres in sentinel stations where
climate change predictions are significantØ Upgrade safe drinking water and sanitation facilities in the rural sector
e) Food Shortage and Nutritional DisordersØ Monitor the growth of pre-school children at sentinel stationsØ Educate people on low-cost nutritive foods which are being promoted for cultivationØ Promote dietary supplementation of high risk groups such as pregnant mothers, infants,
pre-school children and the elderly
5.2.7 Proposed Action for Human Settlement and Public Utilities SectorImpacts of climate change on human settlements and public utilities may be direct as well asindirect. The direct effects could be due to sea level rise and extreme events in the case offloods, droughts, cyclones and landslides. The indirect effects could be impacts on other sectorssuch as agriculture, water resources, health, etc. Several adaptive mechanisms are suggested toaddress these effects.
a) GeneralØ Develop and establish RS/GIS/early warning systems in vulnerable areasØ Integrate suitable adaptation measures into all urban development plansØ Prepare and update national disaster management plan with adequate coverage on
climate changeØ Integrate climate change concerns/responses in relevant national policiesØ Relocate people from vulnerable locations

83
Ø Develop storm, wind and cyclone resistant building standards and guidelines fordifferent building categories
b) FloodsØ Conduct flood plain mapping for different return periods and delineate flood plains for
conservationØ Take steps to conserve natural drainage network including depression storage areas in all
areas of the countryØ Formulate “climate change coefficient” for estimation of flood and drainage design.
c) Droughts/CyclonesØ Develop early warning systems and prepare emergency response/contingency plans for
vulnerable areas
d) LandslidesØ Undertake hazard area mappingØ Take steps to conserve natural drainage networks at macro and micro levelsØ Introduce vegetative silt traps to reduce siltation of water courses
The adaptation responses proposed above need to be prioritized because of the limitedavailability of resources. The prioritization will have to be made on the basis of more detailedassessments of the physical and economic impacts of climate change; the cost of the adaptationmeasures to alleviate these impacts and the availability of resources to implement them.

84
CHAPTER 6
POLICIES AND MEASURES
6.0 POLICIES AND MEASURESPolicy recommendations and adaptation measures must be based on sectoral climate changestudies and long term research, which would provide a scientific basis for decision making. Thepolicy recommendations will have to focus on two aspects; reduction of emissions andmechanisms to mitigate impacts. However, there may be a certain amount of risk involved ininvesting in this regard. The measures adopted therefore should be “no regrets” options. Thismeans that they will produce benefits even if climate change problems do not occur. Thesemeasures suggested fall into this category. They are activities that have been identified as nationalpriorities and in any event need to be carried out for the development of the country in generaland the sustainable management of resources in particular.
6.1 GENERAL RECOMMENDATIONSTaking into account the possible impacts of climate change on the different sectors discussedearlier, some strategies that would increase resilience to climate change and reduce its overallimpact are listed below:
v Protect arable soil: The country’s food production depends largely on the land productivity.At present the country is faced with a severe problem of soil erosion and associated landdegradation. This threatens the ability to produce adequate food and therefore needsimmediate attention.
v Improve water management: An effective water management system should be in place toreduce floods and also to improve water efficiency during periods of drought.
v Enhance agro-technology: New agricultural technologies based on applied research mustbe adopted in order to provide food for the growing population, especially in the face ofadverse climatic events and long term climate changes.
v Formulate land use policies: Land use policies should be prepared particularly for coastalareas. In preparing these policies, stakeholder participation is vital.
v Maintain food reserves: Food stocks should be built up to be used in times of need.
v Provide emergency disaster relief: Emergency aid should be readily available in times ofdisaster.
v Enforce policies: Implementation of policies containing provisions pertaining to climatechange impacts should be given high priority. .
6.2 SPECIFIC RECOMMENDATIONS
6.2.1 Agriculture
(i) Revision of Agriculture Policy:There is a need for revising the existing Agriculture Policy taking into account the climatechange impacts. These need to be strongly addressed and an action plan prepared forimplementing the policy. Particular attention should be placed on breeding for highdrought/pest/and disease resistant varieties and the development of measures for soil andwater conservation. It is also essential that adequate funds are provided for conducting ofresearch to address the impacts of climate change on agriculture.

85
(ii) National Land Resources Management Policy & Plan:In view of the proposed action to increase agricultural productivity by changing croppingpatterns, improved water management and better land management, it is clear, that thebottom line is the need for a cohesive National Land Resources Management Policy andPlan. The objectives of the land resources policy would be to allocate land rationallyamongst competing users, based on physical suitability and social, economic andenvironmental implications. Under the management plan, land will be allocated based on thesuitability of the land for a particular use. For example, in agriculture, this will ensure thatcrop distribution will be determined by the suitability of land. This will lead to an increasedoutput per hectare.
The land resources management plan will also ensure that the misuse of land will beminimized and that each parcel of land will be put to the highest and best use. Themanagement plan will also bring about a more efficient management of lands given over tocrop production and livestock.
6.2.2 Energy, Transport and Industry
ENERGYThe Energy Policy of Sri Lanka covers aspects relating to energy efficiency in terms of fuelswitching to improve technologies. The policy should place greater emphasis on the promotionof renewable energy, including biomass thereby decreasing the dependency on fossil fuels.
(i) Cost-reflective Pricing:A cost-reflective pricing policy should be formulated for the entire energy sector to representthe true cost of production, taking into account environmental impacts and mitigation costs.At present most of the energy sources are subsidized, due to social considerations. Thesubsidies on fuel for example are enjoyed by all. On the other hand, electricity is alsosubsidized, but has different costing for households, commercial establishments and forindustries, with the households getting a better subsidy. In a developing country like SriLanka, marginal social-cost-based pricing would be more appropriate. However, the decisionas to which is better will have to be made based on further studies.
It is proposed that such economic studies be carried out before the preparation of thesecond communication.
(ii) Financial Incentives/Disincentives:Provide rational financial incentives for environmentally benign technologies and practices.Incentives should also be provided for replacing existing use of fossil fuel in electricitygeneration, with low GHG emitting fuels.
TRANSPORTAlthough the existing transport policy does not directly address the climate change issues,nevertheless it includes elements that would contribute to a reduction of emissions in a direct andindirect manner. An important policy recommendation is the improvement of mass publictransport systems. This recommendation should be implemented so that the inefficient use ofpersonal transport systems can be reduced.
INDUSTRY(i) Revision of Current Environment Protection Licences (EPLs):
The guidelines used in granting EPLs should be reviewed. EPLs should be granted based onapplicable emission standards for selected GHGs.
(ii) Encouragement of Soft Industries:The industrial policy should give prominence to encouraging soft industries, which consumeslesser energy wherever it is appropriate.

86
(iii) Institutional and Legal Reforms:In order to effectively implement policy decisions aimed at reducing emissions, institutionaland legal reforms in the energy, transport and industrial sectors will have to take place. Suchreforms will improve the operational efficiency and productivity in these sectors. Thenecessary framework for monitoring the policy changes should also be in place.
6.2.3 Coastal Zone and Marine Resources
Implementation of Coastal Zone Management Plan (CZMP):The CZMP addresses the current threats to the coastal areas and coastal resources. Thesethreats are bound to become greater due to climate change impacts. The plan should berevised taking into consideration the potential impacts.
6.2.4 Forestry
Implementation of the National Forestry Policy (NFP) and the Forestry Master Plan (FMP):The main objectives of the National Forestry Policy of 1995 are:
a) Conserving forests for posterity, with particular emphasis to bio-diversity, soils, waterand historical, cultural, religious values;
b) To increase the tree cover and productivity of forests to meet the needs of present andfuture generations; and
c) To enhance the contribution of forestry to the welfare of the rural people.
An important policy objective is the effective management of state forest resources. Thiswill be done by bringing all state forests under sustainable management both in terms of thecontinued existence of important ecosystems and the flow of forest products and services; byallocating the natural forests firstly for conservation, and secondly for regulated multiple-useproduction forestry, by rehabilitating degraded forest for conservation and multiple-useproduction, where it is economically and technically feasible, mainly for the benefit of localpeople, by ensuring that the planned conversion of forests into other land uses can take placeonly in accordance with procedures defined in legislation and with accepted conservation andscientific norms, and by promoting tree growing by local people, rural communities, NGOsand other non-state sector bodies for the purpose of environmentally sensitive areas.
6.2.5 Water Resources
(i) Preparation of Water Management Plan:The draft water policy emphasizes the efficient use of water. However, it is important thatthe plan takes into account climate change impacts. Since the sources of water have to beprotected, the plan should also pay attention to the protection of the upper watersheds in thecountry. The Water Resources Management Plan would any case have benefits beyondclimate change mitigation.
(ii) Ground Water Extraction Regulation Policy:The indiscriminate exploration of ground water in the Dry zone and the Intermediate zone iscausing concern. The availability of water has not been assessed. This has to be done. Inthe meantime, a policy should be in place to regulate and monitor the construction oftube/agriculture wells in the Dry zone and in the Intermediate zone.

87
6.2.6 Health and Settlements
(i) Implementation of Disaster Management Action Plans:The Presidential Task Force for Preparing a National Programme on Human DisasterManagement has submitted their report which is presently under discussion. Theprogramme should be implemented by preparing Action Plans. The action plan dealing withnatural and manmade disasters should take into account the possible impacts of climatechange. Data from the Department of Meteorology and other relevant institutions should beused in the preparation of the plans.
(ii) Preparing Land Use Plans:Land Use Plans should identify vulnerable areas and allocate those areas for forestry. Areasfor flood plain conservation and areas suitable for settlements should also be identified in theplans.
(iii) Establishing Disaster Management Centres:Disaster Management Centres in sensitive areas for dealing with emergencies includinglandslides, flash floods, etc., should be established.
(iv) Implementation of Action Plan on Waste Management:A Solid Waste Management Strategy has been approved and an action plan for implementingthe strategy is being prepared. The action plan should take into account the health issuesrelating to climate change and recommend action that will deal with management of waste(both industrial and household), including recycling or use of such waste in an economicallyviable manner to minimize emissions from unscientific land fills and reduce possible healthhazards. A co-ordinated effort is required in implementing the programme.
(v) Re-focus Health Policy and Specialized Health Programmes:The Health Ministry has well organized programmes for the prevention of Malaria,respiratory diseases, etc. The malaria control programme being implemented under theNational Malaria Control Policy is aimed at the reduction, elimination and prevention ofmalaria. The programmes implemented will have to take into account possible outbreaks ofepidemics due to climate changes and adopt measures that would prevent or control suchepidemics.
(vi) Air Quality Management:Maintenance of good air quality is the objective of the National Policy on Air QualityManagement. The national policy on air pollution abatement focuses mainly on VehicleInspection and Maintenance, Fuel Reformulation, Pricing and Fleet Mix, EmissionInventory, Monitoring and Reduction, Standard Setting, Institutional Framework andRegulatory Compliance, Economic Instruments, Transport Planning and TrafficManagement and Public Awareness.
The Clean Air 2000 Action Plan for Air Quality Management in the Colombo MetropolitanArea was prepared in late 1992 recognizing the growing problem of air pollution in theColombo Metropolitan area. This Action Plan was prepared in consultation with Ministriesand Agencies whose activities influence air quality and has been considered by the NationalEnvironmental Steering Committee. The Plan combines policy and strategic measures thatwere to be introduced to the overall policy making framework. This is the first real attemptto reduce automotive air pollution in Colombo Metropolitan area. It is expected to stimulatefuture multi-lateral investment initiatives in the areas of energy conservation.

88
6.3 FURTHER ISSUES TO BE CONSIDEREDIt is evident that there are several policies that are capable of dealing with some of the climatechange issues. The implementation of these policies could help to reduce the impacts of climatechange. However, they should not be implemented in isolation to each other because they areclosely connected.
The strengthening of the existing policies will not be adequate to handle all of the impacts ofclimate change. They have to be supported by formulating policies in areas where there arepolicy gaps. Some issues that will have to be considered when strengthening existing policies andpreparing new policies are given below:
v The need for building up a database: The available data has not been sufficiently collatedand analyzed. This has to be done as a matter of priority. At the same time the data gapshave to be identified early and steps taken to fill the gaps.
v The need to provide incentives/disincentives: Based on the experiences of othercountries, it is clear that some of the most innovative experiences in climate changemitigation have come in the form of new incentive and disincentive mechanisms toencourage reliance on renewable energy and co-generation. Hence appropriate financialincentives and disincentives need to be worked out. Innovative policies can spur rapidadoption of new technologies, leading to sharp declines in the combustion of fossil fuels. Itis evident that among the policies adopted so far, the removal of energy subsidies has had thegreatest short-term impact leading to a stringent adaptation of Demand Side ManagementMeasures.
v The need to consider the cost-effectiveness of policies: The policies need to be reviewedin terms of cost-effectiveness taking into account the socio-economic impacts as well. In thecase of health, for example, there are two levels of prevention, which can be adopted, i.e.primary and secondary. Primary prevention consists of those measures that reduce orprevent the risk of developing the disease. Secondary prevention involves the detection andtreatment of a disease at a stage early enough to prevent serious clinical illness. Primaryprevention measures are often more cost effective than higher level interventions, and clearlyreduce the burden of human disease and suffering.
v The need to adopt an integrated approach: Integration of climate change aspects withother development priorities is a two way process. Integrating climate change into acountry’s general planning process makes it possible to ensure that other macro-economicand sectoral policies can be adjusted to take climate change into consideration. At the sametime it will ensure that whatever climate change initiatives implemented are in line withsustainable national development thereby reducing economic burdens on the country.
v The need to promote stakeholder collaboration: Adaptation measures recommended, e.g.in agriculture should be acceptable to all stakeholders. The need and extent of adoption willdepend on the commitment of national policy makers and the support provided throughresearch, training and communication.
v The need to increase the awareness of climate change: Awareness of climate change isinadequate in Sri Lanka. Therefore, it is of utmost importance to enlighten the relevantparties and policymakers on the imminent effects and ensuing problems. In this context, theadvisory and extension services of various institutions and organizations could play a keyrole.

89
CHAPTER 7
EDUCATION, TRAINING AND AWARENESS
INTRODUCTIONIn order to meet the challenges posed by climate change in the coming decades, great importance has tobe attached to education, training and promotion of awareness among different groups. With this inview, Sri Lanka has already launched a number of programmes to educate, train and promote awareness.
7.1 EDUCATIONConsidering the fact that the present student population, from the school system to theuniversity system, would be the decision makers of the future, Sri Lanka has taken steps toinclude some basic concepts of meteorology, climatology, environment, bio-diversity and climatechange into the respective curricula.
In the primary school, environment is taught as part of the syllabus. In the junior school, thesyllabus content of General Science contains the above areas whereas in the senior school,students are taught these concepts through science subjects as well as Geography. At theuniversity under-graduate level, climate change has been included as one of the subjects in thefield of climatology taught in different universities in Sri Lanka, whereas special subjects in post-graduate courses include environment, oceanography and climatology.
In the context of changes that are taking place in the area of climate change and related issues,the contents of these courses will have to be expanded to include the latest climate change relatedinformation.
For non-science students in the General Certificate of Education (Advanced Level) classes, a newsubject called “Science and Society”’ which includes climate change concepts, will be introducedin May 2001.
The Open University of Sri Lanka also hopes to introduce a new course on Climate and ClimateChange at the under-graduate level.
7.2 TRAININGA number of training workshops and seminars have been conducted by the Ministry of Forestryand Environment and the Department of Meteorology, with the assistance and cooperation ofthe National Institute of Education to train master teachers in several aspects of climate changeand related issues. Topics covered at these workshops and seminars included climate variabilityin Sri Lanka, climate change impacts and vulnerability, the United Nations FrameworkConvention on Climate Change and Sri Lanka’s obligations under the UNFCCC, etc.
These programmes will be expanded to train Master Teachers for the expanded syllabuses withclimate change contents. It is also hoped to conduct short courses and training workshops forthe university staff on advanced aspects related to climate change. Training workshops will alsobe held for the benefit of those conducting awareness programmes and also for the print andelectronic media personnel.
Sri Lanka also hopes to undertake capacity building programmes to train scientists (a) toundertake relevant research, and (b) to formulate and implement projects and researchprogrammes on a priority basis.

90
The above programmes will be organized by the recently established Centre for Climate ChangeStudies (see 7.4) with the assistance and cooperation of the Ministry of Forestry andEnvironment, the Ministry of Education and Higher Education, the Education Commission andthe National Institute of Education.
7.3 AWARENESSSri Lanka has been conducting awareness programmes on climate change and related issues forseveral years since the early 1990s. The target groups have been school children from grades 9 to12 and school teachers. Originally, the funding for carrying out these programmes was providedby the US Country Studies Programme, but now the funding is provided by the Ministry ofForestry and Environment. These seminars are organized by the Department of Meteorologyand the resource persons are from the Department of Meteorology and the Ministry of Forestryand Environment. This is an ongoing programme.
Several workshops on climate change and related issues have also been conducted by theMinistry of Forestry and Environment for the benefit of senior government officials, policymakers and NGOs.
The Centre for Climate Change Studies will also be conducting awareness programmes (see 7.4).
7.4 CENTRE FOR CLIMATE CHANGE STUDIESAlthough Sri Lanka’s contribution to the problems of climate change is negligible compared tothose from developed countries and some larger developing countries, the country remainsvulnerable to the economic, ecological and social impacts of climate change. Realizing this, theHon. Minister of Science and Technology obtained the approval of the Government of Sri Lankato set up a Centre for Climate Change Studies. This Centre which was opened on 05 April, 2000,is located at the Headquarters of the Department of Meteorology in Colombo and is headed byone of its Deputy Directors.
The objectives of the Centre are: i. to encourage scientists to carry out research on climate change and related issues; ii. to conduct awareness programmes on climate change and related issues; iii. to serve as a depository of information nationally on research on climate change and climate
change related activities generated in Sri Lanka and in other countries.
The functions and activities of the Centre would be: i. to carry out research on climate change and related issues; ii. to execute climate models; iii. documentation, bibliography and library services; iv. information gathering and dissemination; v. to conduct awareness programmes on climate change and related issues for the benefit of§ policy makers, planners and politicians§ scientists§ general public§ teachers and students
vi. establish links with the relevant international agencies
The activities of the Centre are guided by a Technical Advisory Committee which consists ofsenior scientists from various disciplines.
This Centre will work in close collaboration with related national agencies and the outcome ofstudies done will be made available to policy making bodies in the government and otherconcerned institutions.

91
CHAPTER 8
RECOMMENDED RESEARCH STUDIES AND PORTFOLIOOF PROJECTS
INTRODUCTIONResearch and scientific assessments play a vital role in improving the understanding of the potentialimpacts of climate change in Sri Lanka, with specific reference to their scale and timing. Suchinvestigations will enable the development and assessment of appropriate adaptation strategies. There is aclear need for a coherent, national approach to provide the tools and organization to understand theimpacts of climate change as opposed to continued reliance on individual agency initiatives. Such anapproach would also promote integrated impacts studies which would improve the information and dataavailable to decision-makers in all sectors for developing plans and future policies on climate change. Theresearch studies and projects recommended in this chapter have arisen from the sectoral analyses carriedout for the preparation of the National Action Plan for Climate Change.
8.1 RESEARCH STUDIES
8.1.1 Coastal Zonea) Prepare a coastal data base both referral and relational at a suitable resolution and link the
same with an appropriate environmental monitoring system for updating, analyzing andpredicting coastal responses. It is recommended that a hydrodynamic modelling system beincorporated as an integral part of the monitoring system.
b) Undertake studies on the impact of rise in temperature and sea level on coral reefs andmarine species.
8.1.2 Energy Sectora) Coal will be the preferred option for power generation at present based on a variety of
factors such as the relative cost advantage, lack of infrastructure to transport and handleNatural Gas, lack of sufficient capacity of power generating facilities to utilize Natural Gas,etc. In such a scenario, immediate power requirements will be based on oil and coal until theyear 2008 or so. Beyond this, it would be pertinent to consider Natural Gas as an option forthe future plants as well as the conversion of existing plants especially the large number ofcombustion turbines that will be in the system. A study in this respect should commence.
b) Undertake a study of the economic and environmental impact of identified hydro-powerpotential.
c) Undertake an in-depth Integrated Resource Planning study on Energy Conservation andother Demand Side Management (DMS) measures.
8.1.3 Industry Sectora) Develop and enforce emission standards related to GHGs in the industrial sector.
8.1.4 Transport Sectora) Carry out research studies on the selection of suitable material for road construction. Work
already carried out can be extended to accommodate climate change concerns.
b) Develop representative emission factors for different fuel and vehicle types.

92
c) Improve methodologies for estimation of emissions in the transport sector, in absolute termsas well as in output related terms.
d) Develop an appropriate road pricing system.
e) Identify roads and railway vulnerable to sea level rise and develop strategies to protect theseinfrastructure.
8.1.5 Agricultural Sectora) Breed drought/salinity tolerance varieties and study the use of traditional varieties.
b) Estimate the change in production rates with carbon dioxide fertilization and increase intemperature on different crops – rice, field crops, vegetables, plantation crops.
c) Study the role of agrosilvicultural systems in Sri Lanka – carbon dioxide sinks or sources ofGHG emissions?
d) Undertake studies of economic models that determine the ability to mitigate climate changethrough emission reduction vs. ability to adapt to such changes through adjusting productionfunctions.
e) Study aspects of soil organic matter and nutrient cycling (rates of accumulation,decomposition, etc.) in relation to climate change and agricultural sustainability.
f) Study the effect of different cultural practices such as green manuring, continuous croppingwith fertilizer, multiple cropping, modified alley-farming, etc., on mitigating climate changeimpacts.
g) Study the effect of climate change indicators on weed, pest and disease occurrence ofcultivated crops and develop forecasting systems.
h) Study the effect of carbon dioxide fertilization on radiation use efficiency.
i) Identify agroecological zones particularly sensitive to climate change impacts and potentialdesertification areas.
j) Examine factors affecting methane production in rice paddies of different agro-ecologicalzones and farming practices.
k) Study the impact of climatic change on agriculture – water availability and crop waterrequirements.
8.1.6 Forestry Sectora) Conduct research and development of appropriate protocols for community forest
management or agroforestry type projects. The selection of projects for GHGmitigation should consider:§ The potential social impacts, in particular the potential for poverty reduction
through improved management of communal forest areas or development ofagroforestry systems on individual farm holdings.
§ The potential for Carbon sequestration.§ Other potential benefits such as biodiversity conservation or watershed protection.
93
b) Prepare protocols and guidelines for transferring resources for sustainable forestry and agro-forestry to farmers on the basis of Carbon sequestration.
c) Develop effective systems (standards and procedures) for monitoring and regulating Carbonsequestration by forestry and other land use projects.
d) Evaluate socio economic benefits from Carbon offset projects. Regulatory systems shouldinclude mechanisms for selecting and promoting projects that contribute to the developmentof sustainable rural livelihood.
e) Develop a database of biomass for different types of vegetation in Sri Lanka. Data can bederived from direct measurements of biomass representing the main vegetation types in thecountry.
f) Develop genetic guidelines and methods for managing terrestrial Carbon. This shouldinclude (a) Guidelines for the establishment of regional baselines (b) Socio-economic designcriteria for off set projects (c) Methods for assessment of offset capacity of individualsequestration projects (d) Guidelines for project selection and project development, projectmonitoring and administration, etc.
8.1.7 Water Resources Sectora) Study by hydraulic monitoring the extent of intrusion of salinity wedge along waterways for
different scenarios of sea level rise.
b) Identify new flood levels via hydrological and hydraulic modelling, access daily the impactsof sea level rise.
c) Study the impact of climate variability and climate change on river flow regimes and on theground water table in Sri Lanka.
8.1.8 Health Sectora) Undertake research on low cost thermal environment management and control strategies in
work places.
b) Conduct studies on epidemiological forecasting and early warning systems using RS/GIStechnology applicable in high-risk areas for malaria, dengue, Japanese Encephalitis, diarrhoealdisease and nutritional disorders.
c) Undertake prospective and retrospective studies on identified disease patterns such as eyeand skin disorders relevant to climatic change in sentinel stations.
d) Undertake nutritional research on low cost alternatives to staple diets and supplementaryfoods based on varieties recommended for climatic change.
e) Undertake surveys to identify thermal environment at various work sectors in Sri Lanka.
f) Conduct studies on vector mosquito dynamics and changes in disease patterns on all vectorborne diseases.
8.1.9 Human Settlementsa) Study existing tall structures (telecom towers, etc.) in cyclone prone areas.
b) Study impact of climate change on existing sewerage and drainage systems.

94
c) Study impact of climate change on existing urban water supply schemes, including reservoirs.
d) Develop storm, wind, cyclone and minor flood resistant building standards and guidelinesfor different building categories (NBRO, CHPB, ICTAD, BD, NERD, SLT, CEB).
e) Undertake studies to determine the probability of drought in different agricultural seasonsand in different areas.
8.1.10 Othersa) Develop rainfall and temperature scenarios for Sri Lanka.
b) Examine possible changes in local and foreign recreational activity.
8.2 PROJECTS
8.2.1 Coastal Zonea) Using the mathematical modelling developed, study the influence of increased salt water
intrusion in a selected river estuaries with emphasis on the impacts of fresh water intakes andlow lying agriculture.
b) Undertake a vulnerability assessment in a selected region along the coast which is moreprone to the impacts of sea level rise. The impacts on coastal erosion and coastal land slidesto be included in the study.
c) Undertake the investigation on the impacts of sea level rise and temperature rise on coral reefsystems around the coastal belt.
8.2.2 Energy Sectora) Harness the total maximum identified potential of hydropower, based on a study of the
economic and environmental impacts of identified potential hydropower.
b) Improve transmission and distribution system to bring down the current energy losses.
c) Introduce DSM measures such as peak lopping through appropriate pricing, popularizationof more efficient end use devices such as luminairs, refrigerators, air-conditioners andmotors, etc.
d) Expand and strengthen the capacity of the Energy Conservation Fund to improve itscapability to assist different stakeholders in the energy sector in the areas of energyconservation and management.
e) Commission a study on energy recovery from waste.
8.2.3 Industry Sectora) Adopt energy efficient building codes and standardization and labelling of energy consuming
end use equipment.
b) Promote proper solid waste management with methane recovery.
c) Develop an inventory on emissions from different industries.
d) Develop mechanisms to reduce GHG emissions from such industries.

95
8.2.4 Transport Sectora) Improve traffic management systems through the use of information technology.
b) Introduce a suitable vehicle inspection and monitoring programme.
c) Integrate bus-rail operation through proper network planning.
d) Adopt an appropriate road pricing system.
8.2.5 Agricultural Sectora) Apply simulation models for climatic change and crop response prediction.
b) Promote rainfed farming and the efficient utilization/conservation of water.
c) Develop integrated farming systems in relation to climatic change.
8.2.6 Forestry SectorPrepare a database to:a) Achieve a greater understanding of the linkages between climate change and forest eco-
systems.
b) Quantify the role of forests, forest soils as reservoirs, sinks and sources of Carbon.
c) Determine the dynamic equilibrium of host/parasite relationship in new climateenvironment.
d) Define ways to alter forest management systems to optimize adaptation to climate change,sequestration and storage of Carbon.
8.2.7 Water Resources Sectora) Prepare a groundwater extraction regulation policy.
b) Introduce permit/monitoring systems for groundwater extraction and water qualityassessment in vulnerable areas.
c) Assess the extent of land that will be affected by sea level rise under the following categories: i. Directly inundated (at high tide) ii. Falling below 0.3 m of the new sea level iii. Falling between 0.3 to 1.0 m of the new sea level.
8.2.8 Health Sectora) Establish work environment and occupational safety standards for local conditions.
8.2.9 Human Settlementsa) Map flood plain and flood hazard, especially for Kelani Ganga, Kalu Ganga, Gin Ganga,
Nilwala Ganga, Attanagalu Oya, Mahaweli Oya, Heda Oya and Lunu Oya
b) Measure sea level rise on a continuous basis.
c) Identify and prioritize vulnerable areas for human settlement.

96
CHAPTER 9
CONSTRAINTS AND TECHNOLOGICAL NEEDS
The Enabling Activity Project on Climate Change commenced in 1998, with the main objective ofpreparing the Initial National Communication of Sri Lanka in response to its commitment to theUNFCCC. The project is also expected to enhance general awareness and knowledge on climate changerelated issues in Sri Lanka. The constraints faced in preparing the communication and the majortechnological measures needed to face the potential impacts of climatic change are outlined below.
9.1 CONSTRAINTSDuring the implementation phase, the project had to face several constraints. The moreimportant of these were:
i) The inability to recruit experts on a full time basis. The needed expertise was available onlywith the academic and technical institutions. Being full time staff members of theseinstitutions, they were able to contribute only during their spare time.
ii) The limited availability of specific studies and relevant research. In the preparation of theGHG Inventory for example, reliable data were not available for all aspects. There were alsogaps in activity data. In addition, there were no country specific emission factors to be usedand default values were taken from IPCC guidelines. These however may not represent thereal values for the country. Likewise, very few studies had been undertaken on Vulnerabilityand Adaptation Assessments.
iii) The inadequate time available for undertaking specific studies and research on impacts ofclimate change. These could not be done because the experts had previous commitments.Furthermore, there was no mechanism by which their services could be obtained on a fulltime basis to undertake the necessary research. However, every effort has been made tocollect available information both published and unpublished.
9.2 TECHNOLOGICAL NEEDS
9.2.1 Coastal ZonePreparation of a coastal data base and examining the influence of increased salt water intrusionand vulnerability of coastal areas through case studies.
9.2.2 Energy SectorExploring natural gas as an energy option, harnessing the total identified hydro power potentialand introduction of DSM measures.
9.2.3 Industry and TransportDevelopment of emission factors for vehicles; enforcement of GHG related emission standardsin the industrial sector; adoption of energy efficient building codes and proper solid wastemanagement techniques; improvement of traffic management systems and integration of bus-railoperations through network planning.
9.2.4 Agricultural SectorIdentification of agro-ecological zones sensitive to climate change impacts; promotion of rainfedfarming and; development of integrated farming systems in relation to climate change.

97
9.2.5 Forestry SectorPreparation of a data base to understand linkages between climate change and forestry eco-systems and examining the potential for carbon sequestration.
9.2.6 Water Resource SectorAssessment of the (a) extent of land that will be affected by Sea Level rise and (b) the impact ofclimate change on river flow regimes.
9.2.7 Health SectorEstablishment of work environment standards for local conditions and the undertaking of studieson diseases relevant to climate change.
9.2.8 Human SettlementsMapping of flood plains and flood hazards for selected major rivers; development of strong windand cyclone resistant building standards and guidelines and identification and prioritization ofvulnerable areas for human settlements.

98
BIBLIOGRAPHY
1. Abhayasingha Bandara, K.R., (1999): Identifying Damages to Life and Property by Lightning Dischargesand Developing a Technique of Forecasting Movement of Thunderstorms Using Wind Field for an Area of 100km Radius Around Colombo. Half Yearly Progress Report submitted to the National ScienceFoundation, Sri Lanka.
2. Agricultural Research Station, Maha Illuppalama, Sri Lanka. (1984): Seasonal Reports.
3. Aluvihare P.B. and M. Kikuchi (1991): Irrigation Investment Trends in Sri Lanka: New Construction andBeyond. International Irrigation Management Institute. Colombo, Sri Lanka.
4. Asian Development Bank-Marga Institute, (1994): ‘Climate Change in Asia : Sri Lanka CountryReport’ Asian Development Bank, Manila, Philippines.
5. Bandaratilake, H.M. Implementation Strategies of the Forestry Sector Master Plan. Proceedings of aSeminar on Biodiversity in Sri Lanka, Sri Lanka Association for Advancement of Science,Colombo. (1998).
6. Central Bank of Sri Lanka (1998): Economic and Social Statistics of Sri Lanka.
7. Central Bank of Sri Lanka (1999): State of the Economy.
8. Central Bank of Sri Lanka, Annual Reports, 1993, 1994, 1995, 1998.
9. Ceylon Electricity Board, “Sri Lanka Energy Balance and Energy Data”, 1991 and 1992.
10. Ceylon Electricity Board, Generation Planning Branch, (1996): “Long Term Generation ExpansionPlanning Studies, 1996-2010”.
11. Sri Lanka Tourist Board, (1998): Annual Statistical Reports.
12. Chandrapala, L. (1996): Long Term Trends of Rainfall and Temperature in Sri Lanka. In: Y.P. Abrolet.al., eds., Climate Variability and Agriculture, Narosa Publishing House, New Delhi, India.
13. Chandrasiri, Sunil, (1999): Economy and Environment Programme for Southeast Asia, ControllingAutomotive Air Pollution: The Case of Colombo City. Research Report Series.
14. Climate Impact Group, (1992): Climate Change Scenario for South and South-east Asia,Commonwealth Scientific and Industrial Research Organization,Division of AtmosphericResearch, Aspendala, Mordialloc, Australia.
15. Coast Conservation Department, Ministry of Fisheries & Aquatic Resources, Sri Lanka. (1992):Coastal 2000. A Resource Management Strategy for Sri Lanka’s Coastal Region, Volumes 1 & 11.
16. Coastal Conservation Department, Ministry of Fisheries & Aquatic Resources, Sri Lanka. (1997):Revised Coastal Zone Management Plan.
17. Department of Census and Statistics, Ministry of Finance & Planning, Sri Lanka. StatisticalAbstract, (1997).
18. Daranagama, U., P.D.C. Wijayatunga, K.P. Ariyadasa, H.K. Kumarasiri, H.K. (1999), Feasibility ofDendro Power Based Electricity Generation in Sri Lanka, Research Report, Energy Forum, Sri Lanka.

99
19. Department of Customs, Ministry of Finance & Planning, Sri Lanka. “External Trade Statistics”,1993, 1994 and 1995.
20. Dhanapala et al. (1998): ‘Sri Lanka Climate Change Country Study’, United States Country StudiesProgramme. Sri Lanka.
21. Dharmasena, P.B. (1991): Present Use of Land and Water Resources in Village Tank Farming. Journalof the Soil Science Society of Sri Lanka Vol. 7:1-17.
22. Dhanapala, K., P.D.C. Wijayatunga, W.J.L.S. Fernando, L. Ariyadasa, P.J. Joseph, and S.Fernando, (1998): Environmental and Economic Impact of using Micro-Hydro Biomass Power in the TeaPlantation Sector in Sri Lanka, Research Report, Ministry of Forestry & Environment. Colombo,Sri Lanka.
23. Dharmasena, P.B. (1993): Man-Environmental Interaction in Tank Village Home Garden: the Trends inVegetation. Proceedings of the Fourth Regional Workshop on Multipurpose Trees, University ofPeradeniya, Sri Lanka.
24. Dharmasena, G.T. (1994): Conservation of Water for Irrigation. National Seminar on Soil and WaterConservation, Department of Agriculture, Peradeniya, Sri Lanka.
25. Dharmaratne, G.H.P. and S.H. Kariyawasam (1990): Droughts. Paper presented at the seminaron “Natural Disaster Reduction”, Oct. 15-16, 1990. Colombo, Sri Lanka.
26. Energy Conservation Fund of Sri Lanka, “Sri Lanka Energy Balance and Energy Data”. 1993, 1994,1995.
27. Fernando, T.K. and L. Chandrapala, (1997): Climate Variability in Sri Lanka: A Study on Trends ofAir Temperature, Rainfall and Thunder Activity, in “Climate and Life in the Asia-Pacific”.Proceedings of the International Symposium on Climate and Life in the Asia-Pacific. April 1995,Ed. K.U. Sirinanda. University of Brunei, Darussalam.
28. Fernando, T.K., P.M. Jayathilake Banda and L. Chandrapala (1997): Recent ENSO events in SriLanka – A comparative study of the droughts of 1983, 1987 and 1992, in “Climate and Life in the Asia-Pacific”. Proceedings of the International Symposium on Climate and Life in the Asia-Pacific.April 1995, Ed. K.U. Sirinanda, University of Brunei, Darussalam.
29. Fernando, W.J.N., (1999): Estimation of Energy Use, Department of Chemical Engineering,University of Peradeniya, Sri Lanka.
30. Fernando, K. Sunith (1996); Some Thoughts and Experiences on Wind and Micro Hydro Power,Economic Review, August 1996. Sri Lanka.
31. Fernando,T.K. (1997): Recent Variations of Rainfall and Temperature in Sri Lanka, Proceedings of theAnnual Sessions of the Sri Lanka Association for the Advancement of Science, 1997. Colombo,Sri Lanka.
32. Fernando,W.J.L.S., A. Kumarihamy (1996): “Techno-Economic Potentials of Energy Efficient TechnologyOptions for Mitigating Green House Gases from the Electricity Sector: A Case Study of Sri Lanka, AsianRegional Research Programme in Energy, Environment and Climate, Asian Institute ofTechnology, Bangkok, Thailand.
33. Fernandopulle, M.N. (1994): Use of Different Organic Matter for Soil and Water Conservation inCoconut. National Seminar on Soil and Water Conservation, Department of Agriculture,Peradeniya, Sri Lanka.

100
34. Food Controller’s Department, Planning and Statistics Division, Colombo, Sri Lanka. “FoodBalance”, 1993, 1994, 1995.
35. Forest Department, Ministry of Forestry & Environment, Sri Lanka. Forestry Master Plan (1985).
36. Gelbert, M. (1988): Chena (Shifting) Cultivation and Land Transformation in the Dry Zone of Sri Lanka.Department of Geography, University of Zurich, Zurich, Switzerland.
37. Geological Survey and Mines Bureau of Sri Lanka (1999): “Sri Lanka Minerals Year Book”.
38. Gommes, R., H.M. Kaiser (ed). T.E. Drenen, (1993): Current Climate and Population Constraints onWorld Agriculture. Agricultural Dimensions of Global Climate Change.
39. Gunaratne, Lalith (1994): Solar Photovoltaics in Sri Lanka: a Short History, Progress in Photovoltaics:Research and Applications, Vol. 2.
40. Gunasena, H.P.M. (ed). (1997 ): Multipurpose Tree Species in Sri Lanka. Proceedings of the EighthNational Workshop on Multipurpose Trees, Kandy, Sri Lanka.
41. Herath, J.W., (1975): “Mineral Resources of Sri Lanka”, Geological Survey and Mines Bureau of SriLanka.
42. Intergovernmental Panel on Climate Change (1996): Climate Change 1995. Impact on Sea Level Riseon Coastal Zone Management. [Houghton, J.J., L.G. Meirofilho, B.A.Callender, N. Harris, A.Kattenberg, and K. Maskell (eds.).]
43. Intergovernmental Panel on Climate Change (1995): Climate Change – Second Assessment.
44. Intergovernmental Panel on Climate Change (1996): Climate Change 1995: The Science ofClimate Change. Contribution of Working Group I to the Second Assessment Reporting theIntergovernmental Panel on Climate Change. [Haughton, J.J., L.G. Meiro Filho, B.A. Callender,N. Harris, A. Kattenberg, and K. Maskell (eds.)].
45. Intergovernmental Panel on Climate Change (1998): The Regional Impacts of Climate Change: AnAssessment of Vulnerability. A Special Report of IPC Working Group II [Watson, Robert T., M.C.Zinyowera, R.H. Moss, and D.J. Dokken (eds.)]
46. Intergovernmental Panel on Climate Change, ‘Greenhouse Gas Inventory Reporting Instructions’, Vol. I(1996): IPCC/WG1 Technical Support Unit, Hadley Centre, Meteorological Office, LondonRoad, Brack Nell, United Kingdom.
47. Inter-governmental Panel on Climate Change, “Greenhouse Gas Inventory Workbook”, Volume II,(1996): IPCC/WG1 Technical Support Unit, Hadley Centre, Meteorological Office, LondonRoad, Brack Nell, United Kingdom.
48. Inter-governmental Panel on Climate Change, ‘Greenhouse Gas Inventory Reference Manual, Vol. III,(1996): IPCC/WG1 Technical Support Unit, Hadley Centre, Meteorological Office, LondonRoad, Brack Nell, United Kingdom.
49. Jayawardena, S.D.G. (1988): Conservation and Sustainable Management of Agricultural Biodiversity.Proceedings of Seminar on Biodiversity in Sri Lanka, Sri Lanka Association for Advancement ofScience, Colombo, Sri Lanka.

101
50. Kannangara, R.P.K. (1990): Subdivision of the DL1 Agroecological Region (Sri Lanka). Land and WaterUse Division, Department of Agriculture, Sri Lanka.
51. Madduma Bandara, C.M. Some Impacts of Global Climatic Changes on Hydrometerology and CoastalEnvironments of Sri Lanka. Special Project on Global Climate Change – University of Tsukuba,Japan.
52. Meier, Peter and Mohan Munasinghe (1994): “Incorporating Environmental Concerns into Power SectorDecision Making: A Case Study for Sri Lanka”, World Bank Environmental Paper No. 5, The WorldBank.
53. Metropolitan Environment Improvement Project (1992): Ministry of Plan Implementation,Colombo, Sri Lanka. ‘Clean Air 2000 – Action Plan’ Colombo.
54. Ministry of Agriculture, Lands & Forestry (1996): Sri Lanka. Agriculture Policy Recommendations.
55. Ministry of Agriculture, Lands and Forestry (1995): Sri Lanka. National Policy Framework.
56. Ministry of Agriculture, Lands and Forestry (1996): Sri Lanka. Position Paper for World Food Summit.
57. Ministry of Environment & Parliamentary Affairs (1994): Sri Lanka . Sri Lanka Country Programmefor Phase Out of Ozone Depleting Substances.
58. Ministry of Finance & Planning, Department of Census and Statistics, Sri Lanka. AgriculturalStatistics of Sri Lanka (1997)
59. Ministry of Fisheries and Aquatic Resources Development and Central Environmental Authority(1998): Sri Lanka. Environmental & Other Guidelines for the Fisheries Sector in Sri Lanka.
60. Ministry of Forestry & Environment, Sri Lanka. National Action Plan on Climate Change, FinalReport, April 1999.
61. Ministry of Forestry & Environment, Sri Lanka. National Environmental Action Plan (1998-2001).
62. Ministry of Forestry & Environment, Sri Lanka. Natural Resources and Environmental PolicyProject (1992): ‘Motor Vehicle Pollution Control in Sri Lanka’.
63. Ministry of Forestry and Environment, and Ministry of Health and Indigenous Medicine, SriLanka (1997): Sri Lanka. Environmental Initiative – Strategic Plan.
64. Ministry of Health & Women’s Affairs, Population Division (1994): Sri Lanka. Population Impactson Development.
65. Ministry of Health, Sri Lanka. Annual Health Bulletin 1996 and 1997.
66. Ministry of Health, Highways & Social Services (1996): Sri Lanka. National Health Policy.
67. Ministry of Housing, Construction and Public Utilities, Sri Lanka. Human Settlements & ShelterSector Development in Sri Lanka; National Report for Habitat II Conference.
68. Ministry of Irrigation Power and Energy (1988): Sri Lanka. Power Sector Policy Directions.
69. Ministry of Irrigation Power and Energy (1997): Sri Lanka. “Energy Policy for Sri Lanka”.

102
70. Ministry of Plan Implementation, Ethnic Affairs and National Integration (1997): Sri Lanka. ARegional Development Programme Framework.
71. Ministry of Social Service & Rehabilitation, Sri Lanka. Natural Disaster Preparedness & MitigationPlan & Act (1992).
72. Munasinghe, Mohan, (1998): “Energy-Environment-Development Issues World-wide and Relevance to SriLanka”, LIFE-Goethe Institute International Workshop on Energy, Environment andDevelopment, Colombo, Sri Lanka.
73. National Building Research Organization, Ministry of Housing & Urban Development (1993): SriLanka. ‘Colombo Air Quality Monitoring Programme’.
74. Natural Resources, Energy & Science Authority of Sri Lanka (1998 ): ‘Institutions Carrying OutClimate Related Research in Sri Lanka’, Colombo, Sri Lanka.
75. Perera, K.K.Y.W. (1992). Energy Status in Sri Lanka: Issues-Policy-Suggestions, Institute of PolicyStudies, Sri Lanka.
76. Perera, K.K.Y.W., P.D.C. Wijayatunga, (2000): Energy Resources, Natural Resources Profile,National Science Foundation, Sri Lanka.
77. Ratnasiri, J. (ed). (1998): Final Report of the Sri Lanka Climate Change Country Report, Ministry ofForestry and Environment, Colombo, Sri Lanka.
78. Ratnasiri, P.A.J. (1991): ‘The Greenhouse Effect and its Impact on the SAARC Region,’. Ministry ofForestry & Environment, Colombo, Sri Lanka.
79. Ratnasiri, P.A.J. (1993): ‘Greenhouse Gas Inventory for Sri Lanka’, Ministry of Forestry &Environment, Colombo, Sri Lanka.
80. Ratnasiri, P.A.J. (1994): Ozone Depletion’ SACEP, Ministry of Forestry & Environment, Colombo,Sri Lanka.
81. Ratnasiri, P.A.J. (1994): ‘Clean Air Programme,’ Colombo, Ministry of Forestry & Environment,Colombo, Sri Lanka.
82. Ministry of Health, Sri Lanka. Report on the Presidential Task Force on Formulation of a National HealthPolicy for Shri Lanka (1992).
83. Ministry of Housing & Urban Development, Sri Lanka. Report on the Presidential Task Force onHousing & Urban Development (1998).
84. Samarappuli, L. (1994): Soil and Moisture Conservation Practices in Rubber Plantations. NationalSeminar on Soil and Water Conservation. Department of Agriculture, Peradeniya, Sri Lanka.
85. Shanmuganathan, K. (1994): Trash as a Mulching Material to Conserve Soil and Water for the Cultivationof Sugar Cane. National Seminar on Soil and Water Conservation. Department of Agriculture,Peradeniya, Sri Lanka.
86. Soil Conservation Act 1951. Sri Lanka.
87. Somarisi, S. (1979): Village Tanks as an Agricultural Resource in the Dry Zone of Sri Lanka. TropicalAgriculturist. Vol. 135: 35-46.

103
88. Somasiri, L.L.W., N. Nadarajah, L. Amerasinghe and H.A.J. Gunathilaka, (1994): Land SuitabilityAssessment of Coconut Growing Areas in the Coconut Triangle, Coconut Research Institute, Lunuwila, SriLanka.
89. Surveyor General’s Department, Sri Lanka . Sri Lanka National Atlas. (1988).
90. Tea Research Institute (1998): Talawakele, Sri Lanka. Guidelines to Plantations on Combatting El NinoThreat.
91. United Nations Centre for Housing Settlement (1992): ‘Human Settlements Sector Study : Sri Lanka’
92. United Nations Environment Programme/World Meteorological Organization (1992): ‘UnitedNations Framework Convention on Climate Change’.
93. Urban Development Authority, Ministry of Housing & Urban Development (1996): Sri Lanka.‘Colombo Metropolitan Area Structure Plan’.
94. Wanasinghe, Y.A.D.S. (1997). “Settlements” in T. Somasekeran et al., Arjuna’s Atlas of SriLanka, Arjuna Consulting Co. Ltd., Dehiwela, Sri Lanka.
95. Water Resources Board, (1998): Effects of Draft Water Resources Act on Existing Legislation Water Lawand Policy Advisory Programme, Netherlands/Food & Agriculture Organization Project. WaterResources Board, Colombo, Sri Lanka.
96. Water Resources Secretariat (1999): Policy & Institutional Reforms in Water Resources Management.Recommendations presented to H.E. the President and the Cabinet Ministers for the WaterSector, Colombo, Sri Lanka.
97. Water Resources Secretariat, (1998): Approach for Comprehensive Water Resources Management in SriLanka. Battaramulla, Colombo, Sri Lanka.
98. Water Resources Secretariat, National Planning Department, Ministry of Finance & Planning(1999): Draft National Water Resources Policy and Institutional Recommendations for Comprehensive WaterResources Management, Colombo, Sri Lanka.
99. Weerakkody, U. (1998). Potential Impact of Accelerated Sea Level Rise on Beach Erosion and Inundation ofLowlands of the Southwest Coast of Sri Lanka. Report for the U.S. Country Studies Programme.Colombo, Sri Lanka.
100. White, R. (1996): Land use changes in the Upper Mahaweli Catchment. Proceedings of the Soil ScienceSociety Annual Sessions, Colombo, Sri Lanka.
101. Wickremasinghe, A. (1987): Ecological Impacts of Dry Zone Farming Systems in Sri Lanka. MalaysianJournal of Tropical Geography. Vol. 15.
102. Wijayatunga, P.D.C. (1988 ): Prospects of Renewable Energy Sources in Sri Lanka: Pricing and Other Issues,Workshop on Energy and Environment. Lanka International Forum on EnvironmentSustainable Development/German Cultural Institute, Colombo, Sri Lanka.
103. Wijeratne, M.A. (1966): Vulnerability of Sri Lanka Tea Production to Global Climate Change. Water,Air, and Soil Pollution, 92: 87-94.
104. Wijesundera, M. de S (1998). Malaria Outbreaks in New Foci for Sri Lanka. Parasitology Today.4:147-150.

104
105. Wijewardena, R., and P.G. Joseph (1997): Growing Our Own Energy for Complementing Hydropower forSustainable Energy and Rural Employment in Sri Lanka.
106. World Bank (1995): Non-Plantation Crop Sector Policy Alternatives.
107. World Bank, World Development Report 1998/99, 1998.
108. World Meteorological Organization, Geneva, Intergovernmental Panel on Climate Change(1990): ‘Scientific Assessment of Climate Change’.
109. World Resources Institute (1992). ‘World Resources’.
Enabling Activity Project on Climate Change:
(a) Consultancy Reports prepared to assist in the preparation of the National Action Plan onClimate Change and Greenhouse Gas Inventory:
Bulankulame, S.W.P. (1998). Working Paper prepared on Health, Human Settlements and PublicUtilities. Ministry of Forestry & Environment, Sri Lanka.
Fernando, G B A. (1998): Working Paper prepared on Energy, Industry, Transport & Highways.Ministry of Forestry & Environment, Sri Lanka.
Fernando, W.J.N. (1999): Greenhouse Gas Inventory of Sri Lanka 1993-1995, Energy & IndustrialProcesses. Ministry of Forestry & Environment, Sri Lanka.
Handawela, J. (1998): Working Paper prepared on Agriculture, Forestry, Land Use & WaterResources. Ministry of Forestry & Environment, Sri Lanka.
Kumaradasa, M.A. (2000): Policies & Measures. Ministry of Forestry & Environment, Sri Lanka.
Perera, A.N.F. (1999): National Greenhouse Gas Inventory 1993, 1994, 1995. Ministry of Forestry &Environment, Sri Lanka.
(b) Core Team Reports prepared to assist in the preparation of the National Action Plan onClimate Change:
1. Report on Water Resources.2. Report on Forestry.3. Report on Agriculture.4. Report on Emissions from Energy and Industrial Sectors.5. Report on Large Hydro and Fossil Fuels.6. Report on Health.7. Report on Human Settlements & Public Utilities (HS & PU).8. Report on Transportation.9. Report on Coastal Zone, Ports & Fisheries.10. Alternatives to Fossil Fuel – Excluding Large Hydro.
(c) (Other)
Ranasoma, M.A. 2000: National Action Plan on Climate Change, Ministry of Forestry &Environment.
Recommended