MIT Energy Conference 2007 -Solar Power: A Path to Grid Parity?
Moderator - Travis Bradford, President, Prometheus Institute
1. Manufacturing - Dick Swanson, President and CTO SunPower 2. Technology - Charlie Gay, VP & GM Solar Group, Applied Materials3. Policy - Rhone Resch, President SEIA 4. Financing/Integration - Jigar Shah, CEO SunEdison
Special Thanks to the student organizers: Keith Peltzman - Eerik Hantsoo - Joel Conkling - Anthony Fotopoulos - Carlos Molina

Meeting the NeedThe Prometheus Institute for Sustainable Development
Institute Research Products2006
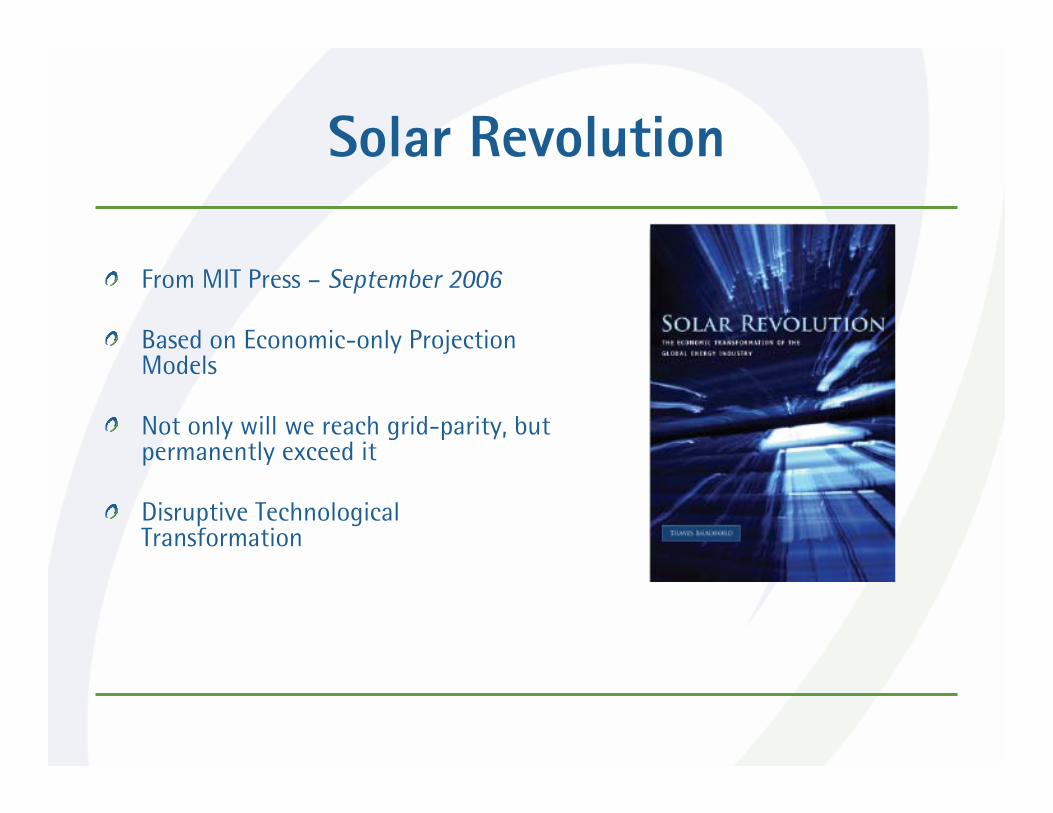
Solar Revolution
From MIT Press – September 2006
Based on Economic-only Projection Models
Not only will we reach grid-parity, but permanently exceed it
Disruptive Technological Transformation

What is Grid Parity?
Assumes Distributed (not Centralized) Solar
Must correctly calculate the cost of PV, including:Component Costs (Modules, Inverters, Racking, etc.)Installation CostFinancing Costs (and terms of repayment)
And must impute amount of sunlight captured in usable form:
Sunlight AvailableInstallation characteristics (angles and shading)Losses from DC capture to AC use
Decide to compare with or without subsidies:Rebates, Tax Credits, Accelerated Depreciation, Tax Deducibility of Home Mortgage Interest

What is Grid Parity ?
PV presents a range of cents/ kWh (based on many variables)Compare versus range of local grid-prices
When do we achieve grid parity? How do we get there?When do we achieve grid parity? How do we get there?
Grid El
ectric
ity
Grid El
ectric
ity
Num
ber
of L
ocat
ions Distributed PV
Distributed PV
Cents / kWh

Dr. Richard Swanson
SunPower Corporation
Richard SwansonFounder, President, CTO
MIT Energy ConferenceMarch 10, 2007

8
2002$3/W
1979$30/W
Solar Price Learning Curve
1
10
100
1 10 100 1000 10000
Cumulative Production (MW)
Mod
ule
Pric
e (2
002$
)
1979$32/W
2002$3.10/W
Silicon Shortage
81% Progress Ratio
Solar Panel Cost Drops by 19% With Each Doubling in Manufacturing Capacity

9
Now two new factors are emerging that will help continue this trend:
• Efficiency as an Important Driver– Increased efficiency drives value
through the entire value chain
• Thinner wafers– Reduces consumption of expensive
silicon

10
Poly Grams per Cell Watt
0
2
4
6
8
10
12
14
Q105 Q205 Q305 Q405 Q106 Q206 Q306
Silicon Utilization

11
• Thinner wafers• Higher efficiency• Improvements in crystal growth technology• Improvements in slicing technology• Improvements in cell processing technology• New lower cost silicon refining technologies• Increased manufacturing scale:
200 MW → 500 MW plant size
Future Cost Reduction Drivers

12
Polysilicon
Wafer Solar Cell Solar Panel SystemIngotPolysilicon
Value Chain Cost Distribution
20%30%
50%
2006 US Solar System Cost Allocation by Category
13
2006 2016
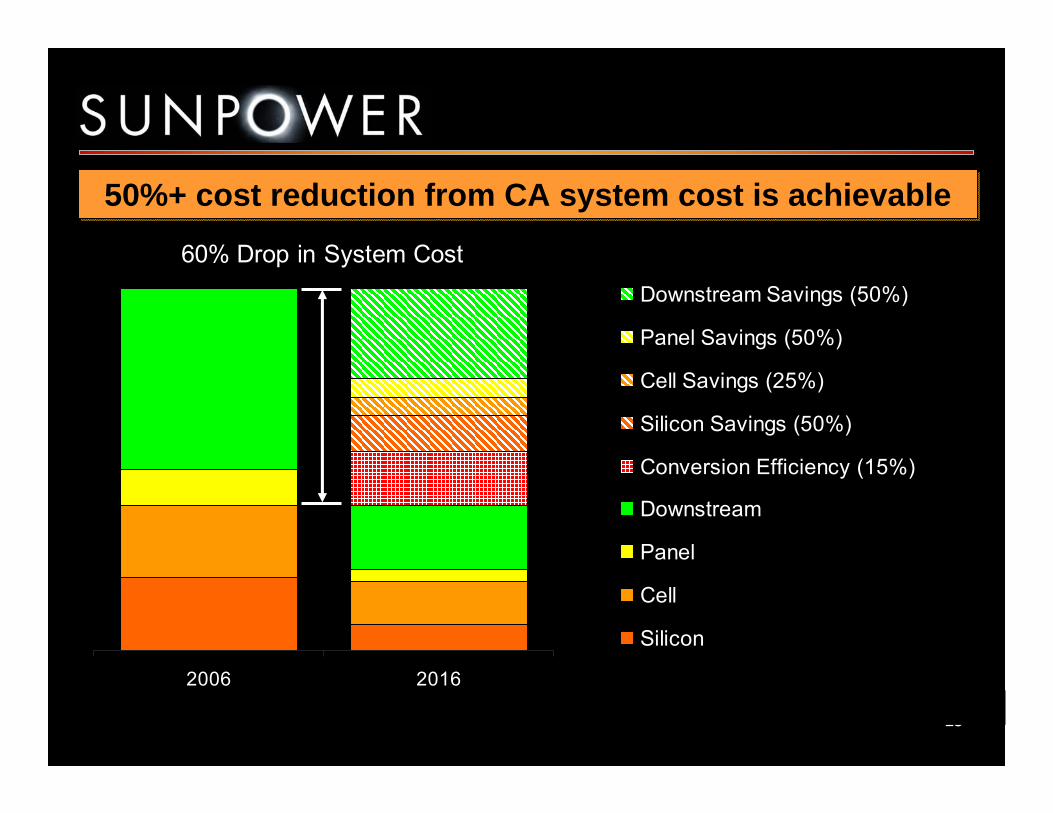
Downstream Savings (50%)
Panel Savings (50%)
Cell Savings (25%)
Silicon Savings (50%)
Conversion Efficiency (15%)
Downstream
Panel
Cell
Silicon
60% Drop in System Cost
50%+ cost reduction from CA system cost is achievable50%+ cost reduction from CA system cost is achievable

14
Silicon Roadmap Cost1
10
100
1 10 100 1,000 10,000 100,000
Cumulative Production (MW)
Mod
ule
Pric
e ($
/W) (
$200
2)
Historical
Projected
1980$21.83/W
1990$6.07/W
2000$3.89/W
2010$1.82/W
2013$1.44/W2002 Roadmap
Solar Panel Learning Curve Predicts Retail Rate Parity < Decade

Dr. Charlie Gay
Applied Materials Corporation

External Use
Gigawatt Scale Solar Manufacturing
Charlie GayVice President and General Manager, Solar Business
The MIT Energy ConferenceMarch 10, 2007
External Use17
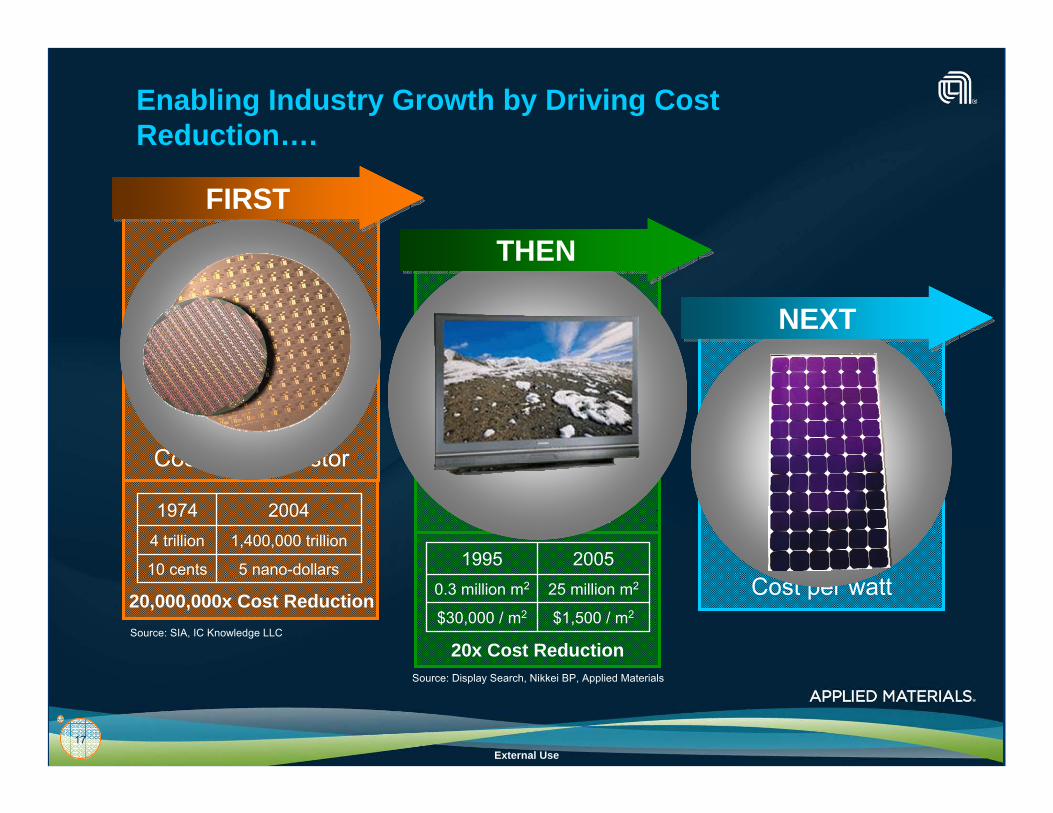
Enabling Industry Growth by Driving Cost Reduction….
5 nano-dollars10 cents
1,400,000 trillion4 trillion
20041974
20,000,000x Cost ReductionSource: SIA, IC Knowledge LLC
$1,500 / m2$30,000 / m2
25 million m20.3 million m2
20051995
20x Cost ReductionSource: Display Search, Nikkei BP, Applied Materials
Cost per transistor
FIRSTFIRST
Cost per area
THENTHEN
Cost per watt
NEXTNEXT

External Use18
Cumulative Volume (MW)
1
10
100
1 10 100 1,000 10,000 1E5
HistoricalHistoricalProjectedProjected
19801980$21.83/W$21.83/W
19901990$6.07/W$6.07/W
20052005$2.70/W$2.70/WM
odul
e C
ost (
$/W
)*
Scale to Enable Learning Curve
* 2002 DollarsSource: Navigant Consulting
Production line size (Megawatts per Year):
Lines Per Factory
0.5(1980)
2
5(2000)
3
50(2005)
4
100(2010F)
10

External Use19
Cost Per Watt Expected to Scale with Fab Size
Current thin film Current thin film technology for technology for
25MW 25MW fabfab
Projected Applied Projected Applied thin film thin film
technology for technology for ~60MW ~60MW fabfab
Projected Applied Projected Applied thin film thin film
technology for technology for 1GW 1GW fabfab
$1.00/W$1.00/W
$0.71/W$0.71/W
Sources: First Solar, Applied Materials, supplier quotationsSources: First Solar, Applied Materials, supplier quotations
Glass Substrate
Transparent Conductor
Amorphous Silicon
Microcrystalline Silicon
Back Contact
Glass Substrate
Transparent Conductor
Amorphous Silicon
Microcrystalline Silicon
Back Contact
Device and Device and materials materials optimization optimization
Jumbo size Jumbo size glassglass
Optimized supply Optimized supply chain, especially glass chain, especially glass and glass coatingand glass coatingLine balancingLine balancing
>$1.42/W>$1.42/W
External Use20
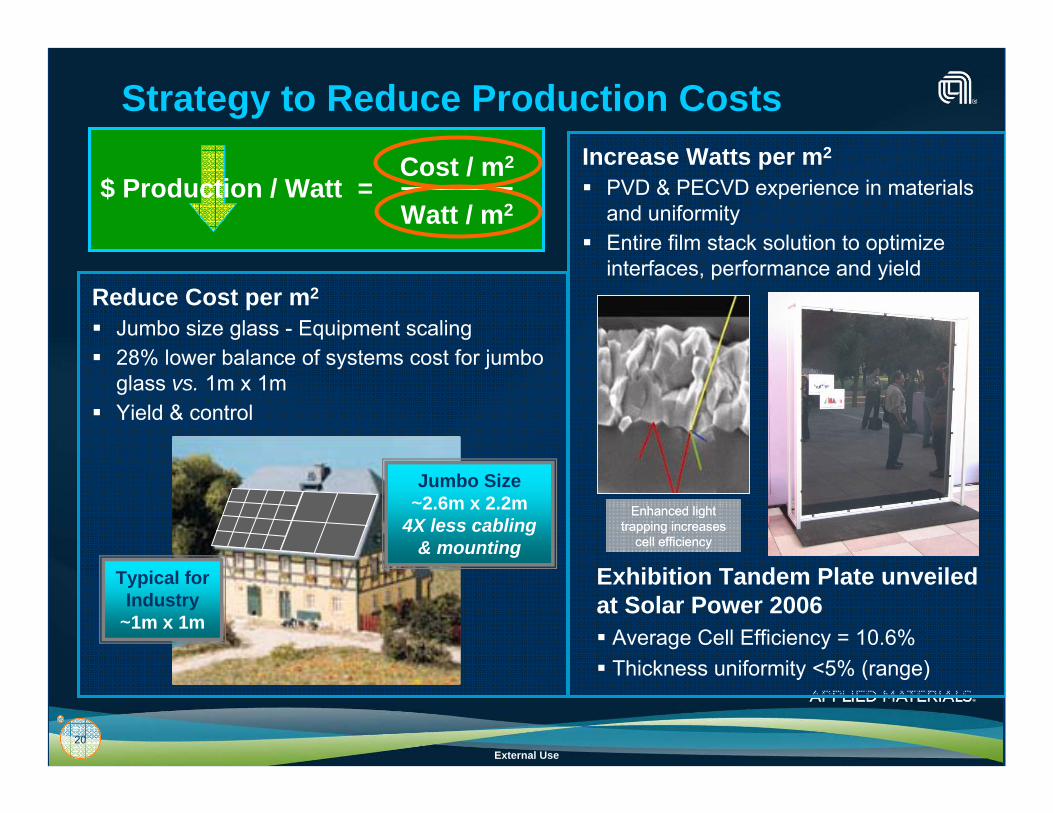
Strategy to Reduce Production Costs
=$ Production / WattCost / m2
Watt / m2
Reduce Cost per m2
Jumbo size glass - Equipment scaling28% lower balance of systems cost for jumbo glass vs. 1m x 1mYield & control
Typical for Industry
~1m x 1m
Jumbo Size~2.6m x 2.2m
4X less cabling & mounting
Exhibition Tandem Plate unveiled at Solar Power 2006
Average Cell Efficiency = 10.6% Thickness uniformity <5% (range)
Increase Watts per m2
PVD & PECVD experience in materials and uniformityEntire film stack solution to optimize interfaces, performance and yield
Enhanced light trapping increases
cell efficiency
Enhanced light trapping increases
cell efficiency

External Use21
Large Area Processing Equipment

Rhone Resch
Solar Energy Industries Association(SEIA)

23
www.seia.org
Expanding the Solar Market in the United States
Rhone ReschPresident
Solar Energy Industries Association
24
www.seia.org
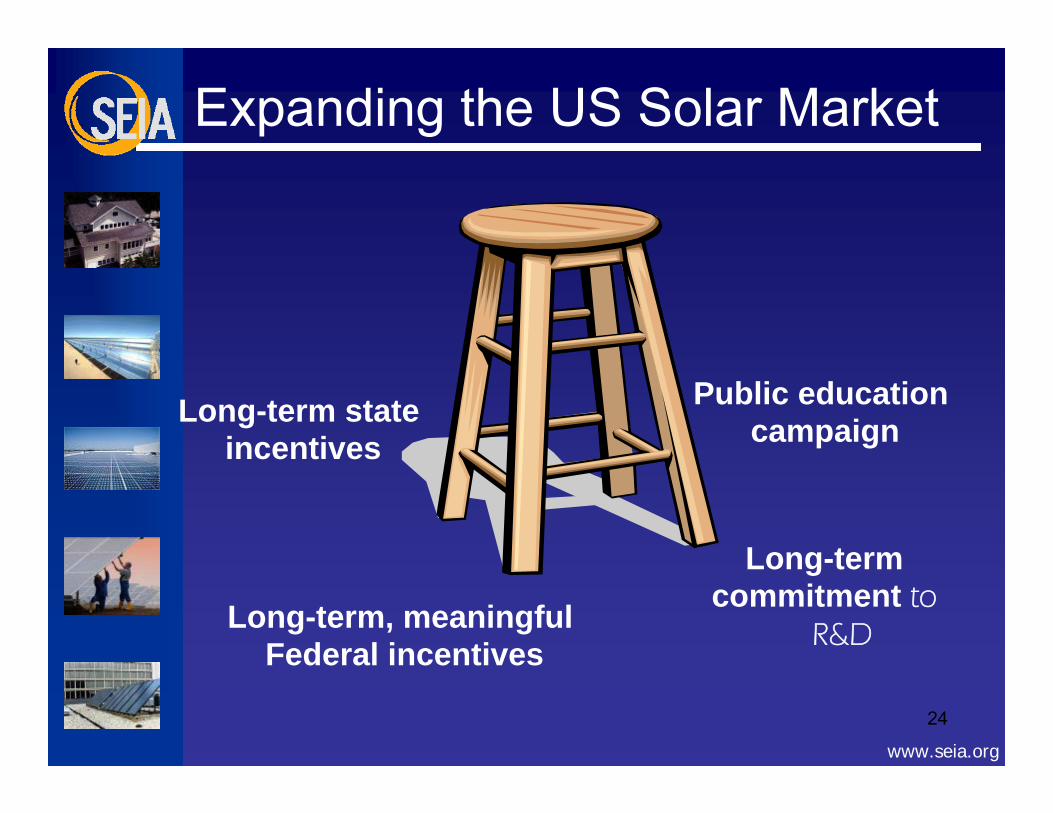
Expanding the US Solar Market
Long-term state incentives
Long-term, meaningful Federal incentives
Long-term commitment to
R&D
Public education campaign

25
www.seia.org
California Leading the Country
• California Solar Initiative– 11-year program, $3.2 billion– CPUC Commercial and Existing Residential
Buildings Program (CERB) • $2.8 billion• Fund 2,800 MW• Hybrid PBI program
– 50% rebate– 50% performance based incentive
– CEC Residential New Construction Comp -2007
• $350 million• New residential single and multi-family homes• Set aside for affordable housing
• Renewable Portfolio Standard - 20% by 2010

26
www.seia.org
Requirements: 23 States and Washington
D.C.
Source: DSIRE, www.dsireusa.org, January 2007
State Goal
☼ PA: 18%¹ by 2020☼ NJ: 22.5% by 2021
CT: 10% by 2010
MA: 4% by 2009 + 1% annual increase
WI: requirement varies by utility; 10% by 2015 Goal
IA: 105 MW
MN: 10% by 2015 Goal +Xcel mandate of
1,125 MW wind by 2010
TX: 5,880 MW by 2015
*NM: 10% by 2011☼ AZ: 15% by 2025
CA: 20% by 2010
☼ NV: 20% by 2015
ME: 30% by 2000;10% by 2017 goal - new RE
State RPS
*MD: 7.5% by 2019
☼ Minimum solar or customer-sited requirement* Increased credit for solar or customer-sited
¹PA: 8% Tier I, 10% Tier II (includes non-renewable sources)
HI: 20% by 2020
RI: 15% by 2020
☼ CO: 10% by 2015
☼ DC: 11% by 2022
☼ NY: 24% by 2013
MT: 15% by 2015
*DE: 10% by 2019
IL: 8% by 2013
VT: RE meets load growth by 2012
Solar water heating eligible
*WA: 15% by 2020
27
www.seia.org
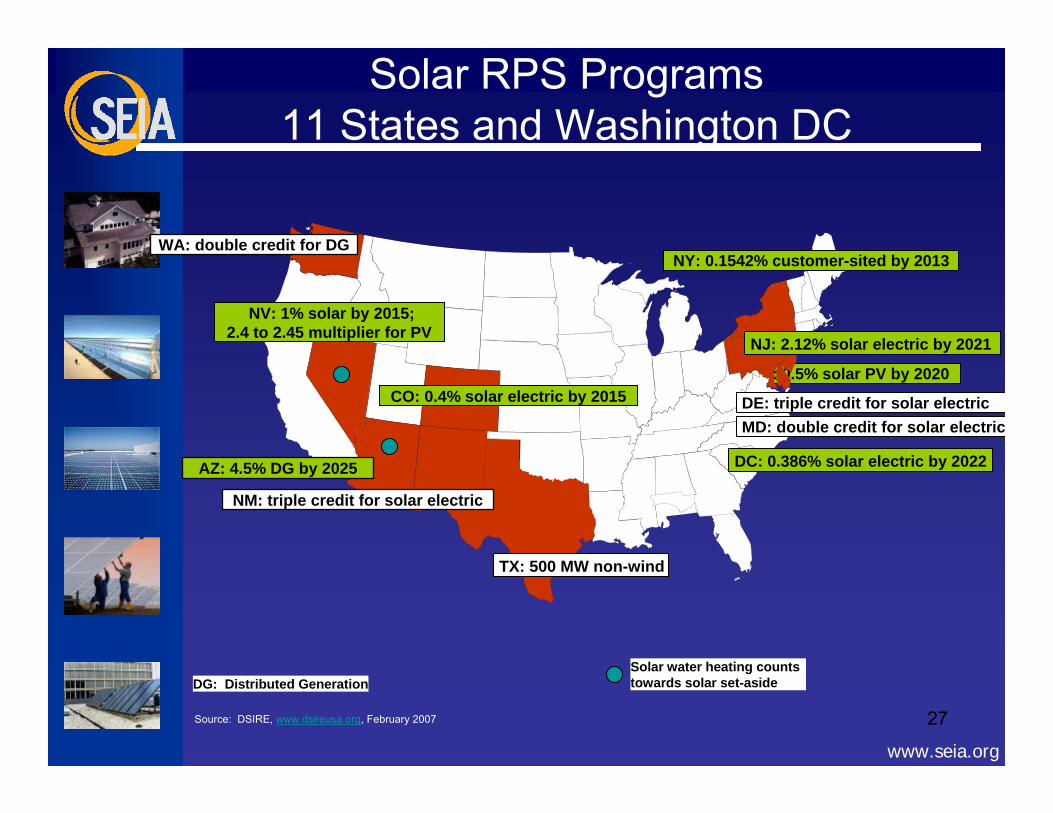
Solar RPS Programs11 States and Washington DC
Source: DSIRE, www.dsireusa.org, February 2007
PA: 0.5% solar PV by 2020
TX: 500 MW non-wind
NM: triple credit for solar electric
AZ: 4.5% DG by 2025
NV: 1% solar by 2015;2.4 to 2.45 multiplier for PV
MD: double credit for solar electric
CO: 0.4% solar electric by 2015
DC: 0.386% solar electric by 2022
NY: 0.1542% customer-sited by 2013
DE: triple credit for solar electric
Solar water heating counts towards solar set-aside
WA: double credit for DG
DG: Distributed Generation
NJ: 2.12% solar electric by 2021

28
www.seia.org
200735 MWsExisting, subsidy underutilized, need some rule changesNortheast States
$35B market
~7,200 MWs
Solar balances rural central generation from Wind, Geo, etcTotals
2007+300 MWsExisting programs, generally small. Need some work on interconnection, net metering, customer awareness, low rebates
AK, DE, FL, IL, MN, MI, MT, NM, OH, OR
Current55 MWsHigh electricity prices, smaller systems, state tax creditsHawaii
Current1,500 MWsProgram increased to 1,500 MWs, rules in place by end of 2007New Jersey
2007200 MWs$500MM legislation going through legislature, Austin 100 MWTexas
Current750 MWsPassed RPS, announced $200MM additional dollarPennsylvania
Current35 MWsReauthorized 35% Tax Credit, $2.5m cap through 2011North Carolina
200725 MWsPassed RPS, more legislation coming, program start by 2008New York
Current145 MWsPassed RPS, current program needs to be fixedNevada
200830 MWsPassed RPS, putting rules in place by end of 2007DC
200650 MWsPassed RPS, started program, looking to double RPSColorado
20073,000 MWsIOU program is place, municipal program in place by end of 2007California
20071,000 MWsACC has secured funding, final rules in place by end of 2007Arizona
Yr to Start Program
MarketsizeThru 2015
StatusState

29
www.seia.org
EPAct 2005
First Residential Tax Credit in 20 Years• 30% capped at $2,000• Available for PV and DSWH• Only 2 years
Expands Commercial Credit• 30%, no cap• Covers all equipment and
installation costs• Available for all technologies• Only 2 years

30
www.seia.org
Securing America’s Energy Independence Act (HR 550, S 590)
• Provisions– Extend the Federal tax credits to 10 years
(through 2016)
– Thermal remains at 30%
– PV credit modified to fixed $/W• $3.00/watt
– Remove the residential cap of $2,000
– Provide AMT relief
– Provide 3-year accelerated depreciation
– Retroactive to January 1, 2007

31
www.seia.org
Securing America’s Energy Independence Act (HR 550, S 590)
• Industry activities– Expanded staff– Hired tax lobby firm– Engaged industry, expanded government affairs committee– Created a national grassroots campaign
• Action alert• Targeted local media buy
– Initiated a paid media campaign
• For the Action Alert, Talking Points and Fact Sheets:WWW.SEIA.ORG

32
www.seia.org
Solar Right’s Act
• Remove market barriers nationwide– Create national interconnection standards– Require retail net metering in all 50 states– Remove restrictive homeowner association covenants– Prevent exploitative permitting fees– Encourage solar-friendly rate structures– Facilitate REC ownership and exchanges
• Additional incentives– Remove utility exemption from ITC– Create tax credit for manufacturing facilities in the US
• Still under development, original co-sponsors in House and Senate identified
Jigar Shah
SunEdison, LLC

3/8/2007 34
Jigar Shah, CEOSun Edison LLC
February 07
The Coming “Solar Decade”
Preparing your electricity market forCost-effective distributed solar energy

3/8/2007 35
Insights on grid parity
Energy Cost are going up!– “Gas production has peaked in North America"
CEO - Exxon Mobil, Lee Raymond - Reuters Energy Summit 6/21/05– “Over the past year, that Great Britain and the United States each invested
roughly $800 million in electricity transmission; but the American grid is 15 times larger than the British one” Financial Times 8/18/03
– “In less than two years, the price of coal from the Eastern fields that start a couple of hundred miles south and west of Washington has climbed from a range of $25 to $28 a ton to $50 to $60 a ton.”Washington Post 4/11/05
– Double digit rate increases in AZ, CA, CO, CT, HI, MD, MA, NJ, NV– US needs 20 GWs annually – this can and will come mostly from renewables
• Represents about a 2% increase per annum• US needs more peaking capacity, NOT baseload• US has still not invested enough in Transmission & Distribution• Utilities are turning to expensive technologies because it is what they know

3/8/2007 36
Challenges to grid parity
• Cost of Solar panels– Qcell, Suntech, others have announced cost reductions of 50%
expected by 2010 for traditional crystalline– First Solar announced costs have dropped to less than $1.35/Wp
• Finding labor– To install 10,000 MWs of solar by 2012 we will need 40,000
additional job-years, maybe 10,000 NEW people in the solar industry– Sales, marketing, finance, accounting, construction, safety, quality
• Leveling the playing fieldNo standby charges (Net metering)Streamlined Utility InterconnectionIncentives tied to the Value of Distributed GenerationFair Utility Rate Design

3/8/2007 37
What SunEdison is doing: Getting Ready
• Vision:– Make solar a meaningful worldwide energy source– Deliver electricity at or below existing retail prices
• Make it easier to switch: First provider to offer solar energy as a turn-key service– No capital outlays– No impact on existing services– No ongoing customer maintenance costs
• Gain Scale: Largest solar energy service provider in North America– Over 30MWs of 100% renewable electricity installed since 2004– Largest solar panel purchases for the US market– 160 Employees in 5 offices (California, Colorado, New Jersey, and Maryland)
• Raise Financing: Strongest financial position of any solar services provider – Over $180M in arranged shelf financing– Over $30M in equity financing

3/8/2007 38
What SunEdison is doing
• Assessing the value of solar to utilities and consumers:– Ratepayers, Utility, Industry, State/Local gov’t, Federal gov’t– Utility savings: Energy, Capacity, T&D Investment, Reliability– Local Economic Development: Tax Revenue– Environmental Benefits: particulate emissions, water usage, etc
• Debunking Myths– US has the lowest energy prices among OECD countries– There is not enough space to supply the nation with solar power– Solar power will always need incentives– Solar power makes the grid unstable– Solar power is maintenance-free– Coal is a low cost, stable energy source– Nuclear energy is the lowest cost energy source
• Developing a supply/demand curve– For solar to grow folks need to continue to invest, for this to happen we
have to show that there is demand for the product – more than just studies

Question 1:
How important is achieving grid parity, what price per installed Watt does that represent,
and when will we get there?
What are the best tools (other than the ones you are currently pursuing) to accelerate the
point of crossover?
Higher Efficiency – Manufacturing Scale – Vertical Integration Next-generation Technologies – Policy and Incentives
Financial Innovation – New Business Models

Question 2:
What would slow the achievement of grid-parity?
What economic risks persist for wider commercialization of distributed solar?

Question 3:
What opportunities exist in financialinnovation to accelerate grid-parity?
What opportunities exist in delivery innovation to accelerate grid-parity?
(e.g. Building-integrated PV, New Construction vs. Retrofit)

Question 4:
How are emerging low-cost global producersgoing to impact the drive to grid-parity?
How are non-US customers and government incentive programs going to impact the drive
to grid-parity in the US?

Question 5:
Beyond economics, what are the remaining obstacles to faster deployment of PV?
How will they be addressed?

Question 6:
How will solar at grid-parity impact the broader energy and electricity market?

Audience Questions:
MIT Energy Conference 2007 -Solar Power: A Path to Grid Parity?
Moderator - Travis Bradford, President, Prometheus Institute
1. Manufacturing - Dick Swanson, President and CTO SunPower 2. Technology - Charlie Gay, VP & GM Solar Group, Applied Materials3. Policy - Rhone Resch, President SEIA 4. Financing/Integration - Jigar Shah, CEO SunEdison
Special Thanks to the student organizers: Keith Peltzman - Eerik Hantsoo - Joel Conkling - Anthony Fotopoulos - Carlos Molina
Recommended