Social Fabric of CanadaSocial Fabric of Canada
Dr. Walter Dorn30 September 2010

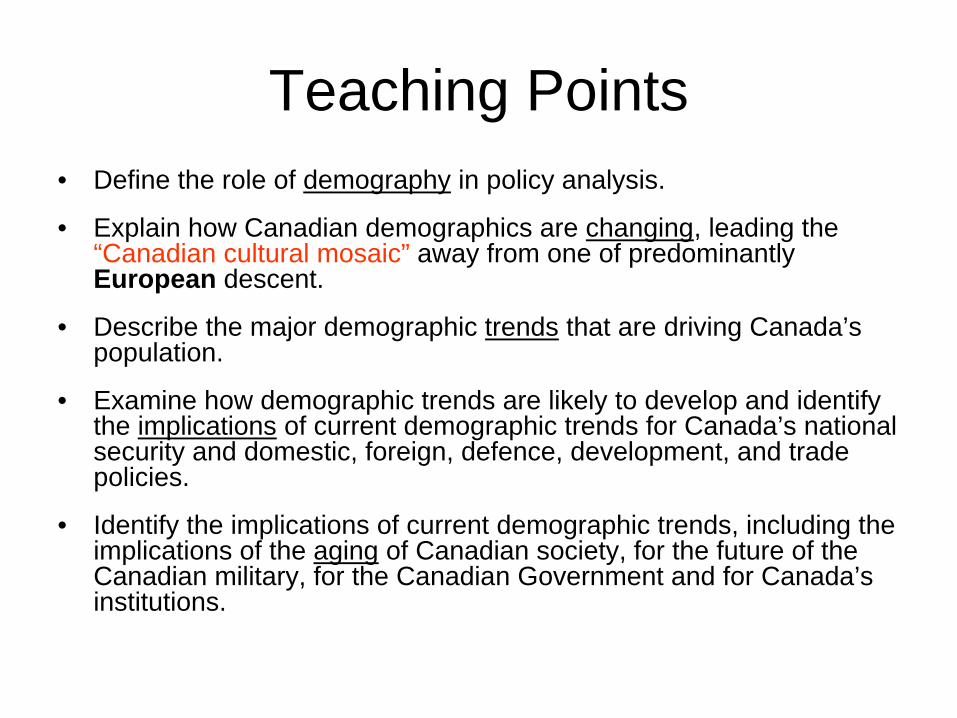
Teaching Points• Define the role of demography in policy analysis.
• Explain how Canadian demographics are changing, leading the “Canadian cultural mosaic” away from one of predominantly European descent.
• Describe the major demographic trends that are driving Canada’s population.
• Examine how demographic trends are likely to develop and identify the implications of current demographic trends for Canada’s national security and domestic, foreign, defence, development, and trade policies.
• Identify the implications of current demographic trends, including the implications of the aging of Canadian society, for the future of the Canadian military, for the Canadian Government and for Canada’s institutions.

Demography is the …
“study of population—its size, growth, distribution, composition, fertility, mortality and migration.”
– Roderic Beaujot and Don Kerr, Population Change in Canada
“study of the statistics of births, deaths, disease, etc., as illustrating the conditions of life in communities”
– Concise OED
Importance for a democracy
• National integrity• Who is in power • Government policies• Government actions
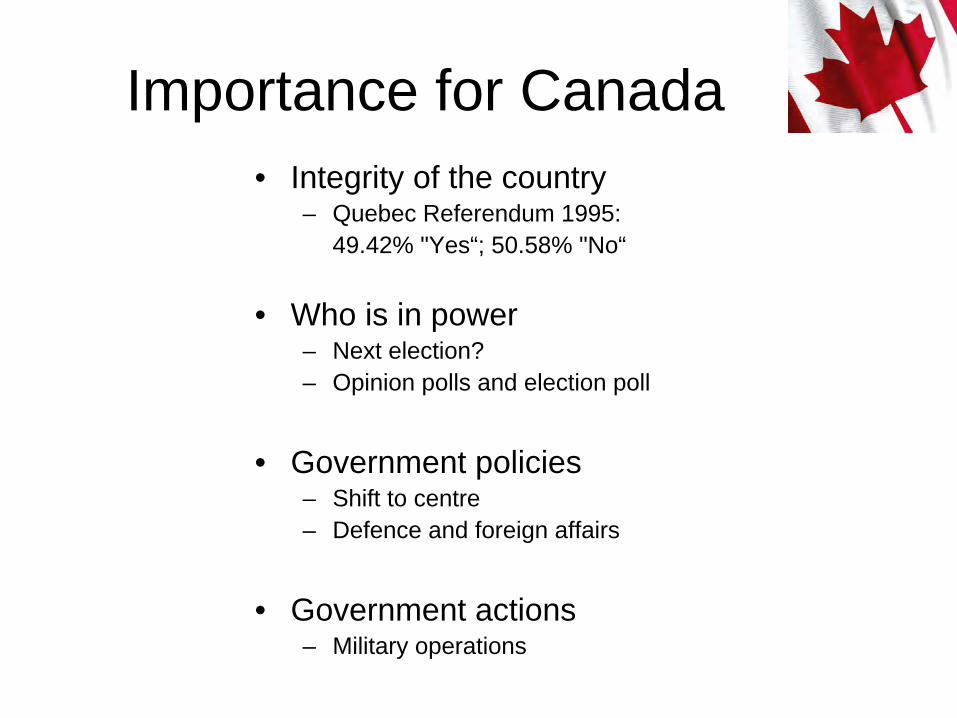
Importance for Canada• Integrity of the country
– Quebec Referendum 1995: 49.42% "Yes“; 50.58% "No“
• Who is in power – Next election?– Opinion polls and election poll
• Government policies– Shift to centre– Defence and foreign affairs
• Government actions– Military operations

Importance for the Individual
• Personal and national history and identity
• Social environment
• Probabilities – Living and dying– Health– Social welfare
Outline
I. Introduction
II. Social fabric in Canadian history
III. Demographics / statistics
IV. Implications, challenges & conclusions

II. Social Fabric in Canadian History

http://firstpeoplesofcanada.com/images/firstnations/paintings/verner_ojibwayfamilyw.jpg
http://www.rideau-info.com/canal/colby2.jpg
http://www.cbc.ca/acadian/images/timeline/early_acadia.jpg
Founding cultures
French
British
Aboriginal(First Peoples)
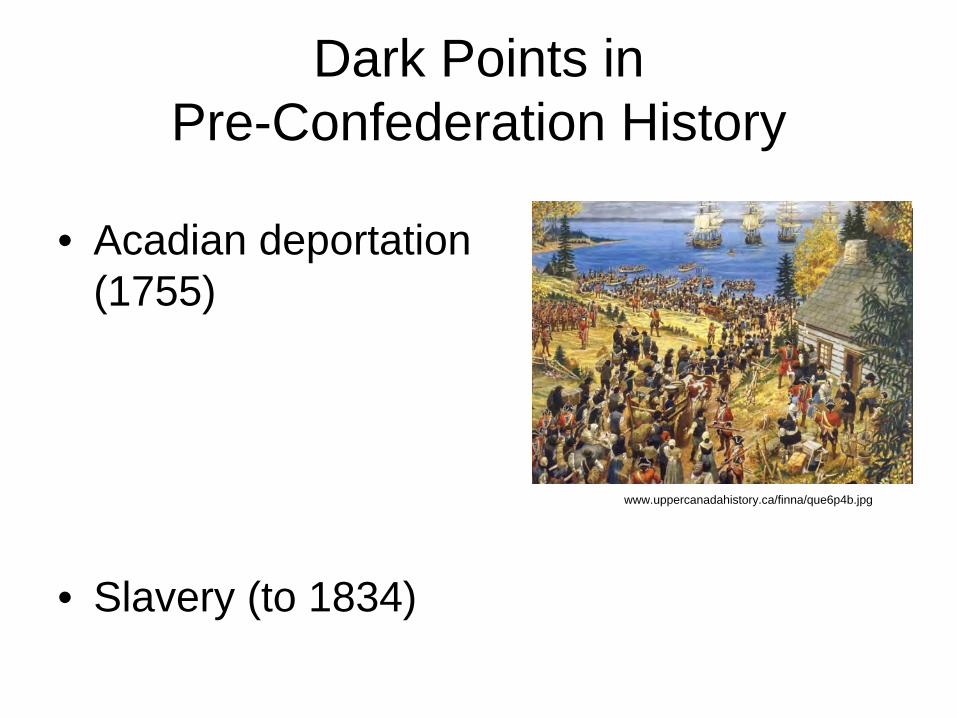
Dark Points in Pre-Confederation History
• Acadian deportation (1755)
• Slavery (to 1834)
www.uppercanadahistory.ca/finna/que6p4b.jpg
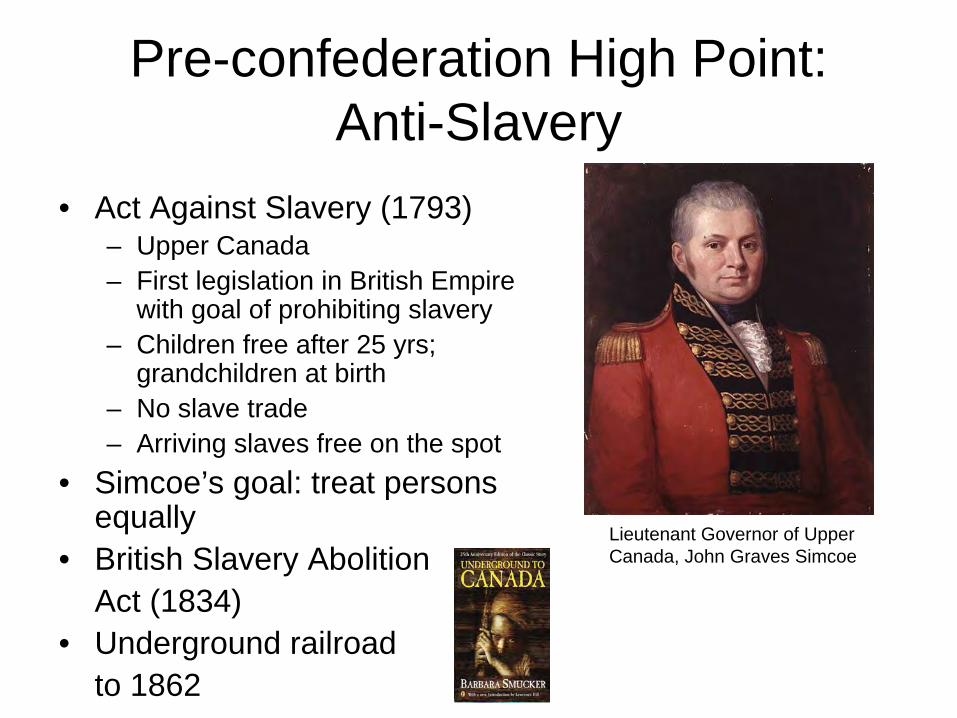
Pre-confederation High Point: Anti-Slavery
• Act Against Slavery (1793)– Upper Canada– First legislation in British Empire
with goal of prohibiting slavery– Children free after 25 yrs;
grandchildren at birth– No slave trade– Arriving slaves free on the spot
• Simcoe’s goal: treat persons equally
• British Slavery Abolition Act (1834)
• Underground railroad to 1862
Lieutenant Governor of Upper Canada, John Graves Simcoe

Population at Confederation (1867)
• Dominion of Canada– Four original provinces
(NB, NS, ON, QE)• Population: 3.4 million
– British Isles: 2.1 million– French: 1.1 million– German: 202,000– Indian: 23,000
(Census 1871)
www65.statcan.gc.ca/acyb02/1947/acyb02_19470117013a-eng.htm
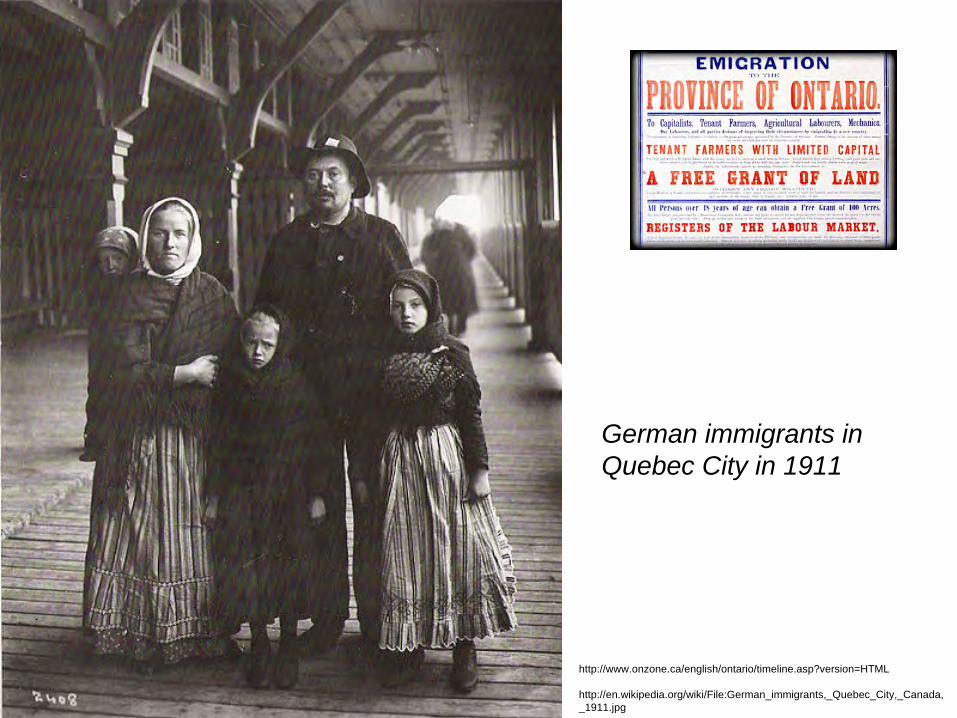
http://www.onzone.ca/english/ontario/timeline.asp?version=HTML
http://en.wikipedia.org/wiki/File:German_immigrants,_Quebec_City,_Canada, _1911.jpg
German immigrants in Quebec City in 1911
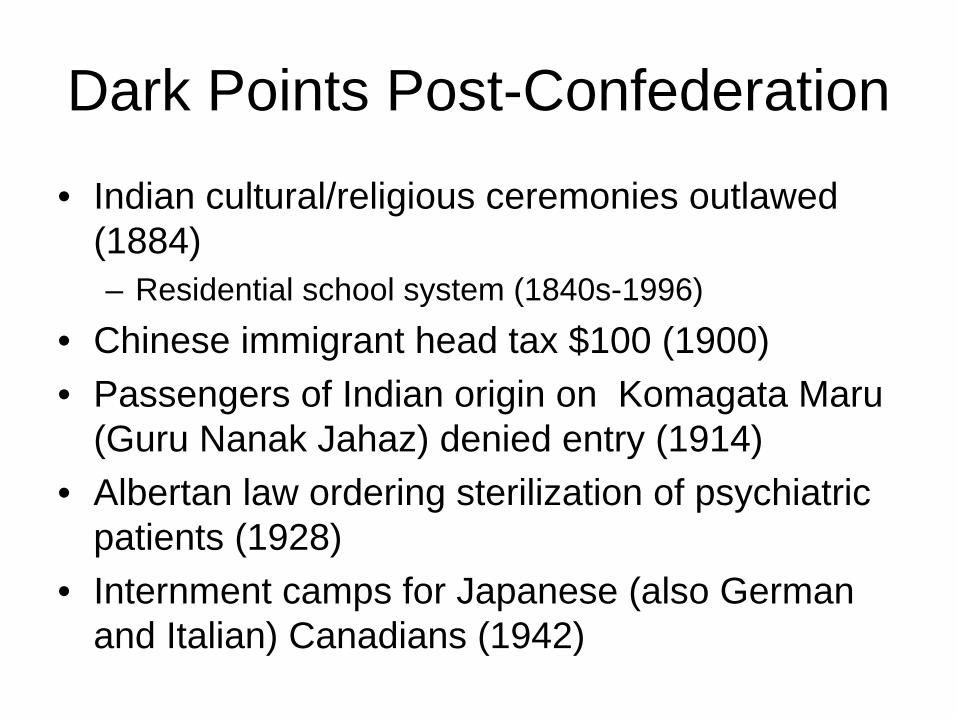
Dark Points Post-Confederation
• Indian cultural/religious ceremonies outlawed (1884)– Residential school system (1840s-1996)
• Chinese immigrant head tax $100 (1900)• Passengers of Indian origin on Komagata Maru
(Guru Nanak Jahaz) denied entry (1914)• Albertan law ordering sterilization of psychiatric
patients (1928)• Internment camps for Japanese (also German
and Italian) Canadians (1942)
Refugees• United Empire loyalists (1783)• Quakers, Mennonites, Doukhobors, Hutterites,
Mormons, Jews (before WW I)• Hungary (1950s), Czechoslovakia (1968)• Americans (late 1960s)• Tibetans, Ugandans, Chileans, Indochinese
(1970s)• Former Yugoslavia, Central America • Africans, Tamils
Nansen Award 1986 to “The "people of Canada"
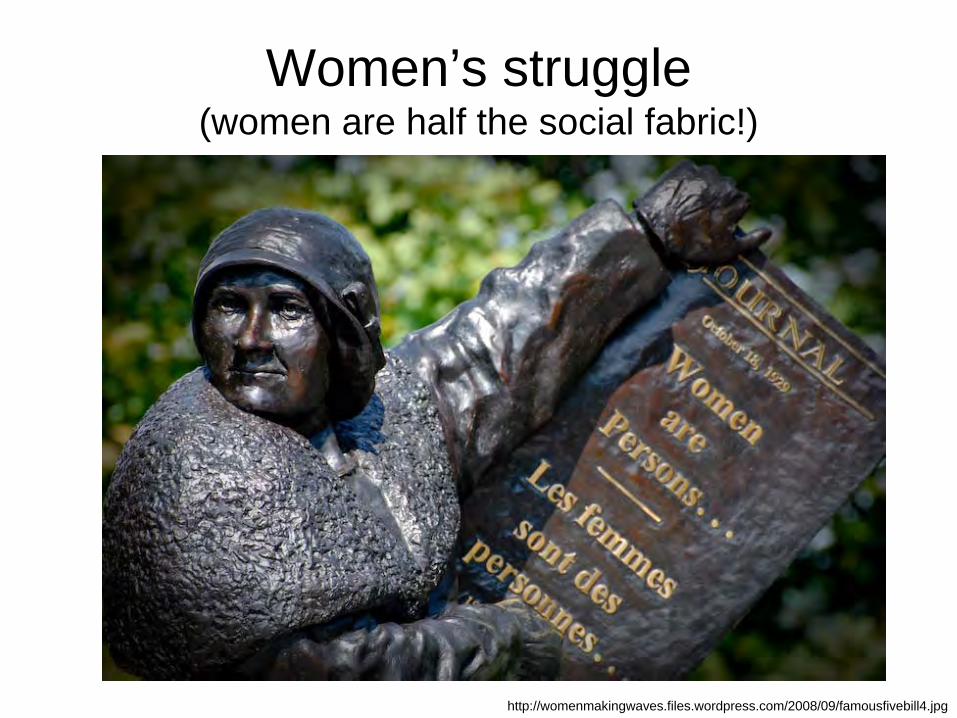
Women’s struggle (women are half the social fabric!)
http://womenmakingwaves.files.wordpress.com/2008/09/famousfivebill4.jpg
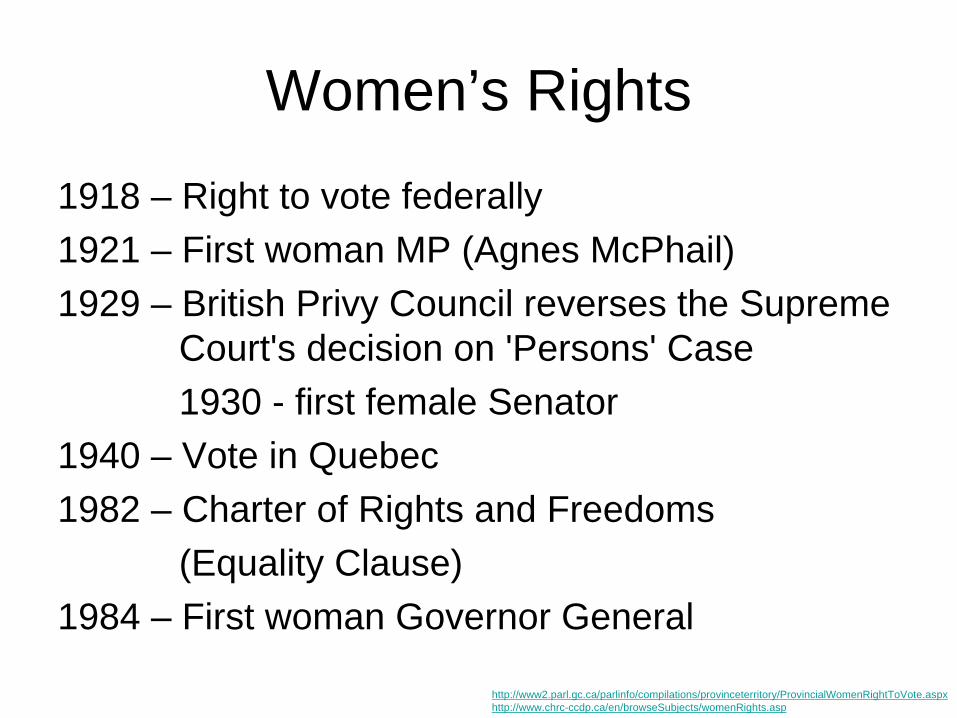
Women’s Rights
1918 – Right to vote federally 1921 – First woman MP (Agnes McPhail) 1929 – British Privy Council reverses the Supreme
Court's decision on 'Persons' Case1930 - first female Senator
1940 – Vote in Quebec1982 – Charter of Rights and Freedoms
(Equality Clause)1984 – First woman Governor General
http://www2.parl.gc.ca/parlinfo/compilations/provinceterritory/ProvincialWomenRightToVote.aspxhttp://www.chrc-ccdp.ca/en/browseSubjects/womenRights.asp


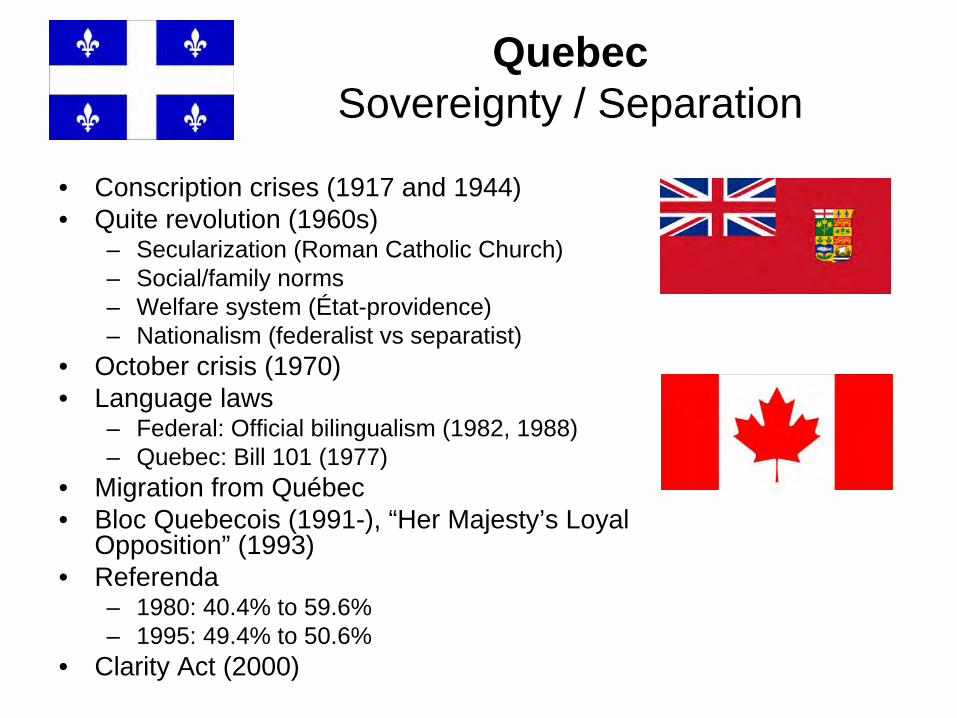
Quebec Sovereignty / Separation
• Conscription crises (1917 and 1944)• Quite revolution (1960s)
– Secularization (Roman Catholic Church)– Social/family norms– Welfare system (État-providence) – Nationalism (federalist vs separatist)
• October crisis (1970)• Language laws
– Federal: Official bilingualism (1982, 1988)– Quebec: Bill 101 (1977)
• Migration from Québec• Bloc Quebecois (1991-), “Her Majesty’s Loyal
Opposition” (1993)• Referenda
– 1980: 40.4% to 59.6%– 1995: 49.4% to 50.6%
• Clarity Act (2000)
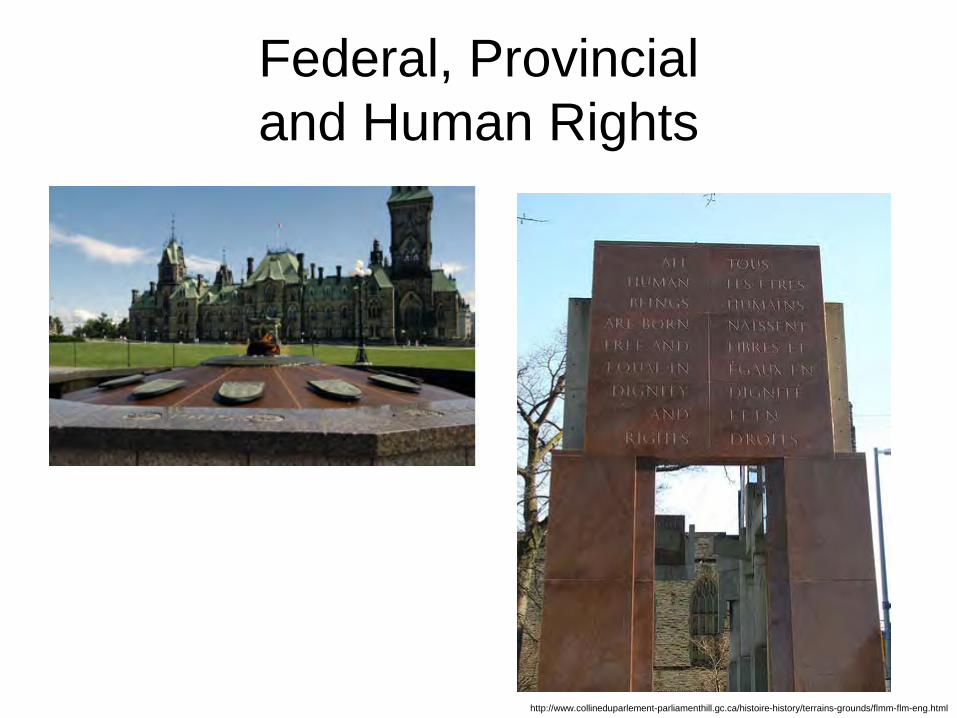
Federal, Provincial and Human Rights
http://www.collineduparlement-parliamenthill.gc.ca/histoire-history/terrains-grounds/flmm-flm-eng.html
Multiculturalism Principle
• Canadian Charter of Rights and Freedoms (Section 27)“This Charter shall be interpreted in a manner consistent with the preservation and enhancement of the multicultural heritage of Canadians.”
• Ministry of Multiculturalism (1973)• Secretary of State, Multiculturalism and
Canadian Identity
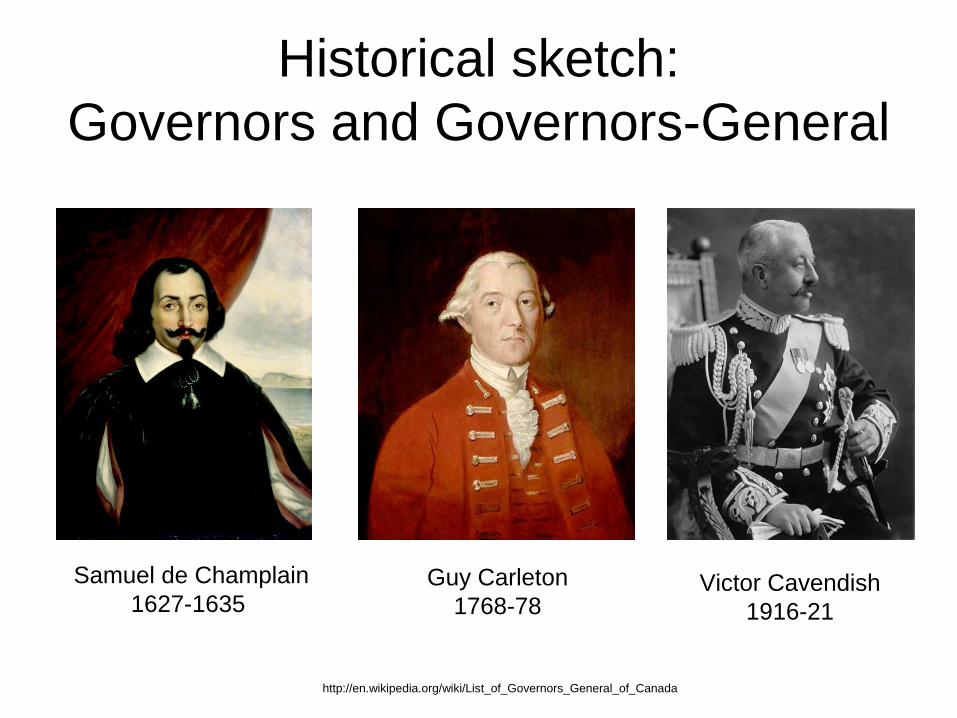
Historical sketch: Governors and Governors-General
Samuel de Champlain1627-1635
Victor Cavendish1916-21
Guy Carleton1768-78
http://en.wikipedia.org/wiki/List_of_Governors_General_of_Canada
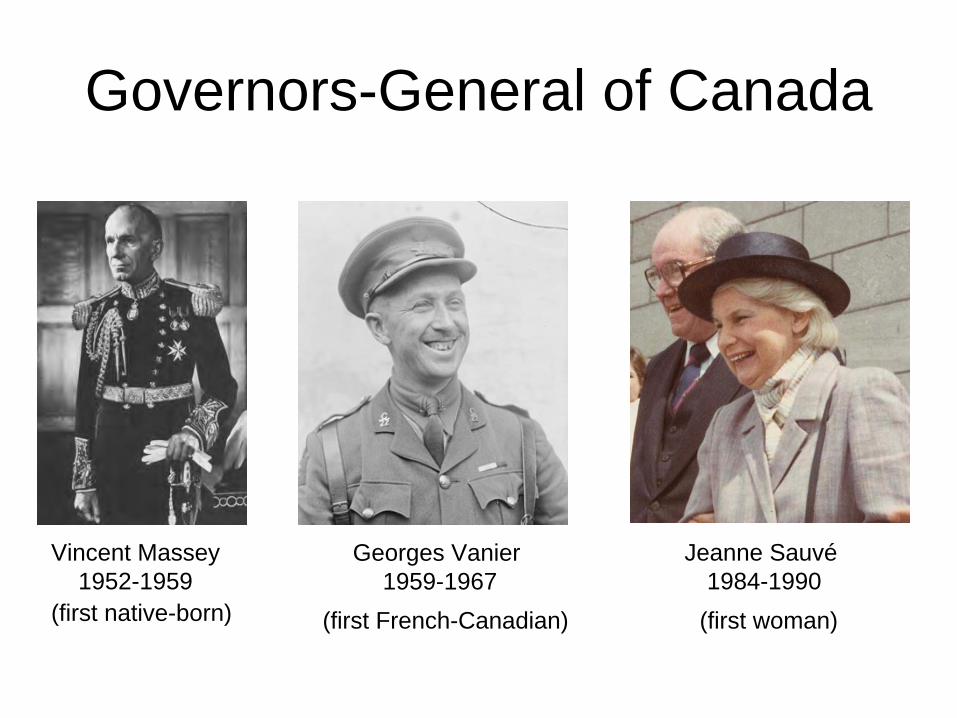
Governors-General of Canada
Georges Vanier 1959-1967
Vincent Massey1952-1959
Jeanne Sauvé1984-1990
(first native-born) (first French-Canadian) (first woman)
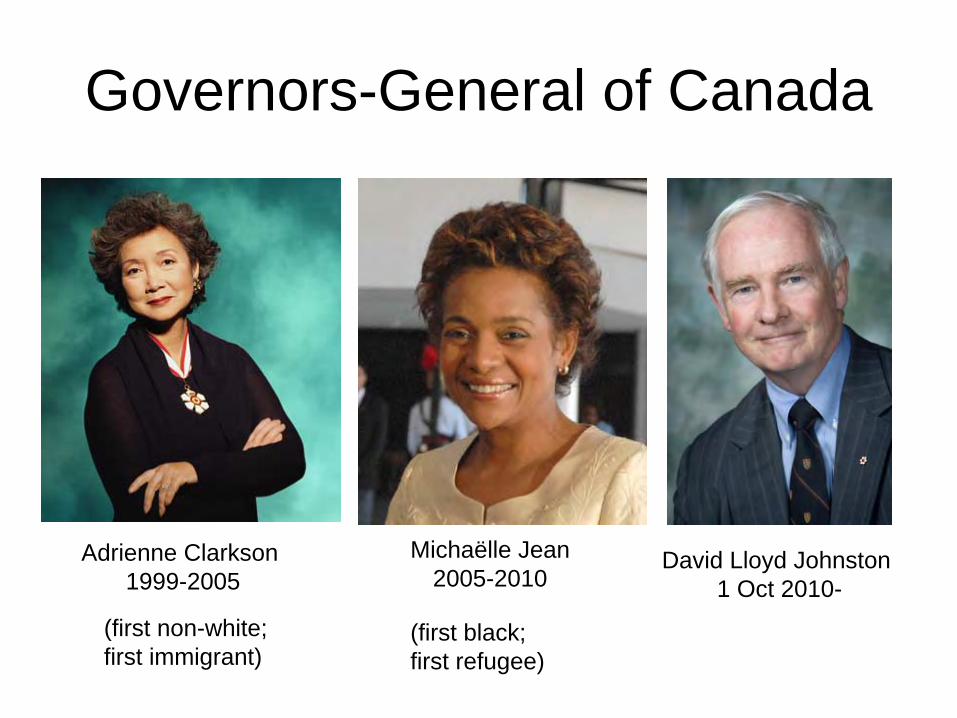
Governors-General of Canada
Michaëlle Jean2005-2010
Adrienne Clarkson 1999-2005
David Lloyd Johnston 1 Oct 2010-
(first non-white;first immigrant)
(first black;first refugee)
III. Demographics / Statistics
Numbers also tell a story
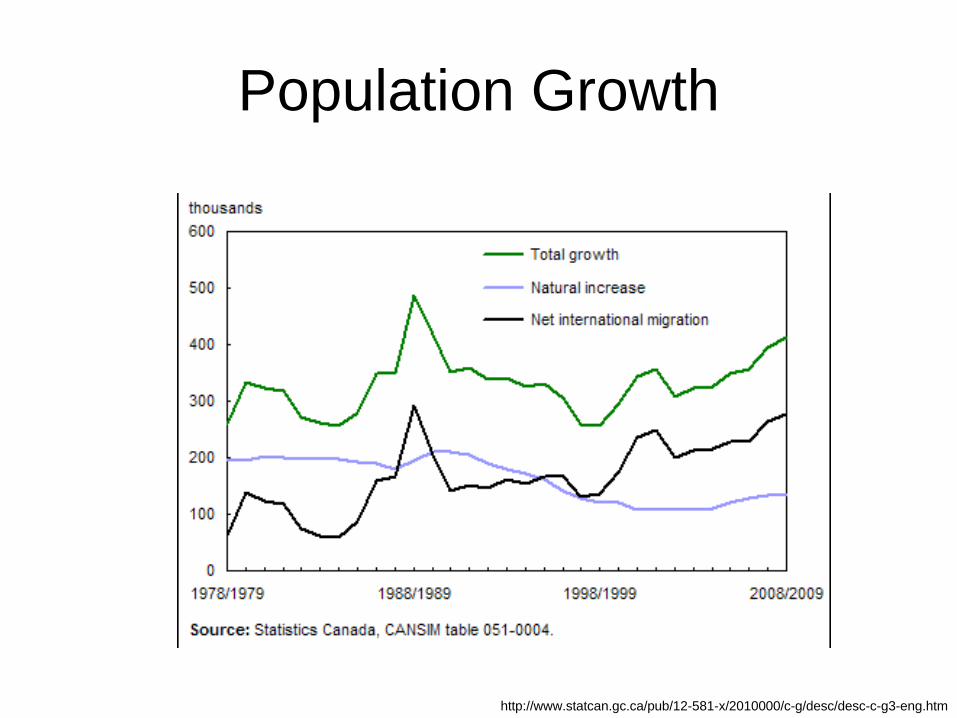
Population Growth
http://www.statcan.gc.ca/pub/12-581-x/2010000/c-g/desc/desc-c-g3-eng.htm
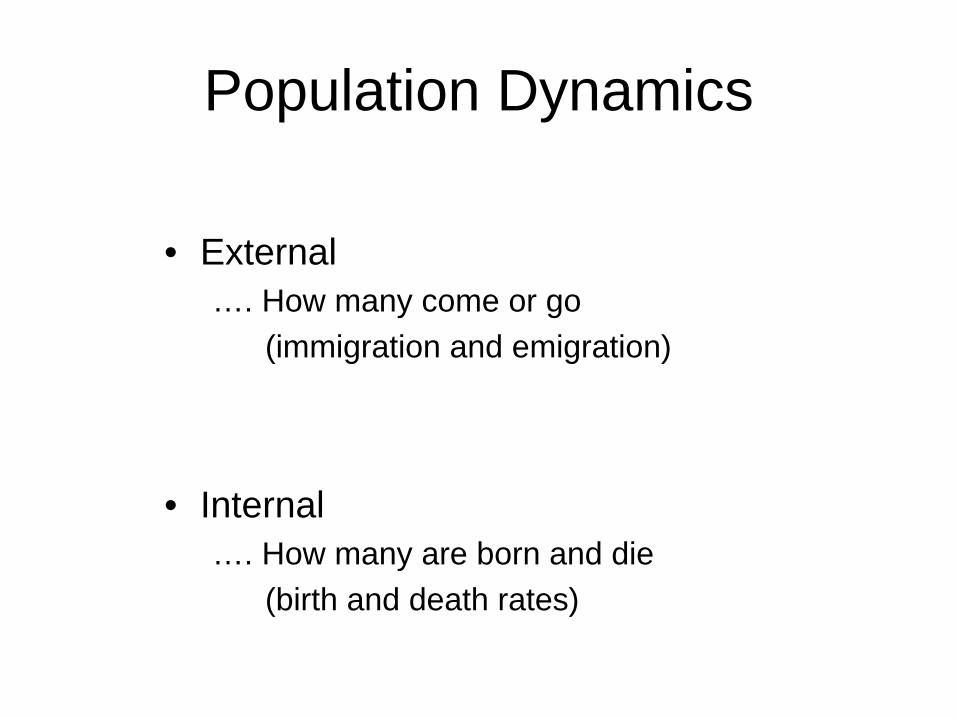
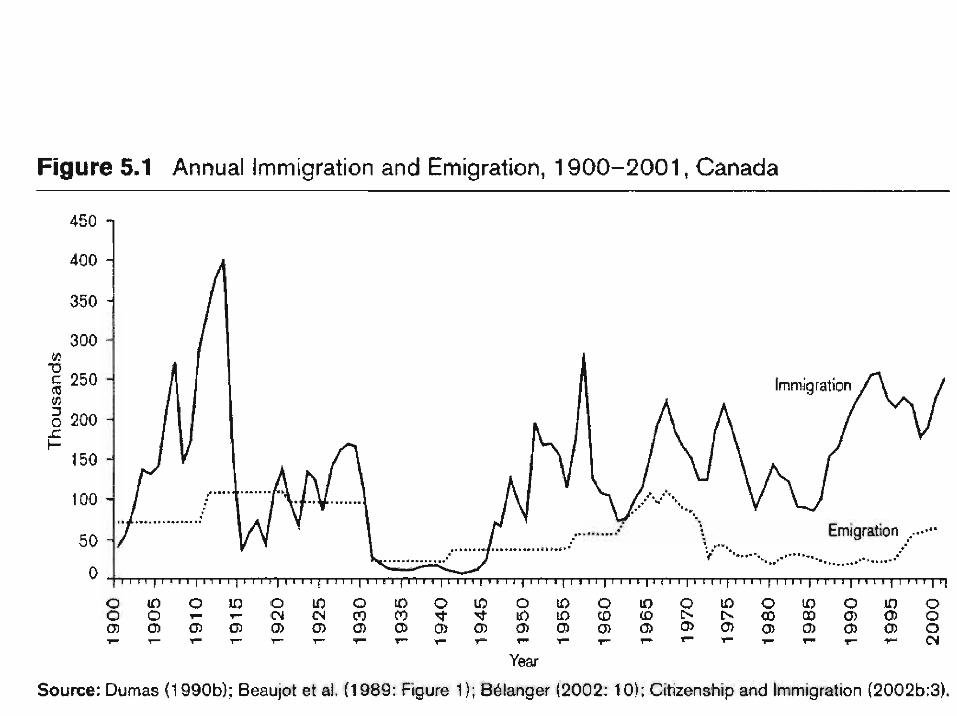
Population Dynamics
• External…. How many come or go
(immigration and emigration)
• Internal …. How many are born and die
(birth and death rates)
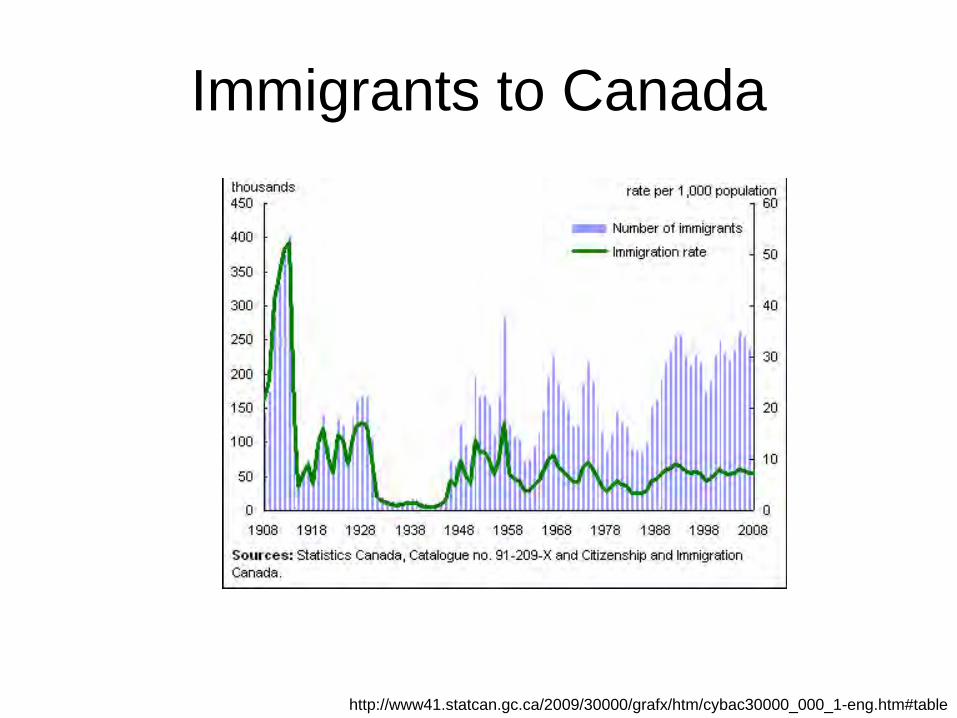
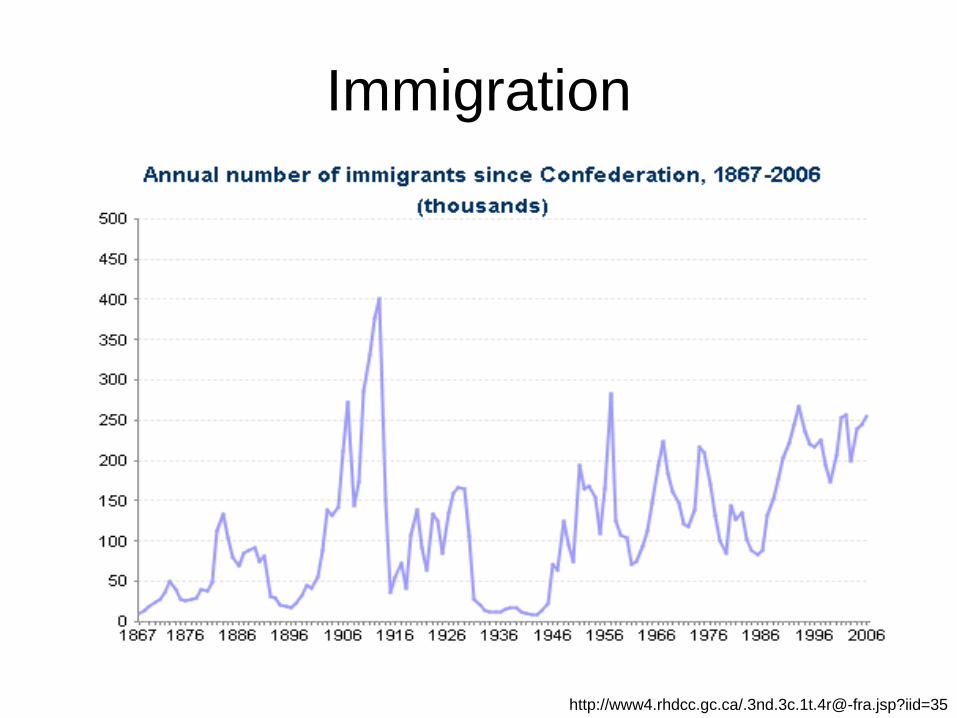
Immigrants to Canada
http://www41.statcan.gc.ca/2009/30000/grafx/htm/cybac30000_000_1-eng.htm#table
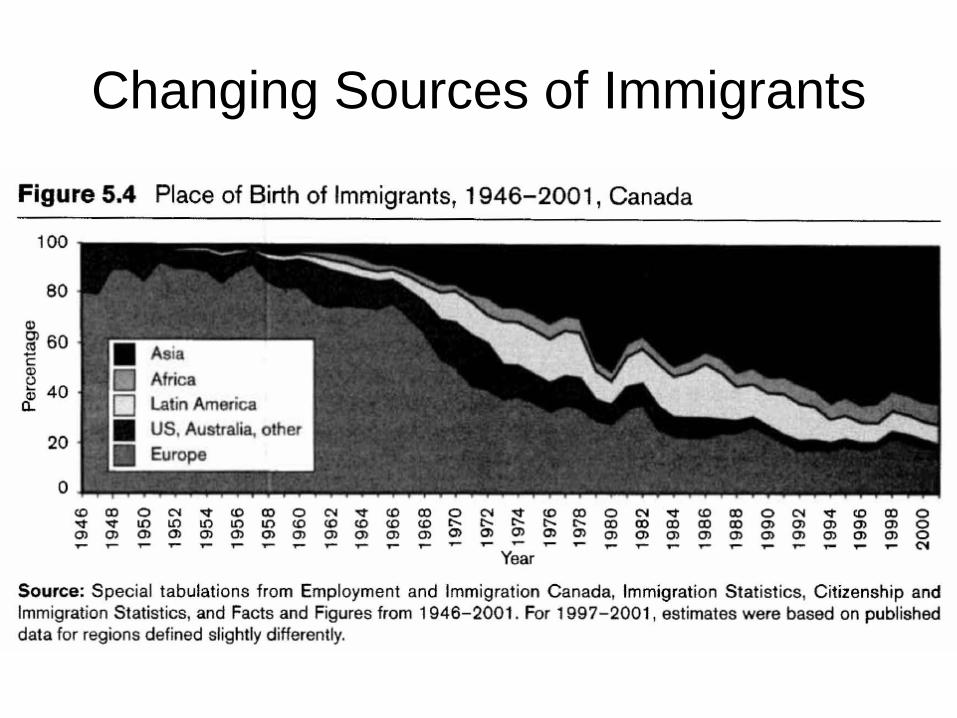
Changing Sources of Immigrants
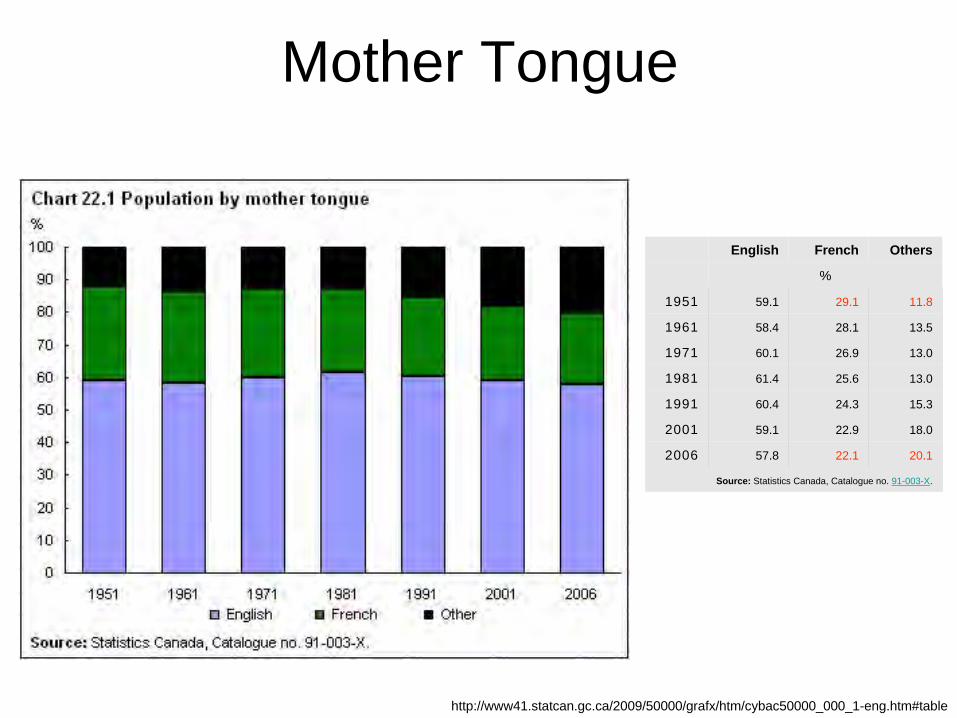
Mother Tongue
http://www41.statcan.gc.ca/2009/50000/grafx/htm/cybac50000_000_1-eng.htm#table
English French Others
%
1951 59.1 29.1 11.8
1961 58.4 28.1 13.5
1971 60.1 26.9 13.0
1981 61.4 25.6 13.0
1991 60.4 24.3 15.3
2001 59.1 22.9 18.0
2006 57.8 22.1 20.1
Source: Statistics Canada, Catalogue no. 91-003-X.
Immigration Rates
• one of the highest rates per capita in the world, driven by economic policy and family reunification.
• "in the early 1990s, the old Reform Party was branded 'racist' for suggesting that immigration levels be lowered from 250,000 to 150,000.”
– Globe and Mail

Immigrants
• 20% of total population (2006)• By province:
– Ontario 28.3 % – British Columbia 27.5– Alberta 16.2– Manitoba 13.3– Quebec 11.5– Yukon 10– Other under 10%
http://www41.statcan.gc.ca/2009/30000/tbl/cybac30000_2009_000_t01-eng.htm
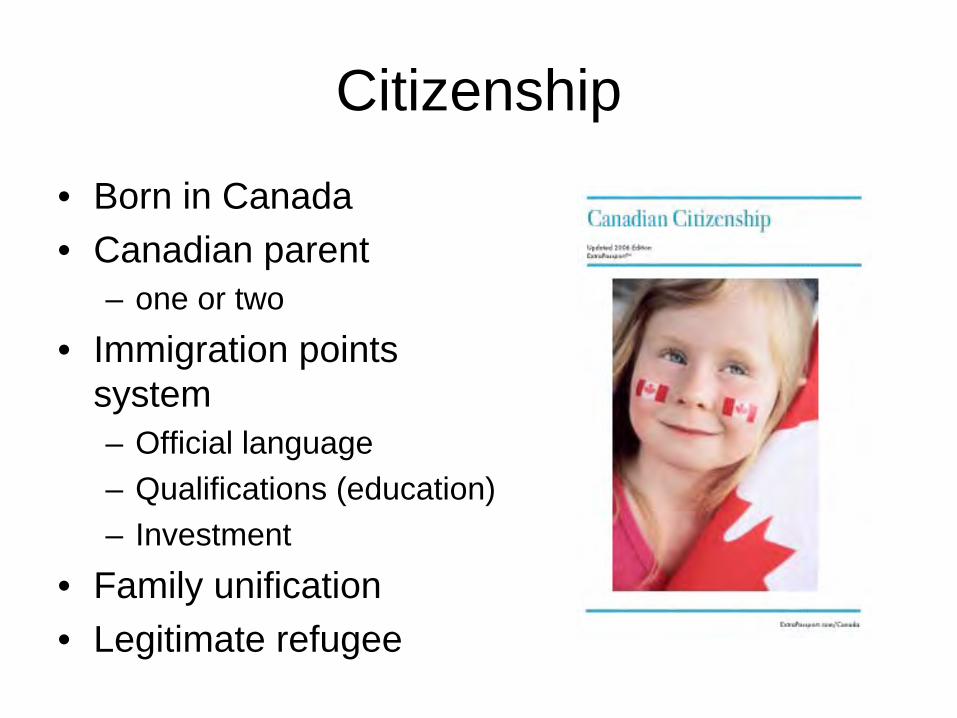
Citizenship
• Born in Canada • Canadian parent
– one or two• Immigration points
system– Official language– Qualifications (education)– Investment
• Family unification• Legitimate refugee
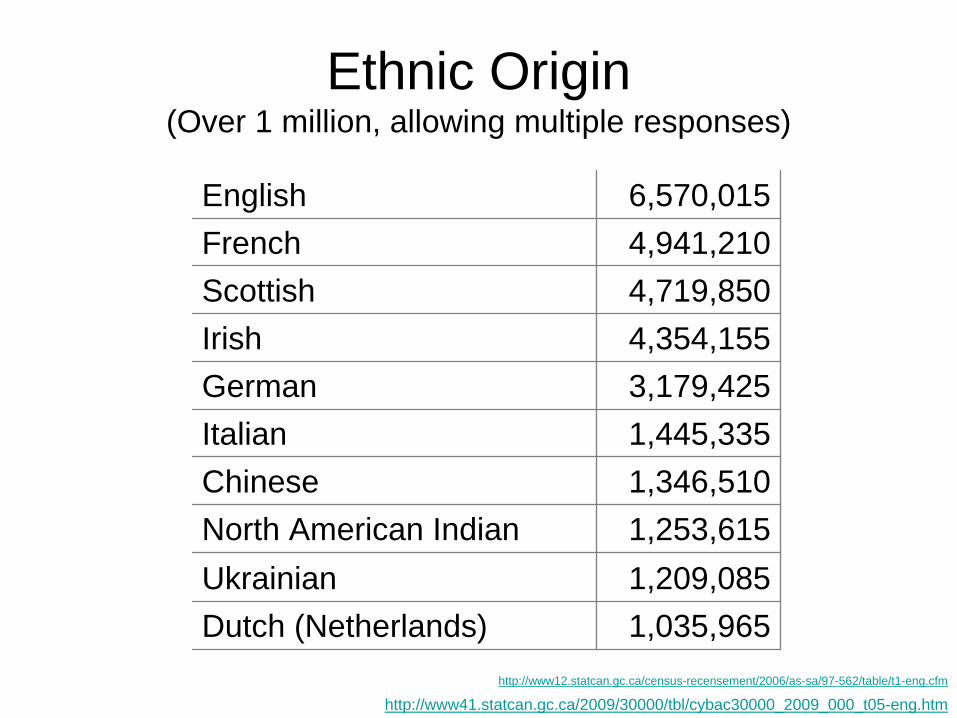
Ethnic Origin (Over 1 million, allowing multiple responses)
English 6,570,015French 4,941,210Scottish 4,719,850Irish 4,354,155German 3,179,425Italian 1,445,335Chinese 1,346,510North American Indian 1,253,615Ukrainian 1,209,085Dutch (Netherlands) 1,035,965
http://www41.statcan.gc.ca/2009/30000/tbl/cybac30000_2009_000_t05-eng.htmhttp://www12.statcan.gc.ca/census-recensement/2006/as-sa/97-562/table/t1-eng.cfm

Canadian Population
Religion:• Roman Catholic 43.6%, Protestant 29.2%, other Christian 4.3% • Muslim 2.0%• Jewish 1.1%• Buddhist 1.0%• Hindu 1.0% • other 1.3% • none 16.5%
Ethnicity: British/Irish 28%, French 23%, other European 15%, Asian/Arab/African 6%, indigenous Amerindian 2%, mixed background 26%.
Language: English (official) 57.8%, French (official) 22.1%, other 20.1% (including Chinese and aboriginal languages).
(2008)
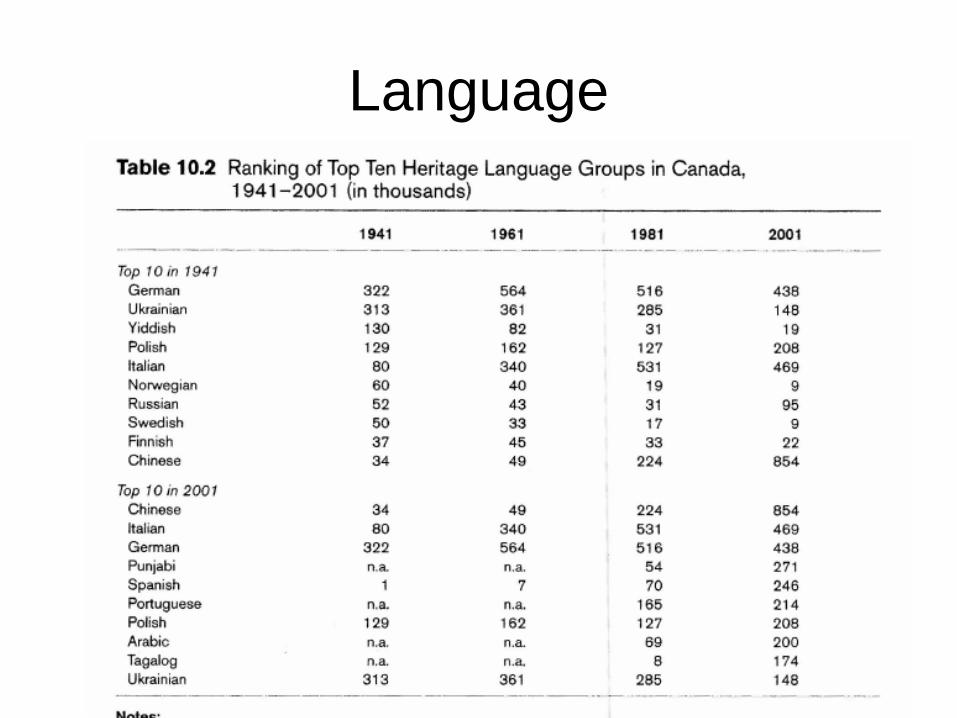
Language
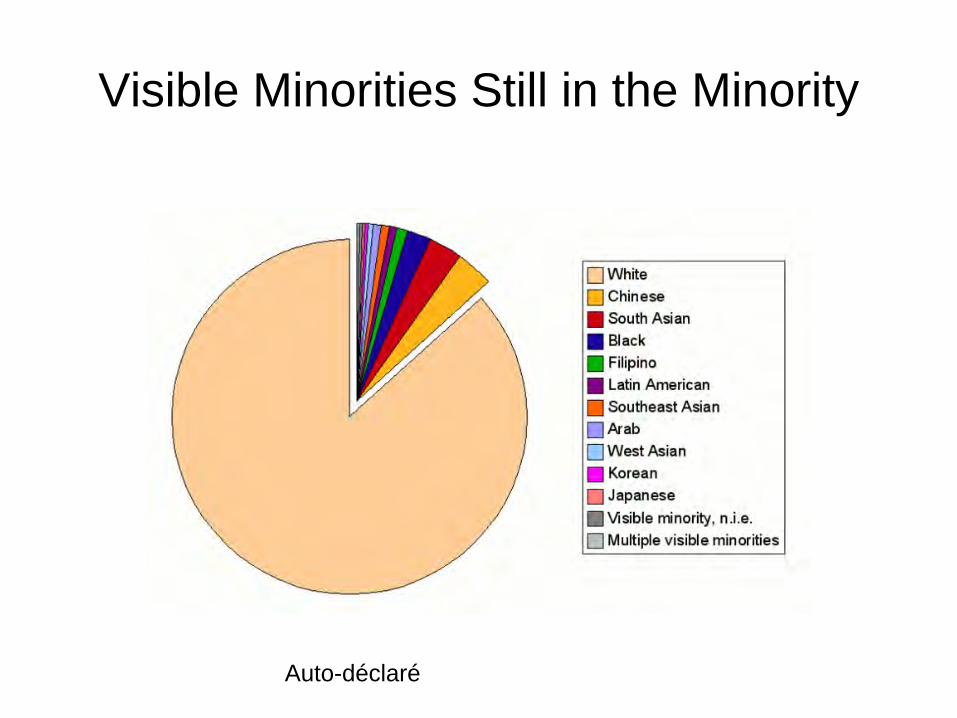
Visible Minorities Still in the Minority
Auto-déclaré
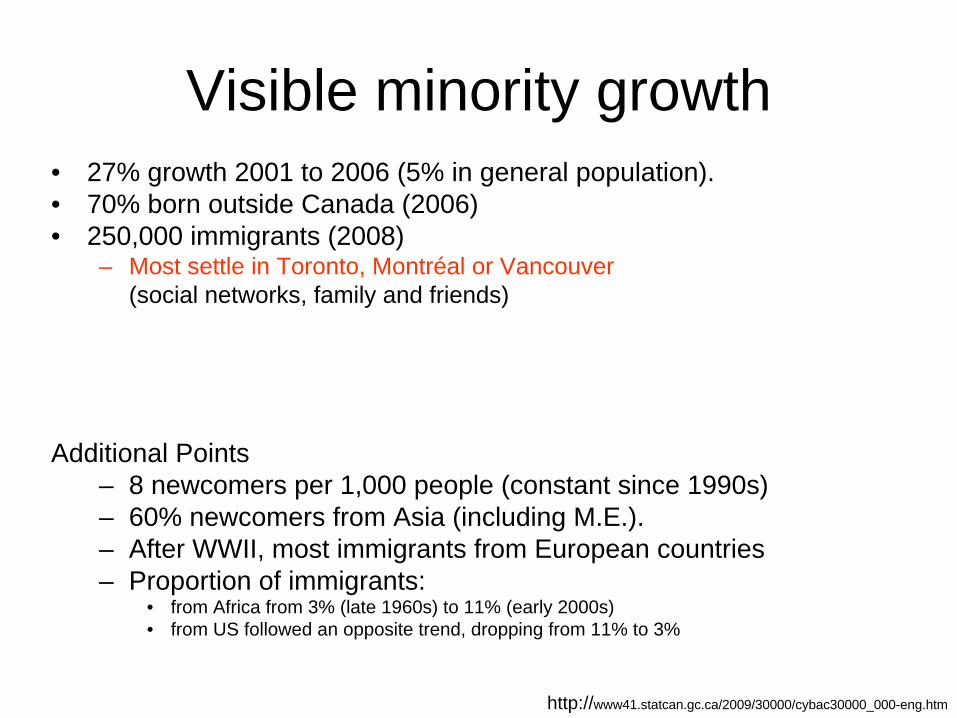
Visible minority growth• 27% growth 2001 to 2006 (5% in general population). • 70% born outside Canada (2006)• 250,000 immigrants (2008)
– Most settle in Toronto, Montréal or Vancouver(social networks, family and friends)
Additional Points– 8 newcomers per 1,000 people (constant since 1990s)– 60% newcomers from Asia (including M.E.). – After WWII, most immigrants from European countries – Proportion of immigrants:
• from Africa from 3% (late 1960s) to 11% (early 2000s)• from US followed an opposite trend, dropping from 11% to 3%
http://www41.statcan.gc.ca/2009/30000/cybac30000_000-eng.htm

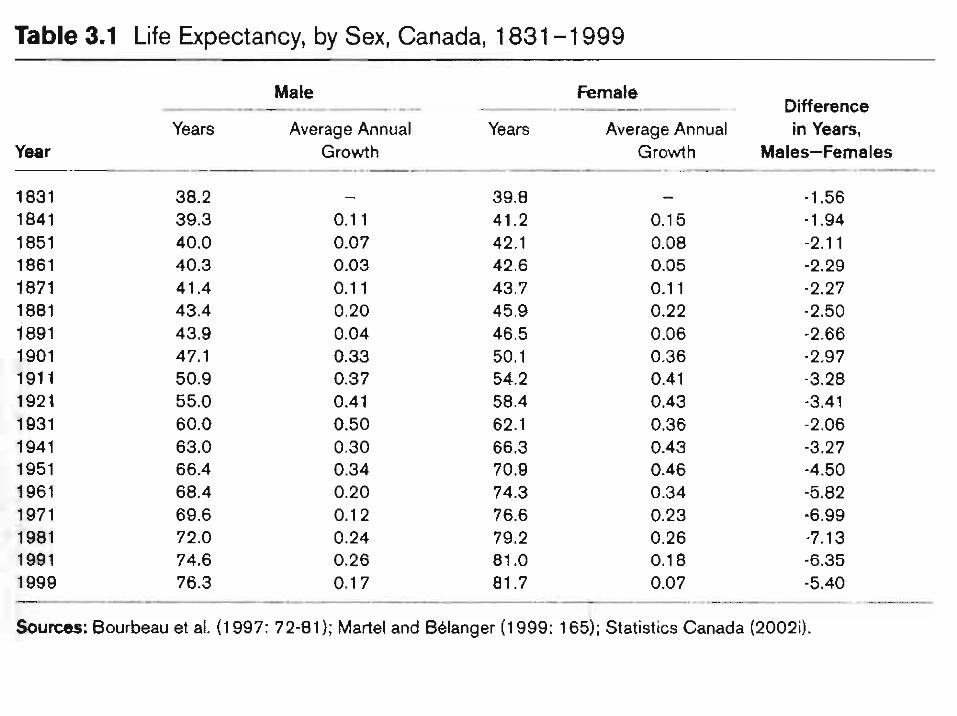
Birth and Death within Canada

Life expectancy• New France: 30-35 years• 1867: 42 years• 1901: 48 years• 1951: 68 years• 2001: 77 years• 2010: 81 years
• Female more likely to live 5 years longer.
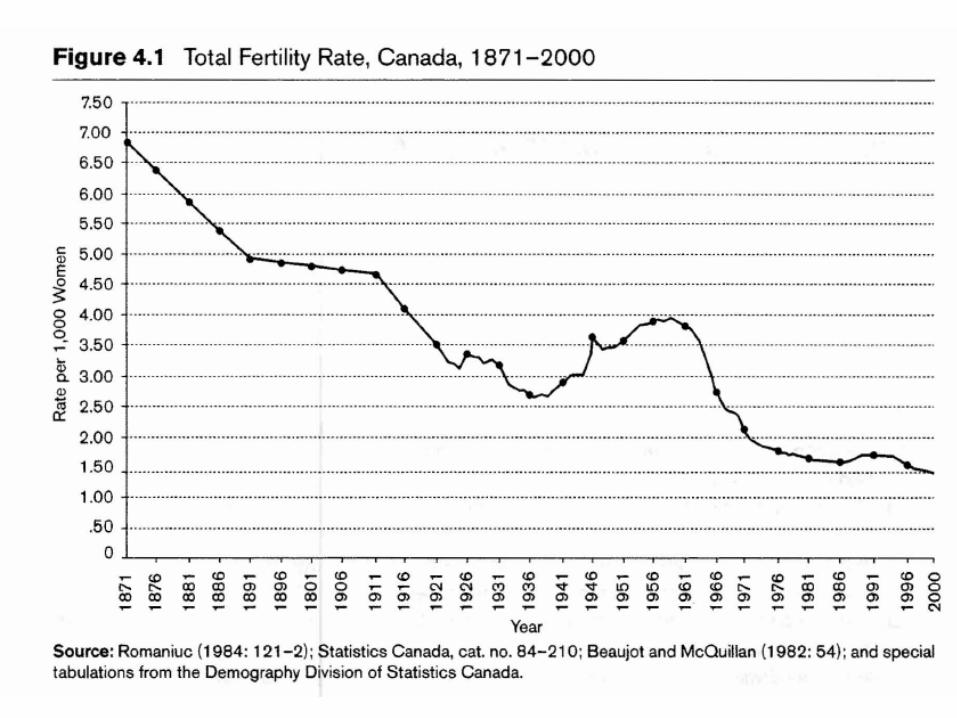
Fertility Rate

http://www.statcan.gc.ca/pub/12-581-x/2010000/c-g/desc/desc-c-g4-eng.htm
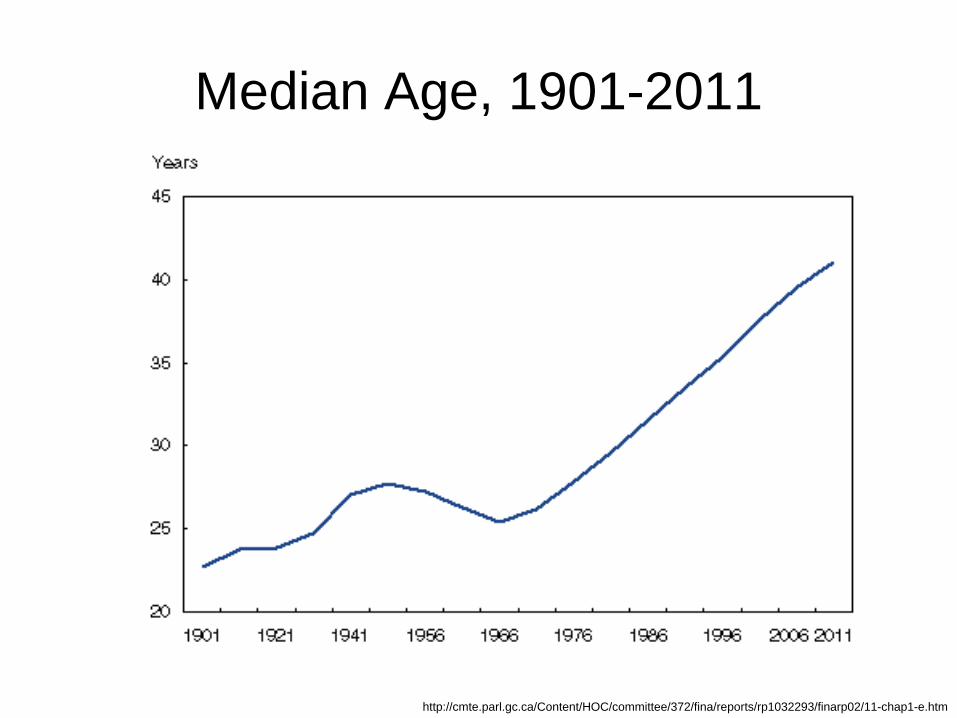
Median Age, 1901-2011
http://cmte.parl.gc.ca/Content/HOC/committee/372/fina/reports/rp1032293/finarp02/11-chap1-e.htm
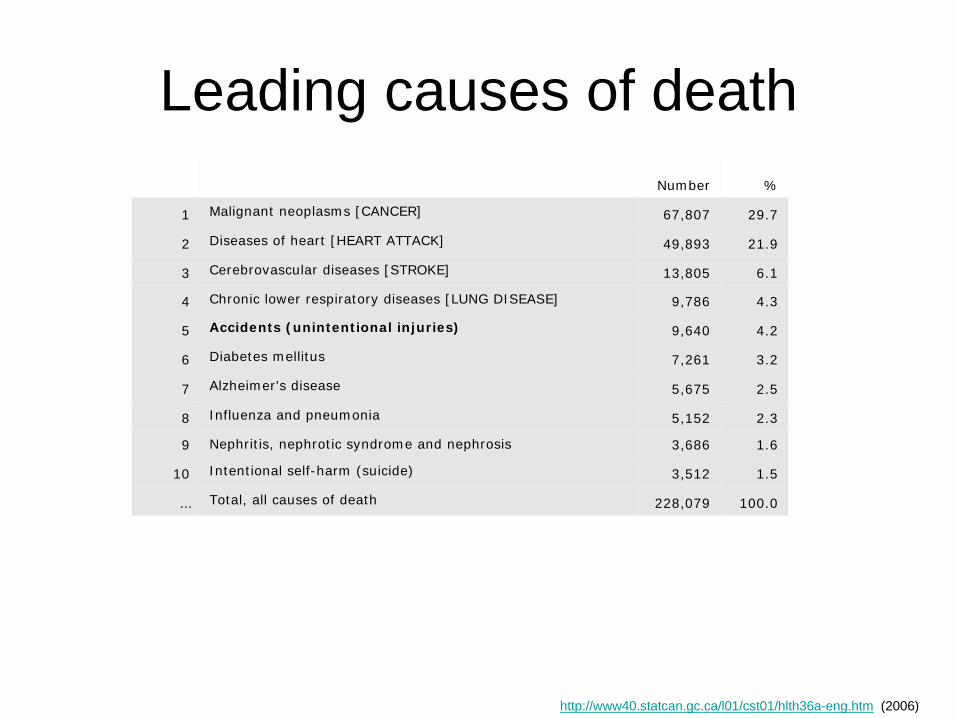
Leading causes of deathNumber %
1 Malignant neoplasms [CANCER] 67,807 29.7
2 Diseases of heart [HEART ATTACK] 49,893 21.9
3 Cerebrovascular diseases [STROKE] 13,805 6.1
4 Chronic lower respiratory diseases [LUNG DISEASE] 9,786 4.3
5 Accidents (unintentional injuries) 9,640 4.2
6 Diabetes mellitus 7,261 3.2
7 Alzheimer's disease 5,675 2.5
8 Influenza and pneumonia 5,152 2.3
9 Nephritis, nephrotic syndrome and nephrosis 3,686 1.6
10 Intentional self-harm (suicide) 3,512 1.5
… Total, all causes of death 228,079 100.0
http://www40.statcan.gc.ca/l01/cst01/hlth36a-eng.htm (2006)
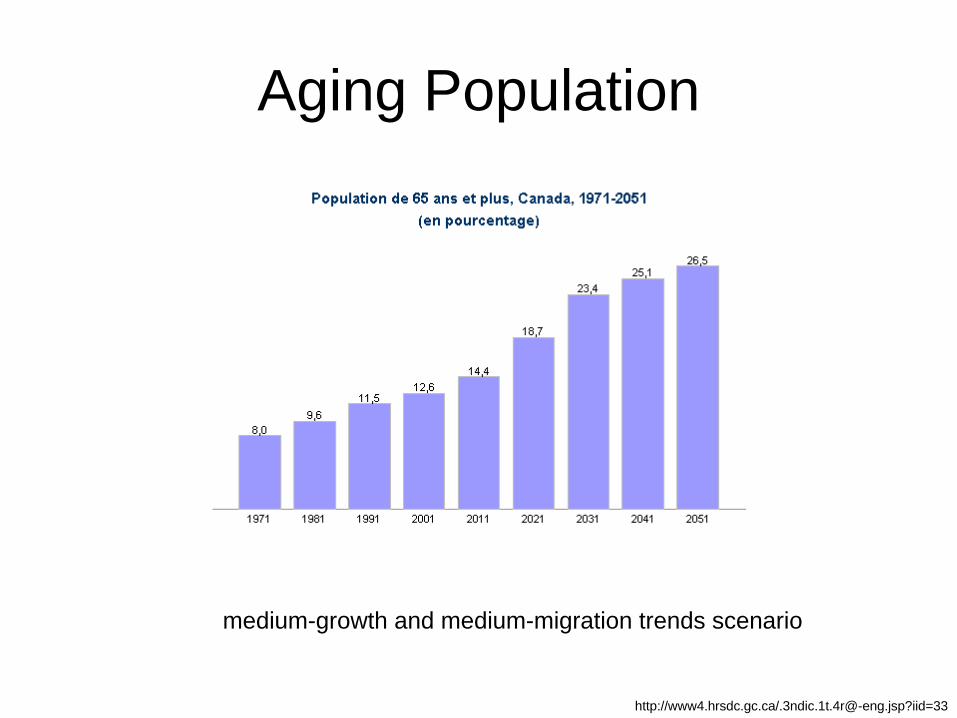
Aging Population
http://www4.hrsdc.gc.ca/[email protected]?iid=33
medium-growth and medium-migration trends scenario
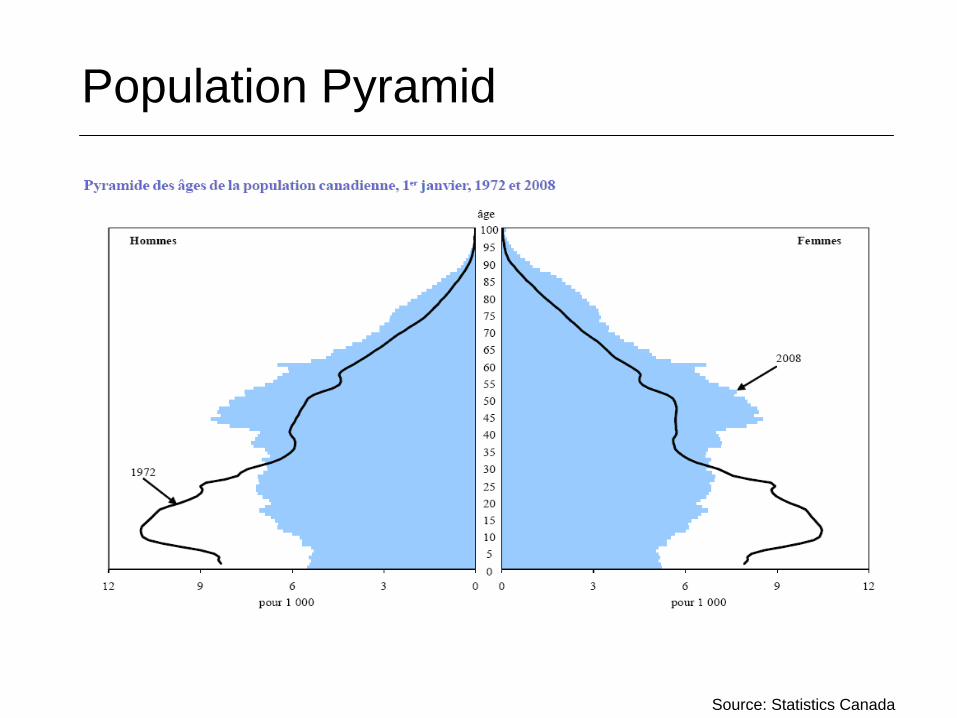
Population Pyramid
Source: Statistics Canada

Quality of Life
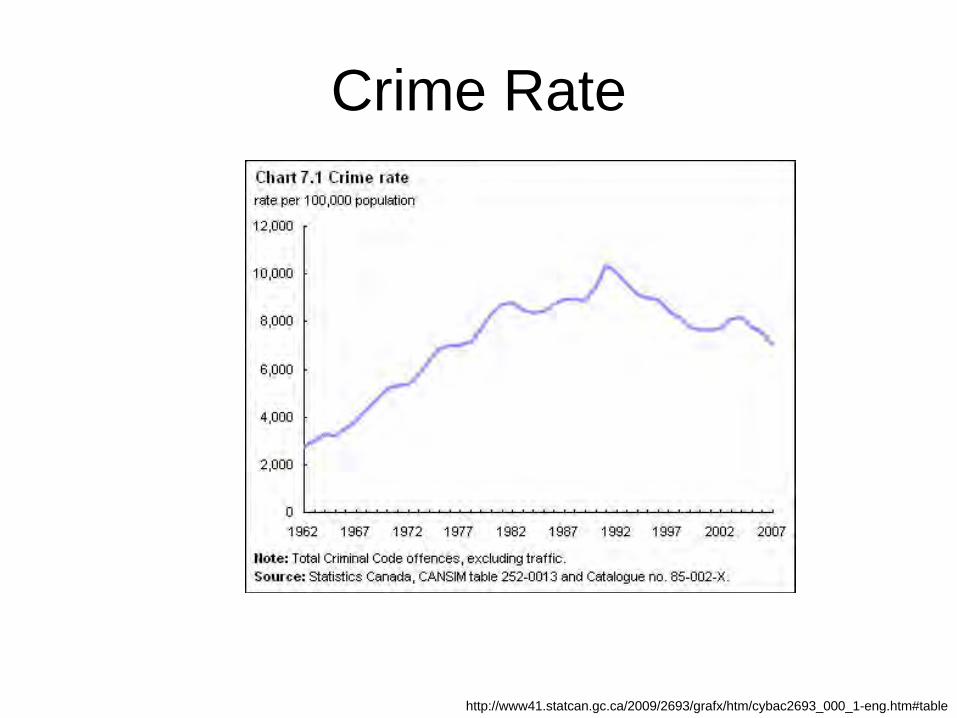
Crime Rate
http://www41.statcan.gc.ca/2009/2693/grafx/htm/cybac2693_000_1-eng.htm#table
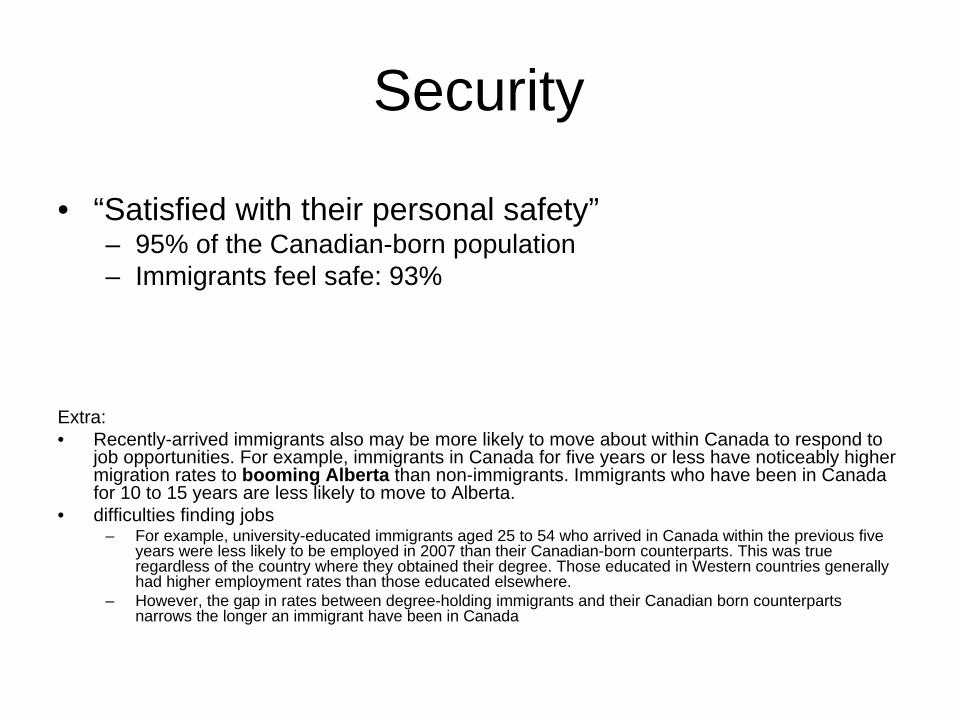
Security
• “Satisfied with their personal safety”– 95% of the Canadian-born population– Immigrants feel safe: 93%
Extra:• Recently-arrived immigrants also may be more likely to move about within Canada to respond to
job opportunities. For example, immigrants in Canada for five years or less have noticeably higher migration rates to booming Alberta than non-immigrants. Immigrants who have been in Canada for 10 to 15 years are less likely to move to Alberta.
• difficulties finding jobs – For example, university-educated immigrants aged 25 to 54 who arrived in Canada within the previous five
years were less likely to be employed in 2007 than their Canadian-born counterparts. This was true regardless of the country where they obtained their degree. Those educated in Western countries generally had higher employment rates than those educated elsewhere.
– However, the gap in rates between degree-holding immigrants and their Canadian born counterparts narrows the longer an immigrant have been in Canada

Human Development Index
Data on • life expectancy • education &• per-capita GDP (as an indicator of
standard of living)
• Canada ranked the highest eight times, followed by Norway at seven times, Japan three times

IV. Implications, Challenges & Conclusions
(selected)
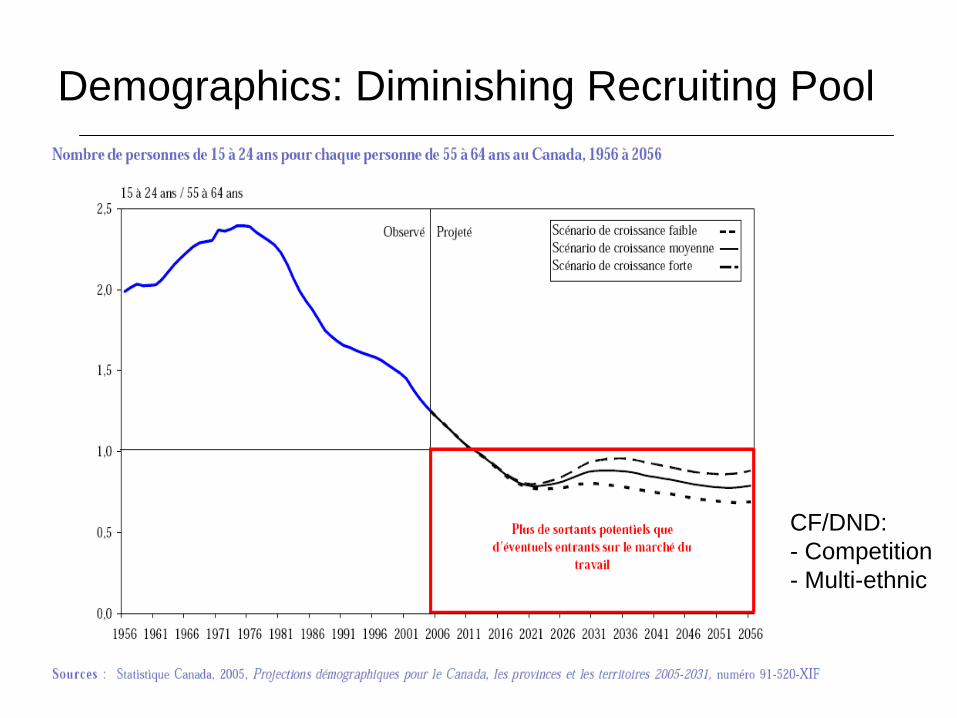
Demographics: Diminishing Recruiting Pool
CF/DND:- Competition- Multi-ethnic
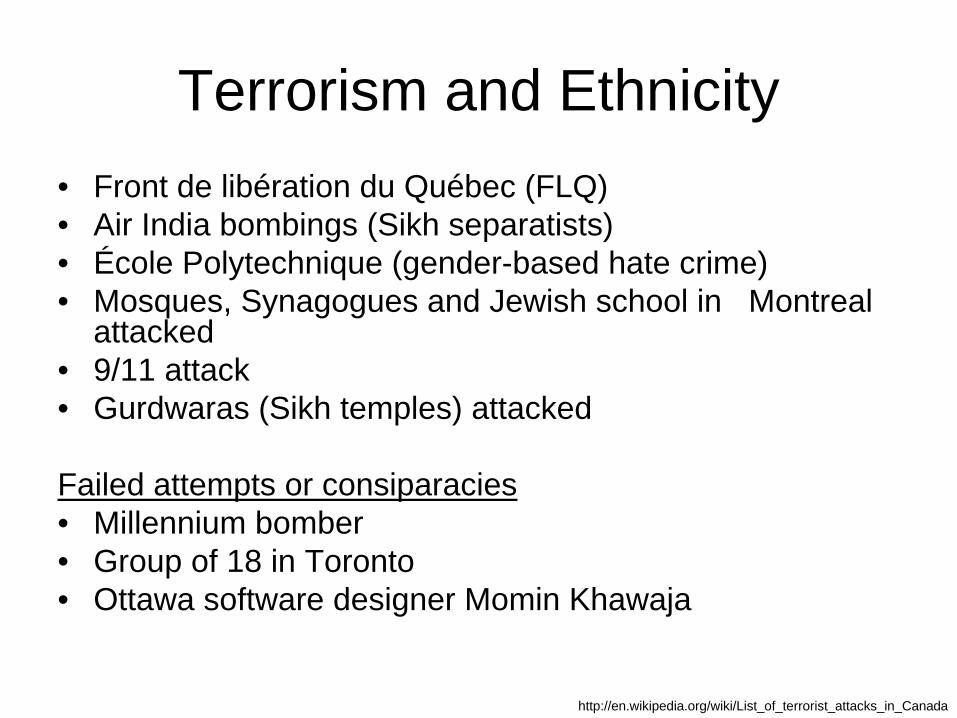
Terrorism and Ethnicity• Front de libération du Québec (FLQ)• Air India bombings (Sikh separatists)• École Polytechnique (gender-based hate crime)• Mosques, Synagogues and Jewish school in Montreal
attacked• 9/11 attack • Gurdwaras (Sikh temples) attacked
Failed attempts or consiparacies• Millennium bomber• Group of 18 in Toronto• Ottawa software designer Momin Khawaja
http://en.wikipedia.org/wiki/List_of_terrorist_attacks_in_Canada
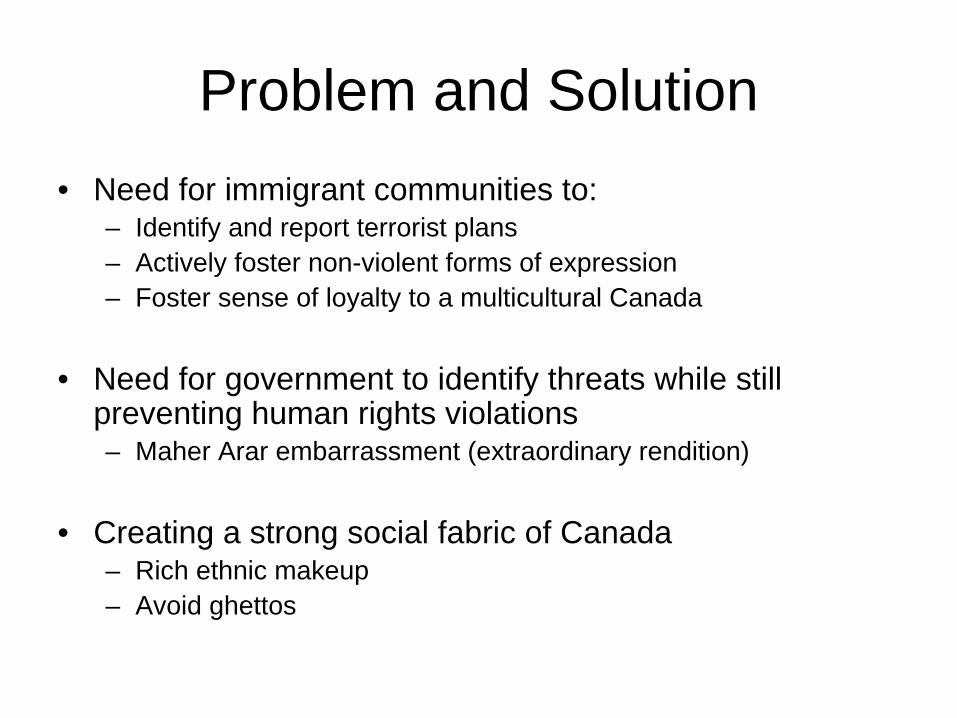
Problem and Solution• Need for immigrant communities to:
– Identify and report terrorist plans– Actively foster non-violent forms of expression– Foster sense of loyalty to a multicultural Canada
• Need for government to identify threats while still preventing human rights violations– Maher Arar embarrassment (extraordinary rendition)
• Creating a strong social fabric of Canada– Rich ethnic makeup– Avoid ghettos
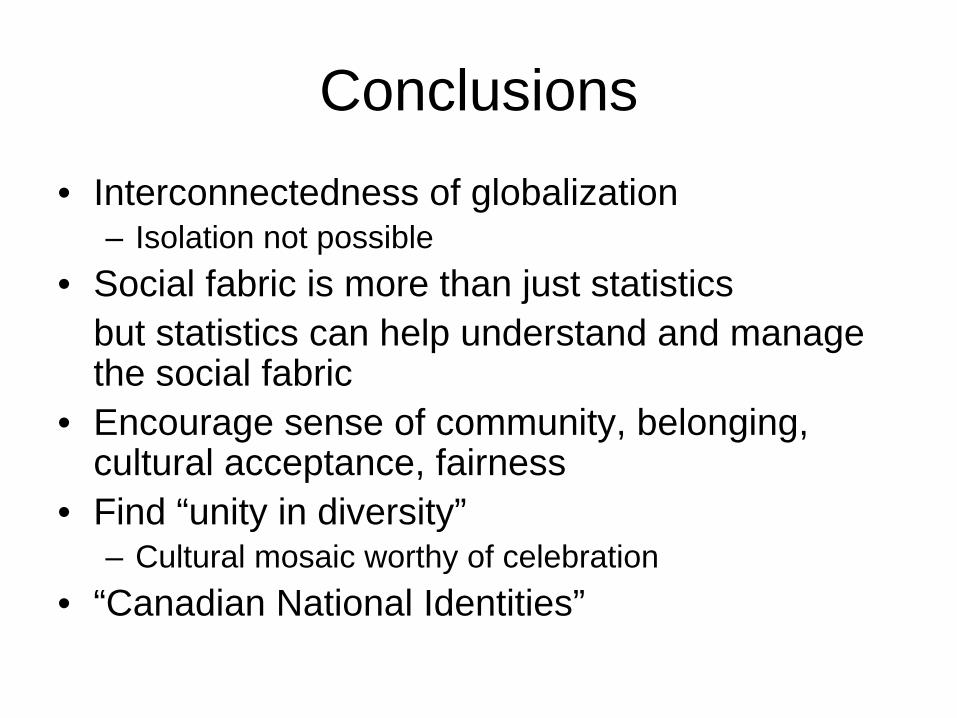
Conclusions• Interconnectedness of globalization
– Isolation not possible• Social fabric is more than just statistics
but statistics can help understand and manage the social fabric
• Encourage sense of community, belonging, cultural acceptance, fairness
• Find “unity in diversity”– Cultural mosaic worthy of celebration
• “Canadian National Identities”
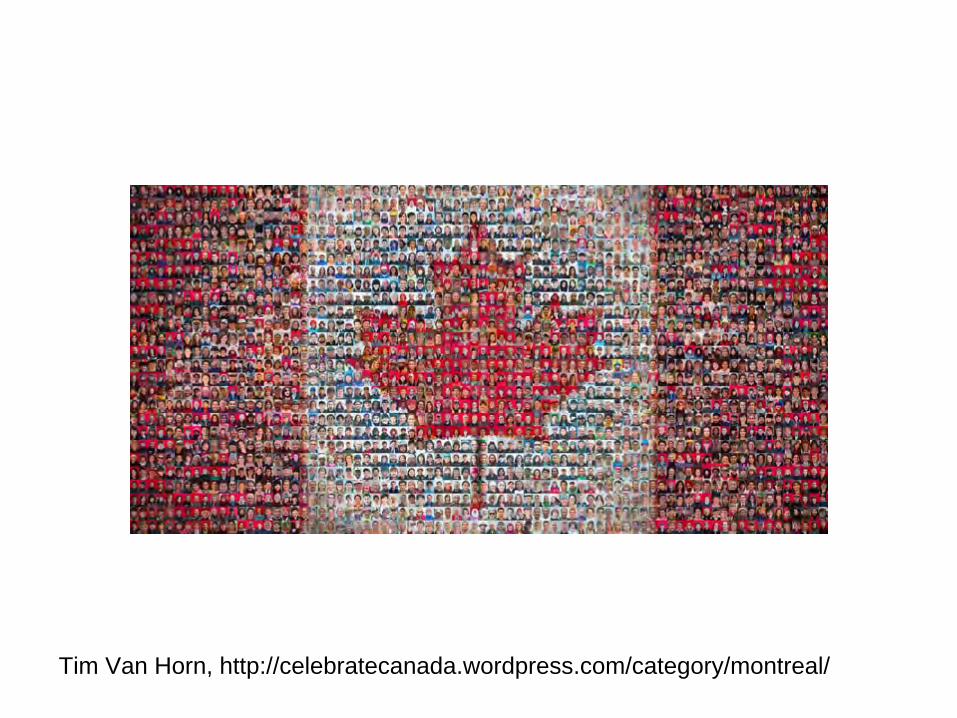
Tim Van Horn, http://celebratecanada.wordpress.com/category/montreal/

The census debate …
http://www.theglobeandmail.com/news/politics/ottawa-notebook/liberals-take-poison-pen-to-ideal-tory-census/article1654300/


QUESTIONS?
Recommended